mark scheme (results) october 2020
TRANSCRIPT

Mark Scheme (Results)
October 2020
Pearson Edexcel International Advanced Subsidiary In Economics (WEC11/01) Unit 1: Markets in action

Edexcel and BTEC Qualifications Edexcel and BTEC qualifications are awarded by Pearson, the UK’s largest awarding body. We provide a wide range of qualifications including academic, vocational, occupational and specific programmes for employers. For further information visit our qualifications websites at www.edexcel.com or www.btec.co.uk. Alternatively, you can get in touch with us using the details on our contact us page at www.edexcel.com/contactus. Pearson: helping people progress, everywhere Pearson aspires to be the world’s leading learning company. Our aim is to help everyone progress in their lives through education. We believe in every kind of learning, for all kinds of people, wherever they are in the world. We’ve been involved in education for over 150 years, and by working across 70 countries, in 100 languages, we have built an international reputation for our commitment to high standards and raising achievement through innovation in education. Find out more about how we can help you and your students at: www.pearson.com/uk Autumn 2020 Publications Code WEC11_01_2010_msc All the material in this publication is copyright © Pearson Education Ltd 2020

General Marking Guidance
• All candidates must receive the same treatment. Examiners must mark the first candidate in exactly the same way as they mark the last.
• Mark schemes should be applied positively. Candidates must be rewarded for what they have shown they can do rather than penalised for omissions.
• Examiners should mark according to the mark scheme not according to their perception of where the grade boundaries may lie.
• There is no ceiling on achievement. All marks on the mark scheme should be used appropriately.
• All the marks on the mark scheme are designed to be awarded. Examiners should always award full marks if deserved, i.e. if the answer matches the mark scheme. Examiners should also be prepared to award zero marks if the candidate’s response is not worthy of credit according to the mark scheme.
• Where some judgement is required, mark schemes will provide the principles by which marks will be awarded and exemplification may be limited.
• When examiners are in doubt regarding the application of the mark scheme to a candidate’s response, the team leader must be consulted.
• Crossed out work should be marked UNLESS the candidate has replaced it with an alternative response.

Section A
Question Number
Quantitative skills assessed Answer Mark
1 The only correct answer is A
B is not correct because the subsidy would lead to increased quantity and external costs- the government role is to reduce external costs
C is not correct because the tax on the good would lead to decreased quantity and a reduction in external benefits- the government role is to reduce external costs
D is not correct because this is a government failure and not a role of the government
(1)
2 – The only correct answer is C
A is not correct because this is a government failure
B is not correct because diminishing marginal utility occurs in any normally functioning market
D is not correct because this is a government failure
(1)
3 QS9: Interpret, apply and analyse information in written, graphical, tabular and numerical forms
The only correct answer is B
A is not correct because this would be the result of an increase in productive capacity
C is not correct because the movement to y is unattainable given current resources
D is not correct because position y would imply that some resources are unemployed
(1)

4 – The only correct answer is C
A is not correct because if consumers were good at computation they would calculate the benefits of switching and be more likely to switch
B is not correct because if they maximised utility they would switch to the cheaper deal
D is not correct because if consumers feel valued by alternative providers they would switch to them
(1)
5 QS9: Interpret, apply and analyse information in written, graphical, tabular and numerical forms
The only correct answer is D
A is not correct because this area represents part of the fall in total revenue for firms
B is not correct because total revenue falls by the area PeUVP1 and VUQeQ1
C is not correct because this area shows producer surplus and not consumer surplus
(1)
6 QS9: Interpret, apply and analyse information in written, graphical, tabular and numerical forms
The only correct answer is A
B is not correct because this represents the total government spending
C is not correct because this is the total revenue earned by firms from customers
D is not correct because this is the total revenue earned by firms from both customers and the government subsidy
(1)

Section B
Question Number
Answer Mark
7 Knowledge 1, Application 3 Quantitative skills assessed: QS4: Construct and interpret a range of standard graphical forms QS9: Interpret, apply and analyse information in written, graphical, tabular and numerical forms.
Knowledge
1 mark for showing knowledge on the diagram: • Supply and demand curves drawn accurately with equilibrium
quantity and price (1)
Application 1 mark for the following included on diagram: • Maximum price below the equilibrium price (1)
1 mark for either of the following: • New quantity supplied (QS) and new quantity demanded (QD)/
Demand extends and supply contracts (1) 1 mark for identifying the overall impact: • Excess demand/ shortage identified on diagram (1)

(4)

Question Number
Answer Mark
8 Knowledge 2, Application 2
Knowledge 1 mark for defining ‘positive statement.’
• Value free/ can be verified with evidence/ objective/ based on facts (1)
1 mark for defining ‘normative statement.’ • Based on value judgement/ cannot be verified or proven/
subjective (1)
Application 2 marks for applying to the statements e.g.:
• Statement 1 is positive as you can verify whether $140bn was spent on renewable subsidies / $260bn was spent on non-renewable subsidies/ check if the government subsidised (1)
• Statement 2 is normative as the word ‘should’ shows it is a value judgement/ suggests a course of action based on a person’s value judgement (1) (4)

Question Number
Answer Mark
9 Knowledge 1, Application 1, Analysis 2
Knowledge 1 mark for defining regulation, e.g.: • rules or laws put in place to influence behaviour (1) Or 1 mark for identifying an impact e.g.: • The quantity consumed will fall • The revenue earned by energy drink manufacturers will fall • Government failure/ Unintended consequences may occur • Lower costs of treating health problems caused by energy drinks • Consumers will substitute to alternatives (1)
Application Up to 1 mark for applying to energy drink market, e.g.: • Children/ Those under 18 will be prohibited from purchasing
energy drinks (1) Analysis Up to 2 marks for explaining the likely impact e.g.: • The quantity consumed will fall as the quantity of customers falls
with under 18s now unable to buy (1) leading to contracting supply / caused by decreased demand (1)
• The revenue earned by energy drink manufacturers will fall as they will no longer sell products to those under the age of 18 (1) thus a smaller number is multiplied by the price and revenue falls (1)
• Government failure/ Unintended consequences may occur as under 18s move to the informal sector to get access to these products (1) and some of this supply may be of inferior quality (1)
• Fewer health problems caused by energy drinks meaning less need for health services (1) and lowering the cost to the government (1)
• The Government will have costs associated with monitoring and policing the regulation (1) these costs will incur an opportunity costs to the government as they cannot spend these funds elsewhere (1)
• Consumers will no longer consume energy drinks and will buy alternatives instead (1) increasing demand and revenue for the firms (1)
• Diagram showing leftwards shift of demand curve (1) and corresponding impact on both lower quantity and lower price (1) (4)

Question Number
Answer Mark
10 Knowledge 1, Application 3 Quantitative skills assessed: QS8: Make calculations of elasticity and interpret the result.
Knowledge 1 mark for the formula for income elasticity of demand:
% change in quantity demanded % change in income OR
1 mark for identifying that the good is a normal good • e.g. In Singapore, new car sales are a normal good as when
income rises, quantity demanded rises. (1)
Application Up to 3 marks for calculations:
• Change in quantity ÷ original quantity 3 023 ÷ 109 091 x 100 = 2.77% (1)
• Change in income ÷ original income 1236 ÷ 65 796 x 100 = 1.88% (1)
• % Change in quantity ÷ % change in income 2.77% ÷ 1.88% = 1.47 (1)
If candidate does not complete any rounding they will calculate 1.48 Accept responses to 1dp, 2dp, 3dp 4dp etc. NB: if correct answer (e.g. 1.47, 1.48, 1.5) is given, award full marks regardless of working
(4)
Question Number
Answer Mark
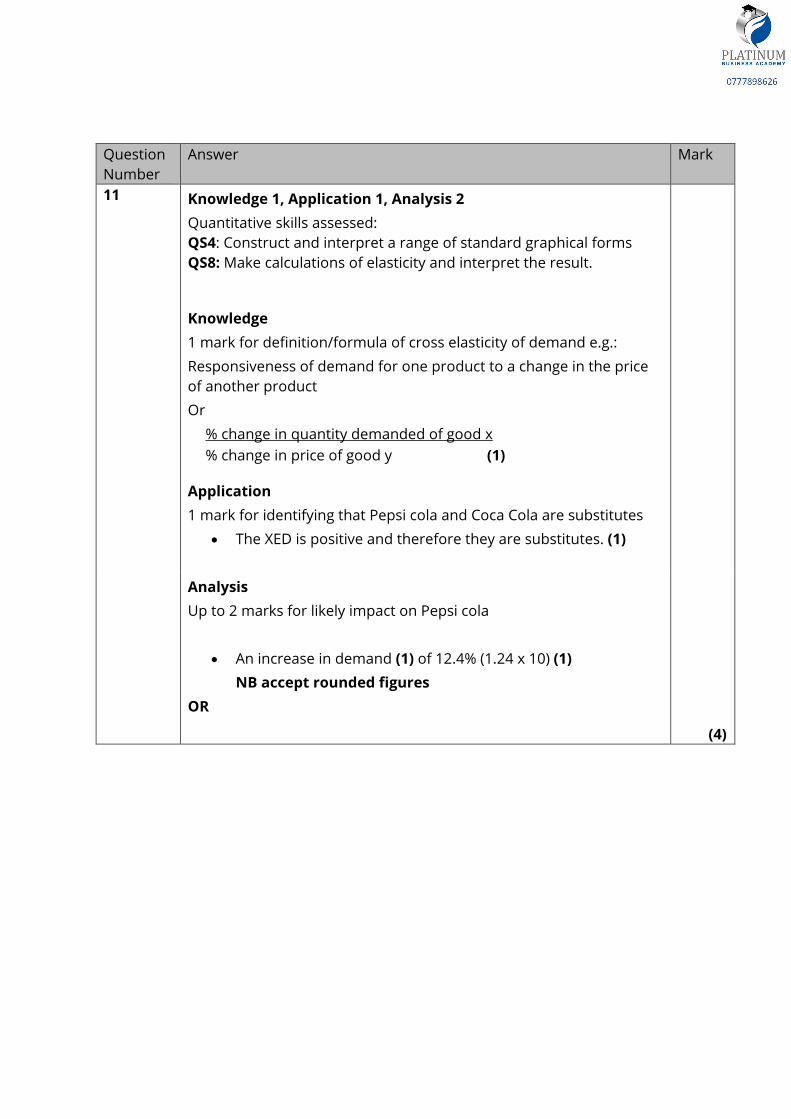
11 Knowledge 1, Application 1, Analysis 2 Quantitative skills assessed: QS4: Construct and interpret a range of standard graphical forms QS8: Make calculations of elasticity and interpret the result.
Knowledge 1 mark for definition/formula of cross elasticity of demand e.g.: Responsiveness of demand for one product to a change in the price of another product Or
% change in quantity demanded of good x % change in price of good y (1)
Application 1 mark for identifying that Pepsi cola and Coca Cola are substitutes
• The XED is positive and therefore they are substitutes. (1)
Analysis Up to 2 marks for likely impact on Pepsi cola
• An increase in demand (1) of 12.4% (1.24 x 10) (1) NB accept rounded figures
OR (4)

• For showing increase in demand (1) • For showing increase in equilibrium price/ quantity (1)
Or • Verbal description of impact of increase in price of Coca Cola on
demand for Pepsi cola • As the price of Coca Cola increases consumers will substitute to
the relatively cheaper Pepsi cola causing the demand to increase (1) the percentage increase will be greater than 10 as the cross elasticity is elastic (1)
• Close substitutes (1) so the impact so will result in a more than proportionate impact (1)

Section C
Question Number
Answer Mark
12 (a) Knowledge 2 Up to 2 marks for defining ‘equilibrium’, e.g.: • Where the market is in balance (1) • Where supply and demand intersect/ meet/ situation where
supply and demand are matched (1) • Leading to a stable price (1) • Determines the market price/ quantity sold (1) • Set by the free market/ price mechanism (1) • Price consumers willing to buy at is the same as the price
producers are willing to sell at (1) • Leads to an efficient allocation of resources (1)
(2)
Question Number
Answer Mark
12 (b) Knowledge 2 Application 2 Quantitative skills assessed: QS9: Interpret, apply and analyse information in written, graphical, tabular and numerical forms Knowledge Up to 2 marks for definitions:
• Substitutes are goods with a positive cross elasticity of demand/ two goods that meet the same need (1)
• Price elasticity of demand is the responsiveness of quantity demanded to a change in price/ or formula (1)
• Elastic demand is where a change in price leads to a proportionally larger change in quantity demanded/ diagram showing elastic demand (1)
Application Up to 2 mark for application to Extract A
• Competing vegetable oils such as rapeseed, soybean and sunflower OR Crude oil is a substitute for palm oil (used in biodiesel) (1)
• With so many substitutes an increase in the price of palm oil would see customers substitute to alternative- crude oil/ rapeseed/ soybean/ sunflower oil (1) meaning demand will be relatively elastic / cause the PED to increase (1) (4)

Question Number
Answer Mark
12 (c) Knowledge 2, Application 2, Analysis 2 Quantitative skills assessed: QS4: Construct and interpret a range of standard graphical forms QS9: Interpret, apply and analyse information in written, graphical, tabular and numerical forms
Knowledge Up to 2 marks for the diagram showing:
• Original supply and demand curves and equilibrium (1) • Where a candidate correctly shifts supply to the right or
demand curve to the left (1) Application 1 marks for one demand factor: Causing leftward shift in the demand curve:
• Price of competing oils/ soya/ rapeseed/ sunflower have fallen (1)
• Lower crude oil prices, substitute for palm oil/ biodiesel (1) 1 marks for one supply factor: Causing rightward shift in the supply curve:
• More produced/ abundant supply (1)
Analysis Up to 2 marks for development of how reason(s) leads to lower prices, e.g.:
• Where a candidate has shifted the second curve correctly e.g. rightwards shift in supply AND leftwards shift in demand (1).
• Final equilibrium following shift in both supply and demand (1)
(6)


Question Number
Answer Mark
12 (d) Knowledge 2, Application 2, Analysis 2, Evaluation 2
QS9: Interpret, apply and analyse information in written, graphical, tabular and numerical forms
Knowledge Up to 2 marks for knowledge of PES, e.g.: • Definition of price elasticity of supply: responsiveness of quantity
supplied to a change in price (1) • Price elastic supply- value of PES greater than 1/ where there is a
more than proportionate change in supply in response to a change in price/ Diagram illustrating elastic supply (1)
• Price inelastic supply- value of PES between 0 and 1/ where there is a less than proportionate change in supply in response to a change in price/ Diagram illustrating inelastic supply (1)
Application and analysis Up to 2 marks for each reference to the given sources and linked explanations with a maximum of 4 marks e.g.: • With the stockpile any increase in price can be responded to with
the release from the stockpile suggesting elastic supply (1+1) • Harvesting only twice a year suggests that when price rises there
could be a delay before harvesting takes place, suggesting supply is inelastic (1+1)
• Harvesting more than once a year suggests that suppliers can respond quickly to changes in price, suggesting supply is more elastic (1+1)
• It can take 30 months from planting a tree for it to produce fruits suggesting a long delay and inelastic supply (1+1)
• Only limited number of countries produce palm oil so when price raises only limited number of countries can increase supply meaning inelastic (1+1)
Candidates may present an argument for elastic or inelastic for KAA and be rewarded for the alternative as Evaluation.
Evaluation Up to 2 marks for evaluative comments, e.g.: • The supply will be relatively inelastic in the short run and become
more elastic in the long run as factors become variable (1+1)
(8)

• The size of the price change will be important in determining how much supply will respond/ the larger change of price at -25.94% suggests a greater influence on supply (1+1)
• Factors such as the weather can have a significant impact on the ability to respond with supply (1+1)
• New technologies could help increase production enabling supply to respond better (1+1)

Question Number
Indicative content
12 (e) Indicative content guidance Answers must be credited by using the level descriptors (below) in line with the general marking guidance. The indicative content below exemplifies some of the points that candidates may make but this does not imply that any of these must be included. Other relevant points must also be credited.
Quantitative skills assessed QS4: Construct and interpret a range of standard graphical forms QS9: Interpret, apply and analyse information in written, graphical, tabular and numerical forms
Knowledge, Application and Analysis (8 marks) – indicative content Externalities- where third parties are affected by a transaction negatively or positively External costs • Definition of ‘external cost’ – where there are negative impact on third
parties Diagram showing external costs

• Producers consider their private costs • Producers ignore impacts on third parties/ external costs • Producers are undervaluing the costs of producing palm oil • The market equilibrium price, Pe is below the social optimum price, P1. • The market equilibrium quantity, Qe is above the social optimum quantity,
Q1- there is overconsumption • The welfare loss is indicated by the welfare loss triangle as shaded. • The rapid and poorly managed expansion of production has caused large
scale deforestation- loss of biodiversity/ loss of potential medicines- future generations affected through this loss/ less oxygen in environment- causing health issues and costs to health services/ greater risk of flooding affecting farmers and the local community
• Caused significant greenhouse gas emissions from the destruction and burning of rainforests- may lead to global warming and health issues- third party Government affected by spending on healthcare
• In Indonesia and Malaysia production has caused habitat and biodiversity loss- third party affecting animals and humans through loss of medicines
• Third party affected- endangered animals population of orangutans reduced by 100 000. 69% of the elephant’s habitat has been lost, there are only 100 rhinos left
External benefits • Definition of ‘external benefits’ – where there are positive impact on third
parties • Diagram showing external benefits

• Consumers consider their private benefits • Consumers ignore impacts on third parties/ external benefits • Consumers are undervaluing the benefit of palm oil • The market equilibrium price, PME is below the social optimum price, PSO/ The
market equilibrium price PME is below the social optimum price PSO. • The market equilibrium quantity, QME is below the social optimum quantity,
QSO- there is underconsumption • The welfare gain that can be achieved by moving to social optimum is
shaded/ labelled • 36 000 000 tonnes produced in Indonesia/ 21 000 000 tonnes produced in
Malaysia will generate substantial export income helping to fund the import of more capital goods helping to boost long term growth for all
• Private benefit of palm oil production tripling between 1998 and 2018- generating more revenue creates an external benefit as firms spent more within economy
• The palm oil sector employs 4.7 million in Malaysia and Indonesia, with these workers spending more money within their economies
• A further 11 million are employed in the two countries who are indirectly dependent on the sector
Positive or negative externalities may be offered as KAA and evaluation may consider the other type of externality

Level Mark Descriptor 0 No rewardable material Level 1 1–3 Displays isolated, superficial or imprecise knowledge and
understanding of economic terms, principles, concepts, theories and models. Use of generic material or irrelevant information or inappropriate examples. Descriptive approach, which has no chains of reasoning.
Level 2 4–6 Displays elements of knowledge and understanding of economic terms, principles, concepts, theories and models. Ability to apply knowledge and understanding to some elements of the question. Some evidence and contextual references are evident in the answer. Chains of reasoning in terms of cause and/or consequence are evident but they may not be developed fully or some stages are omitted.
Level 3 7–8 Demonstrates accurate and precise knowledge and understanding of economic terms, principles, concepts, theories and models. Ability to link knowledge and understanding in context using relevant examples which are fully integrated to address the broad elements of the question. Analysis is clear, coherent, relevant and focused. The answer demonstrates logical and multi-stage chains of reasoning in terms of cause and/or consequence.
Evaluation (6 marks) – indicative content • Magnitude of external benefit/ external costs • Magnitude of welfare gain/loss- with high levels of production welfare
losses/ gains significant • Measurement – it is hard to measure the external benefits/ costs of
production • Weighing of the external benefits with external costs • Short term little external costs or benefits noticed but long term these may
be more noticeable/significant • Palm oil requires one-tenth as much land as soybean production so causing
less damage to land- lower external costs • One-seventh of the fertiliser used compared to soybean, so less impact on
quality of water supply and damage to animals • One-sixth of the energy to produce the same amount of soybean, so less
external costs when less energy produced

Level Mark Descriptor 0 No rewardable material. Level 1 1–2 Identification of generic evaluative comments.
No supporting evidence/reference to context. No evidence of a logical chain of reasoning.
Level 2 3–4 Evidence of evaluation of alternative approaches. Some supporting evidence/reference to context. Evaluation is supported by a partially-developed chain of reasoning.
Level 3 5–6 Evaluation recognises different viewpoints and/or is critical of the evidence. Appropriate reference to evidence/context. Evaluation is supported by a logical chain of reasoning.

Section D Question Number
Indicative content
13 Indicative content guidance Answers must be credited by using the level descriptors (below) in line with the general marking guidance. The indicative content below exemplifies some of the points that candidates may make, but this does not imply that any of these must be included. Other relevant points must also be credited.
Knowledge, application and analysis (12 marks) – indicative content • Indirect tax– expenditure tax • Ad valorem tax- defined • Specific tax- defined • Increases costs of production of firms selling petrol • Supply falls • Customers pay a higher price • The quantity consumed will be lower • Less external costs associated with petrol consumption/ production • People may buy in cheaper countries like Germany/ may lead to
smuggling- Germany may benefit and the Netherlands lose out • Government failure if costs associated with intended consequences
exceed benefits of reduced consumption • Incentive to substitute to hybrid/ electric/ hydrogen powered vehicles/
public transport/ bikes/ walking • Government revenue earned- can be used to fund improvements in
public transport and roads • Increased demand for public transport • Impact on sectors reliant on road transport • Diagram may show ad valorem or specific tax

Impact on business
• Price received by the business is lower at A • Quantity lower at Q1 • Incidence of tax on producer per unit – AP/ Producer incidence ABFP • Reduced producer surplus
Impact on consumers
• Price paid higher at P1 • Incidence of tax on consumer per unit - PP1/ consumer incidence CFPP1 • Reduced consumer surplus
Impact on government
• Government revenue ABCP1 • Funds that can be used elsewhere- e.g. roads

Level Mark Descriptor 0 No rewardable material. Level 1 1–3 Displays isolated, superficial or imprecise knowledge and
understanding of economic terms, principles, concepts, theories and models. Use of generic material or irrelevant information or inappropriate examples. Descriptive approach which has no chains of reasoning.
Level 2 4–6 Displays elements of knowledge and understanding of economic terms, principles, concepts, theories and models. Limited application of knowledge and understanding to economic problems in context. A narrow response or superficial, only two-stage chains of reasoning in terms of cause and/or consequence.
Level 3 7–9 Demonstrates accurate knowledge and understanding of economic terms, principles, concepts, theories and models. Ability to apply knowledge and understanding to some elements of the question. Some evidence and contextual references are evident in the answer. Analysis is clear and coherent. Chains of reasoning in terms of cause and/or consequence are evident but they may not be developed fully or some stages are omitted.
Level 4 10–12 Demonstrates accurate and precise knowledge and understanding of economic terms, principles, concepts, theories and models. Ability to link knowledge and understanding in context, using appropriate examples which are fully integrated to address the broad elements of the question. Analysis is clear, coherent, relevant and focused. The answer demonstrates logical and multi-stage chains of reasoning in terms of cause and/or consequence.

Evaluation (8 marks) – indicative content • Magnitude- 68% of the price charged is indirect tax- significant impact • Germany at just 59% may make it attractive to purchase in Germany but
only for those close to border • Changed in behaviour to alternative fuels may take a very long term • Demand is likely to be highly inelastic so even if tax means higher price
the quantity demanded will fall less than proportionately • Tax evasion/ avoidance may reduce tax revenues • Difficult to measure the correct indirect tax that should be charged • Electric cars may still be significantly more expensive than petrol cars so
there will be little impact on the demand for petrol • Public transport is less convenient for the consumer leading to less
consumer substituting • Depends on how significant petrol taxes are as a proportion of total
business costs e.g. significant issue for logistics/delivery companies • Impact of the tax may affect those on different income levels differently
Level Mark Descriptor 0 No rewardable material. Level 1 1–3 Identification of generic evaluative comments.
No supporting evidence/reference to context. No evidence of a logical chain of reasoning.
Level 2 4–6 Evidence of evaluation of alternative approaches. Some supporting evidence/reference to context. Evaluation is supported by a partially-developed chain of reasoning.
Level 3 7–8 Evaluation recognises different viewpoints and/or is critical of the evidence, leading to an informed judgement. Appropriate reference to evidence/context. Evaluation is supported by a logical chain of reasoning.
Question Number
Indicative content
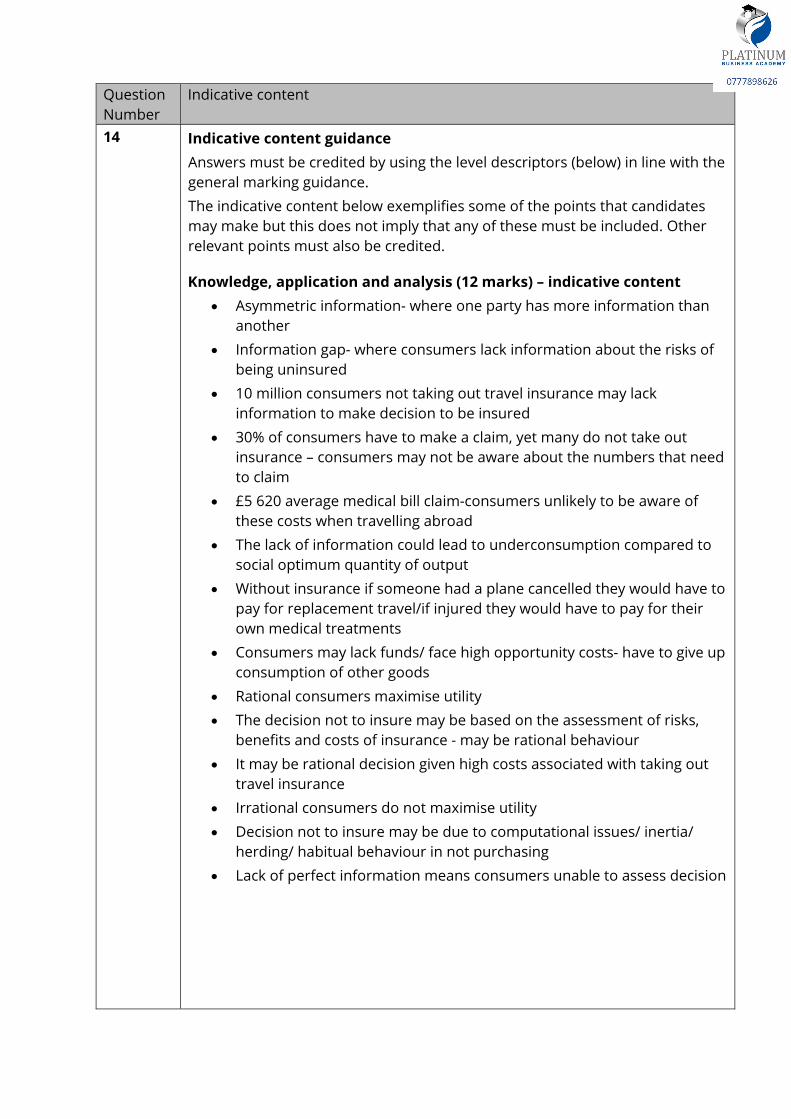
14 Indicative content guidance Answers must be credited by using the level descriptors (below) in line with the general marking guidance. The indicative content below exemplifies some of the points that candidates may make but this does not imply that any of these must be included. Other relevant points must also be credited.
Knowledge, application and analysis (12 marks) – indicative content • Asymmetric information- where one party has more information than
another • Information gap- where consumers lack information about the risks of
being uninsured • 10 million consumers not taking out travel insurance may lack
information to make decision to be insured • 30% of consumers have to make a claim, yet many do not take out
insurance – consumers may not be aware about the numbers that need to claim
• £5 620 average medical bill claim-consumers unlikely to be aware of these costs when travelling abroad
• The lack of information could lead to underconsumption compared to social optimum quantity of output
• Without insurance if someone had a plane cancelled they would have to pay for replacement travel/if injured they would have to pay for their own medical treatments
• Consumers may lack funds/ face high opportunity costs- have to give up consumption of other goods
• Rational consumers maximise utility • The decision not to insure may be based on the assessment of risks,
benefits and costs of insurance - may be rational behaviour • It may be rational decision given high costs associated with taking out
travel insurance • Irrational consumers do not maximise utility • Decision not to insure may be due to computational issues/ inertia/
herding/ habitual behaviour in not purchasing • Lack of perfect information means consumers unable to assess decision

Level Mark Descriptor 0 No rewardable material. Level 1 1–3 Displays isolated, superficial or imprecise knowledge and
understanding of economic terms, principles, concepts, theories and models. Use of generic material or irrelevant information or inappropriate examples. Descriptive approach, which has no chains of reasoning.
Level 2 4–6 Displays elements of knowledge and understanding of economic terms, principles, concepts, theories and models. Limited application of knowledge and understanding to economic problems in context. A narrow response or superficial, only two-stage chains of reasoning in terms of cause and/or consequence.
Level 3 7–9 Demonstrates accurate knowledge and understanding of economic terms, principles, concepts, theories and models. Ability to apply knowledge and understanding to some elements of the question. Some evidence and contextual references are evident in the answer. Analysis is clear and coherent. Chains of reasoning in terms of cause and/or consequence are evident but they may not be developed fully or some stages are omitted.
Level 4 10–12
Demonstrates accurate and precise knowledge and understanding of economic terms, principles, concepts, theories and models. Ability to link knowledge and understanding in context using appropriate examples which are fully integrated to address the broad elements of the question. Analysis is clear, coherent, relevant and focused. The answer demonstrates logical and multi-stage chains of reasoning in terms of cause and/or consequence.
Evaluation (8 marks) – indicative content • Information gaps may be filled by insurance companies and
governments sharing information on costs • Internet helps provide better information on likely costs if a consumer
has an accident on holiday • Some of the 10 million not taking insurance may be on low risk/ short
holidays and be less likely to insure • May be rational as some may perceive the likelihood of successfully
making a claim to be low • Magnitude- 10 million is a large number of consumers not taking out
insurance/ may be a smaller numbers compared to the number of travellers in a given year

Level Mark Descriptor 0 No rewardable material. Level 1 1–3 Identification of generic evaluative comments.
No supporting evidence/reference to context. No evidence of a logical chain of reasoning.
Level 2 4–6 Evidence of evaluation of alternative approaches. Some supporting evidence/reference to context. Evaluation is supported by a partially-developed chain of reasoning.
Level 3 7–8 Evaluation recognises different viewpoints and/or is critical of the evidence, leading to an informed judgement. Appropriate reference to evidence/context. Evaluation is supported by a logical chain of reasoning.

Pearson Education Limited. Registered company number 872828 with its registered office at 80 Strand, London, WC2R 0RL, United Kingdom