markdoc: literate programming in stata -...
TRANSCRIPT

MarkDoc: Literate Programming in Stata
Abstract.
Rigorous documentation of analysis plan, procedure, and computercodes enhances comprehensibility and transparency of the data analy-sis. Documentation is particularly critical when the codes and data aremeant to be publicly shared and examined by the scientific communityto evaluate the analysis or adapt the results. The popular approach fordocumenting computer codes is known as “literate programming” whichrequires preparing a trilingual script file that includes a programming lan-guage for running the data analysis, a human language for documentation,and a markup language for typesetting the document. This article intro-duces MarkDoc, a software package for interactive literate programmingand generating dynamic analysis documents in Stata. MarkDoc recog-nizes Markdown, LATEX, and HTML markup languages and can exportdocuments in several formats such as PDF, Microsoft Office Docx, OpenOffice and LibreOffice ODT, LATEX, HTML, ePub, and Markdown.
Keywords: markdown, HTML, LATEX, literate programming, dynamicdocuments, reproducible research, log file, translator
1 IntroductionIn the recent years, concerns about replicability of the study findings as well asreproducibility of the data analysis results in scientific publication have prolif-erated. In contrast to replication, which requires reimplementing experimentsto validate the findings, reproducibility means replicating the data analysis orthe computation by an independent researcher using the same data, procedure,and methodology (Baggerly and Berry 2009). Reproducing the analysis canbe considered as a minimum standard for evaluating the quantitative resultssince reproducibility does not necessarily certify quality, sound methodology,correctness of data collection, or validity of the findings (Peng 2011; Stoddenet al. 2014). Although, it provides partial transparency for other researchers tovalidate the analysis procedure and examine or adapt the claims in the scientificpublication (Gentleman and Lang 2012).
To support reproducibility of the analysis, a detailed documentation of themethodology and analysis plan, data, and analytic codes and output should beprepared. The documentation can be included in the analysis code as commentsto shed light about a particular function or code chunk. However, readingcomments requires navigating through script files which can be convoluted, asthe size and complexity of the structure of the program increases. Furthermore,comments are scattered across the script files and do not fulfill the demand fora coherent document. Alternatively, the documentation can be written using aword processor such as Microsoft Word. While this approach might suffice fordocumenting the variables and the analysis plan, making reference about the
1

code or output and also, updating the documentation after making a change inthe code would be very boring, time consuming, and prone to human errors.
Another solution to this problem is to write the documentation within thescript files by applying a special notation to separate the documentation fromthe source code. Next, a software is used to parse the special notations andwhether typeset the documentation or compile the code, procedures which arecalled “weave” and “tangle” respectively. This solution was proposed by Don-ald Knuth (1984) and is called “Literate Programming.” Knuth 1983 developedthe WEB literate programming software, which provided the means for writingstructured documentation within the source code and generating dynamic doc-umentation.
There have been several attempts to adapt literate programming paradigmfor statistical data analysis (Leisch 2002; Rossini and Leisch 2003; Rossini 2001;Xie 2013b,a; Lenth 2012). Yet, the only software allowing literate programmingfor Stata have been StatWeave (Lenth 2012), which is written in Java and itsStata package alternative, texdoc (Jann 2015). The drawback of StatWeaveand texdoc is that they only support LATEX, excluding all Stata users who arenot familiar with this markup language. Although LATEX is very enabling, yet,it is a complex markup language and can harm the readability of the source file(see section 4).
Another shortcoming of StatWeave and texdoc is that they do not supportreal-time preview of the document i.e. they do not support writing and view-ing the dynamic document interactively without reexecuting the analysis code.Furthermore, they force the users to create a new script file for generating thedynamic analysis document, which consequently leads to additional problems inupdating and version control of the script files. For example, the source file thatStatWeave executes cannot be executed directly in a do-file because it includesspecial notations for separating LATEX documentation from the analytic codethat are not meaningful for Stata. In practice, the data analysis is developedgradually in a script files and an ideal literate programming software must allowdocumenting the data analysis and executing it interactively, which is a morenatural workflow in the field of statistics, as compared to software development.Besides, texdoc includes several commands for initializing and closing the doc-ument and including Stata log-files which makes working with it inconvenient,especially for statistics learners.
Literate programming in data analysis should be easy to implement in thesource code, support real-time preview of the document, provide a handful ofoptions for adjusting the commands and outputs in the dynamic document, andabove all keep the source file simple and easy to read. Furthermore, generatingdynamic documents in various formats from the same source code would be anadvantage and extends the applications of the literate programming software.For example, some users might wish to produce HTML documentation that canbe uploaded in websites while others might wish for PDF or editable formatssuch as LATEX, Microsoft Word Docx, or OpenOffice ODT. In the current articleI introduce markdoc package, which provides a convenient solution for literateprogramming in Stata and discuss its potential applications.
2

2 WorkflowOne of the main features and also a potential problem with dynamic analysisdocuments is that users select the code and output that they wish to includein the document and dismiss the details that are not essential or necessaryfor reporting. Hence, it is indispensable to bare in mind that dynamic analysisdocument is not a replacement for the analysis log-file, which provides maximumtransparency about the process of data analysis.
Since the log-file registers every entry in Stata including the markup anno-tations and text required for typesetting the dynamic document, the markdoc
command was designed to produce the dynamic document as a by-product ofthe log-file. In other words, markdoc interprets the log-file – which is updatedin real-time during the analysis session – and typesets the dynamic analysisdocument based on the content of the log-file. Therefore, as soon as the useropens a Stata smcl log-file and begins the data analysis, markdoc can quicklycompile a dynamic document interactively as shown below.
Figure 1: The process of producing dynamic documents with markdoc
This workflow has several advantages compared to other common literateprogramming packages used for data analysis. First of all, the log-file can beused to compile a dynamic document in various formats without rerunning theanalysis code. Moreover, dynamic documents can be produced quickly with-out re-executing the analysis code , since the log-file contains the history ofcommands and outputs and is updated automatically. Finally, this workfloweliminated the need for creating an additional script file for producing the dy-namic document because it follows the natural data analysis practice in Statawithout introducing numerous commands for creating the analysis document.
Although using a single command to convert a smcl log-file to various docu-ment formats is convenient, it does not ensure the reproducibility of the sourcecode, even if the do-file begins with opening a log and ends by closing the log.For example, users might have made changes to the data that are not includedin the do-file. Therefore, the do-file must be examined in a clean workspace,where no data is loaded in Stata.
markdoc supports both procedures. If a smcl log-file is given, it convertsthe log to a document without evaluating the reproducibility of the script filethat generated the log. In the example below, markdoc takes the smcl log-file as input and generates a PDF document. Opening the log quietly avoidsincluding the log description in the document and the qui log c which is theabbreviation of quietly log close is automatically removed by markdoc to
3

keep the document clean.
Example
. quietly log using example, replace smcl
. ...
. qui log c
. markdoc example.smcl, export(pdf)
In addition, markdoc can also take a do-file as an input and actively executeit in a new workspace - where no data is loaded in that workspace - to examineits reproducibility and generate a dynamic document from the source code 1. Inthe example above, if the code is saved as a do-file – for example in a file namedexample.do – markdoc can produce an identical document using the script file:
Example
. markdoc example.do, export(pdf)
Both procedures have the same workflow. However, the latter creates atemporary log while executing the do-file and translates the temporary log to adynamic document.
3 MarkDoc Package3.1 Featuresmarkdoc recognizes Markdown, HTML, and LATEX markup languages and canexport dynamic document to several formats which are PDF, Microsoft OfficeDocx, Open Office and LibreOffice ODT, LATEX, HTML, ePub, and Markdown2. By applying any of these markup languages users can style the document,insert figures in the dynamic document, create dynamic tables, write dynamictext for interpreting the data analysis, and style the text.
In addition, markdoc includes several document styles and it also allowsthe users to create a dynamic document using external template files e.g. aLATEX header file, a CSS file, or a Microsoft Word template file (see section 3.3).Furthermore, markdoc uses a syntax highlighter for Stata commands, whichmakes the code more appealing, distinguishable from the documentation text,and easier to read and comprehend. Finally, the package allows rendering LATEXmathematical notations not only when exporting to a LATEX document, but alsoHTML, PDF, Microsoft Word, and OpenOffice.
1markdoc can take a Mata or an ado-file as an input and generate Stata help files or packagevignette. This feature is still under revision and is not discussed in this article
2Since the version 3.5, markdoc can also produce PDF and HTML dynamic presentationslides. However, this feature goes beyond the purpose of current article and is not discussed
4
3.2 Installationmarkdoc requires two other packages which are weaver and statax, both arehosted on SSC server. weaver (Haghish 2014a) is a dynamic document generatorwhich creates LATEX, HTML, and PDF dynamic documents in Stata. It alsosupports markdoc with three commands for creating dynamic tables, writingdynamic text, and capturing the current graph from Stata and inserting it inthe dynamic document. statax (Haghish 2015) is a syntax highlighter enginewhich highlights Stata commands in HTML, PDF, and LATEX documents. Thefollowing commands install markdoc, weaver, and statax packages:
. ssc install markdoc
. ssc install weaver
. ssc install statax
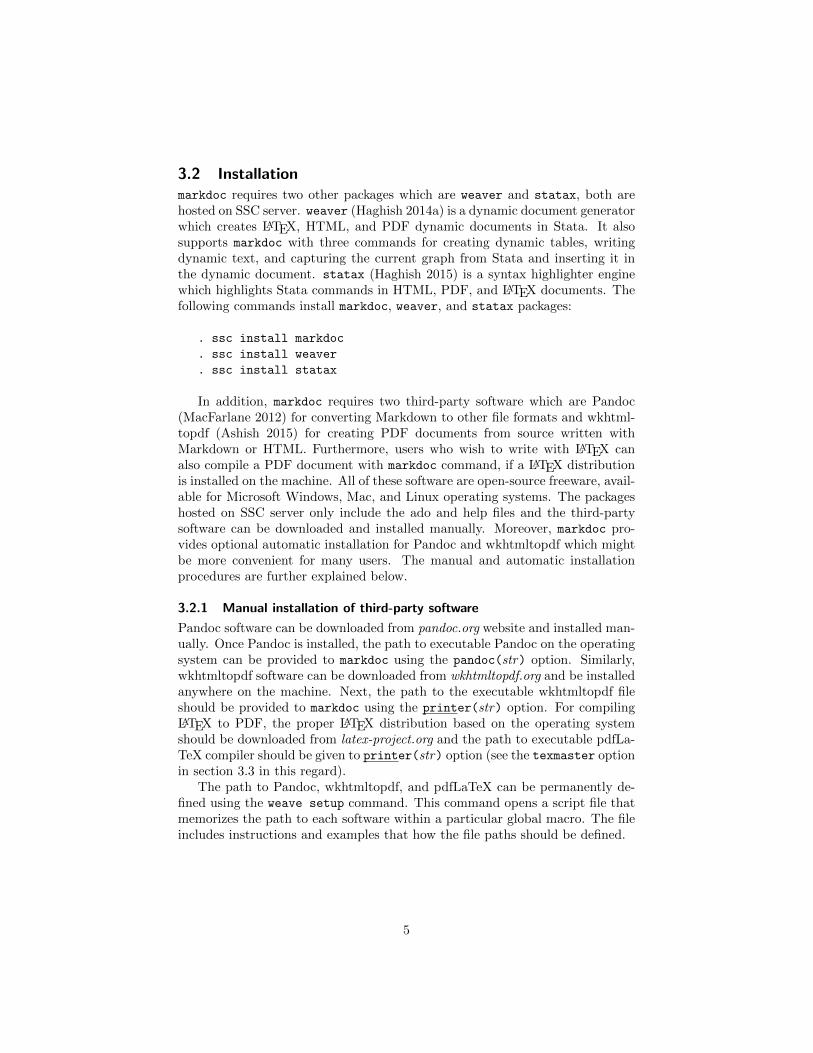
In addition, markdoc requires two third-party software which are Pandoc(MacFarlane 2012) for converting Markdown to other file formats and wkhtml-topdf (Ashish 2015) for creating PDF documents from source written withMarkdown or HTML. Furthermore, users who wish to write with LATEX canalso compile a PDF document with markdoc command, if a LATEX distributionis installed on the machine. All of these software are open-source freeware, avail-able for Microsoft Windows, Mac, and Linux operating systems. The packageshosted on SSC server only include the ado and help files and the third-partysoftware can be downloaded and installed manually. Moreover, markdoc pro-vides optional automatic installation for Pandoc and wkhtmltopdf which mightbe more convenient for many users. The manual and automatic installationprocedures are further explained below.
3.2.1 Manual installation of third-party software
Pandoc software can be downloaded from pandoc.org website and installed man-ually. Once Pandoc is installed, the path to executable Pandoc on the operatingsystem can be provided to markdoc using the pandoc(str) option. Similarly,wkhtmltopdf software can be downloaded from wkhtmltopdf.org and be installedanywhere on the machine. Next, the path to the executable wkhtmltopdf fileshould be provided to markdoc using the printer(str) option. For compilingLATEX to PDF, the proper LATEX distribution based on the operating systemshould be downloaded from latex-project.org and the path to executable pdfLa-TeX compiler should be given to printer(str) option (see the texmaster optionin section 3.3 in this regard).
The path to Pandoc, wkhtmltopdf, and pdfLaTeX can be permanently de-fined using the weave setup command. This command opens a script file thatmemorizes the path to each software within a particular global macro. The fileincludes instructions and examples that how the file paths should be defined.
5

3.2.2 Automatic installation of third-party software
The markdoc command includes the install option which downloads Pandocand wkhtmltopdf software automatically, if they are not already installed orcannot be accessed by markdoc. The automatic installation was successfullytested on Mac OSX (10.9 and 10.10), 32bit and 64bit versions of MicrosoftWindows (XP, 7, and 8), Microsoft Windows 10 (64bit), and several Linuxsystems such as Ubuntu 14.04 (64bit), Mint 17 (32bit and 64bit), and CentOS7 (64bit). However, manual installation is recommended because it ensures theusers install the latest versions of the software and update them frequently.
Technical note
markdoc installs the required software in a directory named Weaver insidethe Plus directory, where Stata expects to find user-written ado-files. The pathto the \ado\plus\ directory can be obtained by using the sysdir commandwhich lists Stata’s system directories. The default Weaver directory paths areshown below based on the operating system for Stata 13 and 14.
Windows: C:\ado\plus\Weaver
Mac OSX: ~/Library/Application Support/Stata/ado/plus/Weaver
Linux: /home/username/ado/plus/Weaver
3.3 SyntaxThe markdoc command is the main command of the package which only re-quires the name of the smcl log-file or a do-file in order to produce the dynamicdocument, as shown below. If the file suffix (.smcl or .do) is not specified, smcllog is assumed.
markdoc filename[, pandoc(str) printer(str) install linesize(#)
test replace export(name) markup(name) numbered style(name)
linesize(int) toc title(str) author(str) affiliation(str)
address(str) summary(str) date texmaster statax template(str)
noisily]
3.3.1 Options
markdoc options are as follows:
pandoc(str) specifies the path to the executable Pandoc on the machine. Thisoption is only required if Pandoc is installed manually and the path is notpermanently defined using the weave setup command.
printer(str) specifies the path to the executable wkhtmltopdf or pdfLaTeXsoftware on the machine. wkhtmltopdf generates a PDF document from
6

Markdown and HTML markup languages and pdfLaTeX typesets LATEX toPDF.
install downloads the required third-party software automatically if they arenot already installed or accessible (see section 3.2.2).
linesize(#) specifies the line size of the document and can range from 80to 255. markdoc also evaluates the linesize of the document and applies theactual linesize automatically, if the linesize is not specified. In general, it is agood practice to keep the line size of the documentation within 80 charactersor less and avoid writing long lines. breaking long line in the script file doesnot influence the dynamic document.
test runs an example do-file and generate an HTML and PDF dynamic docu-ments to ensure that the required software are running properly.
replace rewrites the exported document if it already exists.
export(name) specifies the format of the exported document. The supporteddocument formats are html, pdf, epub, LATEX tex, Microsoft Office docx,and OpenOffice/LibreOffice odt. If this option as well as the markup(name)option are not specified, markdoc exports a Markdown md file by default.
markup(name) specifies the markup language used for annotating the documentand it can be markdown, html, or latex. Markdown is the default markuplanguage.
numbered turns the numbering system on for Stata commands to number theorder of the commands in the dynamic document.
style(name) specifies the theme of the HTML, LATEX, Microsoft Word docx,and PDF documents and it can be simple or stata. The stata style can beused to export LATEX documents in Stata journal style, even if the documentis written with Markdown.
linesize(int) specifies the log-file’s width and it can range between 80 to 255.If the specified width is less than the actual width of the log-file, some wordsmight appear disjoint in the exported dynamic document.
toc automatically creates table of content in the PDF, LATEX, and MicrosoftWord dynamic documents.
title(str) specifies the title of the dynamic document.
author(str) specifies the author’s name.
affiliation(str) specifies the authors’ affiliation or any relevant information.
7

address(str) specifies a contact information or any relevant information in thedocument. For example, it can be used to add a telephone number, e-mail,or mailing address.
date adds the current date to the document.
summary(str) adds a text paragraph for the abstract or summary of document.
texmaster creates a template for LATEX documents and also includes the mostcommon packages for rendering graphs and figures in the document. With-out this option, LATEX document must begin with defining the documentclass, loading the necessary packages, as well as beginning and ending thedocument. However, this option automates the process and creates an exe-cutable LATEX document, allowing the users to only focus on the content ofthe document and keep the source code clean. Users who are not familiarwith LATEX will find this option very handy.
statax highlights the syntax of Stata codes in the HTML and PDF documents,using statax package which is a syntax highlighter engine for Stata.
template(filename) applies an external style sheet file. For example, if thedocument is written in Markdown or HTML and exported to HTML or PDF,a CSS style sheet file can be specified to alter the appearance of dynamicdocument. Similarly, when the document is exported to Microsoft WordDocx, a reference document with the similar format can be used to alter thestyle of the word document (e.g. create a Docx document, change the stylesand themes, and use it as a template file). Finally, if the document is writtenin LATEX, this option can also be used to append the LATEX header (i.e.required packages, user-defined commands, etc.) to the exported document.
noisily prints extended log for debugging markdoc.
3.4 Testing MarkDocAfter installing the required packages, markdoc can be tested to ensure thesoftware is running properly, as shown below (note that when the test optionis used, there is no need to specify the smcl log-file name). If the softwarewere installed manually, the pandoc(str) and printer(str) options should bespecified to tell markdoc where it can access Pandoc and wkhtmltopdf. Incontrast, if the software were installed automatically, only the test option isenough to carry out the test.
. markdoc, test pandoc(str) printer(str)
8

4 Supported Markup languagesIn order to automatically typeset a document from source files, a markup lan-guage is needed. A markup language is a computer language that annotatesthe content and styles in the document. Markup languages can be dividedinto three categories which are descriptive which describe the content of thedocument such as XML, procedural which define how the document should beprocessed such as PostScript, or presentational which frame how the documentshould be rendered and presented such as HTML and LATEX (Reid 2015). Forwriting a literate program, we are in need of a presentational markup languageto define the template of the document and render headings and images in thedocument. markdoc supports annotating text using three markup languageswhich are Markdown, HTML, and LATEX. These markup languages are brieflycompared with examples in the following sections.
Similar to other literate programming software and regardless of the markuplanguage used for writing a dynamic analysis document, there is a demand for aspecial notation to separate the documentation text from the analytic code andresults. As shown in the examples of the following sections, markdoc requiresthe markup syntax and the documentation text to be written as a comment inthe do-file, starting with the “/***” sign and ending with a “***/” sign, eachon a separate line. This notation allows the do-file to remain executable sincethe notation does not interfere with the code execution in Stata.
Technical note
In general, markup languages should not be mixed with one another. If thedocument is written in HTML or LATEX, the markup(name) option should bespecified because the engine of markdoc works differently based on the usedmarkup language.
4.1 MarkdownMarkdown (Gruber 2004) is a minimalistic markup language and has an intuitivesyntax which makes it preferable to HTML and LATEX. Table 1 presents the mostcommon Markdown syntax. The complete documentation of the Markdowncommands can be found on daringfireball.net website.
Dynamic documents written in Markdown can include LATEX mathemati-cal notations and also be exported to HTML and LATEX as well as any of theother supported document formats. Therefore it also provides a greater flexi-bility compared to HTML and LATEX. The example below demonstrates usingMarkdown for creating heading, subheading, and styling text in a do-file andcompiles it to a Microsoft Word document.
9
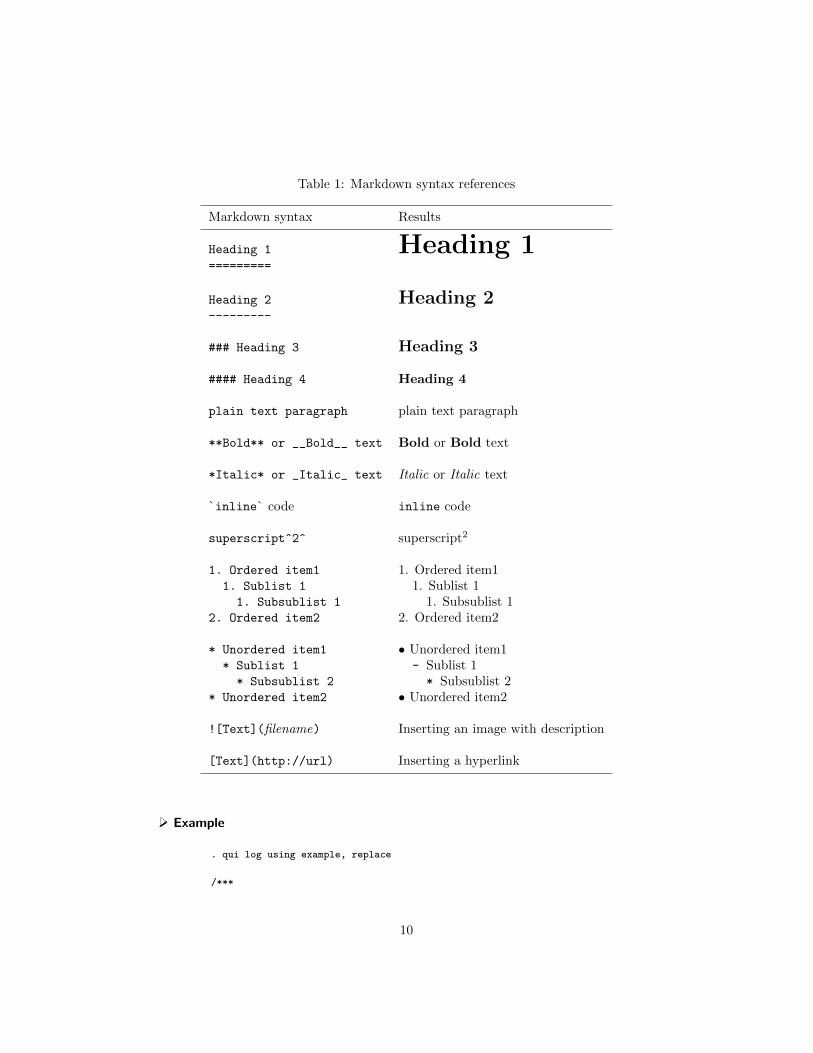
Table 1: Markdown syntax references
Markdown syntax Results
Heading 1 Heading 1=========
Heading 2 Heading 2---------
### Heading 3 Heading 3
#### Heading 4 Heading 4
plain text paragraph plain text paragraph
**Bold** or __Bold__ text Bold or Bold text
*Italic* or _Italic_ text Italic or Italic text
`inline` code inline code
superscript^2^ superscript2
1. Ordered item1 1. Ordered item11. Sublist 1 1. Sublist 11. Subsublist 1 1. Subsublist 1
2. Ordered item2 2. Ordered item2
* Unordered item1 • Unordered item1* Sublist 1 - Sublist 1* Subsublist 2 * Subsublist 2
* Unordered item2 • Unordered item2
 Inserting an image with description
[Text](http://url) Inserting a hyperlink
Example
. qui log using example, replace
/***
10

This is a heading=================
This is a subheading--------------------
Text can also appear as _Italic_ or __Bold__.***/
. qui log c
. markdoc example, export(docx)
4.2 HTML and LATEXDespite its simplicity, convenience, and flexibility, Markdown only provides thebasic styling commands such as writing headings, making text bold or italic,adding a hyper-link and inserting a graph or image in the document. In contrast,HTML and LATEX provide much more options for styling and annotating thedynamic document. But dynamic documents written in these markup languageswill not be as readable as documents written with Markdown and can onlyproduce PDF or HTML and LATEX respectively. Yet, HTML and LATEX areboth supported by markdoc package for writing dynamic documents, althoughthe reader is encouraged to practice Markdown documentation whenever thedocument does not require detailed styling. The following example creates anHTML document using HTML markup.
Example
. qui log using example, replace
/***<h1>This is a heading </h1>
<h2>This is a subheading </h2>
<p>Text can also appear as <i>Italic</i> or <b>Bold</b>.</p>***/
. qui log c
. markdoc example, export(html) markup(html)
The previous example is repeated using LATEX. In addition, the texmaster
option was added to markdoc command in order to create the document’s tem-plate automatically and allow compiling the document. Since markdoc is askedfor compiling LATEX to PDF, the path to pdfLaTeX should also be specifiedwhich is different for each operating system and LATEX distribution.
Example
. qui log using example, replace
11

/***\section{This is a heading}
\subsection{This is a subheading}
Text can also appear as \textit{Italic} or \textbf{Bold}.***/
. qui log c
. markdoc example, texmaster export(pdf) markup(latex) ///printer("/path/pdflatex")
Technical note
The default markup language is Markdown. If the document is annotatedwith HTML or LATEX, the markup(name) option should be specified.
4.3 Additional Notation MarkersAs noted earlier, markdoc package can include a subset of the smcl log-file’s codeand output to create a less-detailed documentation or concentrate on the mainresult of the analysis. For example, the user might not be interested to includethe process of data preparation and exploration in the dynamic document, sinceall the executed commands and outputs are already documented in the log-file.Nevertheless, turning the smcl log on and off is not a favorable approach becauseit reduces the transparency of the analysis, especially if the data analysis iscarried out interactively. Instead, markdoc includes a list of notation markersthat allow the user to exclude a command, output, or a part of the log-file fromthe dynamic document. These markers are listed in Table 2.
Table 2: Additional Notation Markers
Marker Description
/**/ Exclude the Stata command but keep the output
/***/ Exclude the Stata output but include the command
//OFF Exclude everything in the log that follows
//ON Deactivate the //OFF marker
//IMPORT filename Include an external file (Markdown, HTML, LaTeX)
For excluding the Stata command or output, the code line should begin with/**/ or /***/ markers respectively. In order to exclude a section of code and
12

output from the smcl log-file the //OFF and //ON markers should be placed on aseparate lines in the do-file, which makes markdoc ignore anything that appearsin between.
There are a number of user-written packages for exporting Stata outputs toLATEX and HTML files such as tabout (Watson 2007), weaver (Haghish 2014a),and synlight (Haghish 2014b). markdoc provides the “//IMPORT filename”command , which can be used to include external files in the dynamic document.For example, using the outreg2 (Wada 2014) package, a regression table canbe exported to a LATEX file and imported in the dynamic document. To keepthe source code clean, the //IMPORT command can also be used to include adescriptive text file such as a project descriptin or methodology that is notsupposed to changed based on the analysis results.
Since these markers are in the form of comments, they do not influence theexecution of the code in Stata. However, Stata imposes some limits for workingwith comment markers, similar to any other comment signs. Namely, commentscannot be executed from user-written programs and also, cannot be re-executedin loops. To tackle this problem, dynamic text should be written and executedby Stata which is discussed in the following section.
4.4 Mathematical notationsmarkdoc supports LATEX markup language and naturally, it can also renderLATEX notations. In addition, when the document is written in Markdown,markdoc can render LATEX notation in all of the supported formats. For writinginline notations, the notations should begin and end with a single dollar signand for placing the notations on a separate line, double dollar signs can be used,as shown in the example below:
Example
. qui log using example, replace
/***Writing mathematical notations==============================
The text paragraph can include mathematical notations. For example, thisformula $Y_i = \beta_0 + \beta_1 X_i + \epsilon_i$ will be displayed withinthe text paragraph, whereas this next formula will be placed on a separateline: $$Y_i = \beta_0 + \beta_1 X_i + \epsilon_i$$***/
. qui log c
. markdoc example, export(docx)
5 Writing dynamic documentationmarkdoc borrows three additional commands from weaver package which areimg, txt, and tbl, used for capturing and including graphs in the dynamic
13

document, writing dynamic text, and creating Markdown dynamic tables re-spectively. These commands are discussed with examples in this section.
5.1 Dynamic textWriting dynamic text – including macros and scalars within text – is a useful fea-ture in literate programming. By making a change in the data and re-executingthe code, dynamic text will automatically update the values mentioned in thetext. To provide writing dynamic text, the txt command – which is used fora similar purpose in the weaver package – is borrowed and updated to supportmarkdoc. The syntax of the txt command is as follows:
txt[code
][display_directive [display_directive [...]]]
Similar to the display directive of the display command in Stata, thedisplay_directive can be a double-quoted string, compound double-quotedstring, mathematical operation, scalar, as well as formatting directive (%fmt).By default, the txt command creates a text paragraph. However, if the codesubcommand is added, it produces a monospace-font text line which can be usedfor discussing a line of code in the analysis document. In the next example, ther(N) scalar which is returned from the summarize command is used to print thenumber of observations in the price variable in a dynamic text paragraph.
Example
. qui log using example, replace
. sysuse auto, clear
. quietly summarize price
. txt r(N) " observations are included in the data set."
. qui log c
Note that for executing markup and documentation within a loop or user-written programs, the txt command should be applied.
5.2 Dynamic tableSimilar to the txt, the tbl command is also borrowed from the weaver packageto create simple markdown tables which can be exported to any of the supporteddocument formats. This command creates a Markdown table and thus, shouldonly be used if the document is written in Markdown. The syntax of the tbl
is similar to matrix input command in Stata, creating the table by definingsubsequent rows.
tbl (*[,*...] [\ *[,*...] [\ [...]]])[, title(str)
]The asterisk symbol represents a display directive, which can be a double-
quoted string, compound double-quoted string, mathematical operation, scalar,or a formatting directive (%fmt). Using the auto.dta data set, I demonstratecreating a simple table that includes the number of observations, mean, andstandard deviation of the Price variable.
14

Example
. quietly summarize price
. tbl ("Variable", "Observations", "Mean", "SD" \ "_Price_", r(N), ///%9.2f r(mean), 9.2f r(sd))
Figure 2: Preview of the dynamic table
5.3 Dynamic figuresMarkdown, HTML, and LATEX have specific syntax for including figures in thedocument. In order to automatize the process of including a Stata graph inthe document, first it should be exported to an image file and then included inthe document. The example below demonstrates how to include a figure in aMicrosoft Word document, using the auto data set:
Example
. qui log using example, replace
. sysuse auto, clear
. histogram price
. quietly graph export graph.png, width(300) replace
/***Adding a figure in the document===============================
***/
. qui log c
. markdoc example, export(docx) statax
It is noteworthy that for including figures in the analysis document, theyshould be exported to any of the common graphical formats such as PNG,GIF, JPEG, etc. PNG (Portable Network Graphics) is recommended becauseit is a lossless and popular graphical format that can be included in any of thesupported document formats and is also supported by Stata.
An alternative procedure is provided by borrowing the img command fromthe weaver package. The syntax of the img command is as follows:
img[using filename
] [, title(str) width(int) height(int)
markup(name) left center]]
15

As indicated by the syntax, the img command can be used in two differentways. First, to include an image file that is already stored on the machine i.e.“img using filename”. The img command can also be used without “usingfilename”, which will automatically capture the current graph from Stata, storeit in a directory named Weaver-figure in the working directory, and import itin the dynamic document.
Example
. qui log using example, replace
. sysuse auto, clear
. histogram price
. img
. markdoc example, export(html) statax
By default, the img command prints Markdown code in the log, unless themarkup(str) option is used to define html or latex markup. The width(int)and height(int) commands, which are used to specify the figure size in thedynamic document, only work in HTML and LATEXbecause Markdown cannotresize images.
6 Examples and notesIn the following example, I will use Markdown syntax for writing and stylingtext and inserting a graph to the document and export it in PDF format. Theexample also includes the txt and tbl commands for writing dynamic text andcreating a dynamic table as well as the notation markers for hiding parts of thelog-file.
Example
. qui log using example, replace
/***In this example, I will demonstrate how to create headings, style text, inserta graph, and create dynamic tables using MarkDoc package. I will alsodemonstrate how to hide a chunk of code and output from the smcl log file. Iwill use the _auto.dta_ data set and practice some of the most basic Statacommands on the _weight_ variable which indicates the Weight of the vehicle. Iwill begin with summarizing the _Weight_ variable.***/
//OFF. sysuse auto, clear. histogram weight, frequency scheme(sj). quietly graph export graph.png, width(300) replace//ON
. summarize weight
. txt "As shown in the output of the __summarize__ command, the _weight_ " ///"variable includes " r(N) " observations with a mean of " %9.1f r(mean) ///
16

" and Standard Deviation of " %9.1f r(sd) ". Alternatively, I could " ///"create a loop for several variables to create a dynamic table with a " ///"better appearance and less detail."
//OFF. foreach var of varlist weight price mpg {
summarize `var´local `var´_mean : display %9.2f r(mean)local `var´_sd : display %9.2f r(sd)
}//ON
. tbl ("Variable Name", "Mean", "SD" "_Weight_", `weight_mean´, `weight_sd´ ///"_Price_", `price_mean´, `price_sd´ "_MPG_", `mpg_mean´, `mpg_sd´) ///, title("Table 1. Summary of _Weight_, _Price_, and _MPG_ variables")
/***Inserting a figure------------------
In order to demonstrate how to insert a figure in the dynamic document, I createa histogram of the _Weight_ variable and export it to PNG (Portable NetworkGraphics), which is a widely used lossless format.
***/
. qui log c
. markdoc example, replace export(pdf) title("MarkDoc Package Example") ///author("E. F. Haghish") affiliation("University of Freiburg (IMBI)") date
17

Preview of the document written with Markdown
MarkDoc Package ExampleE. F. Haghish
University of Freiburg (IMBI)30 Dec 2015
In this example, I will demonstrate how to create headings, style text, insert a graph, and create dynamic tables using MarkDoc package. I will also demonstrate how to hide a chunk of code and output from the smcl log file. I will use the auto.dta data set and practice some of the most basic Stata commands on the Weight variable which indicates the weight of the vehicle. I will begin with summarizing the Weight variable.
1 . summarize weight
Variable | Obs Mean Std. Dev. Min Max ‐‐‐‐‐‐‐‐‐‐‐‐‐+‐‐‐‐‐‐‐‐‐‐‐‐‐‐‐‐‐‐‐‐‐‐‐‐‐‐‐‐‐‐‐‐‐‐‐‐‐‐‐‐‐‐‐‐‐‐‐‐‐‐‐‐‐‐‐‐
weight | 74 3019.459 777.1936 1760 4840
As shown in the output of the summarize command, the weight variable includes 74 observationswith a mean of 3019.5 and Standard Deviation of 777.2. Alternatively, I could create a loop forseveral variables to create a dynamic table with a better appearance and less detail.
Table 1. Summary of Weight, Price, and MPG variables
Variable Name Mean SDWeight 3019.46 777.19Price 6165.26 2949.5MPG 21.3 5.79
Inserting a figure
In order to demonstrate how to insert a figure in the dynamic document, I creat e a histogram of theWeight variable and export it to PNG (Portable Network Graphics), which is a widely used losslessformat.
Figure 1. Distribution of the Weight variable
18

7 ConclusionPeer reviewing quantitative research calls for a transparent documentation of thedata analysis to allow independent researchers review the procedure and repro-duce the results. For the same reason, scientific journals are becoming stricterin requiring the authors to publish their data and script files as well as mak-ing potentially reusable data publicly available for further research (Loder andGroves 2015; Sturges et al. 2015; nat 2015, 2007; Piwowar et al. 2007; Sturgeset al. 2014; Piwowar and Chapman 2008; McCain 1995). Furthermore, researchis also becoming more collaborative (Wray 2002; Petre 1994; Subramanyam1983), which consequently demands within group data and code sharing andcollaborative programming. In the current article, I discussed some of the com-mon challenges in documenting the data analysis and introduced markdoc, anew literate programming package for Stata.
Literate programming in statistics – explaining and documenting the dataanalysis and statistical codes – can facilitate learning statistics and creatinganalysis documents (Baumer et al. 2014; Rossini 2001). Nevertheless, the dy-namic document is only a product of literate programming but not its the mainpurpose. In other words, literate programming values a clean, well-written, andwell-documented code and assumes it encourages users to read and compre-hend the code easier (Knuth 2007, 1984). Toward this purpose, markdoc wasprogrammed in a way to facilitate clean code documentation. Supporting a min-imalistic markup language that helps to keep the documentation simple, easyto read, and appealing such as Markdown, providing several options and stylesfor simplifying LATEX and HTML documentation, and allowing to use the samesource to compile documents in various formats are a few features that makesthe package distinctive in the field of statistics. Perhaps the biggest advantageof markdoc is that it makes data analysis a joyful activity by encouraging theuser to communicate the analysis more actively.
The simplicity of markdoc not only encourages Stata users to practice literateprogramming, but also it makes teaching literate programming in introductorycourses feasible, which is advertised as a way of improving students statisticalcomprehension and results interpretation (Baumer et al. 2014). Students canuse literate programming tools to write their notes within the statistics softwareand document the code within their script file. Supporting LATEX mathematicalnotations and compiling them to PDF, HTML, Microsoft Word, as well as LATEXturn markdoc to a powerful documentation tool that can be used within StataDo-file Editor.
Similarly, statistics teachers can get benefit from markdoc to create dynamicPDF slides that include figures, mathematical notations, Stata commands andoutput, which also allows them to reuse parts of their slides in other lectures.Incorporating a syntax highlighter that can be used in HTML, PDF, and LATEXdocuments and slides, makes the package a complete tool for developing appeal-ing educational material as well as writing dynamic analysis documents.
19

8 References2007. Got Data? Nature Neuroscience 10(8). URL http://www.nature.com/
neuro/journal/v10/n8/full/nn0807-931.html.
2015. Availability of data, material and methods. URL http://www.nature.
com/authors/policies/availability.html.
Ashish, T., Kulkarni; Jakob. 2015. WK HTML to PDF. URL http://
wkhtmltopdf.org/.
Baggerly, K. A., and D. A. Berry. 2009. Reproducible research.
Baumer, B., M. Cetinkaya-Rundel, A. Bray, L. Loi, and N. J. Horton. 2014.R Markdown: Integrating A Reproducible Analysis Tool into IntroductoryStatistics. Technology Innovations in Statistics Education 8(1).
Gentleman, R., and D. T. Lang. 2012. Statistical analyses and reproducibleresearch. Journal of Computational and Graphical Statistics .
Gruber, J. 2004. Markdown: Syntax. URL http://daringfireball.net/
projects/markdown/syntax.
Haghish, E. F. 2014a. Rethinking Literate Programming in Statis-tics. URL http://www.haghish.com/statistics/stata-blog/
reproducible-research/weaver.php.
. 2014b. synlight: Stata module to highlight syntax in SMCL andtranslate to HTML format. Statistical Software Components . URL https:
//ideas.repec.org/c/boc/bocode/s457894.html.
. 2015. Statax: JavaScript Syntax Highlighter for Stata. URL http:
//www.haghish.com/statax/statax.php.
Jann, B. 2015. Creating LaTeX documents from within Stata using texdoc.Technical report, University of Bern, Department of Social Sciences.
Knuth, D. E. 1983. The WEB system of structured documentation. Departmentof Computer Science, Stanford University.
. 1984. Literate programming. The Computer Journal 27(2): 97–111.
. 2007. Computer programming as an art. In ACM Turing award lectures,1974. ACM.
Leisch, F. 2002. Sweave: Dynamic generation of statistical reports using literatedata analysis. In Compstat, 575–580. Springer.
Lenth, R. V. 2012. StatWeave Users’ Manual . URL http://homepage.stat.
uiowa.edu/~rlenth/StatWeave/StatWeave-manual.pdf.
Loder, E., and T. Groves. 2015. The BMJ requires data sharing on request forall trials. BMJ 350: h2373.
20

MacFarlane, J. 2012. About Pandoc. URL http://johnmacfarlane.net/
pandoc/index.html.
McCain, K. W. 1995. Mandating sharing journal policies in the natural sciences.Science Communication 16(4): 403–431.
Peng, R. D. 2011. Reproducible research in computational science. Science(New York, Ny) 334(6060): 1226.
Petre, M. 1994. A Paradigm, Please-and Heavy on the Culture. InUser-Centred Requirements for Software Engineering Environments, ed.D. Gilmore, R. Winder, and F. Detienne, vol. 123 of NATO ASI Series,273–284. Springer Berlin Heidelberg. URL http://dx.doi.org/10.1007/
978-3-662-03035-6_21.
Piwowar, H. A., and W. W. Chapman. 2008. A review of journal policies forsharing research data. In ELPUB2008.
Piwowar, H. A., R. S. Day, and D. B. Fridsma. 2007. Sharing detailed researchdata is associated with increased citation rate. PloS one 2(3): e308.
Reid, J. 2015. HTML5 Programmer’s Reference. Appress.
Rossini, A., and F. Leisch. 2003. Literate statistical practice .
Rossini, A. J. 2001. Literate Statistical Practice. In Proceedings of the 2ndInternational Workshop on Distributed Statistical Computing (DSC 2001).
Stodden, V., F. Leisch, and R. D. Peng. 2014. Implementing reproducible re-search. CRC Press.
Sturges, P., M. Bamkin, J. Anders, and A. Hussain. 2014. Access to ResearchData: Addressing the Problem through Journal Data Sharing Policies .
Sturges, P., M. Bamkin, J. H. Anders, B. Hubbard, A. Hussain, and M. Hee-ley. 2015. Research data sharing: Developing a stakeholder-driven modelfor journal policies. Journal of the Association for Information Science andTechnology n/a–n/a. URL http://dx.doi.org/10.1002/asi.23336.
Subramanyam, K. 1983. Bibliometric studies of research collaboration: A re-view. Journal of information Science 6(1): 33–38.
Wada, R. 2014. OUTREG2: Stata module to arrange regression outputs intoan illustrative table. Statistical Software Components .
Watson, I. 2007. Publication quality tables in Stata: a tutorial for the tabout pro-gram. URL http://www.ianwatson.com.au/stata/tabout_tutorial.pdf.
Wray, K. B. 2002. The epistemic significance of collaborative research. Philos-ophy of Science 69(1): 150–168.
21

Xie, Y. 2013a. Dynamic Documents with R and knitr. CRC Press.
. 2013b. knitr: A general-purpose package for dynamic report generationin R. R package version 1(7).
22