market area update - c.ymcdn.com · live close to the airport) ... thurston (olympia msa) 5.7%...
TRANSCRIPT
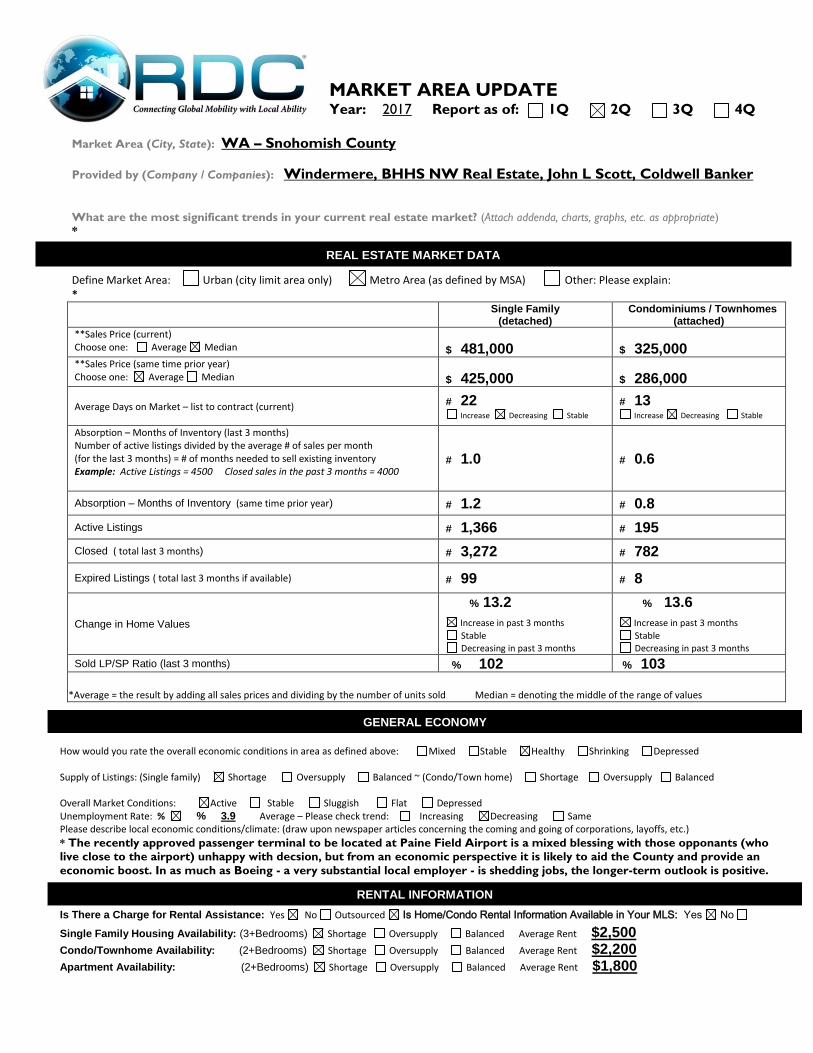
MARKET AREA UPDATE Year: 2017 Report as of: 1Q 2Q 3Q 4Q
Market Area (City, State): WA – Snohomish County
Provided by (Company / Companies): Windermere, BHHS NW Real Estate, John L Scott, Coldwell Banker
What are the most significant trends in your current real estate market? (Attach addenda, charts, graphs, etc. as appropriate)
*
Define Market Area: Urban (city limit area only) Metro Area (as defined by MSA) Other: Please explain: * Single Family
(detached) Condominiums / Townhomes
(attached)
**Sales Price (current) Choose one: Average Median
$ 481,000
$ 325,000
**Sales Price (same time prior year) Choose one: Average Median
$ 425,000
$ 286,000
Average Days on Market – list to contract (current)
# 22
Increase Decreasing Stable
# 13
Increase Decreasing Stable
Absorption – Months of Inventory (last 3 months) Number of active listings divided by the average # of sales per month (for the last 3 months) = # of months needed to sell existing inventory Example: Active Listings = 4500 Closed sales in the past 3 months = 4000
# 1.0
# 0.6
Absorption – Months of Inventory (same time prior year) # 1.2 # 0.8
Active Listings # 1,366 # 195
Closed ( total last 3 months) # 3,272 # 782
Expired Listings ( total last 3 months if available) # 99 # 8
Change in Home Values
% 13.2
Increase in past 3 months
Stable
Decreasing in past 3 months
% 13.6
Increase in past 3 months
Stable
Decreasing in past 3 months
Sold LP/SP Ratio (last 3 months) % 102 % 103
**Average = the result by adding all sales prices and dividing by the number of units sold Median = denoting the middle of the range of values
How would you rate the overall economic conditions in area as defined above: Mixed Stable Healthy Shrinking Depressed Supply of Listings: (Single family) Shortage Oversupply Balanced ~ (Condo/Town home) Shortage Oversupply Balanced Overall Market Conditions: Active Stable Sluggish Flat Depressed Unemployment Rate: % % 3.9 Average – Please check trend: Increasing Decreasing Same Please describe local economic conditions/climate: (draw upon newspaper articles concerning the coming and going of corporations, layoffs, etc.)
* The recently approved passenger terminal to be located at Paine Field Airport is a mixed blessing with those opponants (who live close to the airport) unhappy with decsion, but from an economic perspective it is likely to aid the County and provide an
economic boost. In as much as Boeing - a very substantial local employer - is shedding jobs, the longer-term outlook is positive.
Is There a Charge for Rental Assistance: Yes No Outsourced Is Home/Condo Rental Information Available in Your MLS: Yes No
Single Family Housing Availability: (3+Bedrooms) Shortage Oversupply Balanced Average Rent $2,500 Condo/Townhome Availability: (2+Bedrooms) Shortage Oversupply Balanced Average Rent $2,200
Apartment Availability: (2+Bedrooms) Shortage Oversupply Balanced Average Rent $1,800
REAL ESTATE MARKET DATA
GENERAL ECONOMY
RENTAL INFORMATION

The following analysis of the Western Washington real estate market is provided by Windermere Real Estate Chief Economist Matthew Gardner. We hope that this information may
assist you with making better-informed real estate decisions. For further information about the housing market in your area, please don’t hesitate to contact me.
ABOUT MATTHEW GARDNER Mr. Gardner is the Chief Economist for Windermere Real Estate, specializing in residential market analysis, commercial/industrial market analysis, financial analysis, and land use and regional economics. He is the former
Principal of Gardner Economics, and has more than 30 years of professional experience both in the U.S. and U.K.
W I N D E R M E R E R E A L E S T A T E P R E S E N T S
W E S T E R N W A S H I N G T O N | S E CO N D Q U A R T E R 2 0 17

ANNUAL CHANGE IN HOME SALES Q2-2016 TO Q2-2017
Clallam (Port Angeles MSA)
Mason (Shelton MSA) 27.9%
San Juan (Friday Harbor MSA) 20.0%
Lewis (Centralia MSA) 15.1%
Pierce (Tacoma MSA) 7.2%
Thurston (Olympia MSA) 5.7%
Grays Harbor (Aberdeen MSA) 5.0%
Kitsap (Bremerton/Silverdale MSA) 4.5%
Cowlitz (Longview MSA) 0.8%
King (Seattle/Bellevue MSA) -1.9%
Snohomish (Everett MSA) -2.5%
Whatcom (Bellingham MSA) -4.0%
Jefferson (Port Townsend MSA) -6.6%
Island (Oak Harbor) -6.6%
Skagit (Mt. Vernon-Anacortes MSA) -7.0%
-10% -5% 0% 5% 10% 15% 20% 25% 30%
WESTERN WASHINGTON | SECOND QUARTER 2017THE GARDNER REPORT | WINDERMERE REAL ESTATE
ECONOMIC OVERVIEWThe Washington State economy has been expanding at a rapid pace but we are seeing a slowdown as the state grows closer to full employment. Given the solid growth, I would expect to see income growth move markedly higher, though this has yet to materialize. I anticipate that we will see faster income growth in the second half of the year. I still believe that the state will add around 70,000 jobs in 2017.
Washington State, as well as the markets that make up Western Washington, continue to see unemployment fall. The latest state-wide report now shows a rate of 4.5%—the lowest rate since data started to be collected in 1976.
I believe that growth in the state will continue to outperform the U.S. as a whole and, with such robust expansion, I would not be surprised to see more people relocate here as they see Washington as a market that offers substantial opportunity.
HOME SALES AC TIVIT Y■■ There were 23,349 home sales during the
second quarter of 2017. This is an increase of 1.1% from the same period in 2016.
■■ Clallam County maintains its position as number one for sales growth over the past 12 months. Double-digit gains in sales were seen in just three other counties, which is a sharp drop from prior reports. I attribute this to inventory constraints rather than any tangible drop in demand. The only modest decline in sales last quarter was seen in Grays Harbor County.
■■ The number of homes for sale, unfortunately, showed no improvement, with an average of just 9,279 listings in the quarter, a decline of 20.4% from the second quarter of 2016. Pending sales rose by 3.6% relative to the same quarter a year ago.
■■ The key takeaway from this data is that it is unlikely we will see a significant increase in the number of homes for sale for the rest of 2017.
44.8%
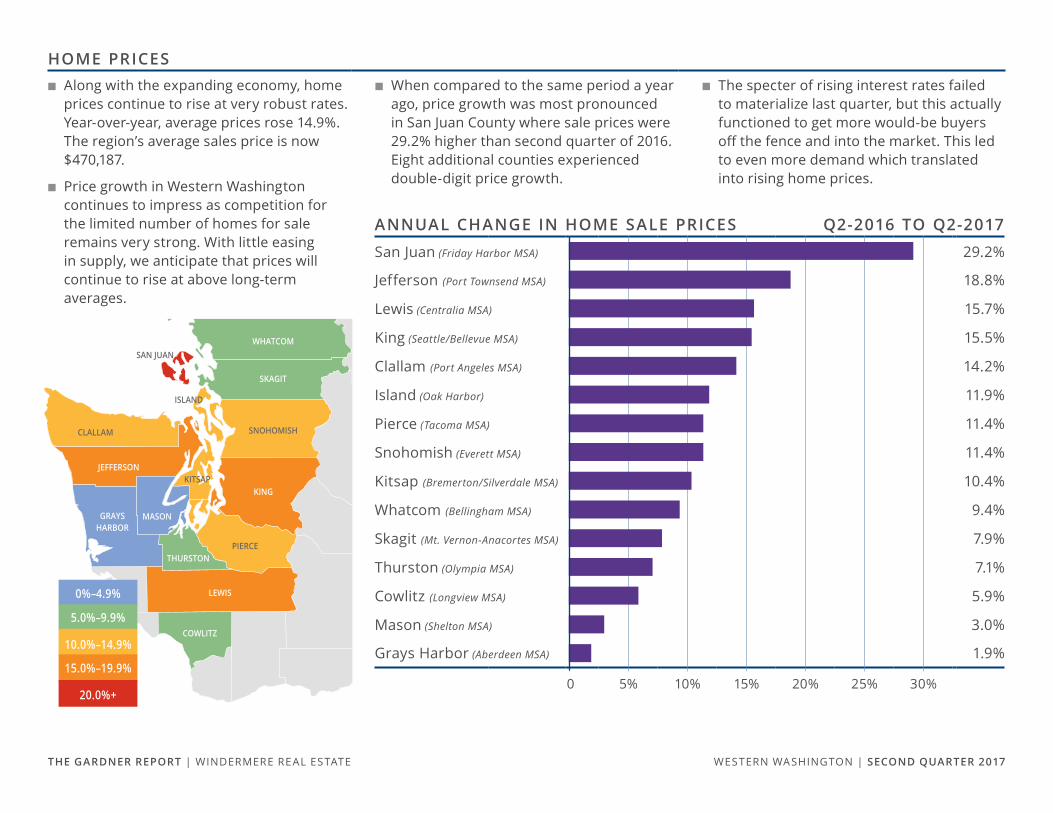
HOME PRICES■■ Along with the expanding economy, home
prices continue to rise at very robust rates. Year-over-year, average prices rose 14.9%. The region’s average sales price is now $470,187.
■■ Price growth in Western Washington continues to impress as competition for the limited number of homes for sale remains very strong. With little easing in supply, we anticipate that prices will continue to rise at above long-term averages.
■■ When compared to the same period a year ago, price growth was most pronounced in San Juan County where sale prices were 29.2% higher than second quarter of 2016. Eight additional counties experienced double-digit price growth.
■■ The specter of rising interest rates failed to materialize last quarter, but this actually functioned to get more would-be buyers off the fence and into the market. This led to even more demand which translated into rising home prices.
ANNUAL CHANGE IN HOME SALE PRICES Q2-2016 TO Q2-2017
San Juan (Friday Harbor MSA) 29.2%
Jefferson (Port Townsend MSA) 18.8%
Lewis (Centralia MSA) 15.7%
King (Seattle/Bellevue MSA) 15.5%
Clallam (Port Angeles MSA) 14.2%
Island (Oak Harbor) 11.9%
Pierce (Tacoma MSA) 11.4%
Snohomish (Everett MSA) 11.4%
Kitsap (Bremerton/Silverdale MSA) 10.4%
Whatcom (Bellingham MSA) 9.4%
Skagit (Mt. Vernon-Anacortes MSA) 7.9%
Thurston (Olympia MSA) 7.1%
Cowlitz (Longview MSA) 5.9%
Mason (Shelton MSA) 3.0%
Grays Harbor (Aberdeen MSA) 1.9%
0 5% 10% 15% 20% 25% 30%
WESTERN WASHINGTON | SECOND QUARTER 2017THE GARDNER REPORT | WINDERMERE REAL ESTATE
WHATCOM
SKAGIT
SNOHOMISH
PIERCE
KITSAP
SAN JUAN
ISLAND
JEFFERSON
CLALLAM
COWLITZ
LEWIS
THURSTON
MASONGRAYSHARBOR
KING
0%–4.9%
5.0%–9.9%
10.0%–14.9%
15.0%–19.9%
20.0%+

CONCLUSIONS
This speedometer reflects the state of the region’s housing market using housing inventory, price gains, home sales, interest rates, and larger economic factors. For the second quarter of 2017, I moved the needle a little more in favor of sellers. To define the Western Washington market as “tight” is somewhat of an understatement. Inventory is short and buyers are plentiful. Something must give, but unless we see builders delivering substantially more units than they have been, it will remain staunchly a sellers’ market for the balance of the year. Furthermore, increasing mortgage rates have failed to materialize and, with employment and income growth on the rise, the regional housing market will continue to be very robust.
© 2017 Windermere Services Company. All rights reserved.WESTERN WASHINGTON | SECOND QUARTER 2017THE GARDNER REPORT | WINDERMERE REAL ESTATE
AVER AGE DAYS ON MARKET Q2-2017
King (Seattle/Bellevue MSA) 15
Snohomish (Everett MSA) 18
Pierce (Tacoma MSA) 28
Thurston (Olympia MSA) 30
Cowlitz (Longview MSA) 35
Kitsap (Bremerton/Silverdale MSA) 36
Whatcom (Bellingham MSA) 37
Skagit (Mt. Vernon-Anacortes MSA) 45
Island (Oak Harbor) 45
Clallam (Port Angeles MSA) 52
Mason (Shelton MSA) 55
Jefferson (Port Townsend MSA) 62
Lewis (Centralia MSA) 69
Grays Harbor (Aberdeen MSA) 85
San Juan (Friday Harbor MSA) 115
0 10 20 30 40 50 60 70 80 90 100 110 120BU
YER’S
MARKET SELLER’S MARKET
DAYS ON MARKET■■ The average number of days it took to sell
a home in the quarter dropped by 18 days when compared to the same quarter of 2016.
■■ King County remains the tightest market; homes, on average, sold in a remarkable 15 days. Every county in this report saw the length of time it took to sell a home drop from the same period a year ago.
■■ Last quarter, it took an average of 48 days to sell a home. This is down from the 66 days it took in the second quarter of 2016.
■■ Given the marked lack of inventory, I would not be surprised to see the length of time it takes to sell a home drop further before the end of the year.