market data, charlottesville virginia, 2011-02-24
TRANSCRIPT
Region State USNominal GDP Growth - - 4.5%Real GDP Growth - - 3.2%CPI Change - - 1.1%10-Year Treasury Yield - - 2.65%Industrial Capacity Utilization - - 74.80%Unemployment 5.1% 6.4% 9.2%Civilian Job Growth 2.3% 1.5% 1.0%Establishment Job Growth (2000-10) 1.5% 0.9% 0.5%Establishment Job Growth (2010-15) 1.4% 1.7% 1.4%Manufacturing Job Growth (2000-10) -1.9% -3.6% -3.6%Manufacturing Job Growth (2010-15) 1.3% 0.2% 0.2%
Region
Charlottesville and Albemarle, Virginia 2000 2010 2015Population 124,285 136,255 141,129Households 48,777 55,424 58,125Renter Households 20,791 21,969 22,898Household Income $60,597 $79,437 $88,304
Market Area
Charlottesville, Virginia Market Area 2000 2010 2015Population 61,194 60,173 60,767Households 24,224 26,006 26,569Renter Households 14,250 14,337 14,672Household Income $46,991 $61,700 $67,950
Market Area
Charlottesville, Virginia Market Area Elderly Family TotalProperties Surveyed, Market Rate 6 68 74Properties Surveyed, Restricted 3 12 15Properties Surveyed, Subsidized 1 1 2Properties Surveyed, Total 10 81 91
Units Surveyed, Market Rate 546 6,650 7,196Units Surveyed, Restricted 203 1,155 1,358Units Surveyed, Subsidized 120 311 431Units Surveyed, Total 869 8,116 8,985
Occupancy Rate, Market Rate 82% 95% 94%Occupancy Rate, Restricted 92% 88% 89%Occupancy Rate, Subsidized 100% 83% 87%Occupancy Rate, Total 86% 93% 93%
Charlottesville, Virginia Market Area Subsidized Restricted Market RateSquare Foot Rent, 0 Bedroom $1.83 $1.35 $1.75Square Foot Rent, 1 Bedroom $0.95 $0.97 $1.45Square Foot Rent, 2 Bedroom $0.87 $0.80 $1.21Square Foot Rent, 3 Bedroom $0.77 $0.73 $1.17Square Foot Rent, 4 Bedroom $0.88 - $1.62
Charlottesville, Virginia Market Area(see accompanying map)
Supply Analysis
Charlottesville and Albemarle, Virginia(see accompanying map)
Charlottesville, Virginia Market Area(see accompanying map)
Demographic Outlook
Economic Outlook
Multifamily Market Data
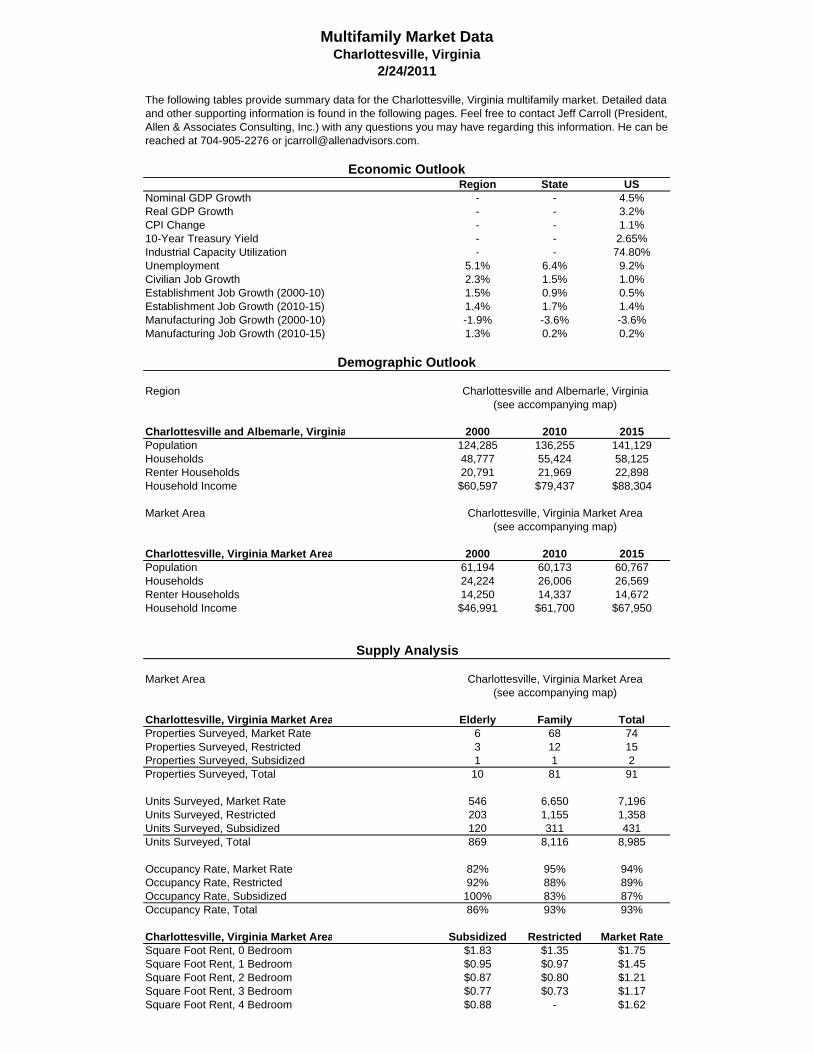
The following tables provide summary data for the Charlottesville, Virginia multifamily market. Detailed data and other supporting information is found in the following pages. Feel free to contact Jeff Carroll (President, Allen & Associates Consulting, Inc.) with any questions you may have regarding this information. He can be reached at 704-905-2276 or [email protected].
Charlottesville, Virginia2/24/2011
Overview
Our primary and secondary market area definitions are found below.
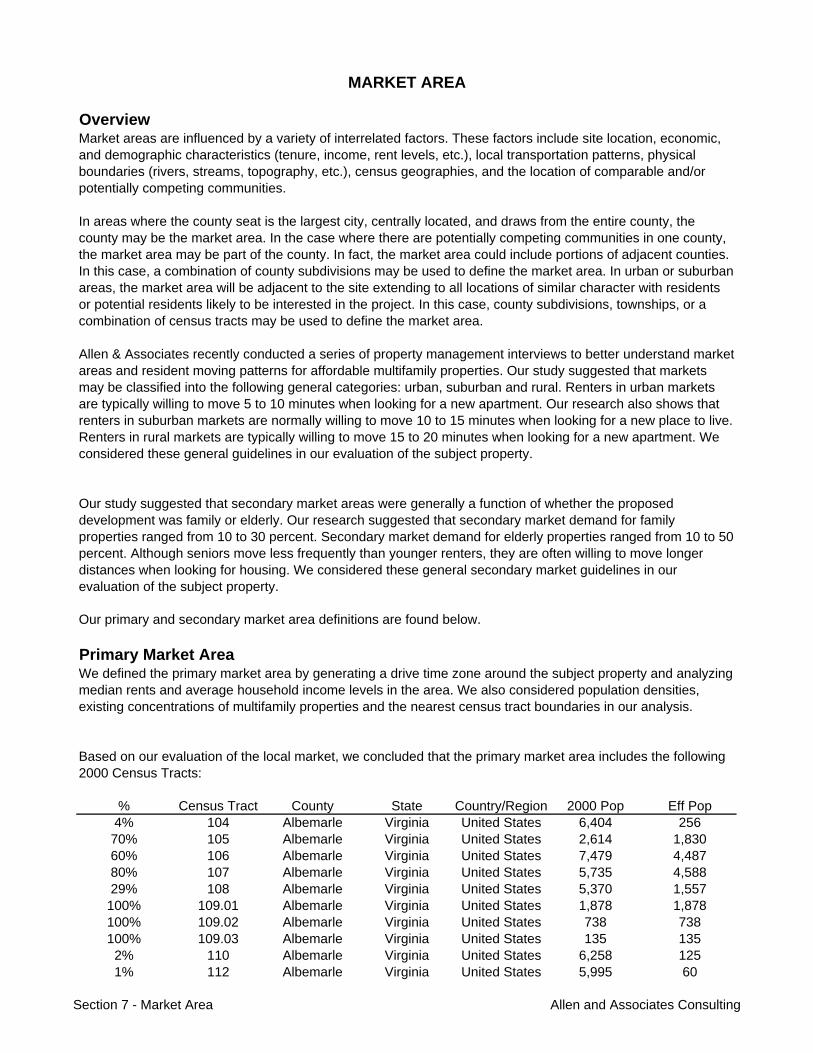
Primary Market Area
% Census Tract County State Country/Region 2000 Pop Eff Pop4% 104 Albemarle Virginia United States 6,404 25670% 105 Albemarle Virginia United States 2,614 1,83060% 106 Albemarle Virginia United States 7,479 4,48780% 107 Albemarle Virginia United States 5,735 4,58829% 108 Albemarle Virginia United States 5,370 1,557
100% 109.01 Albemarle Virginia United States 1,878 1,878100% 109.02 Albemarle Virginia United States 738 738100% 109.03 Albemarle Virginia United States 135 135
2% 110 Albemarle Virginia United States 6,258 1251% 112 Albemarle Virginia United States 5,995 60
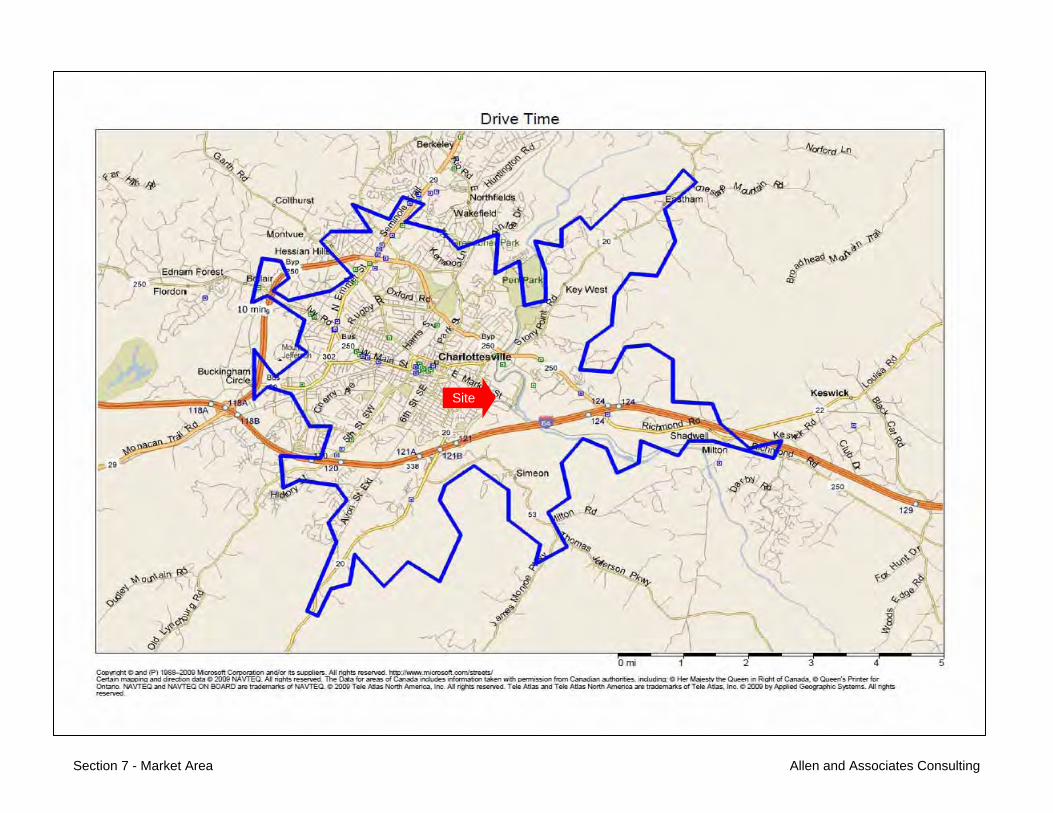
We defined the primary market area by generating a drive time zone around the subject property and analyzing median rents and average household income levels in the area. We also considered population densities, existing concentrations of multifamily properties and the nearest census tract boundaries in our analysis.
Based on our evaluation of the local market, we concluded that the primary market area includes the following 2000 Census Tracts:
Our study suggested that secondary market areas were generally a function of whether the proposed development was family or elderly. Our research suggested that secondary market demand for family properties ranged from 10 to 30 percent. Secondary market demand for elderly properties ranged from 10 to 50 percent. Although seniors move less frequently than younger renters, they are often willing to move longer distances when looking for housing. We considered these general secondary market guidelines in our evaluation of the subject property.
MARKET AREA
Market areas are influenced by a variety of interrelated factors. These factors include site location, economic, and demographic characteristics (tenure, income, rent levels, etc.), local transportation patterns, physical boundaries (rivers, streams, topography, etc.), census geographies, and the location of comparable and/or potentially competing communities.
In areas where the county seat is the largest city, centrally located, and draws from the entire county, the county may be the market area. In the case where there are potentially competing communities in one county, the market area may be part of the county. In fact, the market area could include portions of adjacent counties. In this case, a combination of county subdivisions may be used to define the market area. In urban or suburban areas, the market area will be adjacent to the site extending to all locations of similar character with residents or potential residents likely to be interested in the project. In this case, county subdivisions, townships, or a combination of census tracts may be used to define the market area.
Allen & Associates recently conducted a series of property management interviews to better understand market areas and resident moving patterns for affordable multifamily properties. Our study suggested that markets may be classified into the following general categories: urban, suburban and rural. Renters in urban markets are typically willing to move 5 to 10 minutes when looking for a new apartment. Our research also shows that renters in suburban markets are normally willing to move 10 to 15 minutes when looking for a new place to live. Renters in rural markets are typically willing to move 15 to 20 minutes when looking for a new apartment. We considered these general guidelines in our evaluation of the subject property.
Section 7 - Market Area Allen and Associates Consulting
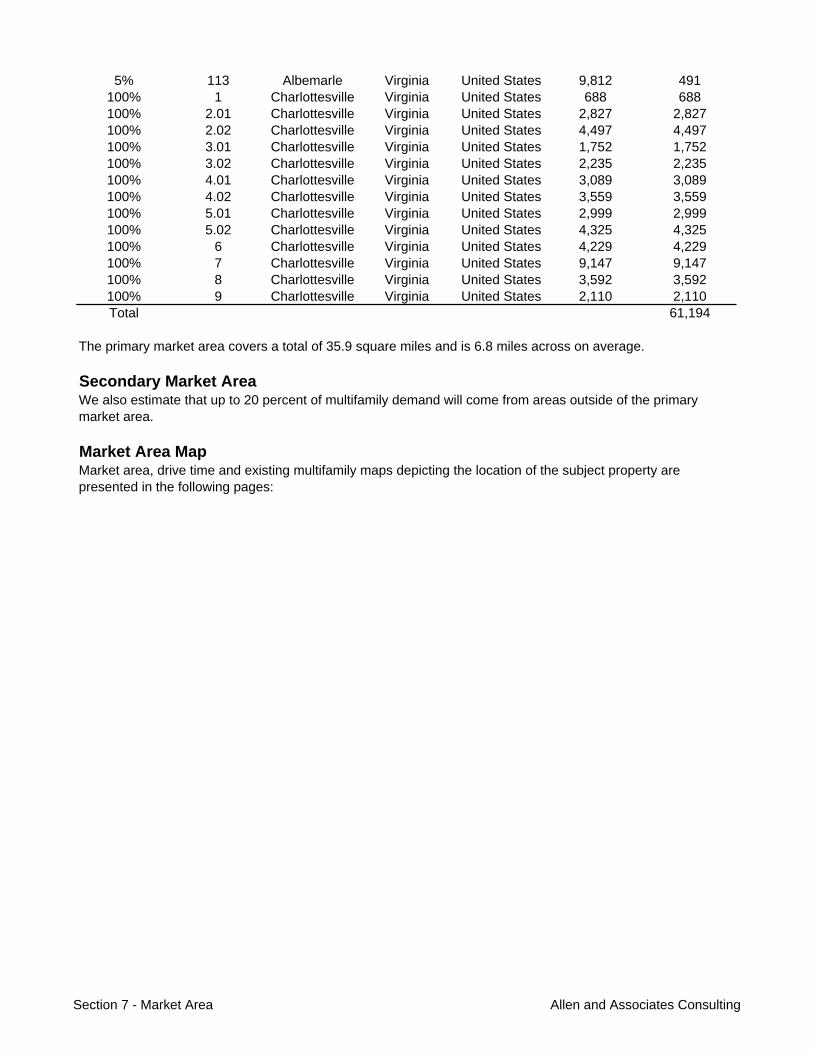
5% 113 Albemarle Virginia United States 9,812 491100% 1 Charlottesville Virginia United States 688 688100% 2.01 Charlottesville Virginia United States 2,827 2,827100% 2.02 Charlottesville Virginia United States 4,497 4,497100% 3.01 Charlottesville Virginia United States 1,752 1,752100% 3.02 Charlottesville Virginia United States 2,235 2,235100% 4.01 Charlottesville Virginia United States 3,089 3,089100% 4.02 Charlottesville Virginia United States 3,559 3,559100% 5.01 Charlottesville Virginia United States 2,999 2,999100% 5.02 Charlottesville Virginia United States 4,325 4,325100% 6 Charlottesville Virginia United States 4,229 4,229100% 7 Charlottesville Virginia United States 9,147 9,147100% 8 Charlottesville Virginia United States 3,592 3,592100% 9 Charlottesville Virginia United States 2,110 2,110Total 61,194
Secondary Market Area
Market Area Map
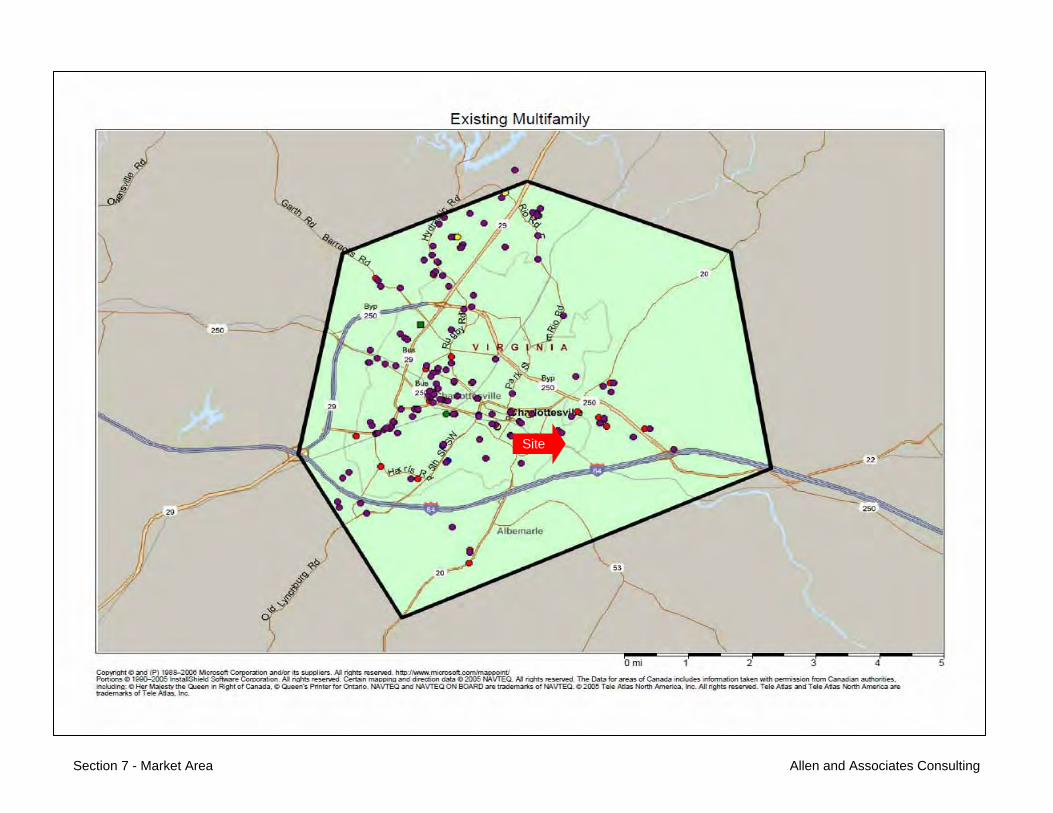
We also estimate that up to 20 percent of multifamily demand will come from areas outside of the primary market area.
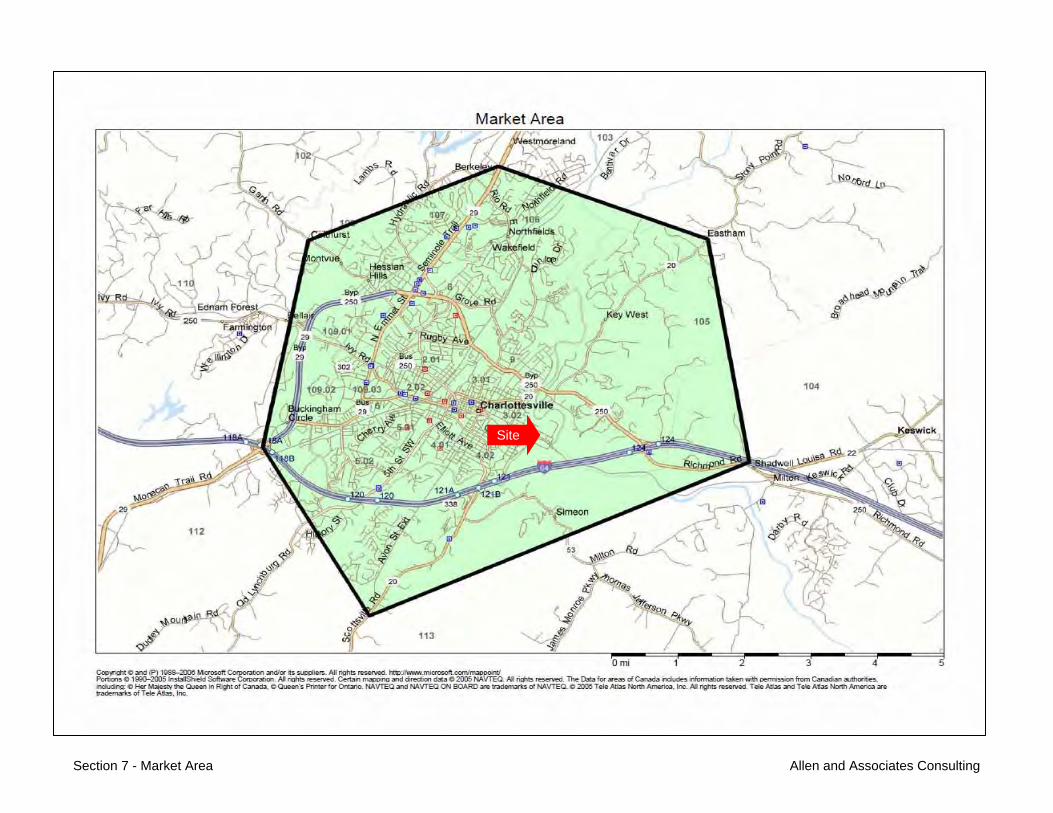
Market area, drive time and existing multifamily maps depicting the location of the subject property are presented in the following pages:
The primary market area covers a total of 35.9 square miles and is 6.8 miles across on average.
Section 7 - Market Area Allen and Associates Consulting
Market Area.pdf
Site
Section 7 - Market Area Allen and Associates Consulting
Drive Time.pdfSite
Section 7 - Market Area Allen and Associates Consulting
Existing Multifamily.pdf
Site
Section 7 - Market Area Allen and Associates Consulting
Gross Domestic Product
Nominal Gross Domestic Product
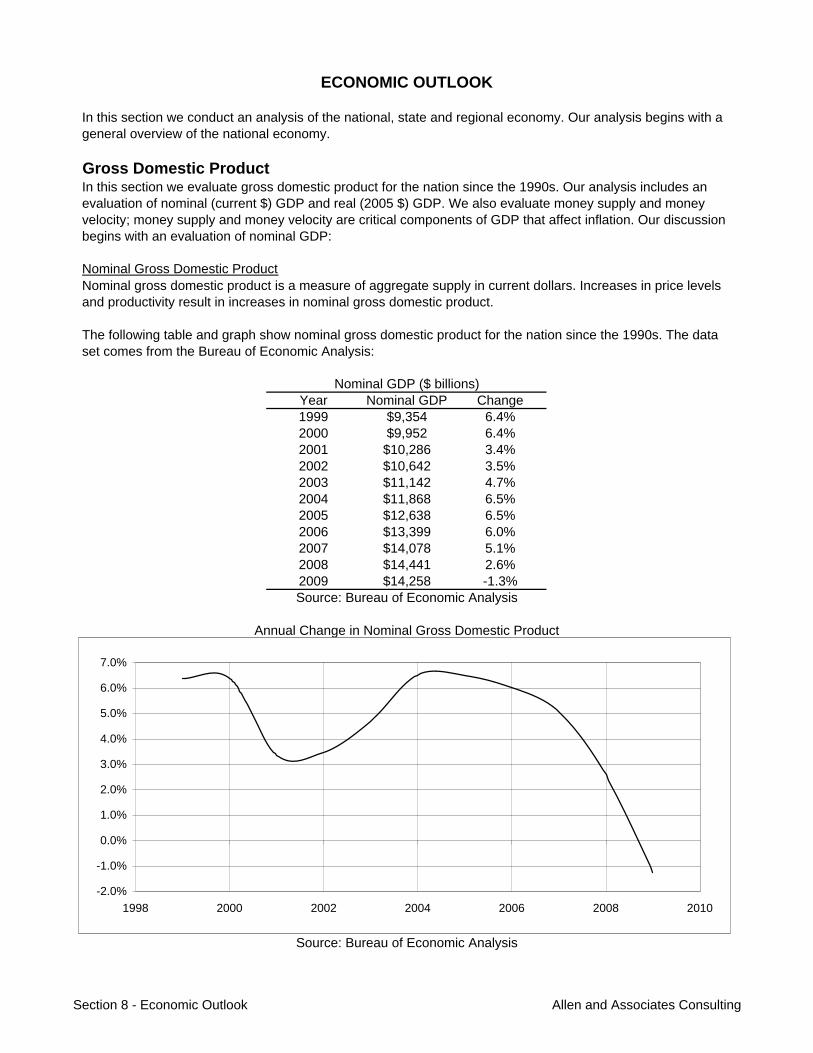
Year Nominal GDP Change1999 $9,354 6.4%2000 $9,952 6.4%2001 $10,286 3.4%2002 $10,642 3.5%2003 $11,142 4.7%2004 $11,868 6.5%2005 $12,638 6.5%2006 $13,399 6.0%2007 $14,078 5.1%2008 $14,441 2.6%2009 $14,258 -1.3%
ECONOMIC OUTLOOK
In this section we conduct an analysis of the national, state and regional economy. Our analysis begins with a general overview of the national economy.
Source: Bureau of Economic Analysis
Nominal GDP ($ billions)
In this section we evaluate gross domestic product for the nation since the 1990s. Our analysis includes an evaluation of nominal (current $) GDP and real (2005 $) GDP. We also evaluate money supply and money velocity; money supply and money velocity are critical components of GDP that affect inflation. Our discussion begins with an evaluation of nominal GDP:
Nominal gross domestic product is a measure of aggregate supply in current dollars. Increases in price levels and productivity result in increases in nominal gross domestic product.
The following table and graph show nominal gross domestic product for the nation since the 1990s. The data set comes from the Bureau of Economic Analysis:
Annual Change in Nominal Gross Domestic Product
Source: Bureau of Economic Analysis
-2.0%
-1.0%
0.0%
1.0%
2.0%
3.0%
4.0%
5.0%
6.0%
7.0%
1998 2000 2002 2004 2006 2008 2010
Section 8 - Economic Outlook Allen and Associates Consulting
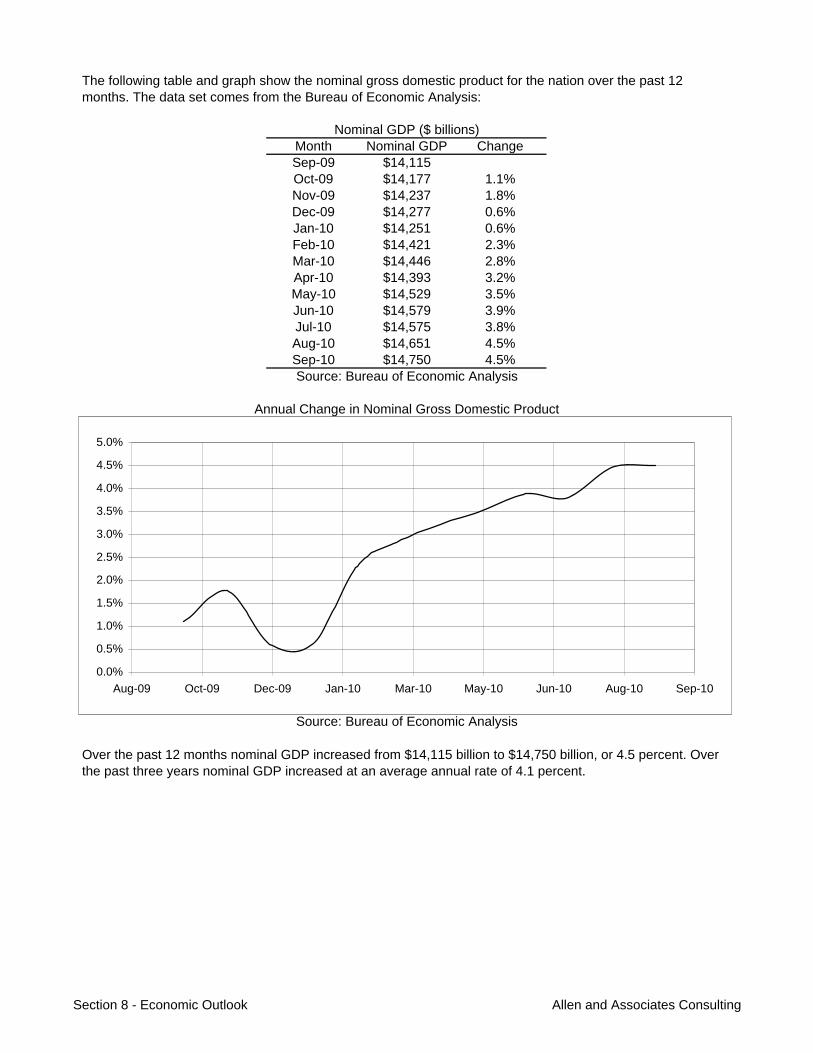
Month Nominal GDP ChangeSep-09 $14,115Oct-09 $14,177 1.1%Nov-09 $14,237 1.8%Dec-09 $14,277 0.6%Jan-10 $14,251 0.6%Feb-10 $14,421 2.3%Mar-10 $14,446 2.8%Apr-10 $14,393 3.2%May-10 $14,529 3.5%Jun-10 $14,579 3.9%Jul-10 $14,575 3.8%Aug-10 $14,651 4.5%Sep-10 $14,750 4.5%
Over the past 12 months nominal GDP increased from $14,115 billion to $14,750 billion, or 4.5 percent. Over the past three years nominal GDP increased at an average annual rate of 4.1 percent.
Nominal GDP ($ billions)
Source: Bureau of Economic Analysis
Annual Change in Nominal Gross Domestic Product
Source: Bureau of Economic Analysis
The following table and graph show the nominal gross domestic product for the nation over the past 12 months. The data set comes from the Bureau of Economic Analysis:
0.0%
0.5%
1.0%
1.5%
2.0%
2.5%
3.0%
3.5%
4.0%
4.5%
5.0%
Aug-09 Oct-09 Dec-09 Jan-10 Mar-10 May-10 Jun-10 Aug-10 Sep-10
Section 8 - Economic Outlook Allen and Associates Consulting

Real Gross Domestic Product
Year Real GDP Change1991 $8,015 -0.2%1992 $8,287 3.4%1993 $8,523 2.9%1994 $8,871 4.1%1995 $9,094 2.5%1996 $9,434 3.7%1997 $9,854 4.5%1998 $10,284 4.4%1999 $10,780 4.8%2000 $11,226 4.1%2001 $11,347 1.1%2002 $11,553 1.8%2003 $11,841 2.5%2004 $12,264 3.6%2005 $12,638 3.1%2006 $12,976 2.7%2007 $13,254 2.1%2008 $13,312 0.4%2009 $12,990 -2.4%
Real gross domestic product is a measure of aggregate supply in constant dollars. Increases in real gross domestic product are sometimes thought of as increases in productivity.
Annual Change in Real Gross Domestic Product
Source: Bureau of Economic Analysis
The following table and graph show the real gross domestic product for the nation since the 1990s. The data set comes from the Bureau of Economic Analysis:
Real GDP ($ billions)
Source: Bureau of Economic Analysis
-3.0%
-2.0%
-1.0%
0.0%
1.0%
2.0%
3.0%
4.0%
5.0%
6.0%
1990 1992 1994 1996 1998 2000 2002 2004 2006 2008 2010
Section 8 - Economic Outlook Allen and Associates Consulting
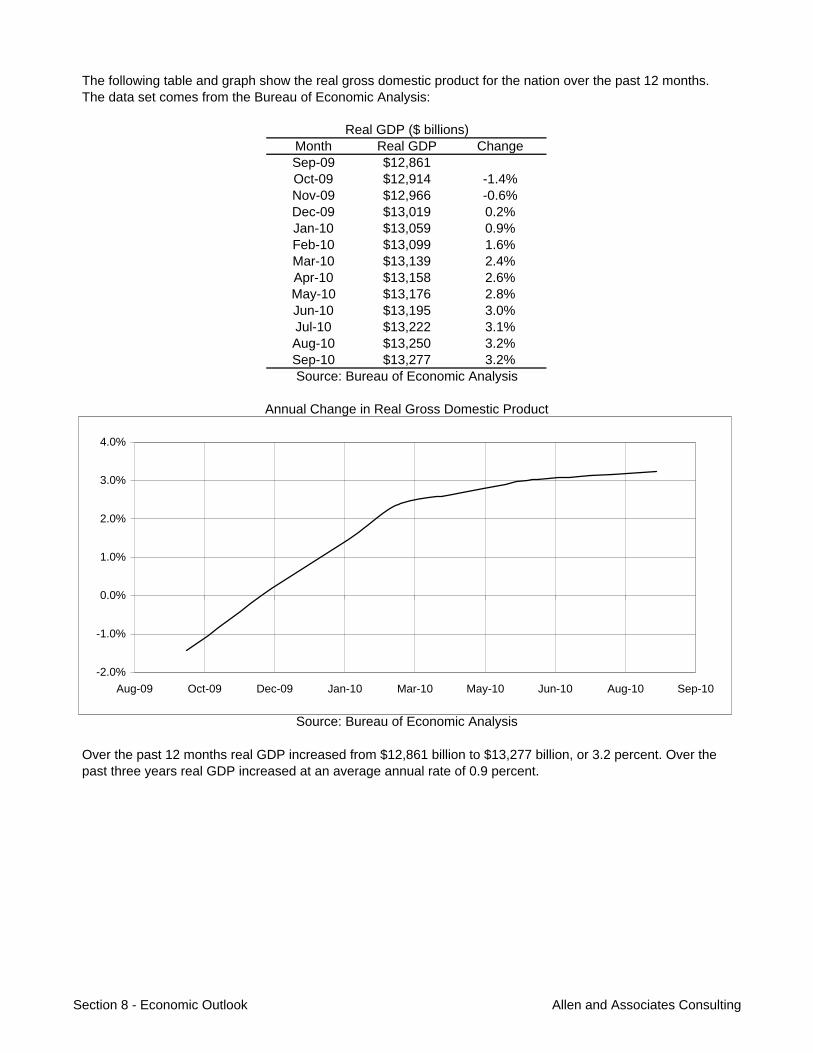
Month Real GDP ChangeSep-09 $12,861Oct-09 $12,914 -1.4%Nov-09 $12,966 -0.6%Dec-09 $13,019 0.2%Jan-10 $13,059 0.9%Feb-10 $13,099 1.6%Mar-10 $13,139 2.4%Apr-10 $13,158 2.6%May-10 $13,176 2.8%Jun-10 $13,195 3.0%Jul-10 $13,222 3.1%Aug-10 $13,250 3.2%Sep-10 $13,277 3.2%
Source: Bureau of Economic Analysis
Over the past 12 months real GDP increased from $12,861 billion to $13,277 billion, or 3.2 percent. Over the past three years real GDP increased at an average annual rate of 0.9 percent.
Real GDP ($ billions)
Source: Bureau of Economic Analysis
Annual Change in Real Gross Domestic Product
The following table and graph show the real gross domestic product for the nation over the past 12 months. The data set comes from the Bureau of Economic Analysis:
-2.0%
-1.0%
0.0%
1.0%
2.0%
3.0%
4.0%
Aug-09 Oct-09 Dec-09 Jan-10 Mar-10 May-10 Jun-10 Aug-10 Sep-10
Section 8 - Economic Outlook Allen and Associates Consulting
Money Supply
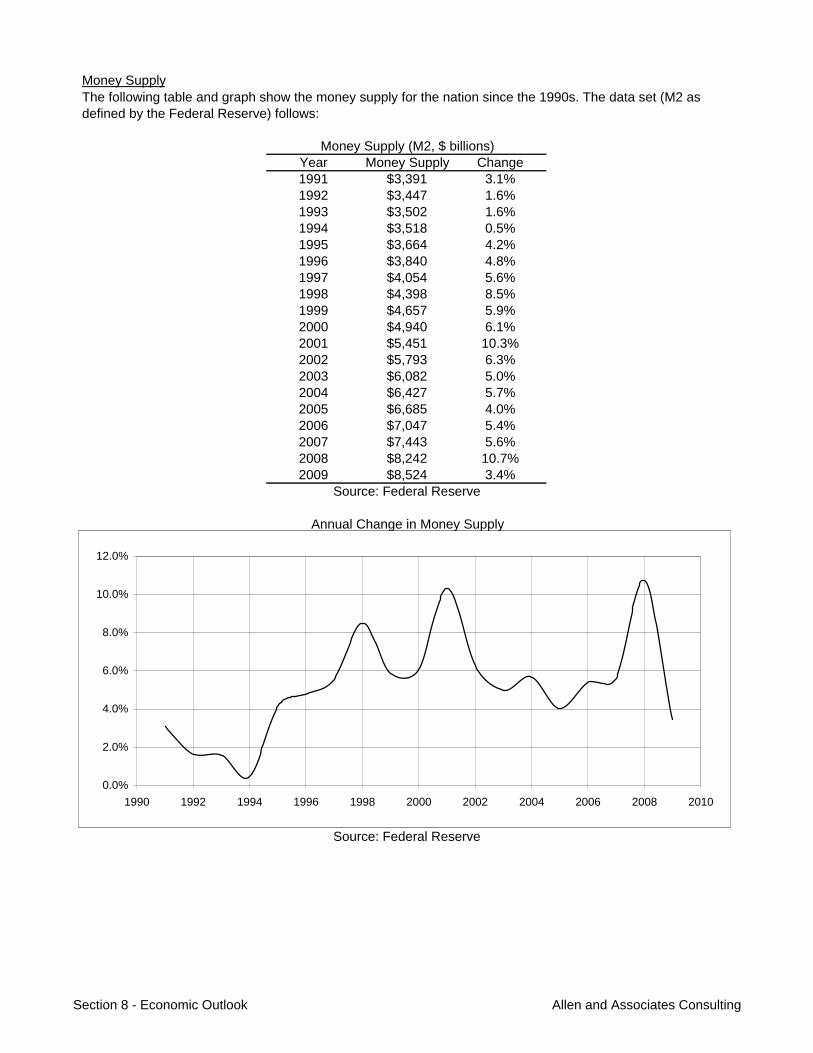
Year Money Supply Change1991 $3,391 3.1%1992 $3,447 1.6%1993 $3,502 1.6%1994 $3,518 0.5%1995 $3,664 4.2%1996 $3,840 4.8%1997 $4,054 5.6%1998 $4,398 8.5%1999 $4,657 5.9%2000 $4,940 6.1%2001 $5,451 10.3%2002 $5,793 6.3%2003 $6,082 5.0%2004 $6,427 5.7%2005 $6,685 4.0%2006 $7,047 5.4%2007 $7,443 5.6%2008 $8,242 10.7%2009 $8,524 3.4%
Annual Change in Money Supply
Money Supply (M2, $ billions)
Source: Federal Reserve
The following table and graph show the money supply for the nation since the 1990s. The data set (M2 as defined by the Federal Reserve) follows:
Source: Federal Reserve
0.0%
2.0%
4.0%
6.0%
8.0%
10.0%
12.0%
1990 1992 1994 1996 1998 2000 2002 2004 2006 2008 2010
Section 8 - Economic Outlook Allen and Associates Consulting
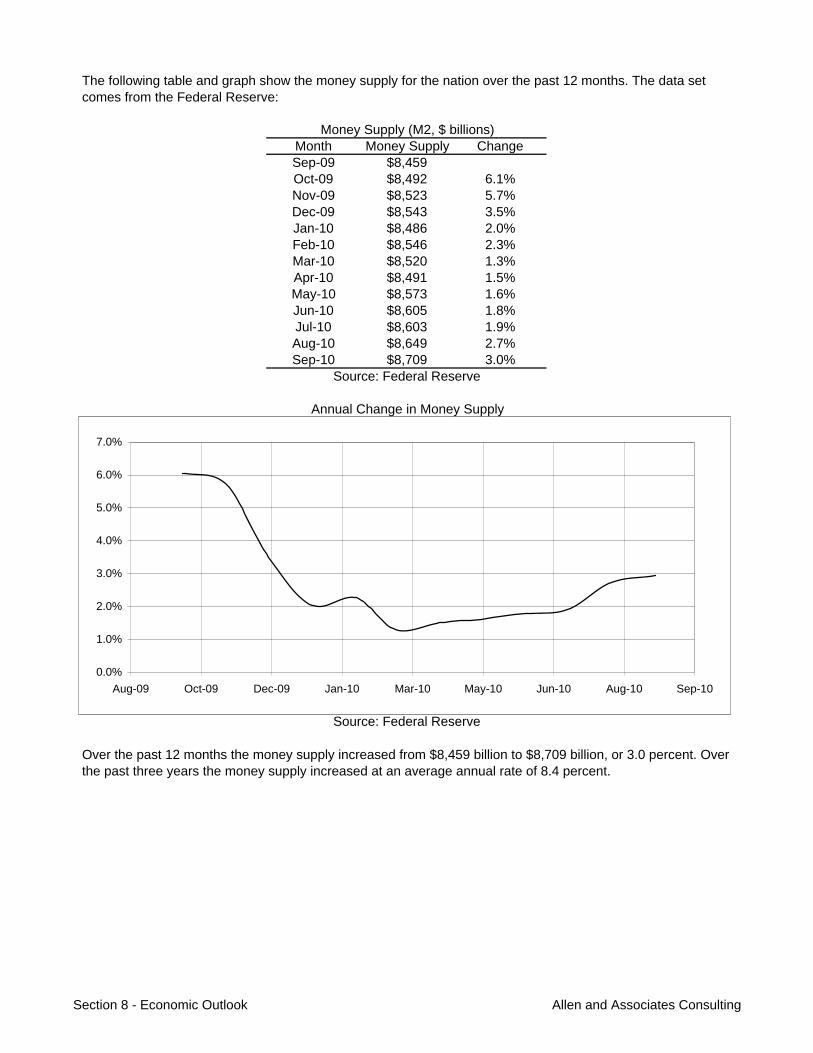
Month Money Supply ChangeSep-09 $8,459Oct-09 $8,492 6.1%Nov-09 $8,523 5.7%Dec-09 $8,543 3.5%Jan-10 $8,486 2.0%Feb-10 $8,546 2.3%Mar-10 $8,520 1.3%Apr-10 $8,491 1.5%May-10 $8,573 1.6%Jun-10 $8,605 1.8%Jul-10 $8,603 1.9%Aug-10 $8,649 2.7%Sep-10 $8,709 3.0%
The following table and graph show the money supply for the nation over the past 12 months. The data set comes from the Federal Reserve:
Money Supply (M2, $ billions)
Source: Federal Reserve
Annual Change in Money Supply
Source: Federal Reserve
Over the past 12 months the money supply increased from $8,459 billion to $8,709 billion, or 3.0 percent. Over the past three years the money supply increased at an average annual rate of 8.4 percent.
0.0%
1.0%
2.0%
3.0%
4.0%
5.0%
6.0%
7.0%
Aug-09 Oct-09 Dec-09 Jan-10 Mar-10 May-10 Jun-10 Aug-10 Sep-10
Section 8 - Economic Outlook Allen and Associates Consulting
Money Velocity
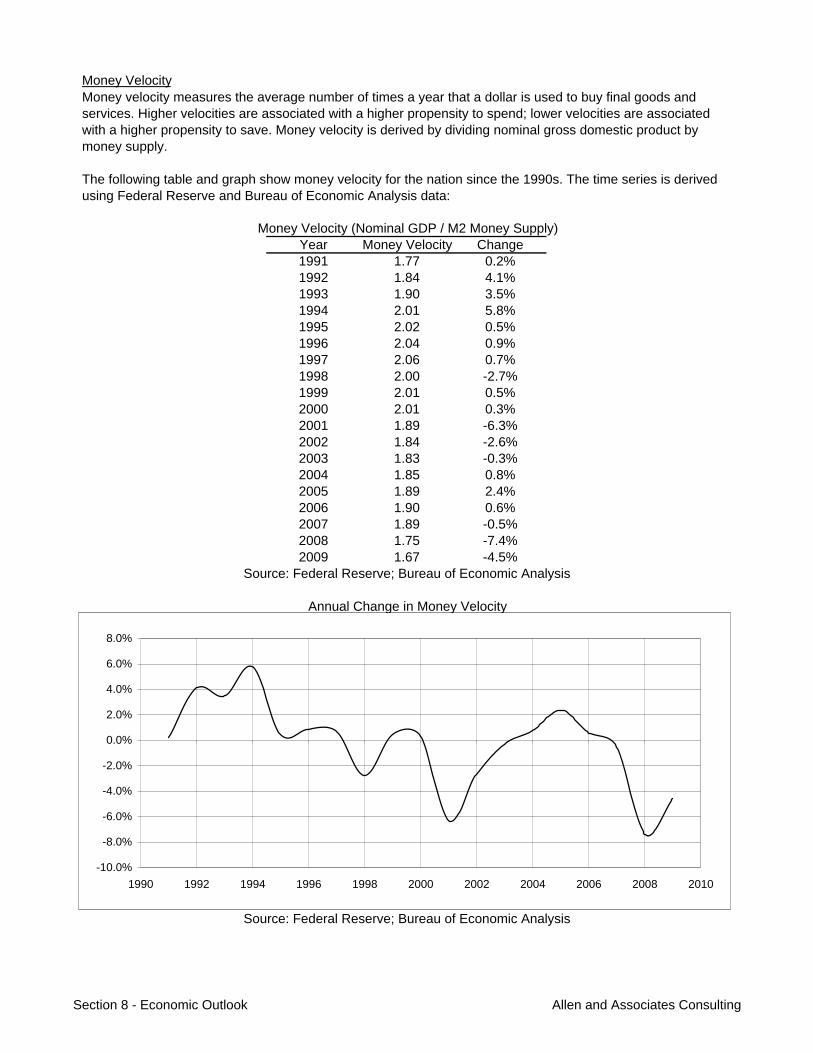
Year Money Velocity Change1991 1.77 0.2%1992 1.84 4.1%1993 1.90 3.5%1994 2.01 5.8%1995 2.02 0.5%1996 2.04 0.9%1997 2.06 0.7%1998 2.00 -2.7%1999 2.01 0.5%2000 2.01 0.3%2001 1.89 -6.3%2002 1.84 -2.6%2003 1.83 -0.3%2004 1.85 0.8%2005 1.89 2.4%2006 1.90 0.6%2007 1.89 -0.5%2008 1.75 -7.4%2009 1.67 -4.5%
The following table and graph show money velocity for the nation since the 1990s. The time series is derived using Federal Reserve and Bureau of Economic Analysis data:
Money velocity measures the average number of times a year that a dollar is used to buy final goods and services. Higher velocities are associated with a higher propensity to spend; lower velocities are associated with a higher propensity to save. Money velocity is derived by dividing nominal gross domestic product by money supply.
Annual Change in Money Velocity
Source: Federal Reserve; Bureau of Economic Analysis
Money Velocity (Nominal GDP / M2 Money Supply)
Source: Federal Reserve; Bureau of Economic Analysis
-10.0%
-8.0%
-6.0%
-4.0%
-2.0%
0.0%
2.0%
4.0%
6.0%
8.0%
1990 1992 1994 1996 1998 2000 2002 2004 2006 2008 2010
Section 8 - Economic Outlook Allen and Associates Consulting
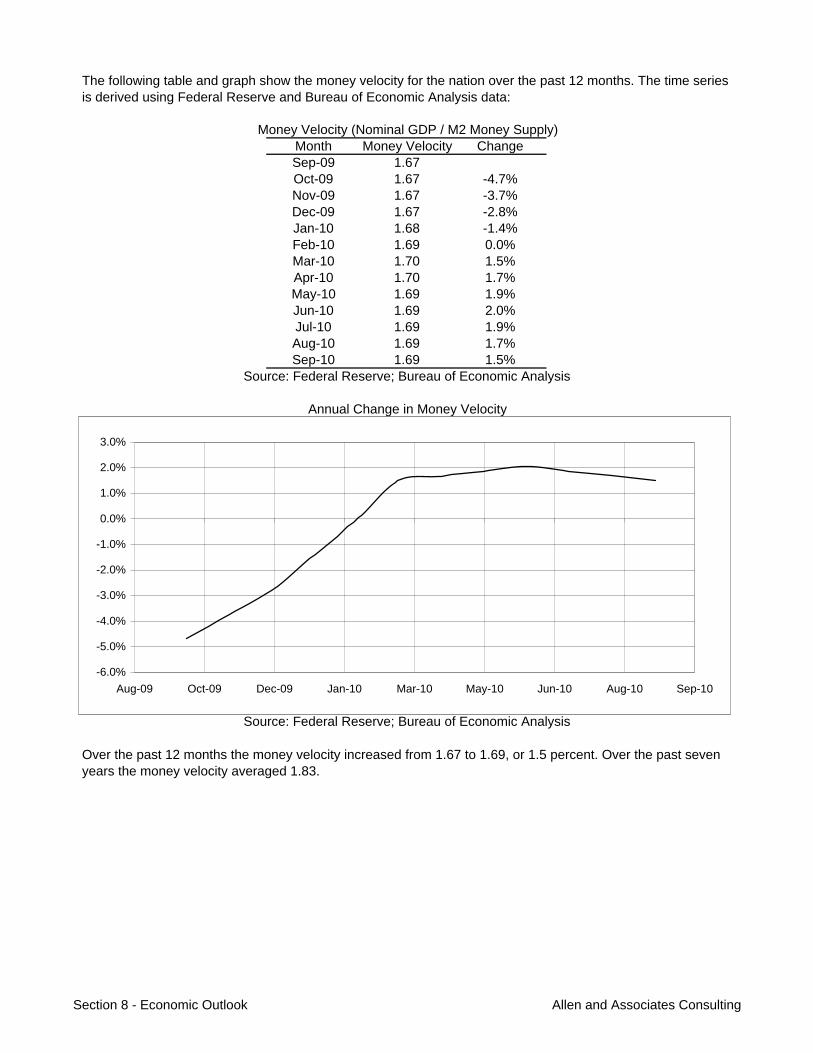
Month Money Velocity ChangeSep-09 1.67Oct-09 1.67 -4.7%Nov-09 1.67 -3.7%Dec-09 1.67 -2.8%Jan-10 1.68 -1.4%Feb-10 1.69 0.0%Mar-10 1.70 1.5%Apr-10 1.70 1.7%May-10 1.69 1.9%Jun-10 1.69 2.0%Jul-10 1.69 1.9%Aug-10 1.69 1.7%Sep-10 1.69 1.5%
Annual Change in Money Velocity
Source: Federal Reserve; Bureau of Economic Analysis
Over the past 12 months the money velocity increased from 1.67 to 1.69, or 1.5 percent. Over the past seven years the money velocity averaged 1.83.
The following table and graph show the money velocity for the nation over the past 12 months. The time series is derived using Federal Reserve and Bureau of Economic Analysis data:
Source: Federal Reserve; Bureau of Economic Analysis
Money Velocity (Nominal GDP / M2 Money Supply)
-6.0%
-5.0%
-4.0%
-3.0%
-2.0%
-1.0%
0.0%
1.0%
2.0%
3.0%
Aug-09 Oct-09 Dec-09 Jan-10 Mar-10 May-10 Jun-10 Aug-10 Sep-10
Section 8 - Economic Outlook Allen and Associates Consulting
Inflation Outlook
After the economy has recovered, we anticipate that the money supply will grow 10.0 percent annually. We also anticipate that money velocity will grow 0.0 percent per year, accompanied by real gross domestic product growth of 4.0 percent. This results in an estimated annual inflation rate of 6.0 percent.
During the expected recovery, we anticipate that the money supply will grow 10.0 percent annually. We also anticipate that money velocity will grow 6.0 percent per year, accompanied by real gross domestic product growth of 4.0 percent. This results in an estimated annual inflation rate of 12.0 percent.
In the immediate term, we anticipate that the money supply will grow 4.0 percent annually. We also anticipate that money velocity will grow 2.0 percent per year, accompanied by real gross domestic product growth of 3.0 percent. This results in an estimated annual inflation rate of 3.0 percent.
Many economists maintain that inflationary pressures will begin to take place once the national unemployment rate falls below 6.0 percent and industrial capacity utilization rises above 80 percent. These figures currently stand at 9.2 percent and 75 percent, respectively.
Inflation can be estimated by adding the anticipated annual change in money supply to the anticipated annual change in money velocity and then subtracting the anticipated annual change in real gross domestic product.
Section 8 - Economic Outlook Allen and Associates Consulting
Consumer Price Index
Year Index Change1991 136.2 4.2%1992 140.3 3.0%1993 144.5 3.0%1994 148.2 2.6%1995 152.4 2.8%1996 156.9 3.0%1997 160.5 2.3%1998 163.0 1.6%1999 166.6 2.2%2000 172.2 3.4%2001 177.1 2.8%2002 179.9 1.6%2003 184.0 2.3%2004 188.9 2.7%2005 195.3 3.4%2006 201.6 3.2%2007 207.3 2.8%2008 215.3 3.9%2009 214.5 -0.4%
Sep-09 216.0Sep-10 218.4 1.1%
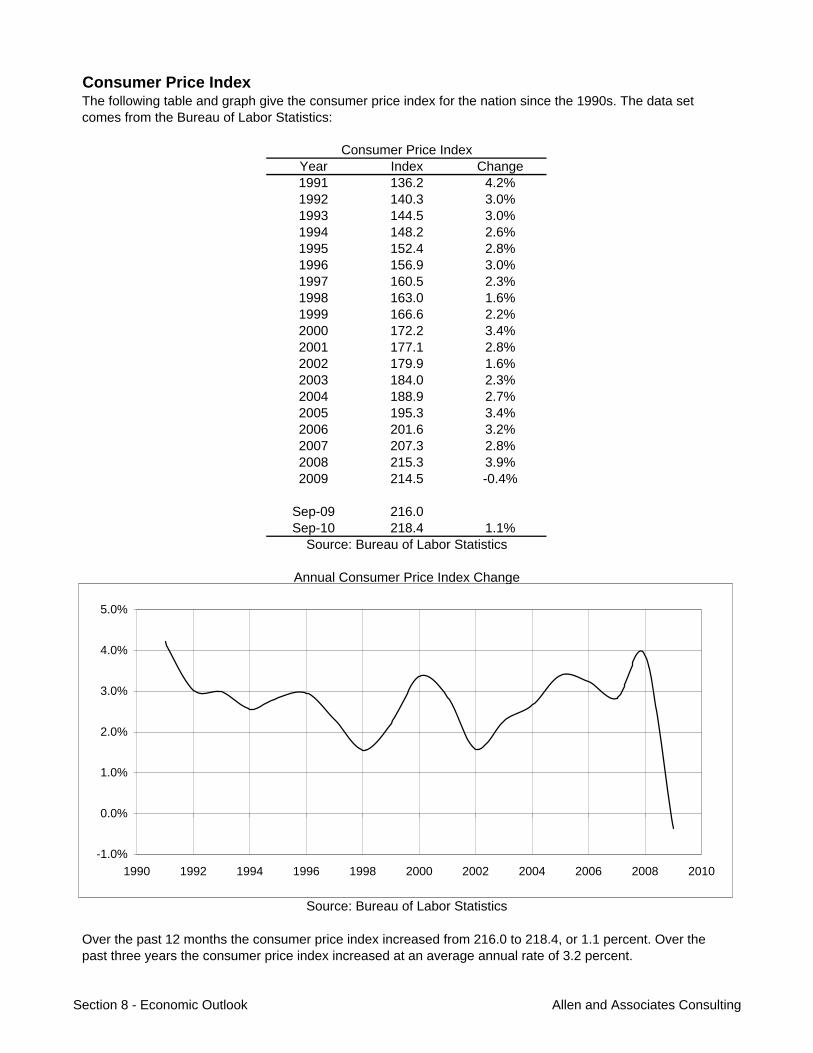
The following table and graph give the consumer price index for the nation since the 1990s. The data set comes from the Bureau of Labor Statistics:
Annual Consumer Price Index Change
Source: Bureau of Labor Statistics
Over the past 12 months the consumer price index increased from 216.0 to 218.4, or 1.1 percent. Over the past three years the consumer price index increased at an average annual rate of 3.2 percent.
Source: Bureau of Labor Statistics
Consumer Price Index
-1.0%
0.0%
1.0%
2.0%
3.0%
4.0%
5.0%
1990 1992 1994 1996 1998 2000 2002 2004 2006 2008 2010
Section 8 - Economic Outlook Allen and Associates Consulting
Interest Rates
Year Yield Change1991 7.86% -0.69%1992 7.01% -0.85%1993 5.87% -1.14%1994 7.09% 1.22%1995 6.57% -0.52%1996 6.44% -0.13%1997 6.35% -0.09%1998 5.26% -1.09%1999 5.65% 0.39%2000 6.03% 0.38%2001 5.02% -1.01%2002 4.61% -0.41%2003 4.01% -0.60%2004 4.27% 0.26%2005 4.29% 0.02%2006 4.80% 0.51%2007 4.63% -0.17%2008 3.66% -0.97%2009 3.26% -0.40%
Sep-09 3.40%Sep-10 2.65% -0.75%
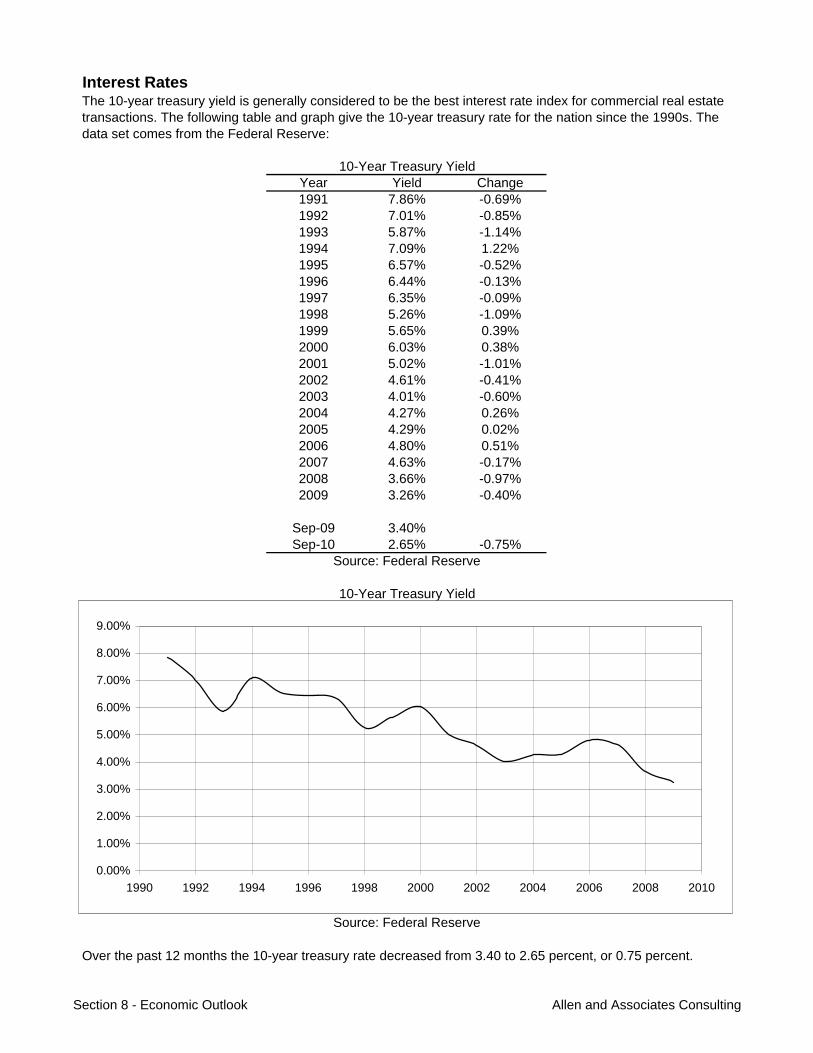
Over the past 12 months the 10-year treasury rate decreased from 3.40 to 2.65 percent, or 0.75 percent.
Source: Federal Reserve
10-Year Treasury Yield
The 10-year treasury yield is generally considered to be the best interest rate index for commercial real estate transactions. The following table and graph give the 10-year treasury rate for the nation since the 1990s. The data set comes from the Federal Reserve:
10-Year Treasury Yield
Source: Federal Reserve
0.00%
1.00%
2.00%
3.00%
4.00%
5.00%
6.00%
7.00%
8.00%
9.00%
1990 1992 1994 1996 1998 2000 2002 2004 2006 2008 2010
Section 8 - Economic Outlook Allen and Associates Consulting
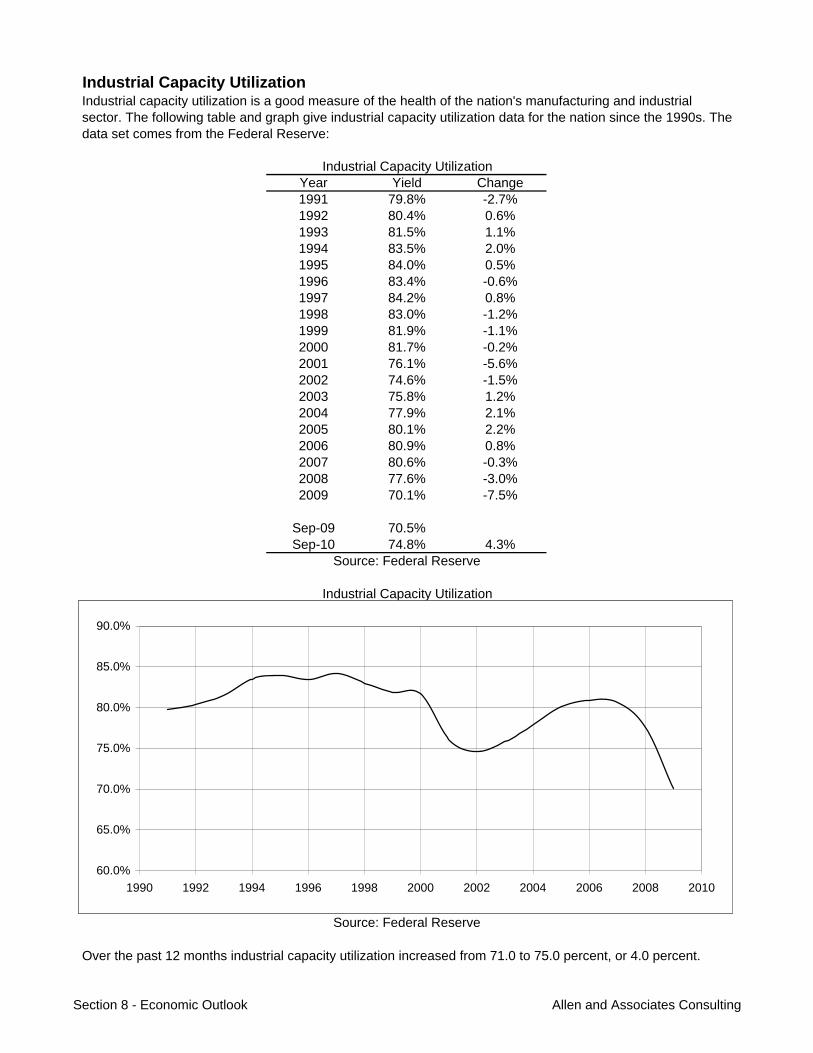
Industrial Capacity Utilization
Year Yield Change1991 79.8% -2.7%1992 80.4% 0.6%1993 81.5% 1.1%1994 83.5% 2.0%1995 84.0% 0.5%1996 83.4% -0.6%1997 84.2% 0.8%1998 83.0% -1.2%1999 81.9% -1.1%2000 81.7% -0.2%2001 76.1% -5.6%2002 74.6% -1.5%2003 75.8% 1.2%2004 77.9% 2.1%2005 80.1% 2.2%2006 80.9% 0.8%2007 80.6% -0.3%2008 77.6% -3.0%2009 70.1% -7.5%
Sep-09 70.5%Sep-10 74.8% 4.3%
Over the past 12 months industrial capacity utilization increased from 71.0 to 75.0 percent, or 4.0 percent.
Source: Federal Reserve
Industrial Capacity Utilization
Industrial capacity utilization is a good measure of the health of the nation's manufacturing and industrial sector. The following table and graph give industrial capacity utilization data for the nation since the 1990s. The data set comes from the Federal Reserve:
Industrial Capacity Utilization
Source: Federal Reserve
0.0%
10.0%
20.0%
30.0%
40.0%
50.0%
60.0%
70.0%
80.0%
90.0%
1990 1992 1994 1996 1998 2000 2002 2004 2006 2008 2010
60.0%
65.0%
70.0%
75.0%
80.0%
85.0%
90.0%
1990 1992 1994 1996 1998 2000 2002 2004 2006 2008 2010
Section 8 - Economic Outlook Allen and Associates Consulting
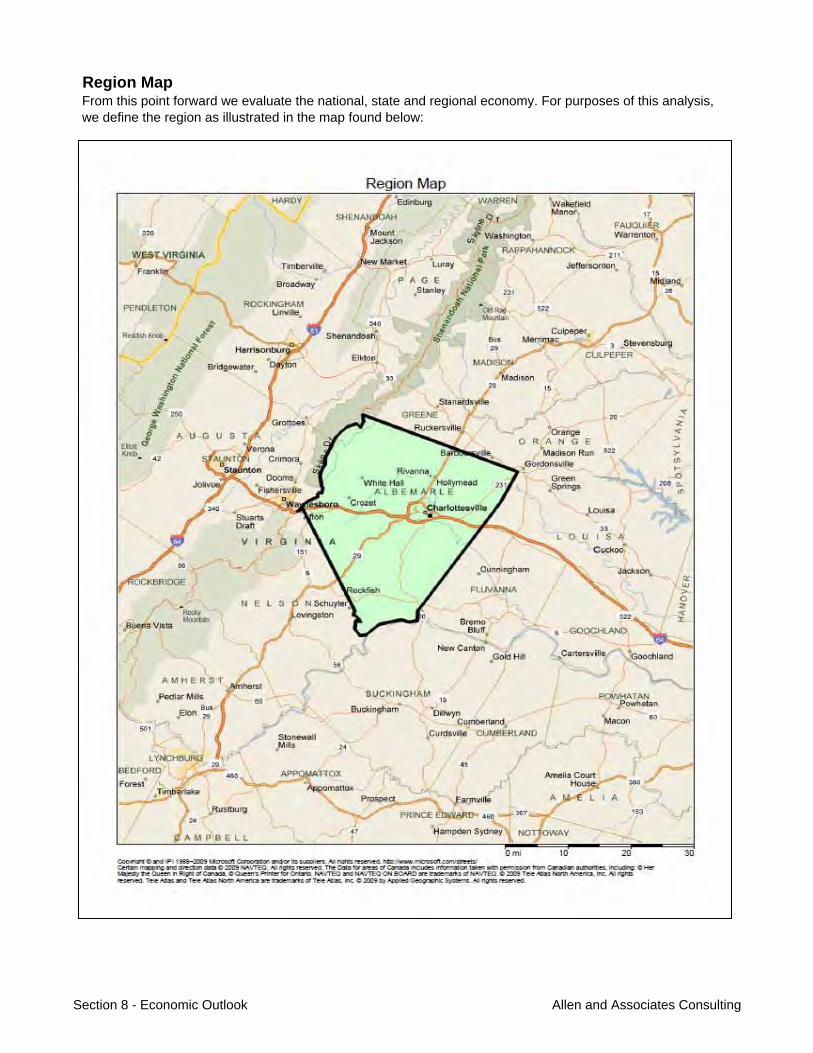
Region Map
Region Map.pdf
From this point forward we evaluate the national, state and regional economy. For purposes of this analysis, we define the region as illustrated in the map found below:
Section 8 - Economic Outlook Allen and Associates Consulting
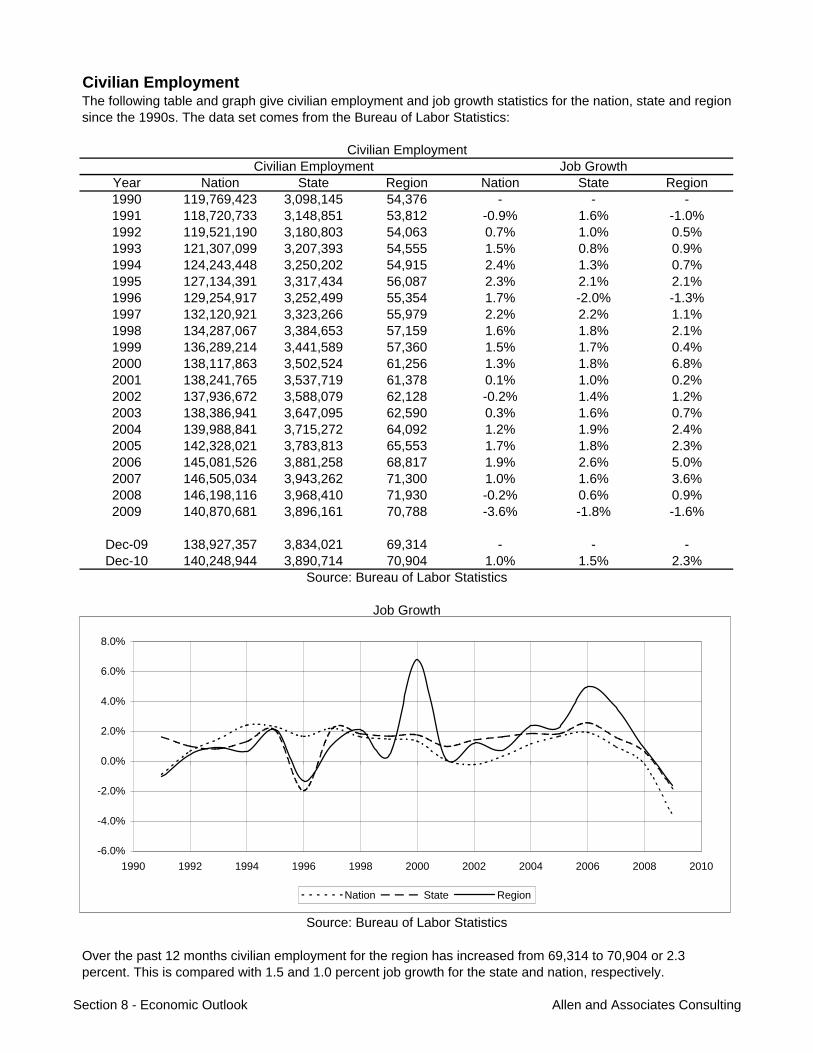
Civilian Employment
Year Nation State Region Nation State Region1990 119,769,423 3,098,145 54,376 - - -1991 118,720,733 3,148,851 53,812 -0.9% 1.6% -1.0%1992 119,521,190 3,180,803 54,063 0.7% 1.0% 0.5%1993 121,307,099 3,207,393 54,555 1.5% 0.8% 0.9%1994 124,243,448 3,250,202 54,915 2.4% 1.3% 0.7%1995 127,134,391 3,317,434 56,087 2.3% 2.1% 2.1%1996 129,254,917 3,252,499 55,354 1.7% -2.0% -1.3%1997 132,120,921 3,323,266 55,979 2.2% 2.2% 1.1%1998 134,287,067 3,384,653 57,159 1.6% 1.8% 2.1%1999 136,289,214 3,441,589 57,360 1.5% 1.7% 0.4%2000 138,117,863 3,502,524 61,256 1.3% 1.8% 6.8%2001 138,241,765 3,537,719 61,378 0.1% 1.0% 0.2%2002 137,936,672 3,588,079 62,128 -0.2% 1.4% 1.2%2003 138,386,941 3,647,095 62,590 0.3% 1.6% 0.7%2004 139,988,841 3,715,272 64,092 1.2% 1.9% 2.4%2005 142,328,021 3,783,813 65,553 1.7% 1.8% 2.3%2006 145,081,526 3,881,258 68,817 1.9% 2.6% 5.0%2007 146,505,034 3,943,262 71,300 1.0% 1.6% 3.6%2008 146,198,116 3,968,410 71,930 -0.2% 0.6% 0.9%2009 140,870,681 3,896,161 70,788 -3.6% -1.8% -1.6%
Dec-09 138,927,357 3,834,021 69,314 - - -Dec-10 140,248,944 3,890,714 70,904 1.0% 1.5% 2.3%
Over the past 12 months civilian employment for the region has increased from 69,314 to 70,904 or 2.3 percent. This is compared with 1.5 and 1.0 percent job growth for the state and nation, respectively.
Source: Bureau of Labor Statistics
The following table and graph give civilian employment and job growth statistics for the nation, state and region since the 1990s. The data set comes from the Bureau of Labor Statistics:
Job Growth
Civilian EmploymentCivilian Employment Job Growth
Source: Bureau of Labor Statistics
-6.0%
-4.0%
-2.0%
0.0%
2.0%
4.0%
6.0%
8.0%
1990 1992 1994 1996 1998 2000 2002 2004 2006 2008 2010
Nation State Region
Section 8 - Economic Outlook Allen and Associates Consulting
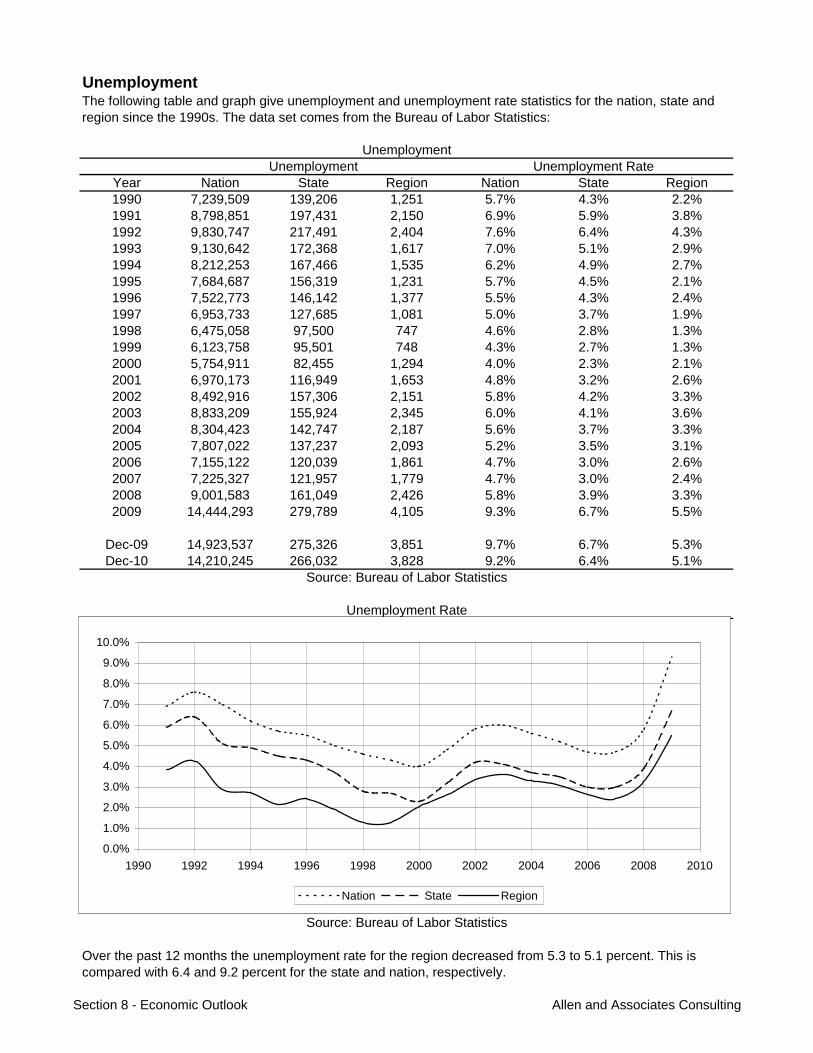
Unemployment
Year Nation State Region Nation State Region1990 7,239,509 139,206 1,251 5.7% 4.3% 2.2%1991 8,798,851 197,431 2,150 6.9% 5.9% 3.8%1992 9,830,747 217,491 2,404 7.6% 6.4% 4.3%1993 9,130,642 172,368 1,617 7.0% 5.1% 2.9%1994 8,212,253 167,466 1,535 6.2% 4.9% 2.7%1995 7,684,687 156,319 1,231 5.7% 4.5% 2.1%1996 7,522,773 146,142 1,377 5.5% 4.3% 2.4%1997 6,953,733 127,685 1,081 5.0% 3.7% 1.9%1998 6,475,058 97,500 747 4.6% 2.8% 1.3%1999 6,123,758 95,501 748 4.3% 2.7% 1.3%2000 5,754,911 82,455 1,294 4.0% 2.3% 2.1%2001 6,970,173 116,949 1,653 4.8% 3.2% 2.6%2002 8,492,916 157,306 2,151 5.8% 4.2% 3.3%2003 8,833,209 155,924 2,345 6.0% 4.1% 3.6%2004 8,304,423 142,747 2,187 5.6% 3.7% 3.3%2005 7,807,022 137,237 2,093 5.2% 3.5% 3.1%2006 7,155,122 120,039 1,861 4.7% 3.0% 2.6%2007 7,225,327 121,957 1,779 4.7% 3.0% 2.4%2008 9,001,583 161,049 2,426 5.8% 3.9% 3.3%2009 14,444,293 279,789 4,105 9.3% 6.7% 5.5%
Dec-09 14,923,537 275,326 3,851 9.7% 6.7% 5.3%Dec-10 14,210,245 266,032 3,828 9.2% 6.4% 5.1%
Over the past 12 months the unemployment rate for the region decreased from 5.3 to 5.1 percent. This is compared with 6.4 and 9.2 percent for the state and nation, respectively.
The following table and graph give unemployment and unemployment rate statistics for the nation, state and region since the 1990s. The data set comes from the Bureau of Labor Statistics:
Unemployment Rate
Source: Bureau of Labor Statistics
UnemploymentUnemployment Unemployment Rate
Source: Bureau of Labor Statistics
0.0%
1.0%
2.0%
3.0%
4.0%
5.0%
6.0%
7.0%
8.0%
9.0%
10.0%
1990 1992 1994 1996 1998 2000 2002 2004 2006 2008 2010
Nation State Region
Section 8 - Economic Outlook Allen and Associates Consulting
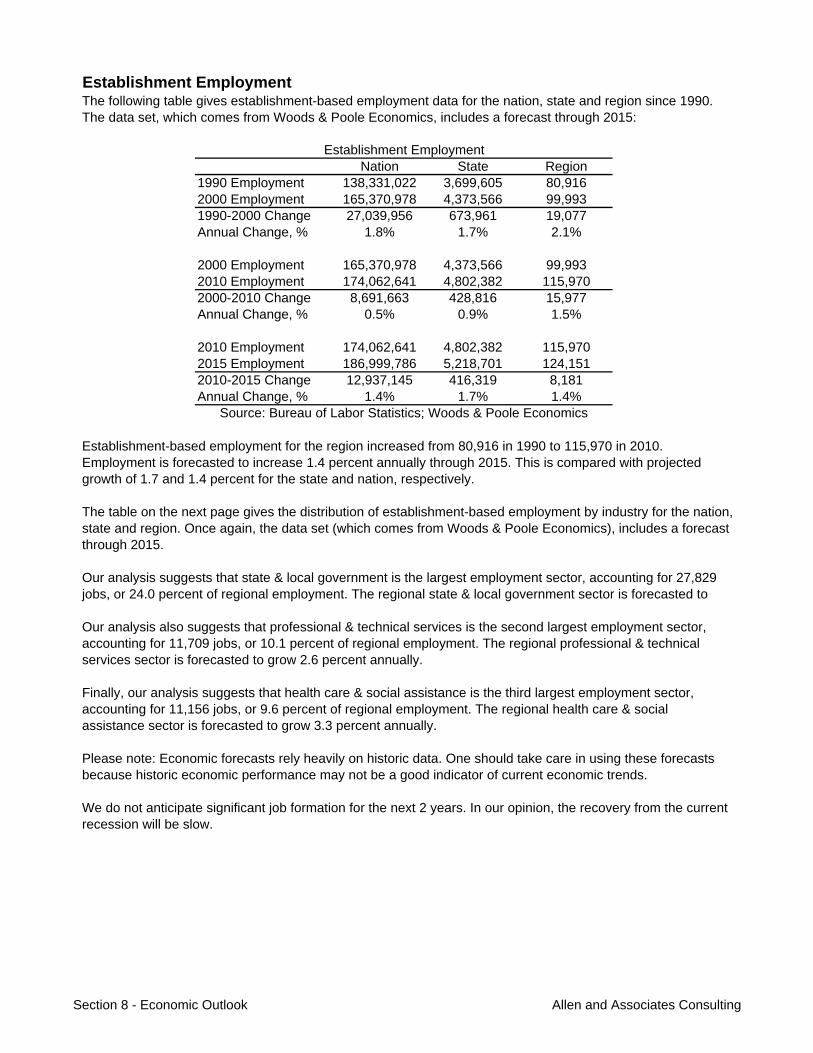
Establishment Employment
Nation State Region1990 Employment 138,331,022 3,699,605 80,9162000 Employment 165,370,978 4,373,566 99,9931990-2000 Change 27,039,956 673,961 19,077Annual Change, % 1.8% 1.7% 2.1%
2000 Employment 165,370,978 4,373,566 99,9932010 Employment 174,062,641 4,802,382 115,9702000-2010 Change 8,691,663 428,816 15,977Annual Change, % 0.5% 0.9% 1.5%
2010 Employment 174,062,641 4,802,382 115,9702015 Employment 186,999,786 5,218,701 124,1512010-2015 Change 12,937,145 416,319 8,181Annual Change, % 1.4% 1.7% 1.4%
We do not anticipate significant job formation for the next 2 years. In our opinion, the recovery from the current recession will be slow.
Please note: Economic forecasts rely heavily on historic data. One should take care in using these forecasts because historic economic performance may not be a good indicator of current economic trends.
Establishment Employment
Source: Bureau of Labor Statistics; Woods & Poole Economics
Our analysis also suggests that professional & technical services is the second largest employment sector, accounting for 11,709 jobs, or 10.1 percent of regional employment. The regional professional & technical services sector is forecasted to grow 2.6 percent annually.
Finally, our analysis suggests that health care & social assistance is the third largest employment sector, accounting for 11,156 jobs, or 9.6 percent of regional employment. The regional health care & social assistance sector is forecasted to grow 3.3 percent annually.
The following table gives establishment-based employment data for the nation, state and region since 1990. The data set, which comes from Woods & Poole Economics, includes a forecast through 2015:
Establishment-based employment for the region increased from 80,916 in 1990 to 115,970 in 2010. Employment is forecasted to increase 1.4 percent annually through 2015. This is compared with projected growth of 1.7 and 1.4 percent for the state and nation, respectively.
The table on the next page gives the distribution of establishment-based employment by industry for the nation, state and region. Once again, the data set (which comes from Woods & Poole Economics), includes a forecast through 2015.
Our analysis suggests that state & local government is the largest employment sector, accounting for 27,829 jobs, or 24.0 percent of regional employment. The regional state & local government sector is forecasted to
Section 8 - Economic Outlook Allen and Associates Consulting
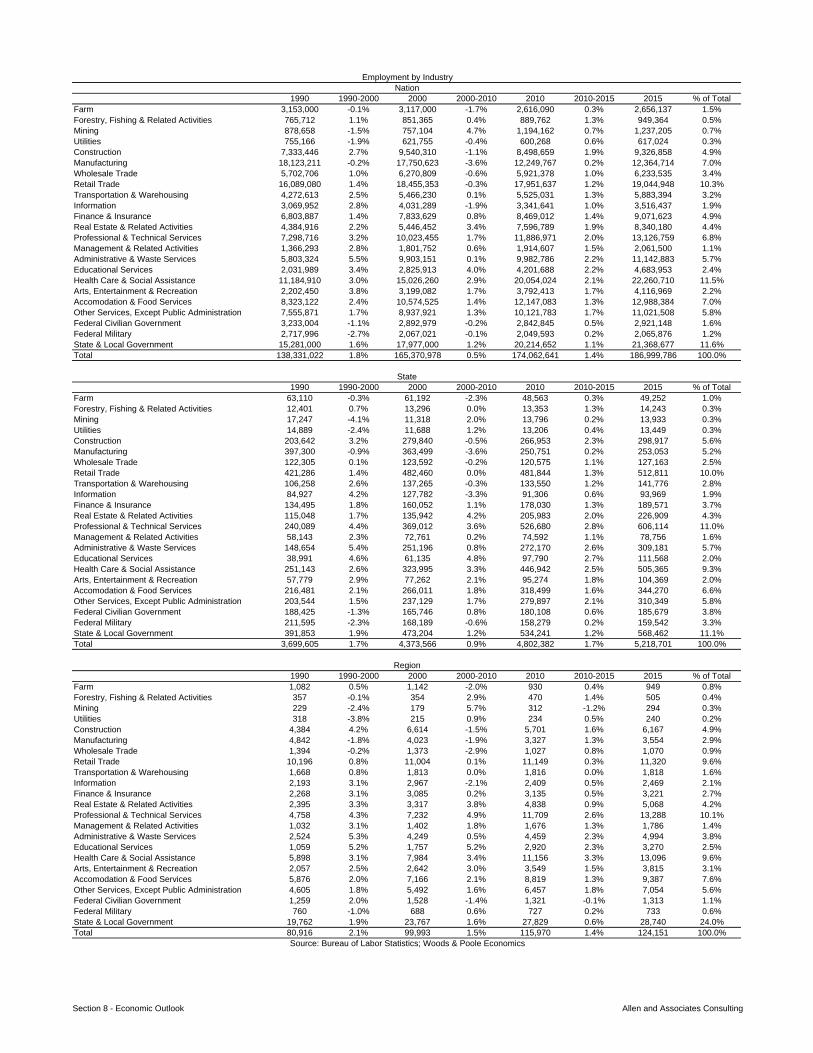
1990 1990-2000 2000 2000-2010 2010 2010-2015 2015 % of TotalFarm 3,153,000 -0.1% 3,117,000 -1.7% 2,616,090 0.3% 2,656,137 1.5%Forestry, Fishing & Related Activities 765,712 1.1% 851,365 0.4% 889,762 1.3% 949,364 0.5%Mining 878,658 -1.5% 757,104 4.7% 1,194,162 0.7% 1,237,205 0.7%Utilities 755,166 -1.9% 621,755 -0.4% 600,268 0.6% 617,024 0.3%Construction 7,333,446 2.7% 9,540,310 -1.1% 8,498,659 1.9% 9,326,858 4.9%Manufacturing 18,123,211 -0.2% 17,750,623 -3.6% 12,249,767 0.2% 12,364,714 7.0%Wholesale Trade 5,702,706 1.0% 6,270,809 -0.6% 5,921,378 1.0% 6,233,535 3.4%Retail Trade 16,089,080 1.4% 18,455,353 -0.3% 17,951,637 1.2% 19,044,948 10.3%Transportation & Warehousing 4,272,613 2.5% 5,466,230 0.1% 5,525,031 1.3% 5,883,394 3.2%Information 3,069,952 2.8% 4,031,289 -1.9% 3,341,641 1.0% 3,516,437 1.9%Finance & Insurance 6,803,887 1.4% 7,833,629 0.8% 8,469,012 1.4% 9,071,623 4.9%Real Estate & Related Activities 4,384,916 2.2% 5,446,452 3.4% 7,596,789 1.9% 8,340,180 4.4%Professional & Technical Services 7,298,716 3.2% 10,023,455 1.7% 11,886,971 2.0% 13,126,759 6.8%Management & Related Activities 1,366,293 2.8% 1,801,752 0.6% 1,914,607 1.5% 2,061,500 1.1%Administrative & Waste Services 5,803,324 5.5% 9,903,151 0.1% 9,982,786 2.2% 11,142,883 5.7%Educational Services 2,031,989 3.4% 2,825,913 4.0% 4,201,688 2.2% 4,683,953 2.4%Health Care & Social Assistance 11,184,910 3.0% 15,026,260 2.9% 20,054,024 2.1% 22,260,710 11.5%Arts, Entertainment & Recreation 2,202,450 3.8% 3,199,082 1.7% 3,792,413 1.7% 4,116,969 2.2%Accomodation & Food Services 8,323,122 2.4% 10,574,525 1.4% 12,147,083 1.3% 12,988,384 7.0%Other Services, Except Public Administration 7,555,871 1.7% 8,937,921 1.3% 10,121,783 1.7% 11,021,508 5.8%Federal Civilian Government 3,233,004 -1.1% 2,892,979 -0.2% 2,842,845 0.5% 2,921,148 1.6%Federal Military 2,717,996 -2.7% 2,067,021 -0.1% 2,049,593 0.2% 2,065,876 1.2%State & Local Government 15,281,000 1.6% 17,977,000 1.2% 20,214,652 1.1% 21,368,677 11.6%Total 138,331,022 1.8% 165,370,978 0.5% 174,062,641 1.4% 186,999,786 100.0%
1990 1990-2000 2000 2000-2010 2010 2010-2015 2015 % of TotalFarm 63,110 -0.3% 61,192 -2.3% 48,563 0.3% 49,252 1.0%Forestry, Fishing & Related Activities 12,401 0.7% 13,296 0.0% 13,353 1.3% 14,243 0.3%Mining 17,247 -4.1% 11,318 2.0% 13,796 0.2% 13,933 0.3%Utilities 14,889 -2.4% 11,688 1.2% 13,206 0.4% 13,449 0.3%Construction 203,642 3.2% 279,840 -0.5% 266,953 2.3% 298,917 5.6%Manufacturing 397,300 -0.9% 363,499 -3.6% 250,751 0.2% 253,053 5.2%Wholesale Trade 122,305 0.1% 123,592 -0.2% 120,575 1.1% 127,163 2.5%Retail Trade 421,286 1.4% 482,460 0.0% 481,844 1.3% 512,811 10.0%Transportation & Warehousing 106,258 2.6% 137,265 -0.3% 133,550 1.2% 141,776 2.8%Information 84,927 4.2% 127,782 -3.3% 91,306 0.6% 93,969 1.9%Finance & Insurance 134,495 1.8% 160,052 1.1% 178,030 1.3% 189,571 3.7%Real Estate & Related Activities 115,048 1.7% 135,942 4.2% 205,983 2.0% 226,909 4.3%Professional & Technical Services 240,089 4.4% 369,012 3.6% 526,680 2.8% 606,114 11.0%Management & Related Activities 58,143 2.3% 72,761 0.2% 74,592 1.1% 78,756 1.6%Administrative & Waste Services 148,654 5.4% 251,196 0.8% 272,170 2.6% 309,181 5.7%Educational Services 38,991 4.6% 61,135 4.8% 97,790 2.7% 111,568 2.0%Health Care & Social Assistance 251,143 2.6% 323,995 3.3% 446,942 2.5% 505,365 9.3%Arts, Entertainment & Recreation 57,779 2.9% 77,262 2.1% 95,274 1.8% 104,369 2.0%Accomodation & Food Services 216,481 2.1% 266,011 1.8% 318,499 1.6% 344,270 6.6%Other Services, Except Public Administration 203,544 1.5% 237,129 1.7% 279,897 2.1% 310,349 5.8%Federal Civilian Government 188,425 -1.3% 165,746 0.8% 180,108 0.6% 185,679 3.8%Federal Military 211,595 -2.3% 168,189 -0.6% 158,279 0.2% 159,542 3.3%State & Local Government 391,853 1.9% 473,204 1.2% 534,241 1.2% 568,462 11.1%Total 3,699,605 1.7% 4,373,566 0.9% 4,802,382 1.7% 5,218,701 100.0%
1990 1990-2000 2000 2000-2010 2010 2010-2015 2015 % of TotalFarm 1,082 0.5% 1,142 -2.0% 930 0.4% 949 0.8%Forestry, Fishing & Related Activities 357 -0.1% 354 2.9% 470 1.4% 505 0.4%Mining 229 -2.4% 179 5.7% 312 -1.2% 294 0.3%Utilities 318 -3.8% 215 0.9% 234 0.5% 240 0.2%Construction 4,384 4.2% 6,614 -1.5% 5,701 1.6% 6,167 4.9%Manufacturing 4,842 -1.8% 4,023 -1.9% 3,327 1.3% 3,554 2.9%Wholesale Trade 1,394 -0.2% 1,373 -2.9% 1,027 0.8% 1,070 0.9%Retail Trade 10,196 0.8% 11,004 0.1% 11,149 0.3% 11,320 9.6%Transportation & Warehousing 1,668 0.8% 1,813 0.0% 1,816 0.0% 1,818 1.6%Information 2,193 3.1% 2,967 -2.1% 2,409 0.5% 2,469 2.1%Finance & Insurance 2,268 3.1% 3,085 0.2% 3,135 0.5% 3,221 2.7%Real Estate & Related Activities 2,395 3.3% 3,317 3.8% 4,838 0.9% 5,068 4.2%Professional & Technical Services 4,758 4.3% 7,232 4.9% 11,709 2.6% 13,288 10.1%Management & Related Activities 1,032 3.1% 1,402 1.8% 1,676 1.3% 1,786 1.4%Administrative & Waste Services 2,524 5.3% 4,249 0.5% 4,459 2.3% 4,994 3.8%Educational Services 1,059 5.2% 1,757 5.2% 2,920 2.3% 3,270 2.5%Health Care & Social Assistance 5,898 3.1% 7,984 3.4% 11,156 3.3% 13,096 9.6%Arts, Entertainment & Recreation 2,057 2.5% 2,642 3.0% 3,549 1.5% 3,815 3.1%Accomodation & Food Services 5,876 2.0% 7,166 2.1% 8,819 1.3% 9,387 7.6%Other Services, Except Public Administration 4,605 1.8% 5,492 1.6% 6,457 1.8% 7,054 5.6%Federal Civilian Government 1,259 2.0% 1,528 -1.4% 1,321 -0.1% 1,313 1.1%Federal Military 760 -1.0% 688 0.6% 727 0.2% 733 0.6%State & Local Government 19,762 1.9% 23,767 1.6% 27,829 0.6% 28,740 24.0%Total 80,916 2.1% 99,993 1.5% 115,970 1.4% 124,151 100.0%
Region
Source: Bureau of Labor Statistics; Woods & Poole Economics
Employment by Industry
State
Nation
Section 8 - Economic Outlook Allen and Associates Consulting
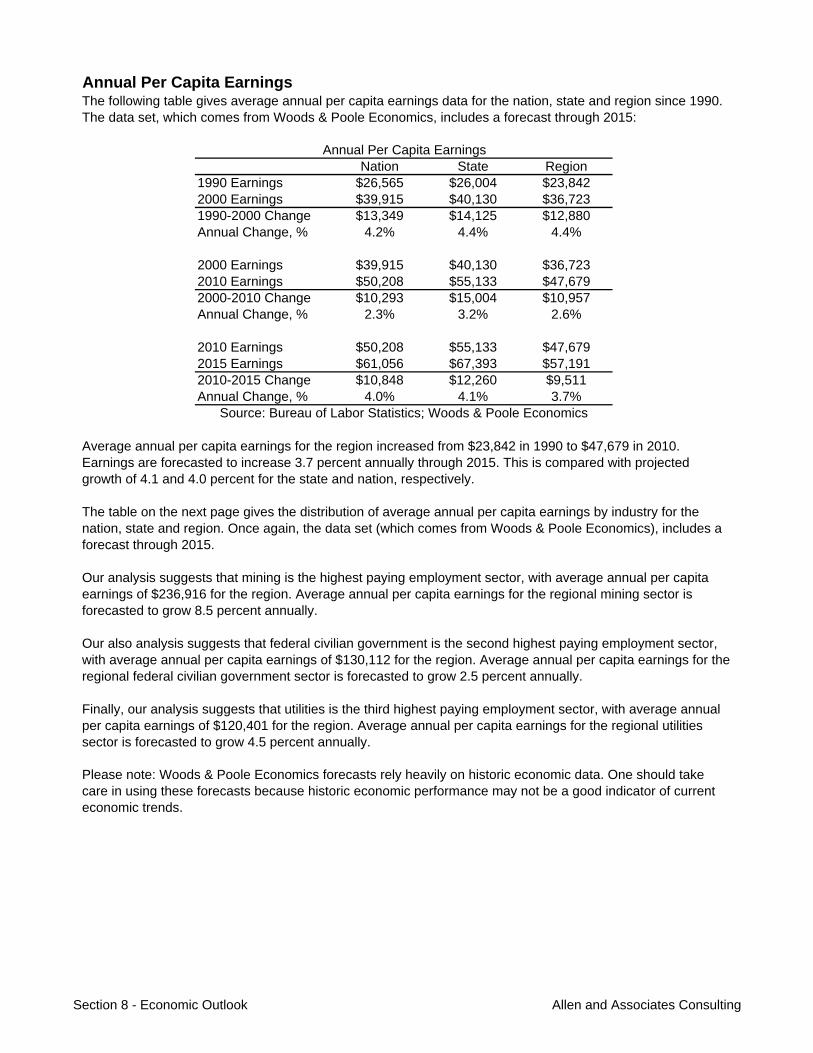
Annual Per Capita Earnings
Nation State Region1990 Earnings $26,565 $26,004 $23,8422000 Earnings $39,915 $40,130 $36,7231990-2000 Change $13,349 $14,125 $12,880Annual Change, % 4.2% 4.4% 4.4%
2000 Earnings $39,915 $40,130 $36,7232010 Earnings $50,208 $55,133 $47,6792000-2010 Change $10,293 $15,004 $10,957Annual Change, % 2.3% 3.2% 2.6%
2010 Earnings $50,208 $55,133 $47,6792015 Earnings $61,056 $67,393 $57,1912010-2015 Change $10,848 $12,260 $9,511Annual Change, % 4.0% 4.1% 3.7%
The following table gives average annual per capita earnings data for the nation, state and region since 1990. The data set, which comes from Woods & Poole Economics, includes a forecast through 2015:
Annual Per Capita Earnings
Source: Bureau of Labor Statistics; Woods & Poole Economics
Average annual per capita earnings for the region increased from $23,842 in 1990 to $47,679 in 2010. Earnings are forecasted to increase 3.7 percent annually through 2015. This is compared with projected growth of 4.1 and 4.0 percent for the state and nation, respectively.
Please note: Woods & Poole Economics forecasts rely heavily on historic economic data. One should take care in using these forecasts because historic economic performance may not be a good indicator of current economic trends.
The table on the next page gives the distribution of average annual per capita earnings by industry for the nation, state and region. Once again, the data set (which comes from Woods & Poole Economics), includes a forecast through 2015.
Our analysis suggests that mining is the highest paying employment sector, with average annual per capita earnings of $236,916 for the region. Average annual per capita earnings for the regional mining sector is forecasted to grow 8.5 percent annually.
Our also analysis suggests that federal civilian government is the second highest paying employment sector, with average annual per capita earnings of $130,112 for the region. Average annual per capita earnings for the regional federal civilian government sector is forecasted to grow 2.5 percent annually.
Finally, our analysis suggests that utilities is the third highest paying employment sector, with average annual per capita earnings of $120,401 for the region. Average annual per capita earnings for the regional utilities sector is forecasted to grow 4.5 percent annually.
Section 8 - Economic Outlook Allen and Associates Consulting
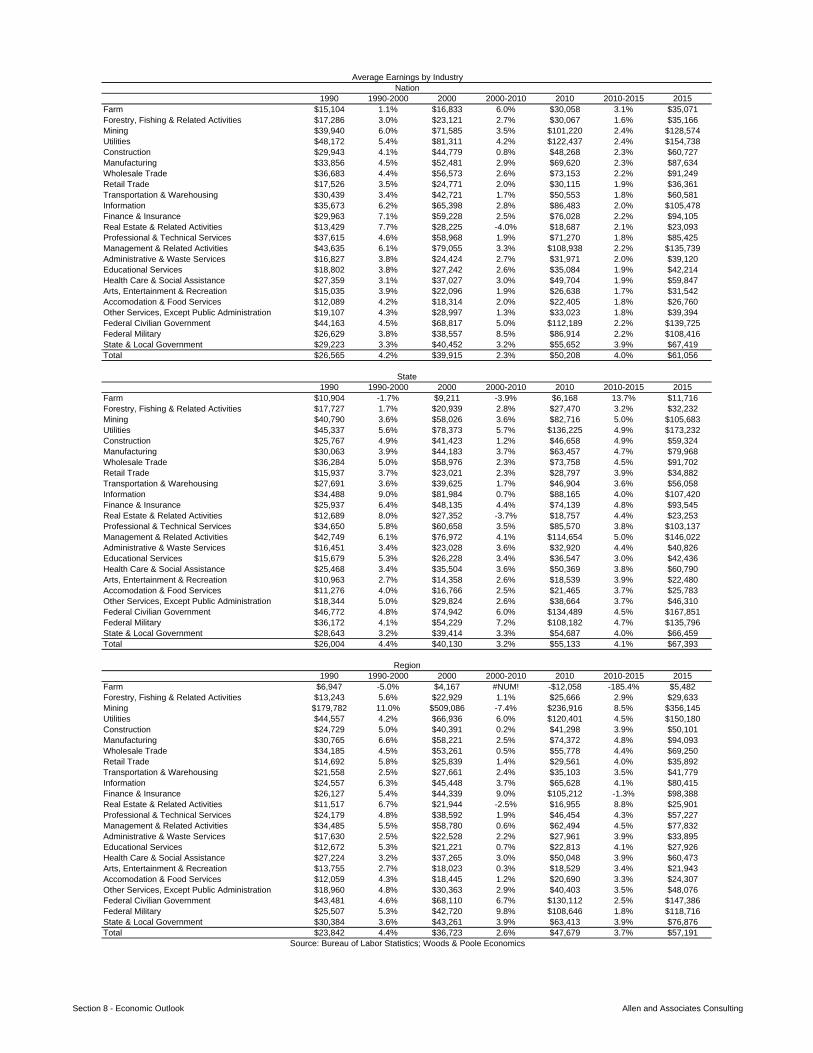
1990 1990-2000 2000 2000-2010 2010 2010-2015 2015Farm $15,104 1.1% $16,833 6.0% $30,058 3.1% $35,071Forestry, Fishing & Related Activities $17,286 3.0% $23,121 2.7% $30,067 1.6% $35,166Mining $39,940 6.0% $71,585 3.5% $101,220 2.4% $128,574Utilities $48,172 5.4% $81,311 4.2% $122,437 2.4% $154,738Construction $29,943 4.1% $44,779 0.8% $48,268 2.3% $60,727Manufacturing $33,856 4.5% $52,481 2.9% $69,620 2.3% $87,634Wholesale Trade $36,683 4.4% $56,573 2.6% $73,153 2.2% $91,249Retail Trade $17,526 3.5% $24,771 2.0% $30,115 1.9% $36,361Transportation & Warehousing $30,439 3.4% $42,721 1.7% $50,553 1.8% $60,581Information $35,673 6.2% $65,398 2.8% $86,483 2.0% $105,478Finance & Insurance $29,963 7.1% $59,228 2.5% $76,028 2.2% $94,105Real Estate & Related Activities $13,429 7.7% $28,225 -4.0% $18,687 2.1% $23,093Professional & Technical Services $37,615 4.6% $58,968 1.9% $71,270 1.8% $85,425Management & Related Activities $43,635 6.1% $79,055 3.3% $108,938 2.2% $135,739Administrative & Waste Services $16,827 3.8% $24,424 2.7% $31,971 2.0% $39,120Educational Services $18,802 3.8% $27,242 2.6% $35,084 1.9% $42,214Health Care & Social Assistance $27,359 3.1% $37,027 3.0% $49,704 1.9% $59,847Arts, Entertainment & Recreation $15,035 3.9% $22,096 1.9% $26,638 1.7% $31,542Accomodation & Food Services $12,089 4.2% $18,314 2.0% $22,405 1.8% $26,760Other Services, Except Public Administration $19,107 4.3% $28,997 1.3% $33,023 1.8% $39,394Federal Civilian Government $44,163 4.5% $68,817 5.0% $112,189 2.2% $139,725Federal Military $26,629 3.8% $38,557 8.5% $86,914 2.2% $108,416State & Local Government $29,223 3.3% $40,452 3.2% $55,652 3.9% $67,419Total $26,565 4.2% $39,915 2.3% $50,208 4.0% $61,056
1990 1990-2000 2000 2000-2010 2010 2010-2015 2015Farm $10,904 -1.7% $9,211 -3.9% $6,168 13.7% $11,716Forestry, Fishing & Related Activities $17,727 1.7% $20,939 2.8% $27,470 3.2% $32,232Mining $40,790 3.6% $58,026 3.6% $82,716 5.0% $105,683Utilities $45,337 5.6% $78,373 5.7% $136,225 4.9% $173,232Construction $25,767 4.9% $41,423 1.2% $46,658 4.9% $59,324Manufacturing $30,063 3.9% $44,183 3.7% $63,457 4.7% $79,968Wholesale Trade $36,284 5.0% $58,976 2.3% $73,758 4.5% $91,702Retail Trade $15,937 3.7% $23,021 2.3% $28,797 3.9% $34,882Transportation & Warehousing $27,691 3.6% $39,625 1.7% $46,904 3.6% $56,058Information $34,488 9.0% $81,984 0.7% $88,165 4.0% $107,420Finance & Insurance $25,937 6.4% $48,135 4.4% $74,139 4.8% $93,545Real Estate & Related Activities $12,689 8.0% $27,352 -3.7% $18,757 4.4% $23,253Professional & Technical Services $34,650 5.8% $60,658 3.5% $85,570 3.8% $103,137Management & Related Activities $42,749 6.1% $76,972 4.1% $114,654 5.0% $146,022Administrative & Waste Services $16,451 3.4% $23,028 3.6% $32,920 4.4% $40,826Educational Services $15,679 5.3% $26,228 3.4% $36,547 3.0% $42,436Health Care & Social Assistance $25,468 3.4% $35,504 3.6% $50,369 3.8% $60,790Arts, Entertainment & Recreation $10,963 2.7% $14,358 2.6% $18,539 3.9% $22,480Accomodation & Food Services $11,276 4.0% $16,766 2.5% $21,465 3.7% $25,783Other Services, Except Public Administration $18,344 5.0% $29,824 2.6% $38,664 3.7% $46,310Federal Civilian Government $46,772 4.8% $74,942 6.0% $134,489 4.5% $167,851Federal Military $36,172 4.1% $54,229 7.2% $108,182 4.7% $135,796State & Local Government $28,643 3.2% $39,414 3.3% $54,687 4.0% $66,459Total $26,004 4.4% $40,130 3.2% $55,133 4.1% $67,393
1990 1990-2000 2000 2000-2010 2010 2010-2015 2015Farm $6,947 -5.0% $4,167 #NUM! -$12,058 -185.4% $5,482Forestry, Fishing & Related Activities $13,243 5.6% $22,929 1.1% $25,666 2.9% $29,633Mining $179,782 11.0% $509,086 -7.4% $236,916 8.5% $356,145Utilities $44,557 4.2% $66,936 6.0% $120,401 4.5% $150,180Construction $24,729 5.0% $40,391 0.2% $41,298 3.9% $50,101Manufacturing $30,765 6.6% $58,221 2.5% $74,372 4.8% $94,093Wholesale Trade $34,185 4.5% $53,261 0.5% $55,778 4.4% $69,250Retail Trade $14,692 5.8% $25,839 1.4% $29,561 4.0% $35,892Transportation & Warehousing $21,558 2.5% $27,661 2.4% $35,103 3.5% $41,779Information $24,557 6.3% $45,448 3.7% $65,628 4.1% $80,415Finance & Insurance $26,127 5.4% $44,339 9.0% $105,212 -1.3% $98,388Real Estate & Related Activities $11,517 6.7% $21,944 -2.5% $16,955 8.8% $25,901Professional & Technical Services $24,179 4.8% $38,592 1.9% $46,454 4.3% $57,227Management & Related Activities $34,485 5.5% $58,780 0.6% $62,494 4.5% $77,832Administrative & Waste Services $17,630 2.5% $22,528 2.2% $27,961 3.9% $33,895Educational Services $12,672 5.3% $21,221 0.7% $22,813 4.1% $27,926Health Care & Social Assistance $27,224 3.2% $37,265 3.0% $50,048 3.9% $60,473Arts, Entertainment & Recreation $13,755 2.7% $18,023 0.3% $18,529 3.4% $21,943Accomodation & Food Services $12,059 4.3% $18,445 1.2% $20,690 3.3% $24,307Other Services, Except Public Administration $18,960 4.8% $30,363 2.9% $40,403 3.5% $48,076Federal Civilian Government $43,481 4.6% $68,110 6.7% $130,112 2.5% $147,386Federal Military $25,507 5.3% $42,720 9.8% $108,646 1.8% $118,716State & Local Government $30,384 3.6% $43,261 3.9% $63,413 3.9% $76,876Total $23,842 4.4% $36,723 2.6% $47,679 3.7% $57,191
Region
Source: Bureau of Labor Statistics; Woods & Poole Economics
Average Earnings by Industry
State
Nation
Section 8 - Economic Outlook Allen and Associates Consulting
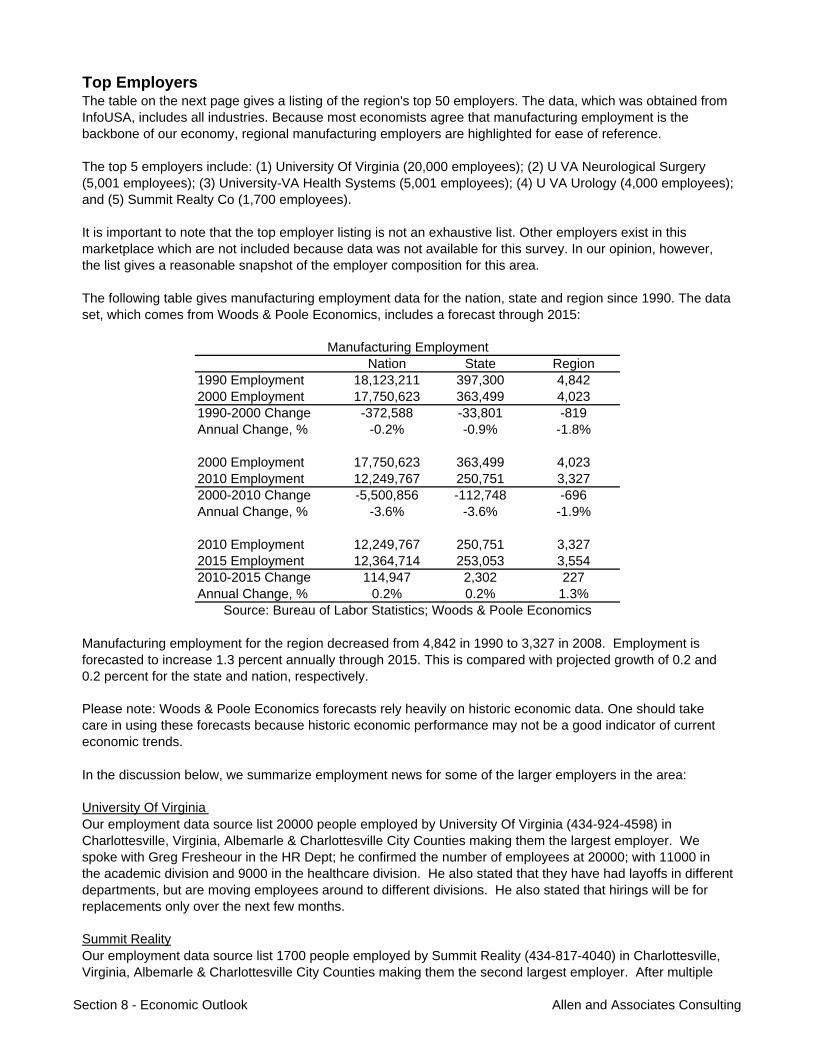
Top Employers
Nation State Region1990 Employment 18,123,211 397,300 4,8422000 Employment 17,750,623 363,499 4,0231990-2000 Change -372,588 -33,801 -819Annual Change, % -0.2% -0.9% -1.8%
2000 Employment 17,750,623 363,499 4,0232010 Employment 12,249,767 250,751 3,3272000-2010 Change -5,500,856 -112,748 -696Annual Change, % -3.6% -3.6% -1.9%
2010 Employment 12,249,767 250,751 3,3272015 Employment 12,364,714 253,053 3,5542010-2015 Change 114,947 2,302 227Annual Change, % 0.2% 0.2% 1.3%
University Of Virginia
Summit RealityOur employment data source list 1700 people employed by Summit Reality (434-817-4040) in Charlottesville, Virginia, Albemarle & Charlottesville City Counties making them the second largest employer. After multiple
Please note: Woods & Poole Economics forecasts rely heavily on historic economic data. One should take care in using these forecasts because historic economic performance may not be a good indicator of current economic trends.
The following table gives manufacturing employment data for the nation, state and region since 1990. The data set, which comes from Woods & Poole Economics, includes a forecast through 2015:
Manufacturing employment for the region decreased from 4,842 in 1990 to 3,327 in 2008. Employment is forecasted to increase 1.3 percent annually through 2015. This is compared with projected growth of 0.2 and 0.2 percent for the state and nation, respectively.
Manufacturing Employment
Source: Bureau of Labor Statistics; Woods & Poole Economics
Our employment data source list 20000 people employed by University Of Virginia (434-924-4598) in Charlottesville, Virginia, Albemarle & Charlottesville City Counties making them the largest employer. We spoke with Greg Fresheour in the HR Dept; he confirmed the number of employees at 20000; with 11000 in the academic division and 9000 in the healthcare division. He also stated that they have had layoffs in different departments, but are moving employees around to different divisions. He also stated that hirings will be for replacements only over the next few months.
In the discussion below, we summarize employment news for some of the larger employers in the area:
It is important to note that the top employer listing is not an exhaustive list. Other employers exist in this marketplace which are not included because data was not available for this survey. In our opinion, however, the list gives a reasonable snapshot of the employer composition for this area.
The table on the next page gives a listing of the region's top 50 employers. The data, which was obtained from InfoUSA, includes all industries. Because most economists agree that manufacturing employment is the backbone of our economy, regional manufacturing employers are highlighted for ease of reference.
The top 5 employers include: (1) University Of Virginia (20,000 employees); (2) U VA Neurological Surgery (5,001 employees); (3) University-VA Health Systems (5,001 employees); (4) U VA Urology (4,000 employees);and (5) Summit Realty Co (1,700 employees).
Section 8 - Economic Outlook Allen and Associates Consulting
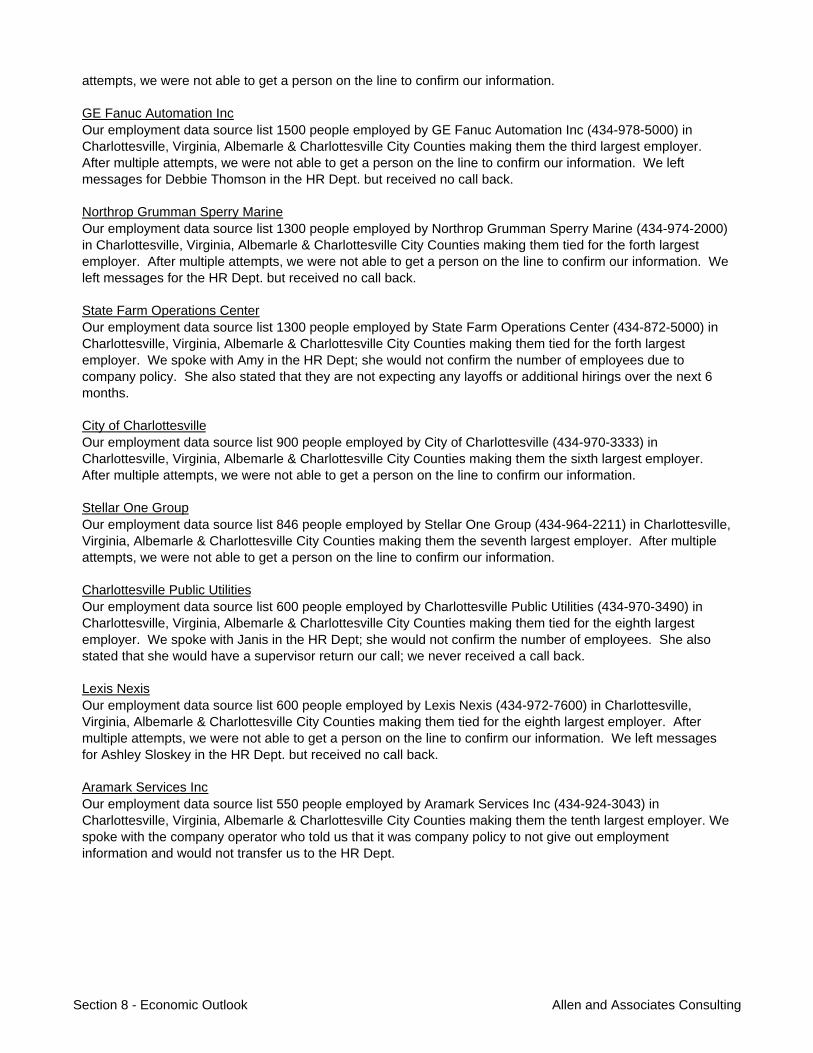
GE Fanuc Automation Inc
Northrop Grumman Sperry Marine
State Farm Operations Center
City of Charlottesville
Stellar One Group
Charlottesville Public Utilities
Lexis Nexis
Aramark Services Inc
attempts, we were not able to get a person on the line to confirm our information.
Our employment data source list 1500 people employed by GE Fanuc Automation Inc (434-978-5000) in Charlottesville, Virginia, Albemarle & Charlottesville City Counties making them the third largest employer. After multiple attempts, we were not able to get a person on the line to confirm our information. We left messages for Debbie Thomson in the HR Dept. but received no call back.
Our employment data source list 1300 people employed by Northrop Grumman Sperry Marine (434-974-2000) in Charlottesville, Virginia, Albemarle & Charlottesville City Counties making them tied for the forth largest employer. After multiple attempts, we were not able to get a person on the line to confirm our information. We left messages for the HR Dept. but received no call back.
Our employment data source list 550 people employed by Aramark Services Inc (434-924-3043) in Charlottesville, Virginia, Albemarle & Charlottesville City Counties making them the tenth largest employer. We spoke with the company operator who told us that it was company policy to not give out employment information and would not transfer us to the HR Dept.
Our employment data source list 900 people employed by City of Charlottesville (434-970-3333) in Charlottesville, Virginia, Albemarle & Charlottesville City Counties making them the sixth largest employer. After multiple attempts, we were not able to get a person on the line to confirm our information.
Our employment data source list 846 people employed by Stellar One Group (434-964-2211) in Charlottesville, Virginia, Albemarle & Charlottesville City Counties making them the seventh largest employer. After multiple attempts, we were not able to get a person on the line to confirm our information.
Our employment data source list 600 people employed by Charlottesville Public Utilities (434-970-3490) in Charlottesville, Virginia, Albemarle & Charlottesville City Counties making them tied for the eighth largest employer. We spoke with Janis in the HR Dept; she would not confirm the number of employees. She also stated that she would have a supervisor return our call; we never received a call back.
Our employment data source list 600 people employed by Lexis Nexis (434-972-7600) in Charlottesville, Virginia, Albemarle & Charlottesville City Counties making them tied for the eighth largest employer. After multiple attempts, we were not able to get a person on the line to confirm our information. We left messages for Ashley Sloskey in the HR Dept. but received no call back.
Our employment data source list 1300 people employed by State Farm Operations Center (434-872-5000) in Charlottesville, Virginia, Albemarle & Charlottesville City Counties making them tied for the forth largest employer. We spoke with Amy in the HR Dept; she would not confirm the number of employees due to company policy. She also stated that they are not expecting any layoffs or additional hirings over the next 6 months.
Section 8 - Economic Outlook Allen and Associates Consulting

The following map shows the location of the top employers in this region:
Top Employers.pdf
Section 8 - Economic Outlook Allen and Associates Consulting
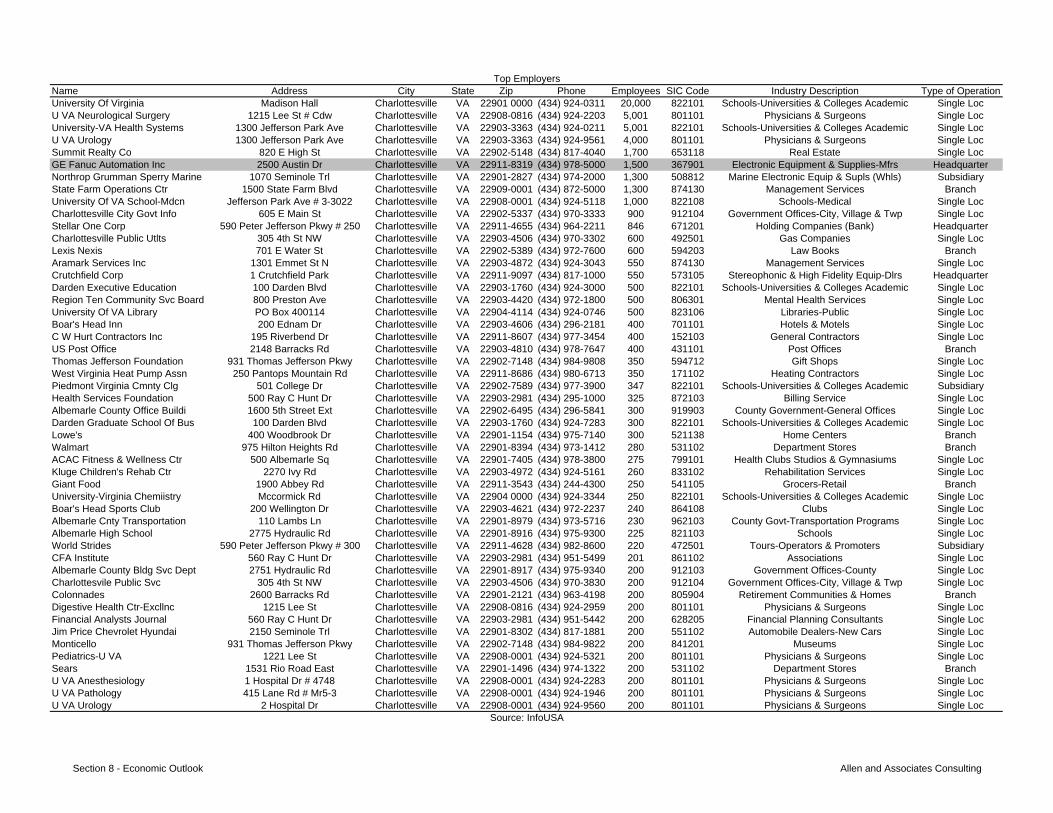
Name Address City State Zip Phone Employees SIC Code Industry Description Type of OperationUniversity Of Virginia Madison Hall Charlottesville VA 22901 0000 (434) 924-0311 20,000 822101 Schools-Universities & Colleges Academic Single LocU VA Neurological Surgery 1215 Lee St # Cdw Charlottesville VA 22908-0816 (434) 924-2203 5,001 801101 Physicians & Surgeons Single LocUniversity-VA Health Systems 1300 Jefferson Park Ave Charlottesville VA 22903-3363 (434) 924-0211 5,001 822101 Schools-Universities & Colleges Academic Single LocU VA Urology 1300 Jefferson Park Ave Charlottesville VA 22903-3363 (434) 924-9561 4,000 801101 Physicians & Surgeons Single LocSummit Realty Co 820 E High St Charlottesville VA 22902-5148 (434) 817-4040 1,700 653118 Real Estate Single LocGE Fanuc Automation Inc 2500 Austin Dr Charlottesville VA 22911-8319 (434) 978-5000 1,500 367901 Electronic Equipment & Supplies-Mfrs HeadquarterNorthrop Grumman Sperry Marine 1070 Seminole Trl Charlottesville VA 22901-2827 (434) 974-2000 1,300 508812 Marine Electronic Equip & Supls (Whls) SubsidiaryState Farm Operations Ctr 1500 State Farm Blvd Charlottesville VA 22909-0001 (434) 872-5000 1,300 874130 Management Services BranchUniversity Of VA School-Mdcn Jefferson Park Ave # 3-3022 Charlottesville VA 22908-0001 (434) 924-5118 1,000 822108 Schools-Medical Single LocCharlottesville City Govt Info 605 E Main St Charlottesville VA 22902-5337 (434) 970-3333 900 912104 Government Offices-City, Village & Twp Single LocStellar One Corp 590 Peter Jefferson Pkwy # 250 Charlottesville VA 22911-4655 (434) 964-2211 846 671201 Holding Companies (Bank) HeadquarterCharlottesville Public Utlts 305 4th St NW Charlottesville VA 22903-4506 (434) 970-3302 600 492501 Gas Companies Single LocLexis Nexis 701 E Water St Charlottesville VA 22902-5389 (434) 972-7600 600 594203 Law Books BranchAramark Services Inc 1301 Emmet St N Charlottesville VA 22903-4872 (434) 924-3043 550 874130 Management Services Single LocCrutchfield Corp 1 Crutchfield Park Charlottesville VA 22911-9097 (434) 817-1000 550 573105 Stereophonic & High Fidelity Equip-Dlrs HeadquarterDarden Executive Education 100 Darden Blvd Charlottesville VA 22903-1760 (434) 924-3000 500 822101 Schools-Universities & Colleges Academic Single LocRegion Ten Community Svc Board 800 Preston Ave Charlottesville VA 22903-4420 (434) 972-1800 500 806301 Mental Health Services Single LocUniversity Of VA Library PO Box 400114 Charlottesville VA 22904-4114 (434) 924-0746 500 823106 Libraries-Public Single LocBoar's Head Inn 200 Ednam Dr Charlottesville VA 22903-4606 (434) 296-2181 400 701101 Hotels & Motels Single LocC W Hurt Contractors Inc 195 Riverbend Dr Charlottesville VA 22911-8607 (434) 977-3454 400 152103 General Contractors Single LocUS Post Office 2148 Barracks Rd Charlottesville VA 22903-4810 (434) 978-7647 400 431101 Post Offices BranchThomas Jefferson Foundation 931 Thomas Jefferson Pkwy Charlottesville VA 22902-7148 (434) 984-9808 350 594712 Gift Shops Single LocWest Virginia Heat Pump Assn 250 Pantops Mountain Rd Charlottesville VA 22911-8686 (434) 980-6713 350 171102 Heating Contractors Single LocPiedmont Virginia Cmnty Clg 501 College Dr Charlottesville VA 22902-7589 (434) 977-3900 347 822101 Schools-Universities & Colleges Academic SubsidiaryHealth Services Foundation 500 Ray C Hunt Dr Charlottesville VA 22903-2981 (434) 295-1000 325 872103 Billing Service Single LocAlbemarle County Office Buildi 1600 5th Street Ext Charlottesville VA 22902-6495 (434) 296-5841 300 919903 County Government-General Offices Single LocDarden Graduate School Of Bus 100 Darden Blvd Charlottesville VA 22903-1760 (434) 924-7283 300 822101 Schools-Universities & Colleges Academic Single LocLowe's 400 Woodbrook Dr Charlottesville VA 22901-1154 (434) 975-7140 300 521138 Home Centers BranchWalmart 975 Hilton Heights Rd Charlottesville VA 22901-8394 (434) 973-1412 280 531102 Department Stores BranchACAC Fitness & Wellness Ctr 500 Albemarle Sq Charlottesville VA 22901-7405 (434) 978-3800 275 799101 Health Clubs Studios & Gymnasiums Single LocKluge Children's Rehab Ctr 2270 Ivy Rd Charlottesville VA 22903-4972 (434) 924-5161 260 833102 Rehabilitation Services Single LocGiant Food 1900 Abbey Rd Charlottesville VA 22911-3543 (434) 244-4300 250 541105 Grocers-Retail BranchUniversity-Virginia Chemiistry Mccormick Rd Charlottesville VA 22904 0000 (434) 924-3344 250 822101 Schools-Universities & Colleges Academic Single LocBoar's Head Sports Club 200 Wellington Dr Charlottesville VA 22903-4621 (434) 972-2237 240 864108 Clubs Single LocAlbemarle Cnty Transportation 110 Lambs Ln Charlottesville VA 22901-8979 (434) 973-5716 230 962103 County Govt-Transportation Programs Single LocAlbemarle High School 2775 Hydraulic Rd Charlottesville VA 22901-8916 (434) 975-9300 225 821103 Schools Single LocWorld Strides 590 Peter Jefferson Pkwy # 300 Charlottesville VA 22911-4628 (434) 982-8600 220 472501 Tours-Operators & Promoters SubsidiaryCFA Institute 560 Ray C Hunt Dr Charlottesville VA 22903-2981 (434) 951-5499 201 861102 Associations Single LocAlbemarle County Bldg Svc Dept 2751 Hydraulic Rd Charlottesville VA 22901-8917 (434) 975-9340 200 912103 Government Offices-County Single LocCharlottesvile Public Svc 305 4th St NW Charlottesville VA 22903-4506 (434) 970-3830 200 912104 Government Offices-City, Village & Twp Single LocColonnades 2600 Barracks Rd Charlottesville VA 22901-2121 (434) 963-4198 200 805904 Retirement Communities & Homes BranchDigestive Health Ctr-Excllnc 1215 Lee St Charlottesville VA 22908-0816 (434) 924-2959 200 801101 Physicians & Surgeons Single LocFinancial Analysts Journal 560 Ray C Hunt Dr Charlottesville VA 22903-2981 (434) 951-5442 200 628205 Financial Planning Consultants Single LocJim Price Chevrolet Hyundai 2150 Seminole Trl Charlottesville VA 22901-8302 (434) 817-1881 200 551102 Automobile Dealers-New Cars Single LocMonticello 931 Thomas Jefferson Pkwy Charlottesville VA 22902-7148 (434) 984-9822 200 841201 Museums Single LocPediatrics-U VA 1221 Lee St Charlottesville VA 22908-0001 (434) 924-5321 200 801101 Physicians & Surgeons Single LocSears 1531 Rio Road East Charlottesville VA 22901-1496 (434) 974-1322 200 531102 Department Stores BranchU VA Anesthesiology 1 Hospital Dr # 4748 Charlottesville VA 22908-0001 (434) 924-2283 200 801101 Physicians & Surgeons Single LocU VA Pathology 415 Lane Rd # Mr5-3 Charlottesville VA 22908-0001 (434) 924-1946 200 801101 Physicians & Surgeons Single LocU VA Urology 2 Hospital Dr Charlottesville VA 22908-0001 (434) 924-9560 200 801101 Physicians & Surgeons Single Loc
Top Employers
Source: InfoUSA
Section 8 - Economic Outlook Allen and Associates Consulting
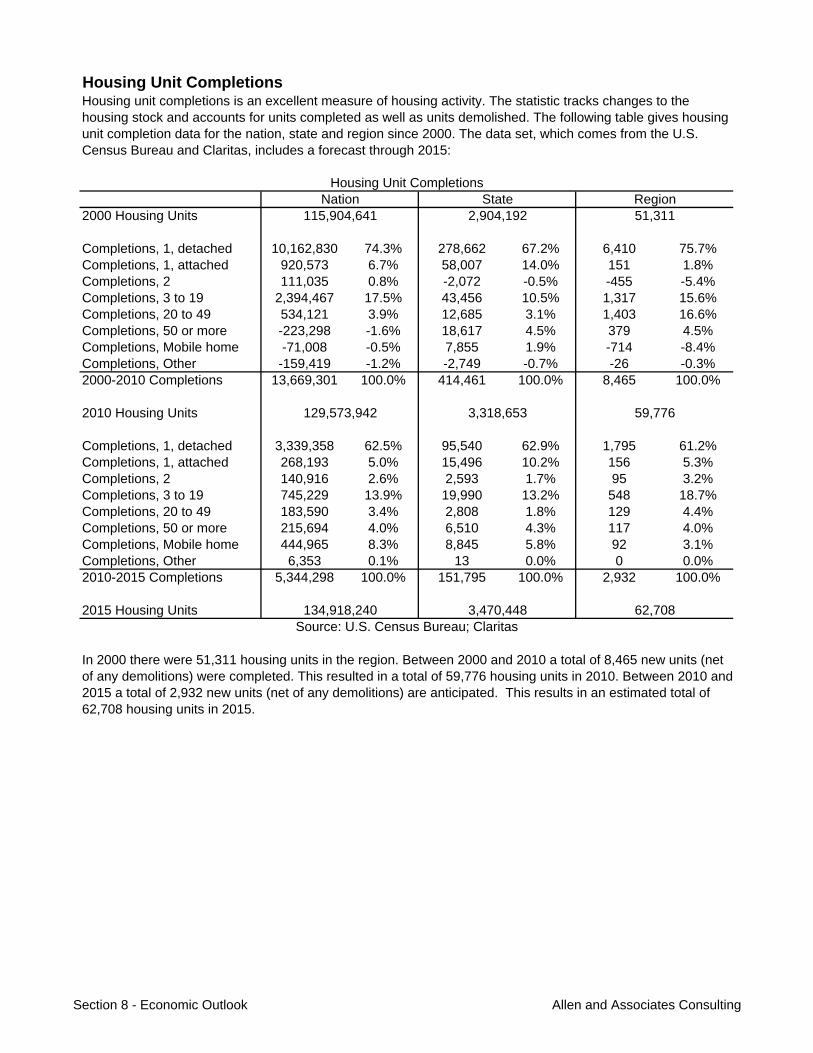
Housing Unit Completions
2000 Housing Units
Completions, 1, detached 10,162,830 74.3% 278,662 67.2% 6,410 75.7%Completions, 1, attached 920,573 6.7% 58,007 14.0% 151 1.8%Completions, 2 111,035 0.8% -2,072 -0.5% -455 -5.4%Completions, 3 to 19 2,394,467 17.5% 43,456 10.5% 1,317 15.6%Completions, 20 to 49 534,121 3.9% 12,685 3.1% 1,403 16.6%Completions, 50 or more -223,298 -1.6% 18,617 4.5% 379 4.5%Completions, Mobile home -71,008 -0.5% 7,855 1.9% -714 -8.4%Completions, Other -159,419 -1.2% -2,749 -0.7% -26 -0.3%2000-2010 Completions 13,669,301 100.0% 414,461 100.0% 8,465 100.0%
2010 Housing Units
Completions, 1, detached 3,339,358 62.5% 95,540 62.9% 1,795 61.2%Completions, 1, attached 268,193 5.0% 15,496 10.2% 156 5.3%Completions, 2 140,916 2.6% 2,593 1.7% 95 3.2%Completions, 3 to 19 745,229 13.9% 19,990 13.2% 548 18.7%Completions, 20 to 49 183,590 3.4% 2,808 1.8% 129 4.4%Completions, 50 or more 215,694 4.0% 6,510 4.3% 117 4.0%Completions, Mobile home 444,965 8.3% 8,845 5.8% 92 3.1%Completions, Other 6,353 0.1% 13 0.0% 0 0.0%2010-2015 Completions 5,344,298 100.0% 151,795 100.0% 2,932 100.0%
2015 Housing Units
In 2000 there were 51,311 housing units in the region. Between 2000 and 2010 a total of 8,465 new units (net of any demolitions) were completed. This resulted in a total of 59,776 housing units in 2010. Between 2010 and 2015 a total of 2,932 new units (net of any demolitions) are anticipated. This results in an estimated total of 62,708 housing units in 2015.
Nation115,904,641
State2,904,192
Region51,311
Housing Unit Completions
Source: U.S. Census Bureau; Claritas134,918,240 3,470,448 62,708
Housing unit completions is an excellent measure of housing activity. The statistic tracks changes to the housing stock and accounts for units completed as well as units demolished. The following table gives housing unit completion data for the nation, state and region since 2000. The data set, which comes from the U.S. Census Bureau and Claritas, includes a forecast through 2015:
129,573,942 3,318,653 59,776
Section 8 - Economic Outlook Allen and Associates Consulting
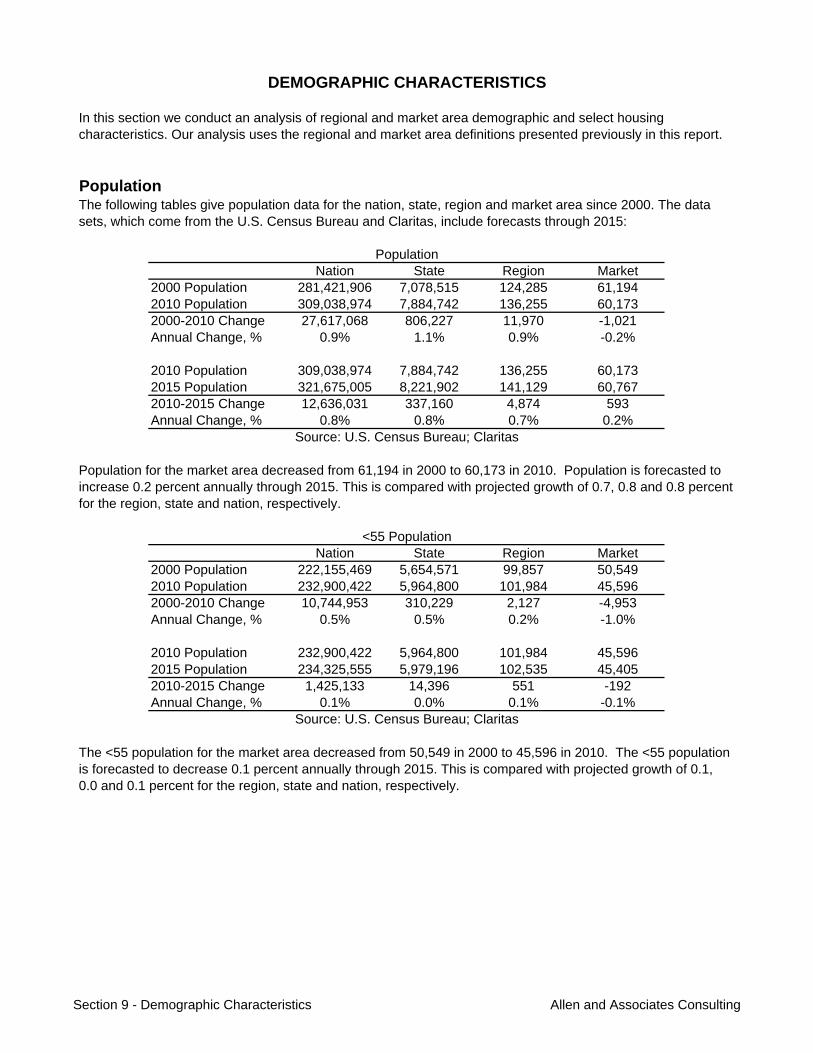
Population
Nation State Region Market2000 Population 281,421,906 7,078,515 124,285 61,1942010 Population 309,038,974 7,884,742 136,255 60,1732000-2010 Change 27,617,068 806,227 11,970 -1,021Annual Change, % 0.9% 1.1% 0.9% -0.2%
2010 Population 309,038,974 7,884,742 136,255 60,1732015 Population 321,675,005 8,221,902 141,129 60,7672010-2015 Change 12,636,031 337,160 4,874 593Annual Change, % 0.8% 0.8% 0.7% 0.2%
Nation State Region Market2000 Population 222,155,469 5,654,571 99,857 50,5492010 Population 232,900,422 5,964,800 101,984 45,5962000-2010 Change 10,744,953 310,229 2,127 -4,953Annual Change, % 0.5% 0.5% 0.2% -1.0%
2010 Population 232,900,422 5,964,800 101,984 45,5962015 Population 234,325,555 5,979,196 102,535 45,4052010-2015 Change 1,425,133 14,396 551 -192Annual Change, % 0.1% 0.0% 0.1% -0.1%
The following tables give population data for the nation, state, region and market area since 2000. The data sets, which come from the U.S. Census Bureau and Claritas, include forecasts through 2015:
<55 Population
Population
Source: U.S. Census Bureau; Claritas
DEMOGRAPHIC CHARACTERISTICS
In this section we conduct an analysis of regional and market area demographic and select housing characteristics. Our analysis uses the regional and market area definitions presented previously in this report.
Population for the market area decreased from 61,194 in 2000 to 60,173 in 2010. Population is forecasted to increase 0.2 percent annually through 2015. This is compared with projected growth of 0.7, 0.8 and 0.8 percent for the region, state and nation, respectively.
The <55 population for the market area decreased from 50,549 in 2000 to 45,596 in 2010. The <55 population is forecasted to decrease 0.1 percent annually through 2015. This is compared with projected growth of 0.1, 0.0 and 0.1 percent for the region, state and nation, respectively.
Source: U.S. Census Bureau; Claritas
Section 9 - Demographic Characteristics Allen and Associates Consulting
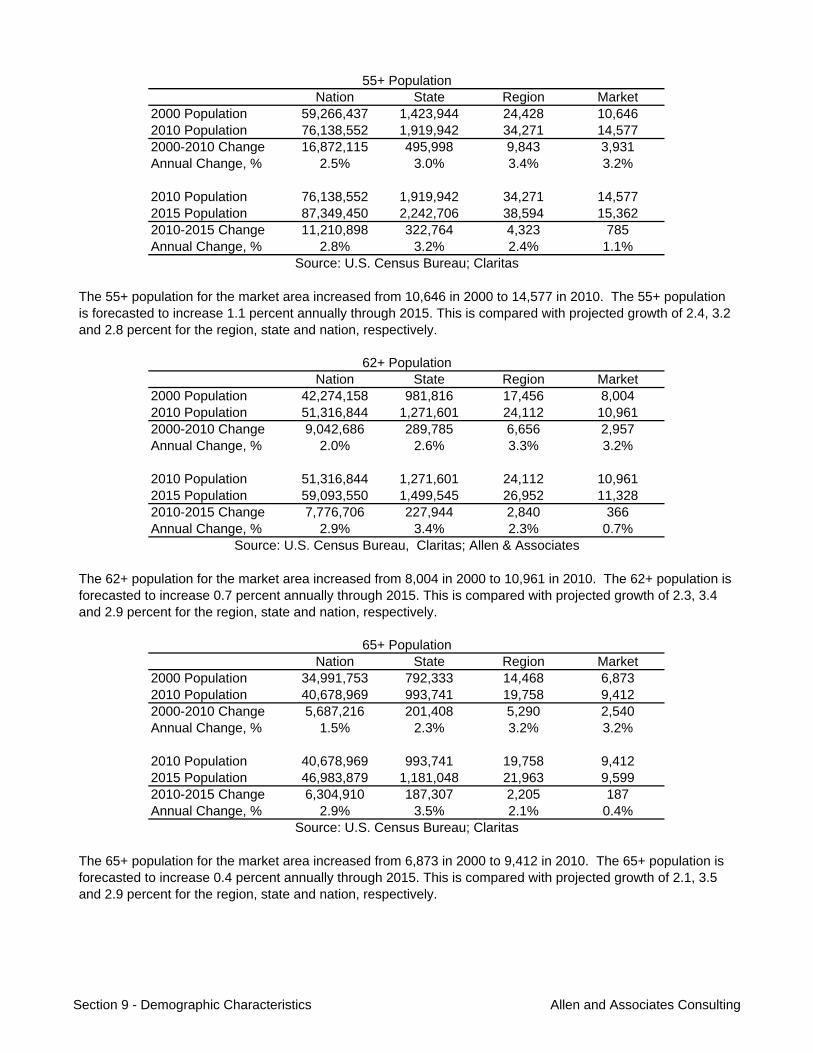
Nation State Region Market2000 Population 59,266,437 1,423,944 24,428 10,6462010 Population 76,138,552 1,919,942 34,271 14,5772000-2010 Change 16,872,115 495,998 9,843 3,931Annual Change, % 2.5% 3.0% 3.4% 3.2%
2010 Population 76,138,552 1,919,942 34,271 14,5772015 Population 87,349,450 2,242,706 38,594 15,3622010-2015 Change 11,210,898 322,764 4,323 785Annual Change, % 2.8% 3.2% 2.4% 1.1%
Nation State Region Market2000 Population 42,274,158 981,816 17,456 8,0042010 Population 51,316,844 1,271,601 24,112 10,9612000-2010 Change 9,042,686 289,785 6,656 2,957Annual Change, % 2.0% 2.6% 3.3% 3.2%
2010 Population 51,316,844 1,271,601 24,112 10,9612015 Population 59,093,550 1,499,545 26,952 11,3282010-2015 Change 7,776,706 227,944 2,840 366Annual Change, % 2.9% 3.4% 2.3% 0.7%
Nation State Region Market2000 Population 34,991,753 792,333 14,468 6,8732010 Population 40,678,969 993,741 19,758 9,4122000-2010 Change 5,687,216 201,408 5,290 2,540Annual Change, % 1.5% 2.3% 3.2% 3.2%
2010 Population 40,678,969 993,741 19,758 9,4122015 Population 46,983,879 1,181,048 21,963 9,5992010-2015 Change 6,304,910 187,307 2,205 187Annual Change, % 2.9% 3.5% 2.1% 0.4%
62+ Population
Source: U.S. Census Bureau; Claritas
Source: U.S. Census Bureau, Claritas; Allen & Associates
65+ Population
55+ Population
Source: U.S. Census Bureau; Claritas
The 65+ population for the market area increased from 6,873 in 2000 to 9,412 in 2010. The 65+ population is forecasted to increase 0.4 percent annually through 2015. This is compared with projected growth of 2.1, 3.5 and 2.9 percent for the region, state and nation, respectively.
The 55+ population for the market area increased from 10,646 in 2000 to 14,577 in 2010. The 55+ population is forecasted to increase 1.1 percent annually through 2015. This is compared with projected growth of 2.4, 3.2 and 2.8 percent for the region, state and nation, respectively.
The 62+ population for the market area increased from 8,004 in 2000 to 10,961 in 2010. The 62+ population is forecasted to increase 0.7 percent annually through 2015. This is compared with projected growth of 2.3, 3.4 and 2.9 percent for the region, state and nation, respectively.
Section 9 - Demographic Characteristics Allen and Associates Consulting
Population per Household
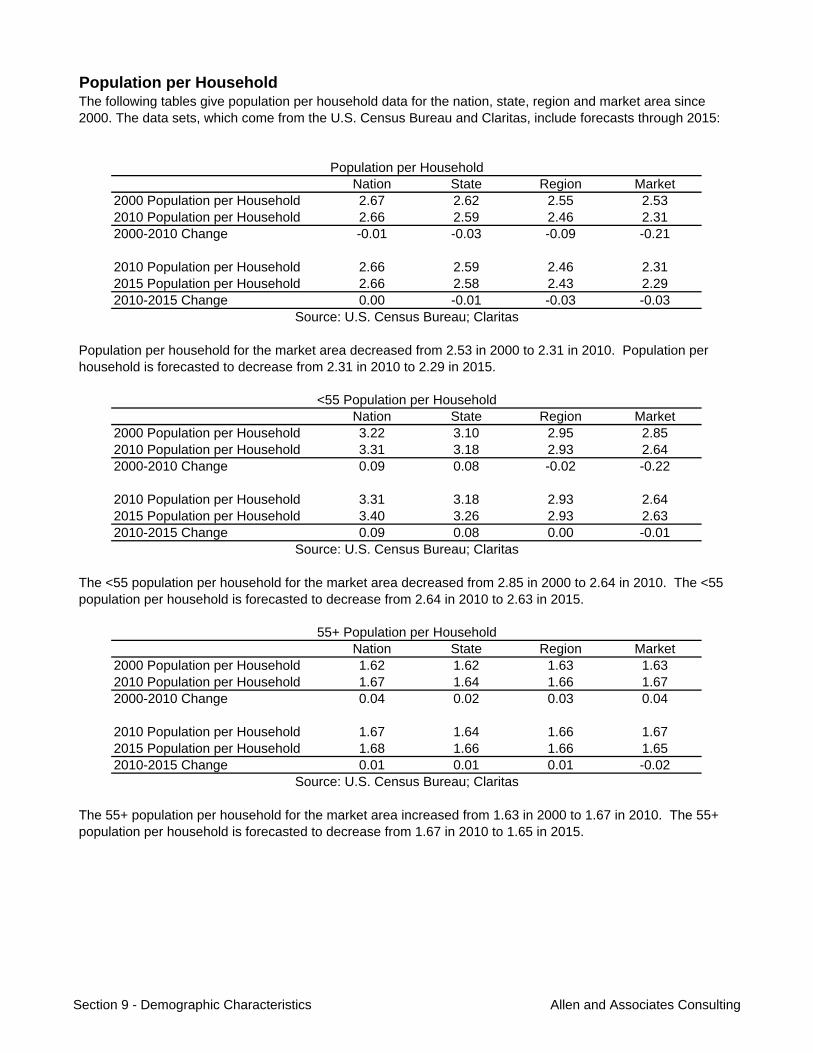
Nation State Region Market2000 Population per Household 2.67 2.62 2.55 2.532010 Population per Household 2.66 2.59 2.46 2.312000-2010 Change -0.01 -0.03 -0.09 -0.21
2010 Population per Household 2.66 2.59 2.46 2.312015 Population per Household 2.66 2.58 2.43 2.292010-2015 Change 0.00 -0.01 -0.03 -0.03
Nation State Region Market2000 Population per Household 3.22 3.10 2.95 2.852010 Population per Household 3.31 3.18 2.93 2.642000-2010 Change 0.09 0.08 -0.02 -0.22
2010 Population per Household 3.31 3.18 2.93 2.642015 Population per Household 3.40 3.26 2.93 2.632010-2015 Change 0.09 0.08 0.00 -0.01
Nation State Region Market2000 Population per Household 1.62 1.62 1.63 1.632010 Population per Household 1.67 1.64 1.66 1.672000-2010 Change 0.04 0.02 0.03 0.04
2010 Population per Household 1.67 1.64 1.66 1.672015 Population per Household 1.68 1.66 1.66 1.652010-2015 Change 0.01 0.01 0.01 -0.02
Population per household for the market area decreased from 2.53 in 2000 to 2.31 in 2010. Population per household is forecasted to decrease from 2.31 in 2010 to 2.29 in 2015.
The <55 population per household for the market area decreased from 2.85 in 2000 to 2.64 in 2010. The <55 population per household is forecasted to decrease from 2.64 in 2010 to 2.63 in 2015.
The 55+ population per household for the market area increased from 1.63 in 2000 to 1.67 in 2010. The 55+ population per household is forecasted to decrease from 1.67 in 2010 to 1.65 in 2015.
Source: U.S. Census Bureau; Claritas
55+ Population per Household
Source: U.S. Census Bureau; Claritas
The following tables give population per household data for the nation, state, region and market area since 2000. The data sets, which come from the U.S. Census Bureau and Claritas, include forecasts through 2015:
<55 Population per Household
Population per Household
Source: U.S. Census Bureau; Claritas
Section 9 - Demographic Characteristics Allen and Associates Consulting
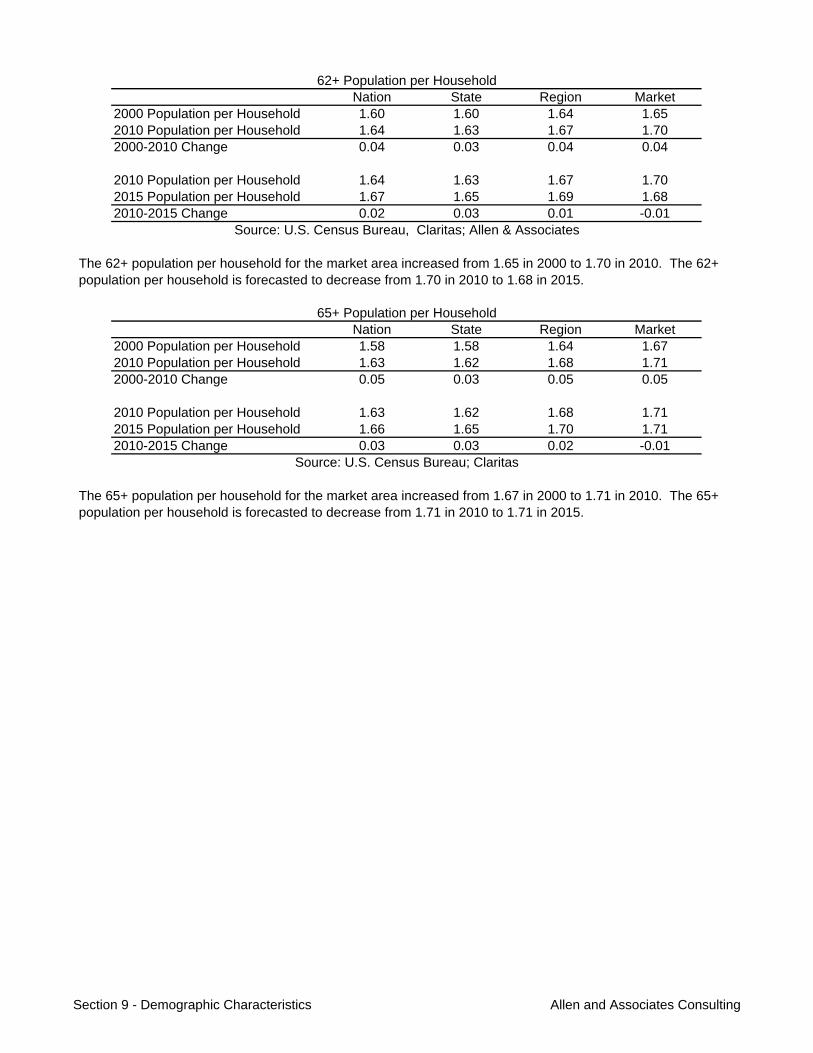
Nation State Region Market2000 Population per Household 1.60 1.60 1.64 1.652010 Population per Household 1.64 1.63 1.67 1.702000-2010 Change 0.04 0.03 0.04 0.04
2010 Population per Household 1.64 1.63 1.67 1.702015 Population per Household 1.67 1.65 1.69 1.682010-2015 Change 0.02 0.03 0.01 -0.01
Nation State Region Market2000 Population per Household 1.58 1.58 1.64 1.672010 Population per Household 1.63 1.62 1.68 1.712000-2010 Change 0.05 0.03 0.05 0.05
2010 Population per Household 1.63 1.62 1.68 1.712015 Population per Household 1.66 1.65 1.70 1.712010-2015 Change 0.03 0.03 0.02 -0.01
The 65+ population per household for the market area increased from 1.67 in 2000 to 1.71 in 2010. The 65+ population per household is forecasted to decrease from 1.71 in 2010 to 1.71 in 2015.
The 62+ population per household for the market area increased from 1.65 in 2000 to 1.70 in 2010. The 62+ population per household is forecasted to decrease from 1.70 in 2010 to 1.68 in 2015.
62+ Population per Household
Source: U.S. Census Bureau; Claritas
Source: U.S. Census Bureau, Claritas; Allen & Associates
65+ Population per Household
Section 9 - Demographic Characteristics Allen and Associates Consulting
Households
Nation State Region Market2000 Households 105,539,122 2,700,335 48,777 24,2242010 Households 116,136,617 3,043,091 55,424 26,0062000-2010 Change 10,597,495 342,756 6,647 1,782Annual Change, % 1.0% 1.2% 1.3% 0.7%
2010 Households 116,136,617 3,043,091 55,424 26,0062015 Households 120,947,177 3,184,201 58,125 26,5692010-2015 Change 4,810,560 141,110 2,701 563Annual Change, % 0.8% 0.9% 1.0% 0.4%
Nation State Region Market2000 Households 69,061,603 1,823,639 33,820 17,7072010 Households 70,450,021 1,874,847 34,766 17,2982000-2010 Change 1,388,418 51,208 946 -409Annual Change, % 0.2% 0.3% 0.3% -0.2%
2010 Households 70,450,021 1,874,847 34,766 17,2982015 Households 68,982,220 1,831,815 34,938 17,2842010-2015 Change -1,467,801 -43,032 172 -15Annual Change, % -0.4% -0.5% 0.1% 0.0%
Nation State Region Market2000 Households 36,477,519 876,696 14,957 6,5172010 Households 45,686,596 1,168,244 20,658 8,7082000-2010 Change 9,209,077 291,548 5,701 2,191Annual Change, % 2.3% 2.9% 3.3% 2.9%
2010 Households 45,686,596 1,168,244 20,658 8,7082015 Households 51,964,957 1,352,386 23,187 9,2852010-2015 Change 6,278,361 184,142 2,529 577Annual Change, % 2.6% 3.0% 2.3% 1.3%
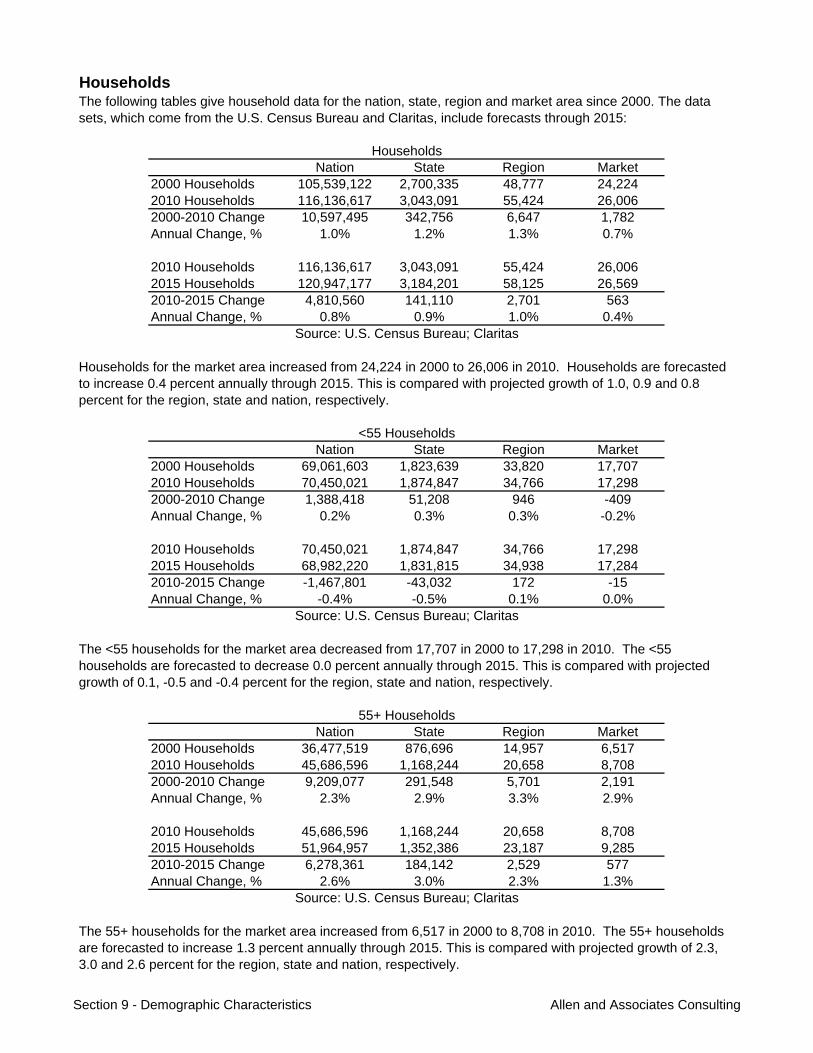
Households for the market area increased from 24,224 in 2000 to 26,006 in 2010. Households are forecasted to increase 0.4 percent annually through 2015. This is compared with projected growth of 1.0, 0.9 and 0.8 percent for the region, state and nation, respectively.
The <55 households for the market area decreased from 17,707 in 2000 to 17,298 in 2010. The <55 households are forecasted to decrease 0.0 percent annually through 2015. This is compared with projected growth of 0.1, -0.5 and -0.4 percent for the region, state and nation, respectively.
The 55+ households for the market area increased from 6,517 in 2000 to 8,708 in 2010. The 55+ households are forecasted to increase 1.3 percent annually through 2015. This is compared with projected growth of 2.3, 3.0 and 2.6 percent for the region, state and nation, respectively.
Source: U.S. Census Bureau; Claritas
55+ Households
Source: U.S. Census Bureau; Claritas
The following tables give household data for the nation, state, region and market area since 2000. The data sets, which come from the U.S. Census Bureau and Claritas, include forecasts through 2015:
<55 Households
Households
Source: U.S. Census Bureau; Claritas
Section 9 - Demographic Characteristics Allen and Associates Consulting
Nation State Region Market2000 Households 26,422,327 613,465 10,671 4,8402010 Households 31,196,855 780,781 14,414 6,4592000-2010 Change 4,774,528 167,316 3,743 1,619Annual Change, % 1.7% 2.4% 3.1% 2.9%
2010 Households 31,196,855 780,781 14,414 6,4592015 Households 35,455,889 906,725 15,986 6,7252010-2015 Change 4,259,034 125,944 1,572 266Annual Change, % 2.6% 3.0% 2.1% 0.8%
Nation State Region Market2000 Households 22,112,959 500,652 8,834 4,1222010 Households 24,986,966 614,726 11,738 5,4952000-2010 Change 2,874,007 114,074 2,904 1,373Annual Change, % 1.2% 2.1% 2.9% 2.9%
2010 Households 24,986,966 614,726 11,738 5,4952015 Households 28,380,574 715,728 12,900 5,6282010-2015 Change 3,393,608 101,002 1,162 132Annual Change, % 2.6% 3.1% 1.9% 0.5%
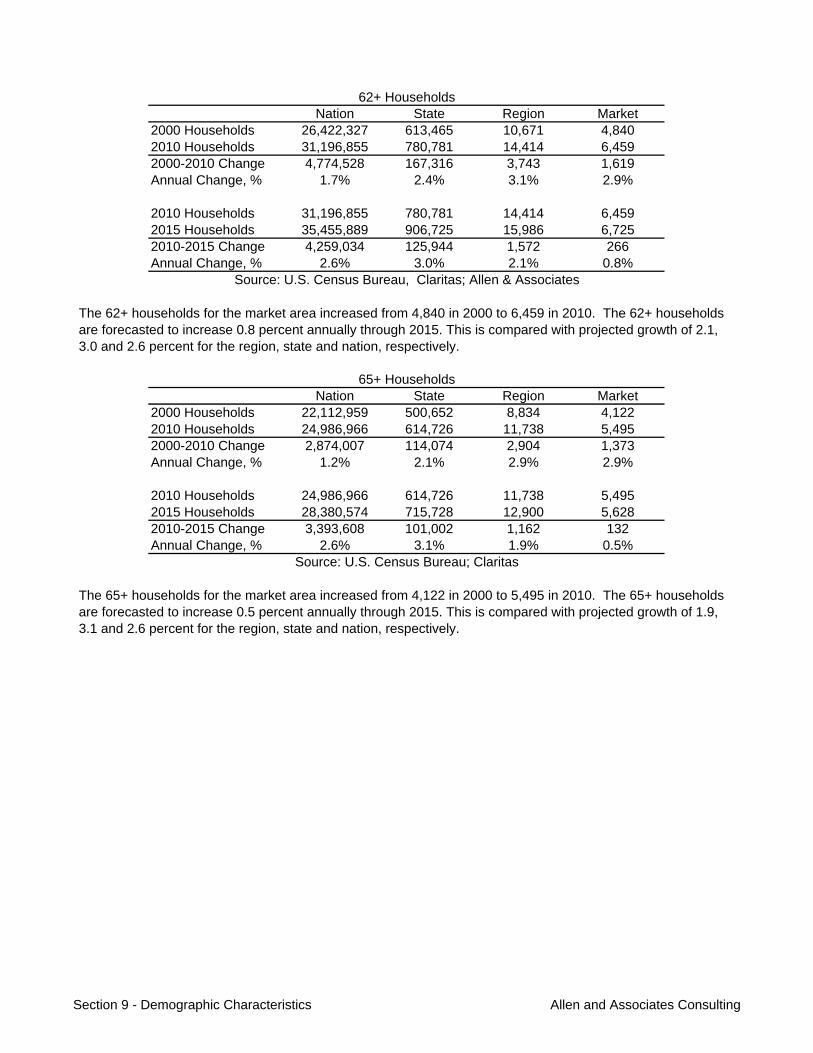
The 65+ households for the market area increased from 4,122 in 2000 to 5,495 in 2010. The 65+ households are forecasted to increase 0.5 percent annually through 2015. This is compared with projected growth of 1.9, 3.1 and 2.6 percent for the region, state and nation, respectively.
The 62+ households for the market area increased from 4,840 in 2000 to 6,459 in 2010. The 62+ households are forecasted to increase 0.8 percent annually through 2015. This is compared with projected growth of 2.1, 3.0 and 2.6 percent for the region, state and nation, respectively.
62+ Households
Source: U.S. Census Bureau; Claritas
Source: U.S. Census Bureau, Claritas; Allen & Associates
65+ Households
Section 9 - Demographic Characteristics Allen and Associates Consulting
Owner Tenure
Nation State Region Market2000 Tenure 66.2% 68.1% 57.4% 41.2%2010 Tenure 66.8% 70.0% 60.4% 44.9%2000-2010 Change 0.66% 1.86% 2.99% 3.69%
2010 Tenure 66.8% 70.0% 60.4% 44.9%2015 Tenure 66.8% 70.3% 60.6% 44.8%2010-2015 Change 0.00% 0.31% 0.24% -0.09%
Nation State Region Market2000 Tenure 59.7% 61.7% 47.7% 29.8%2010 Tenure 59.6% 63.0% 49.2% 31.4%2000-2010 Change -0.04% 1.27% 1.52% 1.58%
2010 Tenure 59.6% 63.0% 49.2% 31.4%2015 Tenure 58.8% 62.4% 48.8% 31.2%2010-2015 Change -0.86% -0.53% -0.43% -0.20%
Nation State Region Market2000 Tenure 78.5% 81.5% 79.3% 72.1%2010 Tenure 78.0% 81.3% 79.2% 71.7%2000-2010 Change -0.53% -0.25% -0.15% -0.41%
2010 Tenure 78.0% 81.3% 79.2% 71.7%2015 Tenure 77.5% 81.0% 78.4% 70.1%2010-2015 Change -0.41% -0.30% -0.72% -1.58%
Source: U.S. Census Bureau; Claritas
55+ Owner Tenure
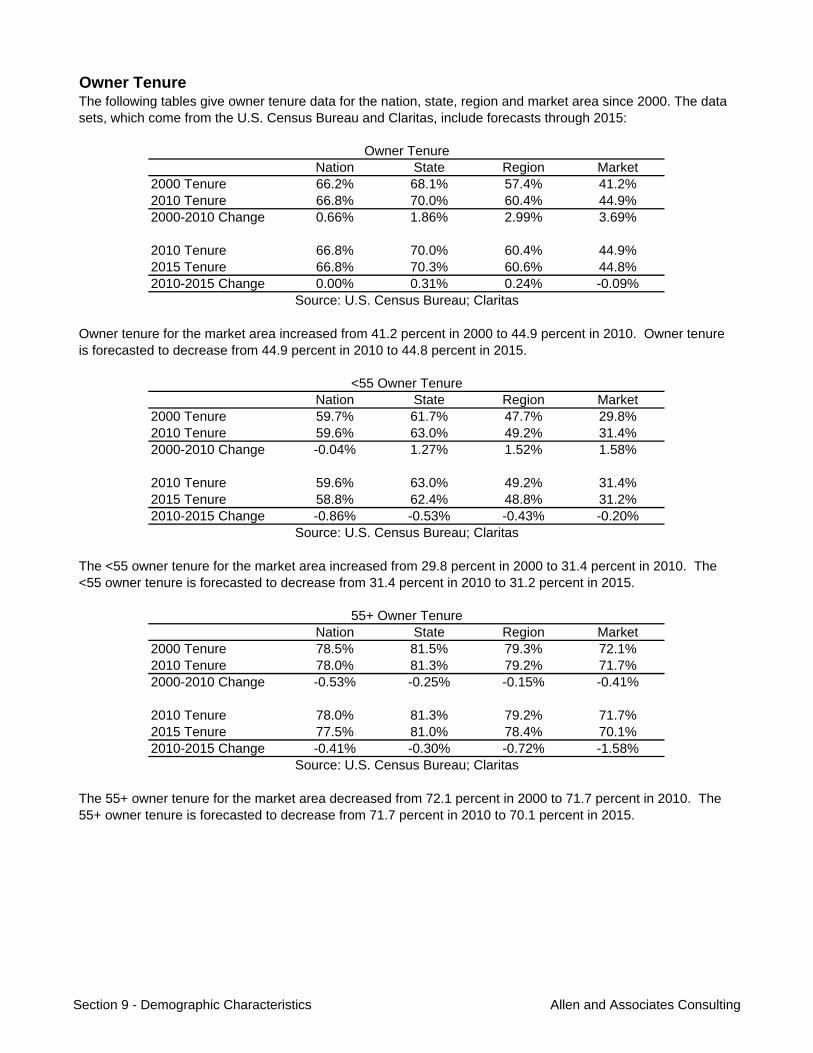
The following tables give owner tenure data for the nation, state, region and market area since 2000. The data sets, which come from the U.S. Census Bureau and Claritas, include forecasts through 2015:
<55 Owner Tenure
Owner Tenure
Source: U.S. Census Bureau; Claritas
Owner tenure for the market area increased from 41.2 percent in 2000 to 44.9 percent in 2010. Owner tenure is forecasted to decrease from 44.9 percent in 2010 to 44.8 percent in 2015.
The <55 owner tenure for the market area increased from 29.8 percent in 2000 to 31.4 percent in 2010. The <55 owner tenure is forecasted to decrease from 31.4 percent in 2010 to 31.2 percent in 2015.
The 55+ owner tenure for the market area decreased from 72.1 percent in 2000 to 71.7 percent in 2010. The 55+ owner tenure is forecasted to decrease from 71.7 percent in 2010 to 70.1 percent in 2015.
Source: U.S. Census Bureau; Claritas
Section 9 - Demographic Characteristics Allen and Associates Consulting
Nation State Region Market2000 Tenure 78.2% 81.0% 79.0% 72.3%2010 Tenure 77.3% 80.5% 77.9% 71.4%2000-2010 Change -0.90% -0.56% -1.02% -0.91%
2010 Tenure 77.3% 80.5% 77.9% 71.4%2015 Tenure 76.9% 80.2% 77.4% 70.0%2010-2015 Change -0.39% -0.26% -0.55% -1.40%
Nation State Region Market2000 Tenure 78.0% 80.6% 78.7% 72.5%2010 Tenure 76.8% 79.8% 77.0% 71.3%2000-2010 Change -1.21% -0.84% -1.69% -1.26%
2010 Tenure 76.8% 79.8% 77.0% 71.3%2015 Tenure 76.4% 79.6% 76.6% 70.0%2010-2015 Change -0.38% -0.23% -0.43% -1.29%
65+ Owner Tenure
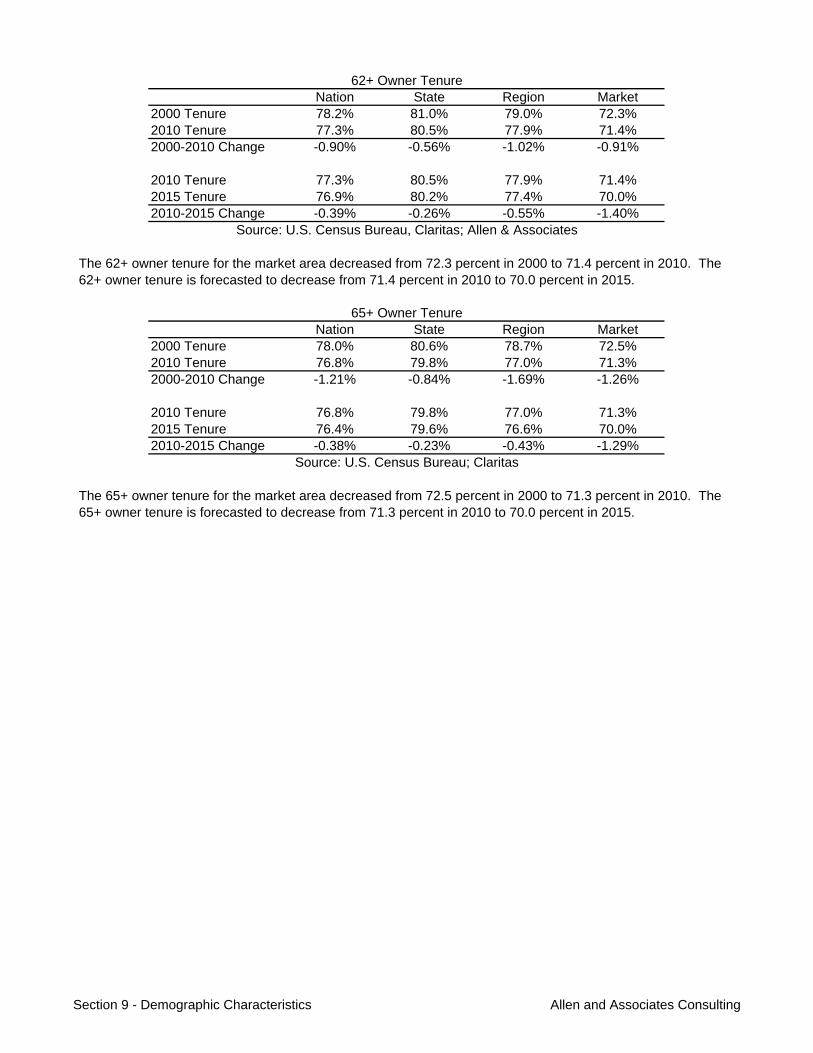
The 65+ owner tenure for the market area decreased from 72.5 percent in 2000 to 71.3 percent in 2010. The 65+ owner tenure is forecasted to decrease from 71.3 percent in 2010 to 70.0 percent in 2015.
The 62+ owner tenure for the market area decreased from 72.3 percent in 2000 to 71.4 percent in 2010. The 62+ owner tenure is forecasted to decrease from 71.4 percent in 2010 to 70.0 percent in 2015.
62+ Owner Tenure
Source: U.S. Census Bureau; Claritas
Source: U.S. Census Bureau, Claritas; Allen & Associates
Section 9 - Demographic Characteristics Allen and Associates Consulting
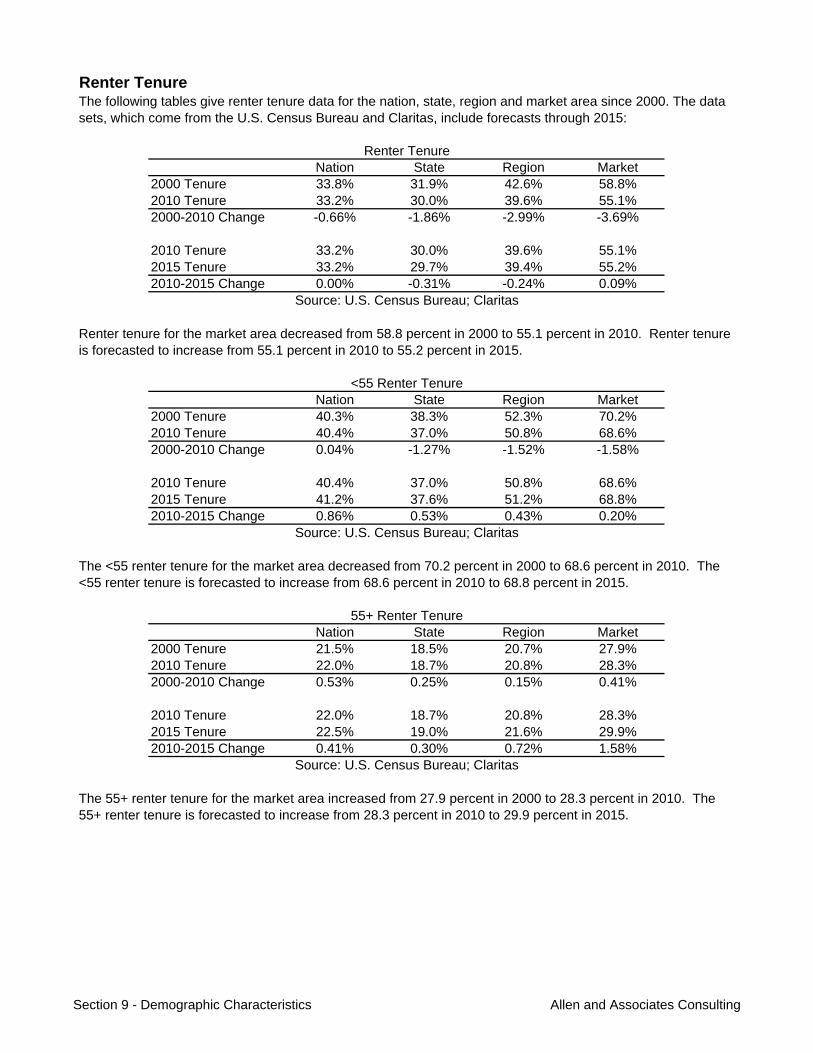
Renter Tenure
Nation State Region Market2000 Tenure 33.8% 31.9% 42.6% 58.8%2010 Tenure 33.2% 30.0% 39.6% 55.1%2000-2010 Change -0.66% -1.86% -2.99% -3.69%
2010 Tenure 33.2% 30.0% 39.6% 55.1%2015 Tenure 33.2% 29.7% 39.4% 55.2%2010-2015 Change 0.00% -0.31% -0.24% 0.09%
Nation State Region Market2000 Tenure 40.3% 38.3% 52.3% 70.2%2010 Tenure 40.4% 37.0% 50.8% 68.6%2000-2010 Change 0.04% -1.27% -1.52% -1.58%
2010 Tenure 40.4% 37.0% 50.8% 68.6%2015 Tenure 41.2% 37.6% 51.2% 68.8%2010-2015 Change 0.86% 0.53% 0.43% 0.20%
Nation State Region Market2000 Tenure 21.5% 18.5% 20.7% 27.9%2010 Tenure 22.0% 18.7% 20.8% 28.3%2000-2010 Change 0.53% 0.25% 0.15% 0.41%
2010 Tenure 22.0% 18.7% 20.8% 28.3%2015 Tenure 22.5% 19.0% 21.6% 29.9%2010-2015 Change 0.41% 0.30% 0.72% 1.58%
The <55 renter tenure for the market area decreased from 70.2 percent in 2000 to 68.6 percent in 2010. The <55 renter tenure is forecasted to increase from 68.6 percent in 2010 to 68.8 percent in 2015.
The 55+ renter tenure for the market area increased from 27.9 percent in 2000 to 28.3 percent in 2010. The 55+ renter tenure is forecasted to increase from 28.3 percent in 2010 to 29.9 percent in 2015.
Source: U.S. Census Bureau; Claritas
The following tables give renter tenure data for the nation, state, region and market area since 2000. The data sets, which come from the U.S. Census Bureau and Claritas, include forecasts through 2015:
<55 Renter Tenure
Renter Tenure
Source: U.S. Census Bureau; Claritas
Renter tenure for the market area decreased from 58.8 percent in 2000 to 55.1 percent in 2010. Renter tenure is forecasted to increase from 55.1 percent in 2010 to 55.2 percent in 2015.
Source: U.S. Census Bureau; Claritas
55+ Renter Tenure
Section 9 - Demographic Characteristics Allen and Associates Consulting
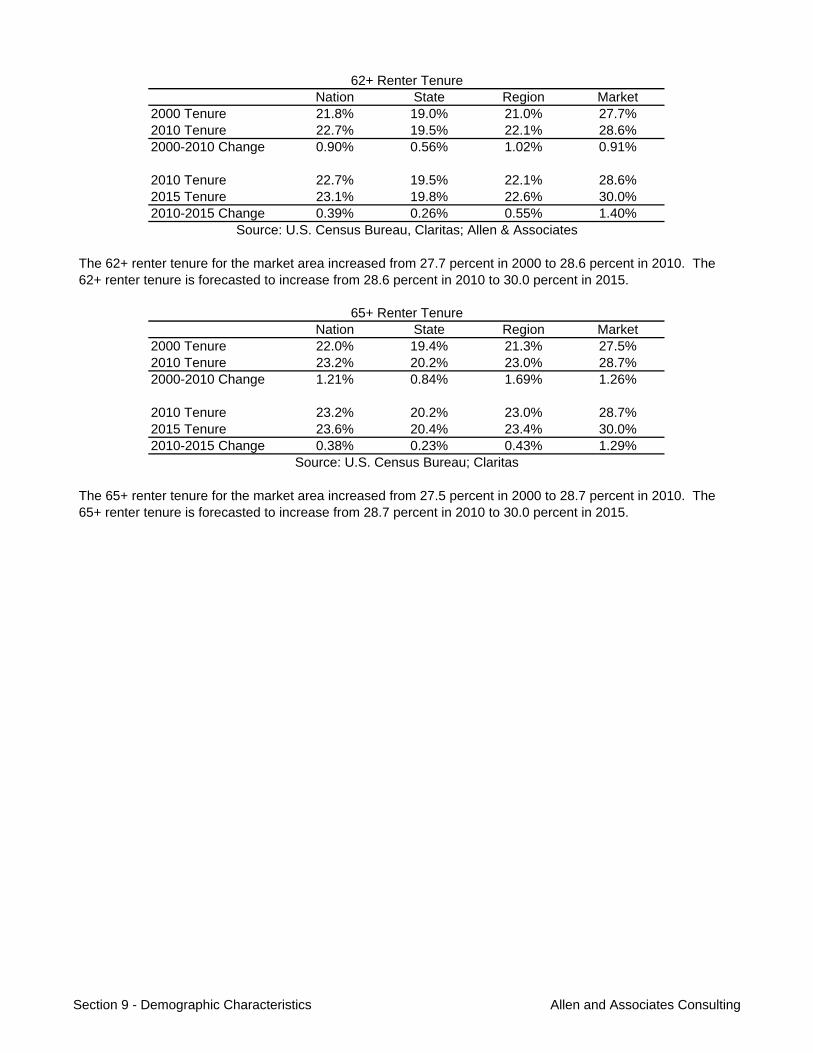
Nation State Region Market2000 Tenure 21.8% 19.0% 21.0% 27.7%2010 Tenure 22.7% 19.5% 22.1% 28.6%2000-2010 Change 0.90% 0.56% 1.02% 0.91%
2010 Tenure 22.7% 19.5% 22.1% 28.6%2015 Tenure 23.1% 19.8% 22.6% 30.0%2010-2015 Change 0.39% 0.26% 0.55% 1.40%
Nation State Region Market2000 Tenure 22.0% 19.4% 21.3% 27.5%2010 Tenure 23.2% 20.2% 23.0% 28.7%2000-2010 Change 1.21% 0.84% 1.69% 1.26%
2010 Tenure 23.2% 20.2% 23.0% 28.7%2015 Tenure 23.6% 20.4% 23.4% 30.0%2010-2015 Change 0.38% 0.23% 0.43% 1.29%
The 65+ renter tenure for the market area increased from 27.5 percent in 2000 to 28.7 percent in 2010. The 65+ renter tenure is forecasted to increase from 28.7 percent in 2010 to 30.0 percent in 2015.
The 62+ renter tenure for the market area increased from 27.7 percent in 2000 to 28.6 percent in 2010. The 62+ renter tenure is forecasted to increase from 28.6 percent in 2010 to 30.0 percent in 2015.
62+ Renter Tenure
Source: U.S. Census Bureau; Claritas
Source: U.S. Census Bureau, Claritas; Allen & Associates
65+ Renter Tenure
Section 9 - Demographic Characteristics Allen and Associates Consulting
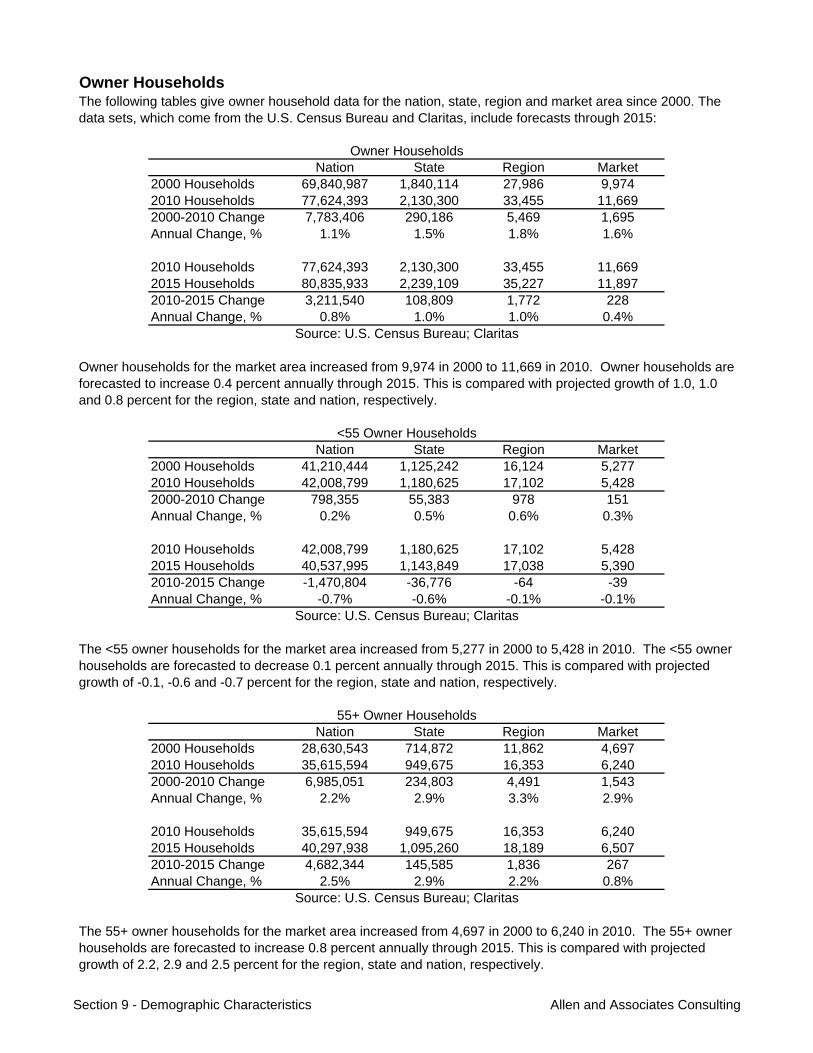
Owner Households
Nation State Region Market2000 Households 69,840,987 1,840,114 27,986 9,9742010 Households 77,624,393 2,130,300 33,455 11,6692000-2010 Change 7,783,406 290,186 5,469 1,695Annual Change, % 1.1% 1.5% 1.8% 1.6%
2010 Households 77,624,393 2,130,300 33,455 11,6692015 Households 80,835,933 2,239,109 35,227 11,8972010-2015 Change 3,211,540 108,809 1,772 228Annual Change, % 0.8% 1.0% 1.0% 0.4%
Nation State Region Market2000 Households 41,210,444 1,125,242 16,124 5,2772010 Households 42,008,799 1,180,625 17,102 5,4282000-2010 Change 798,355 55,383 978 151Annual Change, % 0.2% 0.5% 0.6% 0.3%
2010 Households 42,008,799 1,180,625 17,102 5,4282015 Households 40,537,995 1,143,849 17,038 5,3902010-2015 Change -1,470,804 -36,776 -64 -39Annual Change, % -0.7% -0.6% -0.1% -0.1%
Nation State Region Market2000 Households 28,630,543 714,872 11,862 4,6972010 Households 35,615,594 949,675 16,353 6,2402000-2010 Change 6,985,051 234,803 4,491 1,543Annual Change, % 2.2% 2.9% 3.3% 2.9%
2010 Households 35,615,594 949,675 16,353 6,2402015 Households 40,297,938 1,095,260 18,189 6,5072010-2015 Change 4,682,344 145,585 1,836 267Annual Change, % 2.5% 2.9% 2.2% 0.8%
Owner households for the market area increased from 9,974 in 2000 to 11,669 in 2010. Owner households are forecasted to increase 0.4 percent annually through 2015. This is compared with projected growth of 1.0, 1.0 and 0.8 percent for the region, state and nation, respectively.
The <55 owner households for the market area increased from 5,277 in 2000 to 5,428 in 2010. The <55 owner households are forecasted to decrease 0.1 percent annually through 2015. This is compared with projected growth of -0.1, -0.6 and -0.7 percent for the region, state and nation, respectively.
The 55+ owner households for the market area increased from 4,697 in 2000 to 6,240 in 2010. The 55+ owner households are forecasted to increase 0.8 percent annually through 2015. This is compared with projected growth of 2.2, 2.9 and 2.5 percent for the region, state and nation, respectively.
Source: U.S. Census Bureau; Claritas
55+ Owner Households
Source: U.S. Census Bureau; Claritas
The following tables give owner household data for the nation, state, region and market area since 2000. The data sets, which come from the U.S. Census Bureau and Claritas, include forecasts through 2015:
<55 Owner Households
Owner Households
Source: U.S. Census Bureau; Claritas
Section 9 - Demographic Characteristics Allen and Associates Consulting
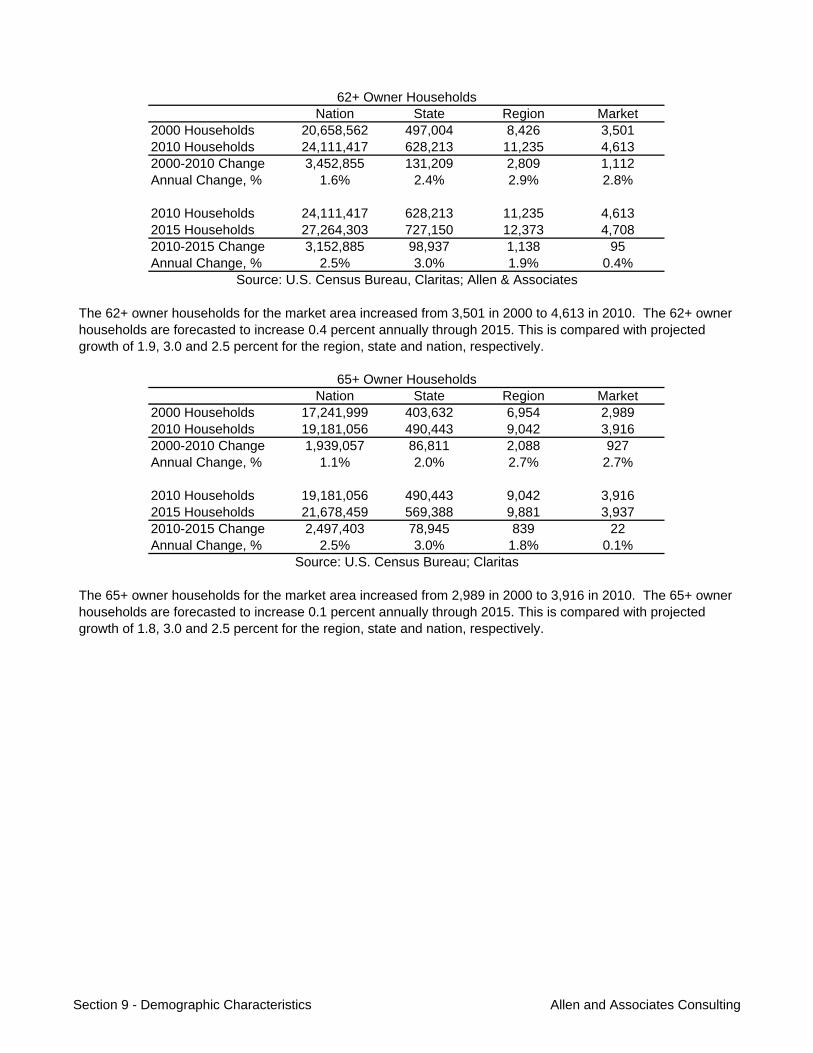
Nation State Region Market2000 Households 20,658,562 497,004 8,426 3,5012010 Households 24,111,417 628,213 11,235 4,6132000-2010 Change 3,452,855 131,209 2,809 1,112Annual Change, % 1.6% 2.4% 2.9% 2.8%
2010 Households 24,111,417 628,213 11,235 4,6132015 Households 27,264,303 727,150 12,373 4,7082010-2015 Change 3,152,885 98,937 1,138 95Annual Change, % 2.5% 3.0% 1.9% 0.4%
Nation State Region Market2000 Households 17,241,999 403,632 6,954 2,9892010 Households 19,181,056 490,443 9,042 3,9162000-2010 Change 1,939,057 86,811 2,088 927Annual Change, % 1.1% 2.0% 2.7% 2.7%
2010 Households 19,181,056 490,443 9,042 3,9162015 Households 21,678,459 569,388 9,881 3,9372010-2015 Change 2,497,403 78,945 839 22Annual Change, % 2.5% 3.0% 1.8% 0.1%
The 65+ owner households for the market area increased from 2,989 in 2000 to 3,916 in 2010. The 65+ owner households are forecasted to increase 0.1 percent annually through 2015. This is compared with projected growth of 1.8, 3.0 and 2.5 percent for the region, state and nation, respectively.
The 62+ owner households for the market area increased from 3,501 in 2000 to 4,613 in 2010. The 62+ owner households are forecasted to increase 0.4 percent annually through 2015. This is compared with projected growth of 1.9, 3.0 and 2.5 percent for the region, state and nation, respectively.
62+ Owner Households
Source: U.S. Census Bureau; Claritas
Source: U.S. Census Bureau, Claritas; Allen & Associates
65+ Owner Households
Section 9 - Demographic Characteristics Allen and Associates Consulting
Renter Households
Nation State Region Market2000 Households 35,698,135 860,221 20,791 14,2502010 Households 38,512,224 912,791 21,969 14,3372000-2010 Change 2,814,089 52,570 1,178 87Annual Change, % 0.8% 0.6% 0.6% 0.1%
2010 Households 38,512,224 912,791 21,969 14,3372015 Households 40,111,244 945,092 22,898 14,6722010-2015 Change 1,599,020 32,301 929 335Annual Change, % 0.8% 0.7% 0.8% 0.5%
Nation State Region Market2000 Households 27,851,159 698,397 17,696 12,4302010 Households 28,441,222 694,222 17,664 11,8702000-2010 Change 590,063 -4,175 -32 -560Annual Change, % 0.2% -0.1% 0.0% -0.5%
2010 Households 28,441,222 694,222 17,664 11,8702015 Households 28,444,225 687,966 17,900 11,8942010-2015 Change 3,003 -6,256 236 24Annual Change, % 0.0% -0.2% 0.3% 0.0%
Nation State Region Market2000 Households 7,846,976 161,824 3,095 1,8202010 Households 10,071,002 218,569 4,305 2,4672000-2010 Change 2,224,026 56,745 1,210 647Annual Change, % 2.5% 3.1% 3.4% 3.1%
2010 Households 10,071,002 218,569 4,305 2,4672015 Households 11,667,019 257,126 4,998 2,7782010-2015 Change 1,596,017 38,557 693 310Annual Change, % 3.0% 3.3% 3.0% 2.4%
The following tables give renter household data for the nation, state, region and market area since 2000. The data sets, which come from the U.S. Census Bureau and Claritas, include forecasts through 2015:
<55 Renter Households
Renter Households
Source: U.S. Census Bureau; Claritas
Renter households for the market area increased from 14,250 in 2000 to 14,337 in 2010. Renter households are forecasted to increase 0.5 percent annually through 2015. This is compared with projected growth of 0.8, 0.7 and 0.8 percent for the region, state and nation, respectively.
The <55 renter households for the market area decreased from 12,430 in 2000 to 11,870 in 2010. The <55 renter households are forecasted to increase 0.0 percent annually through 2015. This is compared with projected growth of 0.3, -0.2 and 0.0 percent for the region, state and nation, respectively.
The 55+ renter households for the market area increased from 1,820 in 2000 to 2,467 in 2010. The 55+ renter households are forecasted to increase 2.4 percent annually through 2015. This is compared with projected growth of 3.0, 3.3 and 3.0 percent for the region, state and nation, respectively.
Source: U.S. Census Bureau; Claritas
55+ Renter Households
Source: U.S. Census Bureau; Claritas
Section 9 - Demographic Characteristics Allen and Associates Consulting

Nation State Region Market2000 Households 5,763,765 116,461 2,245 1,3392010 Households 7,085,438 152,569 3,179 1,8462000-2010 Change 1,321,673 36,108 934 507Annual Change, % 2.1% 2.7% 3.5% 3.3%
2010 Households 7,085,438 152,569 3,179 1,8462015 Households 8,191,586 179,576 3,613 2,0172010-2015 Change 1,106,149 27,007 434 170Annual Change, % 2.9% 3.3% 2.6% 1.8%
Nation State Region Market2000 Households 4,870,960 97,020 1,880 1,1332010 Households 5,805,910 124,283 2,696 1,5802000-2010 Change 934,950 27,263 816 447Annual Change, % 1.8% 2.5% 3.7% 3.4%
2010 Households 5,805,910 124,283 2,696 1,5802015 Households 6,702,115 146,340 3,019 1,6902010-2015 Change 896,205 22,057 323 110Annual Change, % 2.9% 3.3% 2.3% 1.4%
62+ Renter Households
Source: U.S. Census Bureau; Claritas
Source: U.S. Census Bureau, Claritas; Allen & Associates
65+ Renter Households
The 65+ renter households for the market area increased from 1,133 in 2000 to 1,580 in 2010. The 65+ renter households are forecasted to increase 1.4 percent annually through 2015. This is compared with projected growth of 2.3, 3.3 and 2.9 percent for the region, state and nation, respectively.
The 62+ renter households for the market area increased from 1,339 in 2000 to 1,846 in 2010. The 62+ renter households are forecasted to increase 1.8 percent annually through 2015. This is compared with projected growth of 2.6, 3.3 and 2.9 percent for the region, state and nation, respectively.
Section 9 - Demographic Characteristics Allen and Associates Consulting
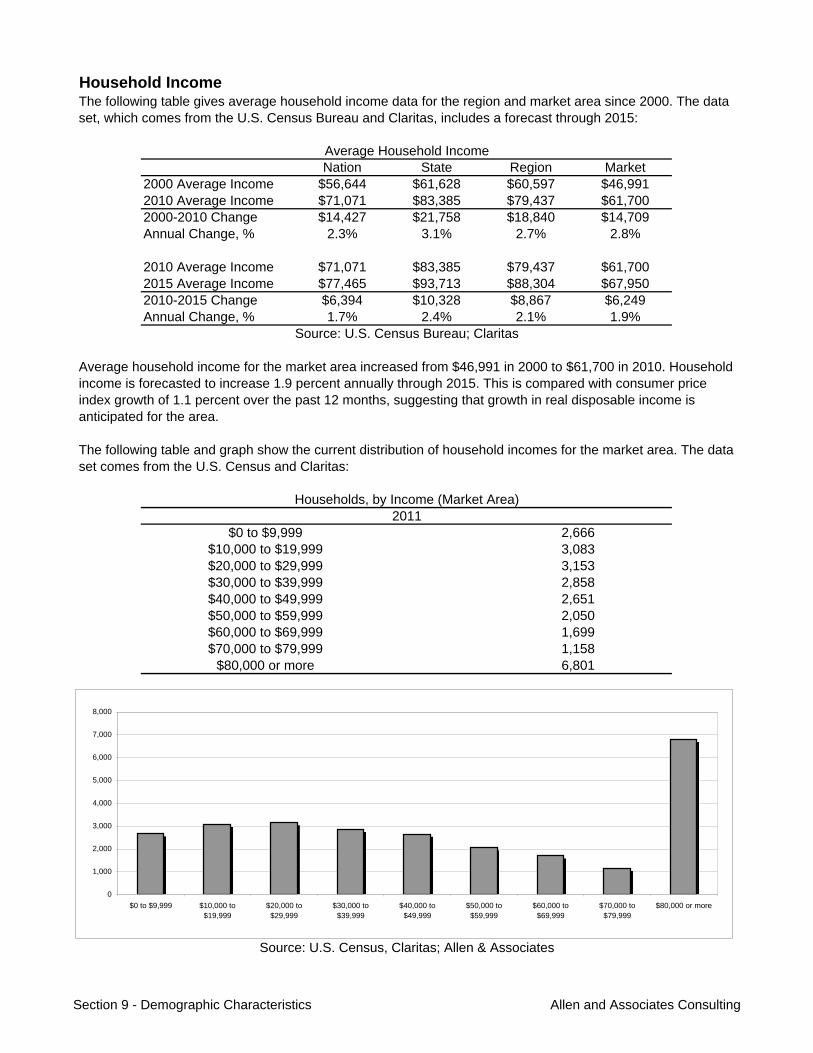
Household Income
Nation State Region Market2000 Average Income $56,644 $61,628 $60,597 $46,9912010 Average Income $71,071 $83,385 $79,437 $61,7002000-2010 Change $14,427 $21,758 $18,840 $14,709Annual Change, % 2.3% 3.1% 2.7% 2.8%
2010 Average Income $71,071 $83,385 $79,437 $61,7002015 Average Income $77,465 $93,713 $88,304 $67,9502010-2015 Change $6,394 $10,328 $8,867 $6,249Annual Change, % 1.7% 2.4% 2.1% 1.9%
1,6991,158
$60,000 to $69,999$70,000 to $79,999
$80,000 or more
2,6663,0833,1532,858
6,801
2,6512,050
$20,000 to $29,999$30,000 to $39,999$40,000 to $49,999$50,000 to $59,999
2011Households, by Income (Market Area)
The following table and graph show the current distribution of household incomes for the market area. The data set comes from the U.S. Census and Claritas:
The following table gives average household income data for the region and market area since 2000. The data set, which comes from the U.S. Census Bureau and Claritas, includes a forecast through 2015:
Source: U.S. Census, Claritas; Allen & Associates
Average Household Income
Source: U.S. Census Bureau; Claritas
$0 to $9,999
Average household income for the market area increased from $46,991 in 2000 to $61,700 in 2010. Household income is forecasted to increase 1.9 percent annually through 2015. This is compared with consumer price index growth of 1.1 percent over the past 12 months, suggesting that growth in real disposable income is anticipated for the area.
$10,000 to $19,999
0
1,000
2,000
3,000
4,000
5,000
6,000
7,000
8,000
$0 to $9,999 $10,000 to$19,999
$20,000 to$29,999
$30,000 to$39,999
$40,000 to$49,999
$50,000 to$59,999
$60,000 to$69,999
$70,000 to$79,999
$80,000 or more
Section 9 - Demographic Characteristics Allen and Associates Consulting
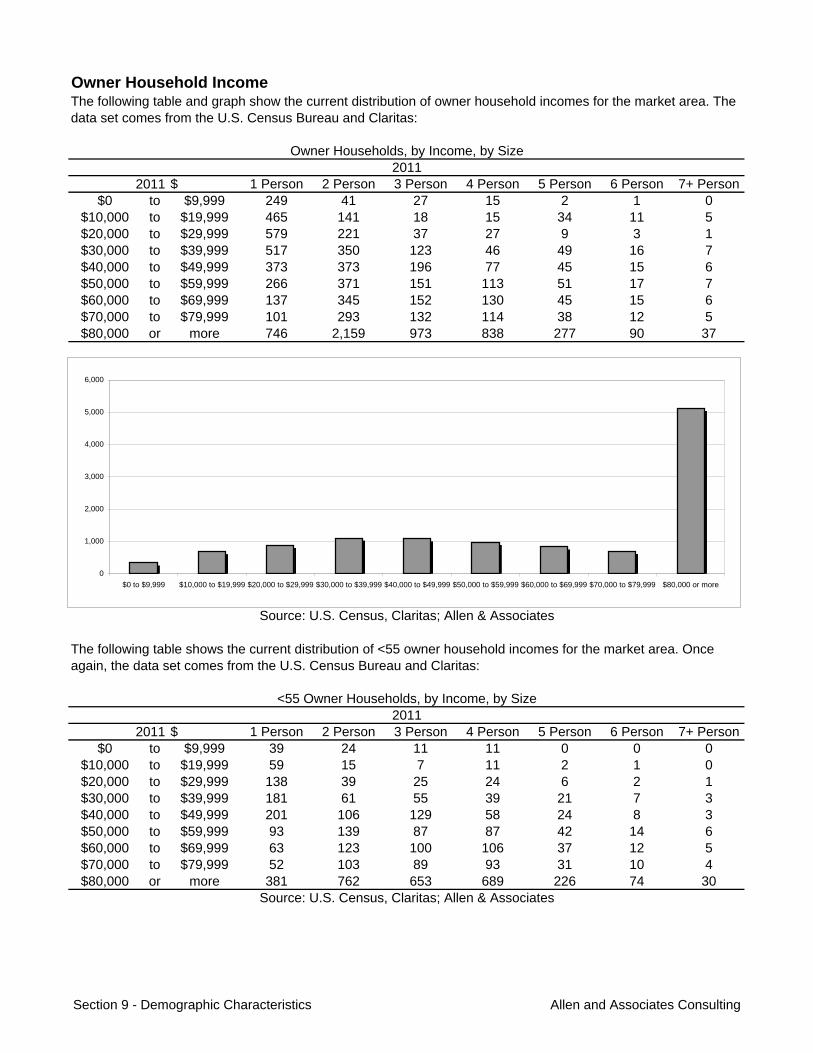
Owner Household Income
$ 1 Person 2 Person 3 Person 4 Person 5 Person 6 Person 7+ Person$0 to $9,999 249 41 27 15 2 1 0
$10,000 to $19,999 465 141 18 15 34 11 5$20,000 to $29,999 579 221 37 27 9 3 1$30,000 to $39,999 517 350 123 46 49 16 7$40,000 to $49,999 373 373 196 77 45 15 6$50,000 to $59,999 266 371 151 113 51 17 7$60,000 to $69,999 137 345 152 130 45 15 6$70,000 to $79,999 101 293 132 114 38 12 5$80,000 or more 746 2,159 973 838 277 90 37
$ 1 Person 2 Person 3 Person 4 Person 5 Person 6 Person 7+ Person$0 to $9,999 39 24 11 11 0 0 0
$10,000 to $19,999 59 15 7 11 2 1 0$20,000 to $29,999 138 39 25 24 6 2 1$30,000 to $39,999 181 61 55 39 21 7 3$40,000 to $49,999 201 106 129 58 24 8 3$50,000 to $59,999 93 139 87 87 42 14 6$60,000 to $69,999 63 123 100 106 37 12 5$70,000 to $79,999 52 103 89 93 31 10 4$80,000 or more 381 762 653 689 226 74 30
<55 Owner Households, by Income, by Size
2011
The following table and graph show the current distribution of owner household incomes for the market area. The data set comes from the U.S. Census Bureau and Claritas:
20112011
Source: U.S. Census, Claritas; Allen & Associates
Owner Households, by Income, by Size
The following table shows the current distribution of <55 owner household incomes for the market area. Once again, the data set comes from the U.S. Census Bureau and Claritas:
Source: U.S. Census, Claritas; Allen & Associates
2011
0
1,000
2,000
3,000
4,000
5,000
6,000
$0 to $9,999 $10,000 to $19,999 $20,000 to $29,999 $30,000 to $39,999 $40,000 to $49,999 $50,000 to $59,999 $60,000 to $69,999 $70,000 to $79,999 $80,000 or more
Section 9 - Demographic Characteristics Allen and Associates Consulting

$ 1 Person 2 Person 3 Person 4 Person 5 Person 6 Person 7+ Person$0 to $9,999 210 18 16 3 2 1 0
$10,000 to $19,999 406 125 12 4 32 10 4$20,000 to $29,999 441 182 12 3 3 1 0$30,000 to $39,999 336 289 67 7 28 9 4$40,000 to $49,999 172 266 67 20 21 7 3$50,000 to $59,999 173 232 64 27 9 3 1$60,000 to $69,999 74 222 52 24 8 3 1$70,000 to $79,999 50 190 43 20 7 2 1$80,000 or more 365 1,397 320 150 51 17 7
$ 1 Person 2 Person 3 Person 4 Person 5 Person 6 Person 7+ Person$0 to $9,999 186 13 6 1 1 0 0
$10,000 to $19,999 371 107 8 1 13 4 2$20,000 to $29,999 370 154 10 3 2 1 0$30,000 to $39,999 261 234 54 6 25 8 3$40,000 to $49,999 119 211 53 14 15 5 2$50,000 to $59,999 126 160 49 20 7 2 1$60,000 to $69,999 57 145 32 17 5 2 1$70,000 to $79,999 39 123 25 14 4 1 1$80,000 or more 290 903 188 107 33 11 4
$ 1 Person 2 Person 3 Person 4 Person 5 Person 6 Person 7+ Person$0 to $9,999 175 11 1 1 1 0 0
$10,000 to $19,999 357 99 6 0 5 2 1$20,000 to $29,999 340 142 9 2 1 0 0$30,000 to $39,999 229 210 48 6 24 8 3$40,000 to $49,999 97 187 48 12 12 4 2$50,000 to $59,999 105 129 43 18 6 2 1$60,000 to $69,999 50 111 24 14 4 1 1$70,000 to $79,999 35 94 18 12 3 1 0$80,000 or more 257 691 131 88 25 8 3
Source: U.S. Census, Claritas; Allen & Associates
55+ Owner Households, by Income, by Size
2011
Source: U.S. Census, Claritas; Allen & Associates
65+ Owner Households, by Income, by Size2011
2011
20112011
The following table shows the current distribution of 55+ owner household incomes for the market area. Once again, the data set comes from the U.S. Census Bureau and Claritas:
The following table shows the current distribution of 62+ owner household incomes for the market area. Once again, the data set comes from the U.S. Census Bureau and Claritas:
The following table shows the current distribution of 65+ owner household incomes for the market area. Once again, the data set comes from the U.S. Census Bureau and Claritas:
Source: U.S. Census, Claritas; Allen & Associates
62+ Owner Households, by Income, by Size2011
Section 9 - Demographic Characteristics Allen and Associates Consulting
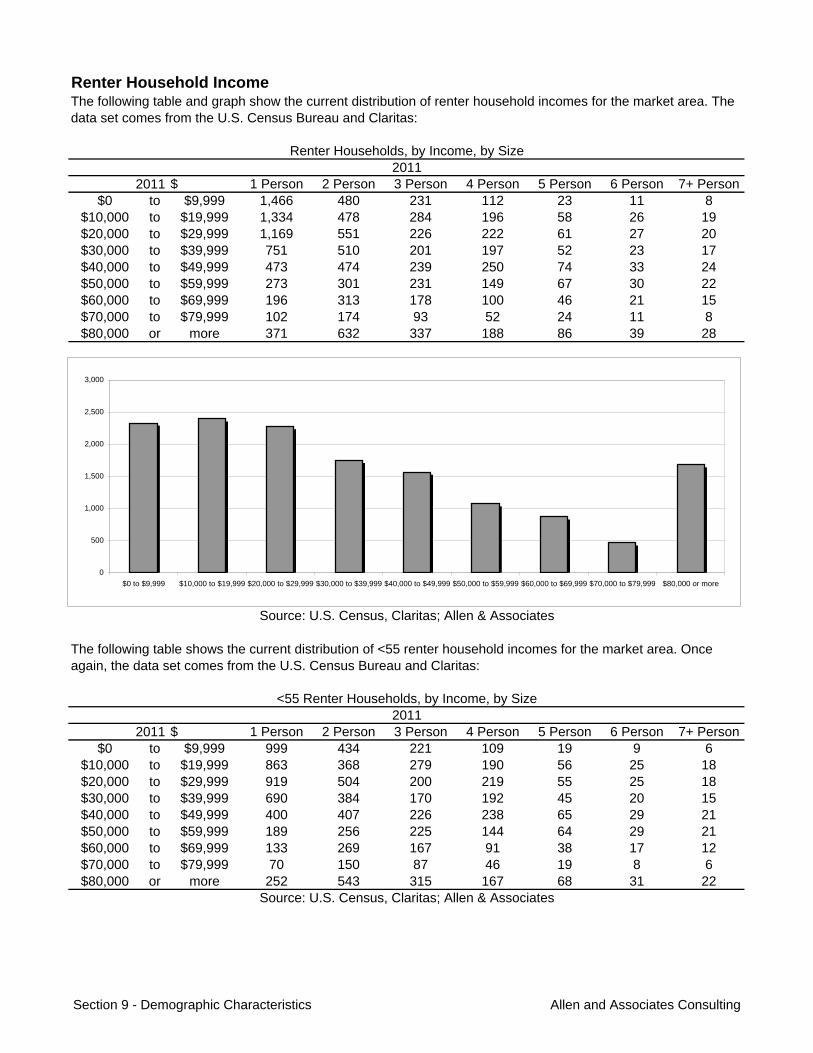
Renter Household Income
$ 1 Person 2 Person 3 Person 4 Person 5 Person 6 Person 7+ Person$0 to $9,999 1,466 480 231 112 23 11 8
$10,000 to $19,999 1,334 478 284 196 58 26 19$20,000 to $29,999 1,169 551 226 222 61 27 20$30,000 to $39,999 751 510 201 197 52 23 17$40,000 to $49,999 473 474 239 250 74 33 24$50,000 to $59,999 273 301 231 149 67 30 22$60,000 to $69,999 196 313 178 100 46 21 15$70,000 to $79,999 102 174 93 52 24 11 8$80,000 or more 371 632 337 188 86 39 28
$ 1 Person 2 Person 3 Person 4 Person 5 Person 6 Person 7+ Person$0 to $9,999 999 434 221 109 19 9 6
$10,000 to $19,999 863 368 279 190 56 25 18$20,000 to $29,999 919 504 200 219 55 25 18$30,000 to $39,999 690 384 170 192 45 20 15$40,000 to $49,999 400 407 226 238 65 29 21$50,000 to $59,999 189 256 225 144 64 29 21$60,000 to $69,999 133 269 167 91 38 17 12$70,000 to $79,999 70 150 87 46 19 8 6$80,000 or more 252 543 315 167 68 31 22
<55 Renter Households, by Income, by Size
2011
The following table and graph show the current distribution of renter household incomes for the market area. The data set comes from the U.S. Census Bureau and Claritas:
20112011
Source: U.S. Census, Claritas; Allen & Associates
Renter Households, by Income, by Size
The following table shows the current distribution of <55 renter household incomes for the market area. Once again, the data set comes from the U.S. Census Bureau and Claritas:
Source: U.S. Census, Claritas; Allen & Associates
2011
0
500
1,000
1,500
2,000
2,500
3,000
$0 to $9,999 $10,000 to $19,999 $20,000 to $29,999 $30,000 to $39,999 $40,000 to $49,999 $50,000 to $59,999 $60,000 to $69,999 $70,000 to $79,999 $80,000 or more
Section 9 - Demographic Characteristics Allen and Associates Consulting
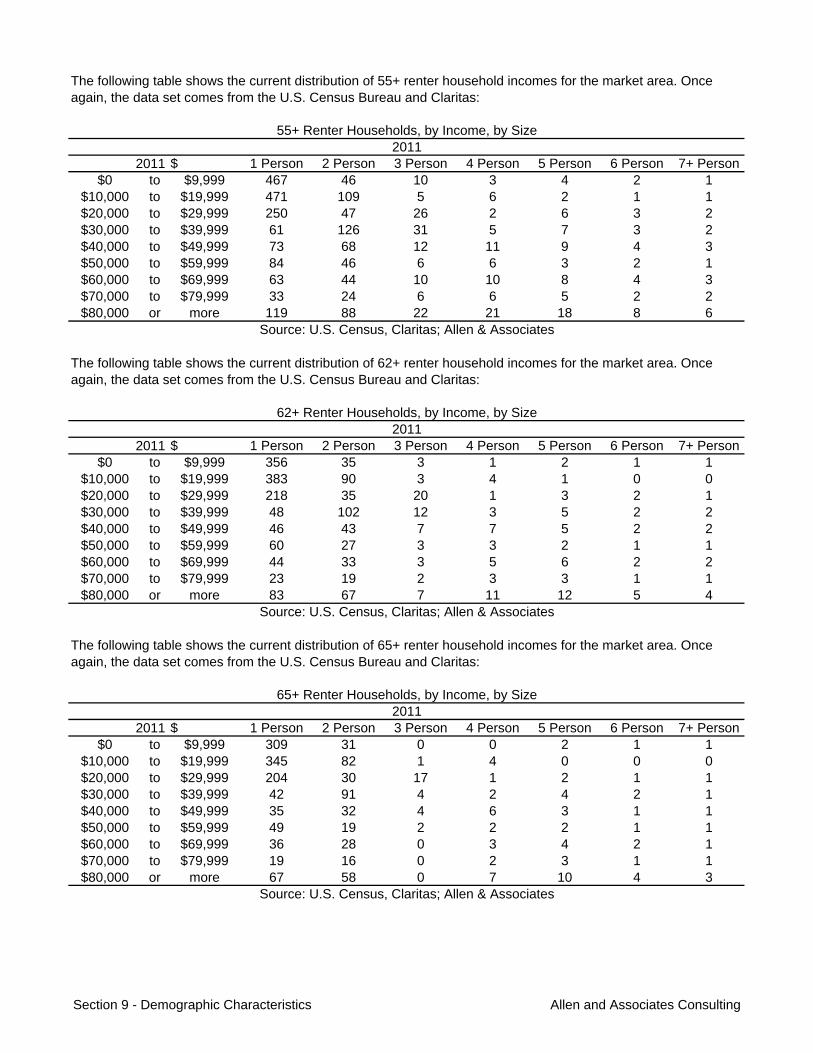
$ 1 Person 2 Person 3 Person 4 Person 5 Person 6 Person 7+ Person$0 to $9,999 467 46 10 3 4 2 1
$10,000 to $19,999 471 109 5 6 2 1 1$20,000 to $29,999 250 47 26 2 6 3 2$30,000 to $39,999 61 126 31 5 7 3 2$40,000 to $49,999 73 68 12 11 9 4 3$50,000 to $59,999 84 46 6 6 3 2 1$60,000 to $69,999 63 44 10 10 8 4 3$70,000 to $79,999 33 24 6 6 5 2 2$80,000 or more 119 88 22 21 18 8 6
$ 1 Person 2 Person 3 Person 4 Person 5 Person 6 Person 7+ Person$0 to $9,999 356 35 3 1 2 1 1
$10,000 to $19,999 383 90 3 4 1 0 0$20,000 to $29,999 218 35 20 1 3 2 1$30,000 to $39,999 48 102 12 3 5 2 2$40,000 to $49,999 46 43 7 7 5 2 2$50,000 to $59,999 60 27 3 3 2 1 1$60,000 to $69,999 44 33 3 5 6 2 2$70,000 to $79,999 23 19 2 3 3 1 1$80,000 or more 83 67 7 11 12 5 4
$ 1 Person 2 Person 3 Person 4 Person 5 Person 6 Person 7+ Person$0 to $9,999 309 31 0 0 2 1 1
$10,000 to $19,999 345 82 1 4 0 0 0$20,000 to $29,999 204 30 17 1 2 1 1$30,000 to $39,999 42 91 4 2 4 2 1$40,000 to $49,999 35 32 4 6 3 1 1$50,000 to $59,999 49 19 2 2 2 1 1$60,000 to $69,999 36 28 0 3 4 2 1$70,000 to $79,999 19 16 0 2 3 1 1$80,000 or more 67 58 0 7 10 4 3
Source: U.S. Census, Claritas; Allen & Associates
55+ Renter Households, by Income, by Size
2011
Source: U.S. Census, Claritas; Allen & Associates
65+ Renter Households, by Income, by Size2011
2011
20112011
The following table shows the current distribution of 55+ renter household incomes for the market area. Once again, the data set comes from the U.S. Census Bureau and Claritas:
The following table shows the current distribution of 62+ renter household incomes for the market area. Once again, the data set comes from the U.S. Census Bureau and Claritas:
The following table shows the current distribution of 65+ renter household incomes for the market area. Once again, the data set comes from the U.S. Census Bureau and Claritas:
Source: U.S. Census, Claritas; Allen & Associates
62+ Renter Households, by Income, by Size2011
Section 9 - Demographic Characteristics Allen and Associates Consulting
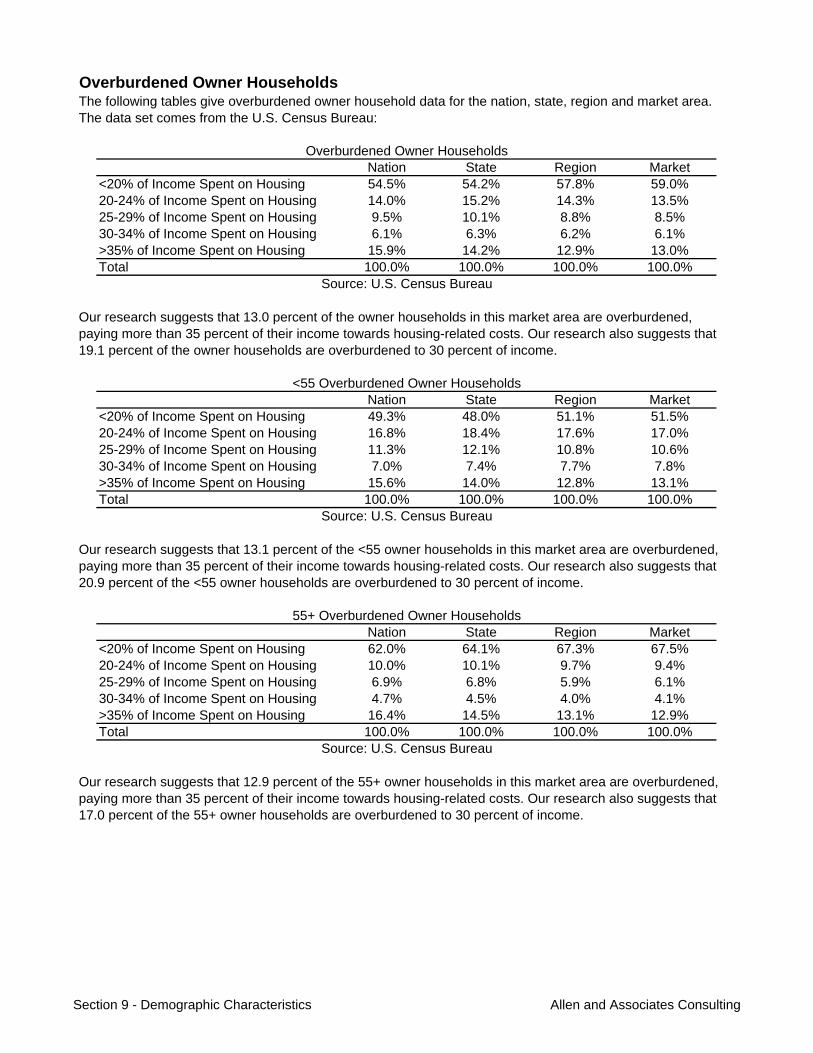
Overburdened Owner Households
Nation State Region Market<20% of Income Spent on Housing 54.5% 54.2% 57.8% 59.0%20-24% of Income Spent on Housing 14.0% 15.2% 14.3% 13.5%25-29% of Income Spent on Housing 9.5% 10.1% 8.8% 8.5%30-34% of Income Spent on Housing 6.1% 6.3% 6.2% 6.1%>35% of Income Spent on Housing 15.9% 14.2% 12.9% 13.0%Total 100.0% 100.0% 100.0% 100.0%
Nation State Region Market<20% of Income Spent on Housing 49.3% 48.0% 51.1% 51.5%20-24% of Income Spent on Housing 16.8% 18.4% 17.6% 17.0%25-29% of Income Spent on Housing 11.3% 12.1% 10.8% 10.6%30-34% of Income Spent on Housing 7.0% 7.4% 7.7% 7.8%>35% of Income Spent on Housing 15.6% 14.0% 12.8% 13.1%Total 100.0% 100.0% 100.0% 100.0%
Nation State Region Market<20% of Income Spent on Housing 62.0% 64.1% 67.3% 67.5%20-24% of Income Spent on Housing 10.0% 10.1% 9.7% 9.4%25-29% of Income Spent on Housing 6.9% 6.8% 5.9% 6.1%30-34% of Income Spent on Housing 4.7% 4.5% 4.0% 4.1%>35% of Income Spent on Housing 16.4% 14.5% 13.1% 12.9%Total 100.0% 100.0% 100.0% 100.0%
55+ Overburdened Owner Households
Source: U.S. Census Bureau
<55 Overburdened Owner Households
Source: U.S. Census Bureau
The following tables give overburdened owner household data for the nation, state, region and market area. The data set comes from the U.S. Census Bureau:
Our research suggests that 13.0 percent of the owner households in this market area are overburdened, paying more than 35 percent of their income towards housing-related costs. Our research also suggests that 19.1 percent of the owner households are overburdened to 30 percent of income.
Our research suggests that 13.1 percent of the <55 owner households in this market area are overburdened, paying more than 35 percent of their income towards housing-related costs. Our research also suggests that 20.9 percent of the <55 owner households are overburdened to 30 percent of income.
Our research suggests that 12.9 percent of the 55+ owner households in this market area are overburdened, paying more than 35 percent of their income towards housing-related costs. Our research also suggests that 17.0 percent of the 55+ owner households are overburdened to 30 percent of income.
Overburdened Owner Households
Source: U.S. Census Bureau
Section 9 - Demographic Characteristics Allen and Associates Consulting
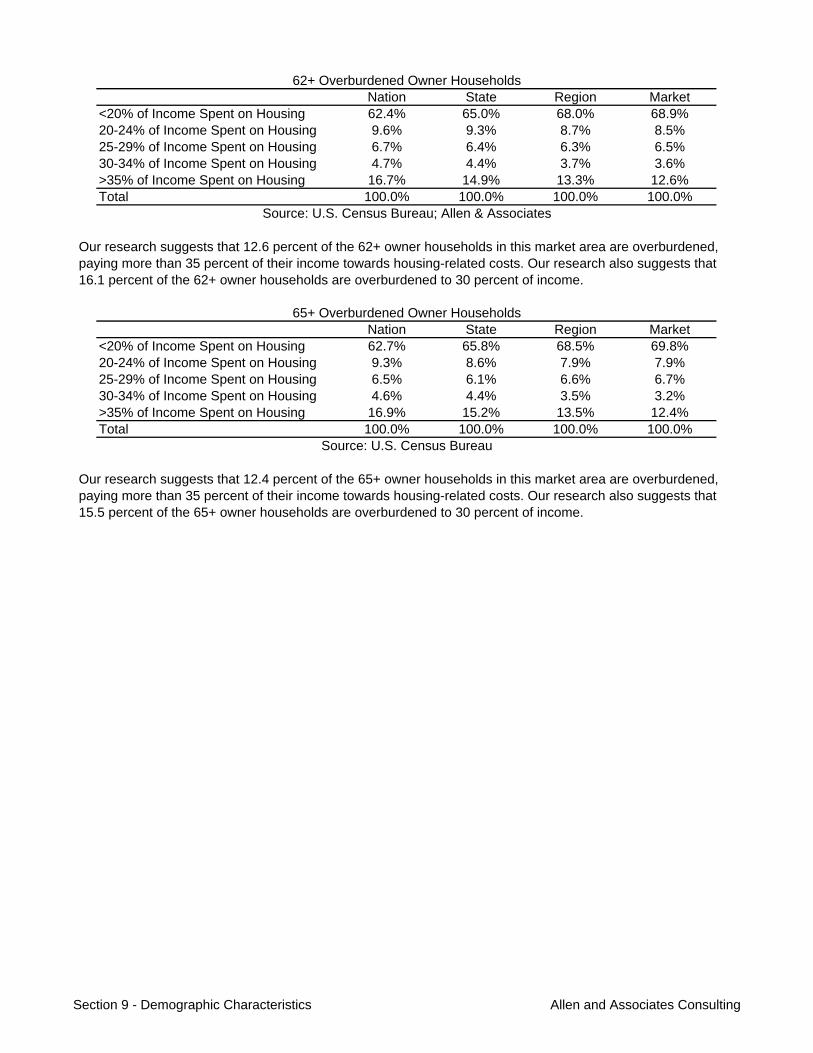
Nation State Region Market<20% of Income Spent on Housing 62.4% 65.0% 68.0% 68.9%20-24% of Income Spent on Housing 9.6% 9.3% 8.7% 8.5%25-29% of Income Spent on Housing 6.7% 6.4% 6.3% 6.5%30-34% of Income Spent on Housing 4.7% 4.4% 3.7% 3.6%>35% of Income Spent on Housing 16.7% 14.9% 13.3% 12.6%Total 100.0% 100.0% 100.0% 100.0%
Nation State Region Market<20% of Income Spent on Housing 62.7% 65.8% 68.5% 69.8%20-24% of Income Spent on Housing 9.3% 8.6% 7.9% 7.9%25-29% of Income Spent on Housing 6.5% 6.1% 6.6% 6.7%30-34% of Income Spent on Housing 4.6% 4.4% 3.5% 3.2%>35% of Income Spent on Housing 16.9% 15.2% 13.5% 12.4%Total 100.0% 100.0% 100.0% 100.0%
65+ Overburdened Owner Households
Source: U.S. Census Bureau
62+ Overburdened Owner Households
Source: U.S. Census Bureau; Allen & Associates
Our research suggests that 12.6 percent of the 62+ owner households in this market area are overburdened, paying more than 35 percent of their income towards housing-related costs. Our research also suggests that 16.1 percent of the 62+ owner households are overburdened to 30 percent of income.
Our research suggests that 12.4 percent of the 65+ owner households in this market area are overburdened, paying more than 35 percent of their income towards housing-related costs. Our research also suggests that 15.5 percent of the 65+ owner households are overburdened to 30 percent of income.
Section 9 - Demographic Characteristics Allen and Associates Consulting
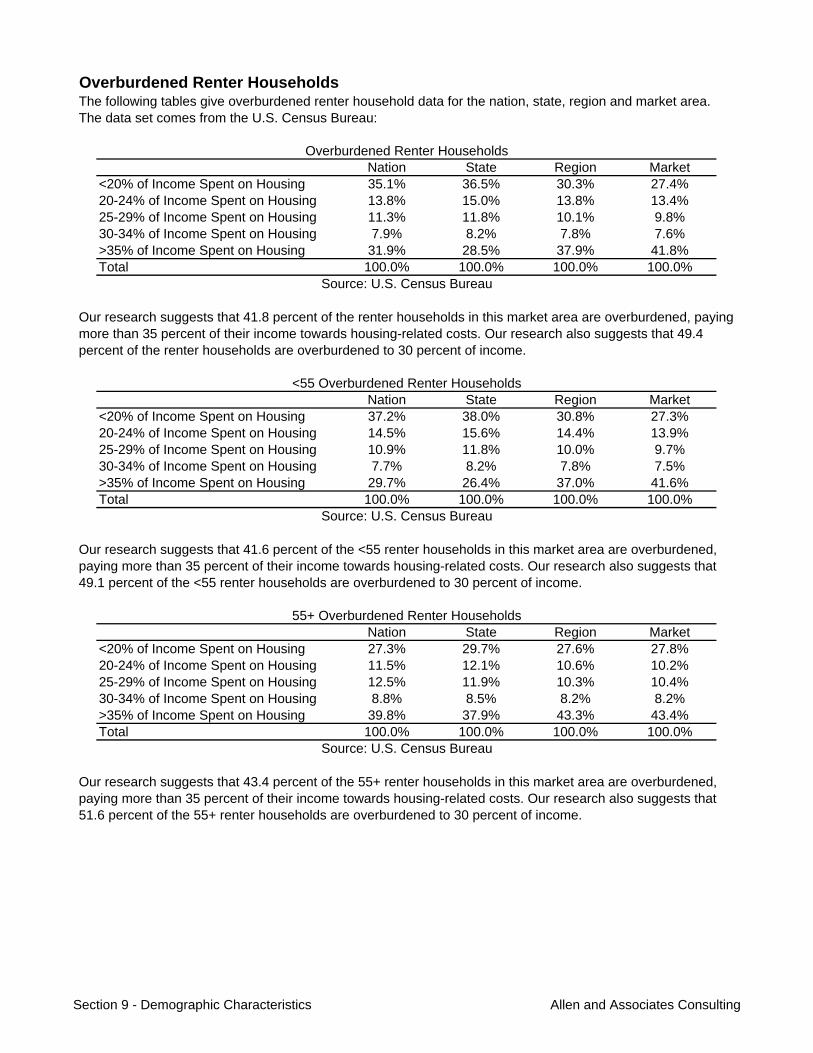
Overburdened Renter Households
Nation State Region Market<20% of Income Spent on Housing 35.1% 36.5% 30.3% 27.4%20-24% of Income Spent on Housing 13.8% 15.0% 13.8% 13.4%25-29% of Income Spent on Housing 11.3% 11.8% 10.1% 9.8%30-34% of Income Spent on Housing 7.9% 8.2% 7.8% 7.6%>35% of Income Spent on Housing 31.9% 28.5% 37.9% 41.8%Total 100.0% 100.0% 100.0% 100.0%
Nation State Region Market<20% of Income Spent on Housing 37.2% 38.0% 30.8% 27.3%20-24% of Income Spent on Housing 14.5% 15.6% 14.4% 13.9%25-29% of Income Spent on Housing 10.9% 11.8% 10.0% 9.7%30-34% of Income Spent on Housing 7.7% 8.2% 7.8% 7.5%>35% of Income Spent on Housing 29.7% 26.4% 37.0% 41.6%Total 100.0% 100.0% 100.0% 100.0%
Nation State Region Market<20% of Income Spent on Housing 27.3% 29.7% 27.6% 27.8%20-24% of Income Spent on Housing 11.5% 12.1% 10.6% 10.2%25-29% of Income Spent on Housing 12.5% 11.9% 10.3% 10.4%30-34% of Income Spent on Housing 8.8% 8.5% 8.2% 8.2%>35% of Income Spent on Housing 39.8% 37.9% 43.3% 43.4%Total 100.0% 100.0% 100.0% 100.0%
55+ Overburdened Renter Households
Source: U.S. Census Bureau
<55 Overburdened Renter Households
Source: U.S. Census Bureau
The following tables give overburdened renter household data for the nation, state, region and market area. The data set comes from the U.S. Census Bureau:
Our research suggests that 41.8 percent of the renter households in this market area are overburdened, paying more than 35 percent of their income towards housing-related costs. Our research also suggests that 49.4 percent of the renter households are overburdened to 30 percent of income.
Our research suggests that 41.6 percent of the <55 renter households in this market area are overburdened, paying more than 35 percent of their income towards housing-related costs. Our research also suggests that 49.1 percent of the <55 renter households are overburdened to 30 percent of income.
Our research suggests that 43.4 percent of the 55+ renter households in this market area are overburdened, paying more than 35 percent of their income towards housing-related costs. Our research also suggests that 51.6 percent of the 55+ renter households are overburdened to 30 percent of income.
Overburdened Renter Households
Source: U.S. Census Bureau
Section 9 - Demographic Characteristics Allen and Associates Consulting
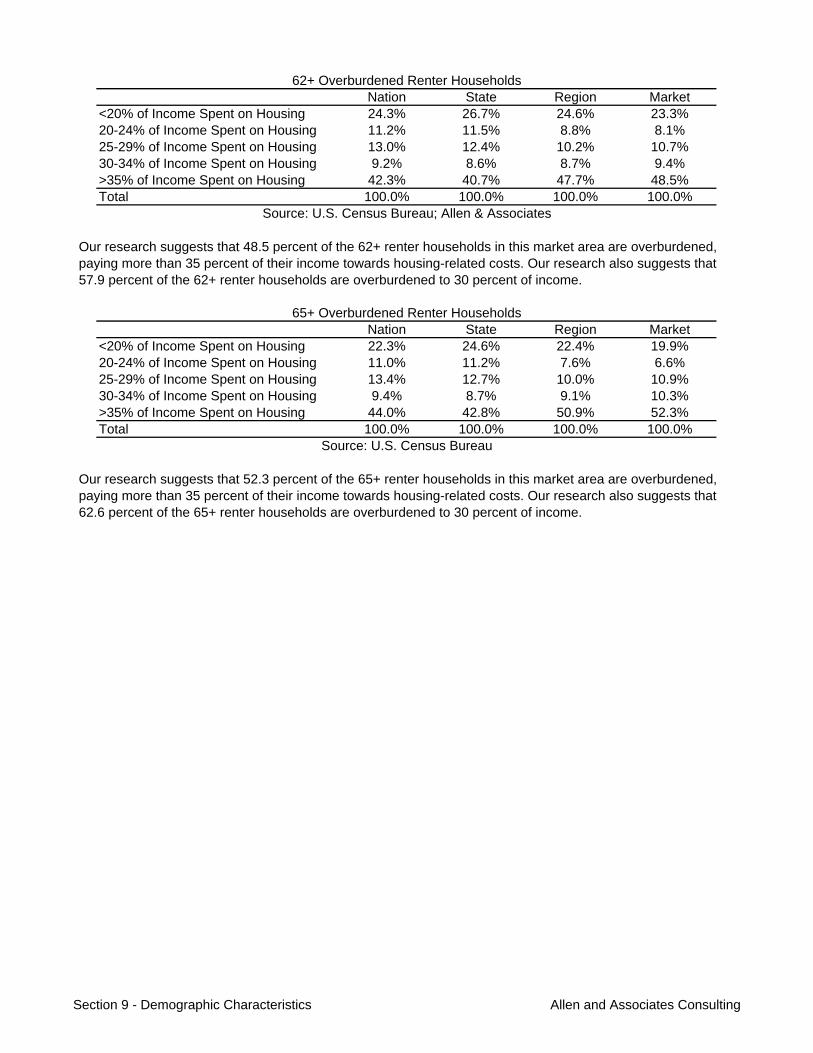
Nation State Region Market<20% of Income Spent on Housing 24.3% 26.7% 24.6% 23.3%20-24% of Income Spent on Housing 11.2% 11.5% 8.8% 8.1%25-29% of Income Spent on Housing 13.0% 12.4% 10.2% 10.7%30-34% of Income Spent on Housing 9.2% 8.6% 8.7% 9.4%>35% of Income Spent on Housing 42.3% 40.7% 47.7% 48.5%Total 100.0% 100.0% 100.0% 100.0%
Nation State Region Market<20% of Income Spent on Housing 22.3% 24.6% 22.4% 19.9%20-24% of Income Spent on Housing 11.0% 11.2% 7.6% 6.6%25-29% of Income Spent on Housing 13.4% 12.7% 10.0% 10.9%30-34% of Income Spent on Housing 9.4% 8.7% 9.1% 10.3%>35% of Income Spent on Housing 44.0% 42.8% 50.9% 52.3%Total 100.0% 100.0% 100.0% 100.0%
65+ Overburdened Renter Households
Source: U.S. Census Bureau
62+ Overburdened Renter Households
Source: U.S. Census Bureau; Allen & Associates
Our research suggests that 48.5 percent of the 62+ renter households in this market area are overburdened, paying more than 35 percent of their income towards housing-related costs. Our research also suggests that 57.9 percent of the 62+ renter households are overburdened to 30 percent of income.
Our research suggests that 52.3 percent of the 65+ renter households in this market area are overburdened, paying more than 35 percent of their income towards housing-related costs. Our research also suggests that 62.6 percent of the 65+ renter households are overburdened to 30 percent of income.
Section 9 - Demographic Characteristics Allen and Associates Consulting
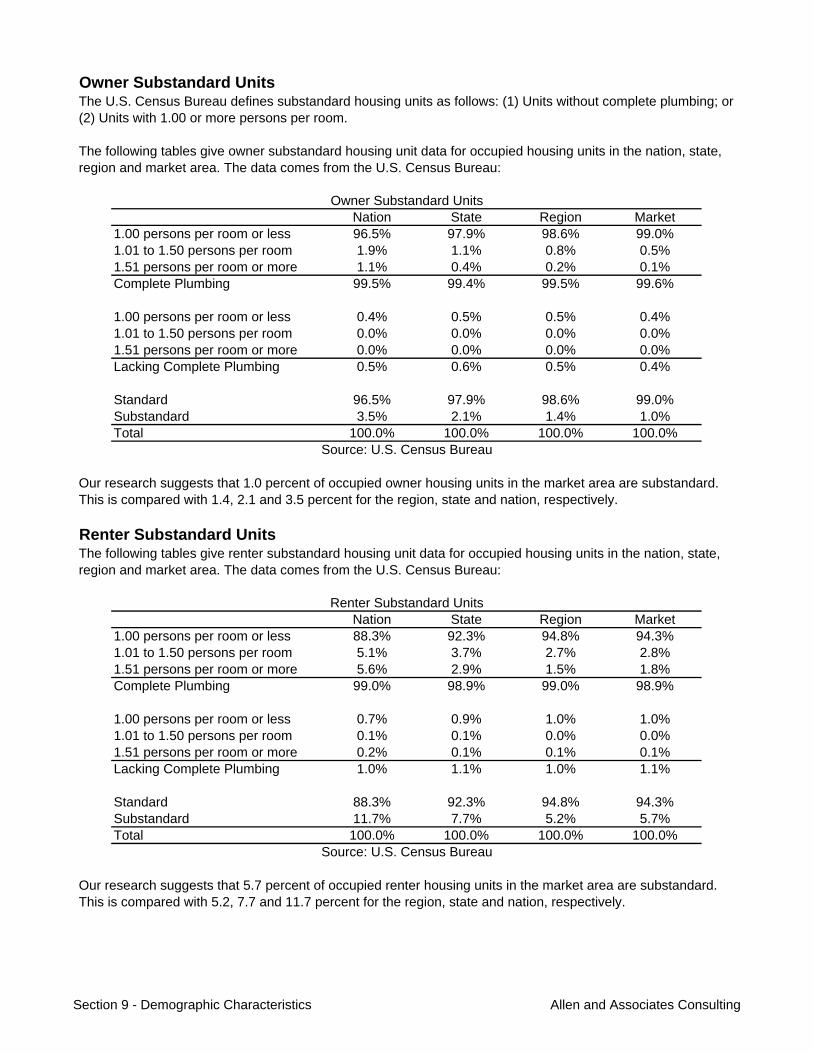
Owner Substandard Units
Nation State Region Market1.00 persons per room or less 96.5% 97.9% 98.6% 99.0%1.01 to 1.50 persons per room 1.9% 1.1% 0.8% 0.5%1.51 persons per room or more 1.1% 0.4% 0.2% 0.1%Complete Plumbing 99.5% 99.4% 99.5% 99.6%
1.00 persons per room or less 0.4% 0.5% 0.5% 0.4%1.01 to 1.50 persons per room 0.0% 0.0% 0.0% 0.0%1.51 persons per room or more 0.0% 0.0% 0.0% 0.0%Lacking Complete Plumbing 0.5% 0.6% 0.5% 0.4%
Standard 96.5% 97.9% 98.6% 99.0%Substandard 3.5% 2.1% 1.4% 1.0%Total 100.0% 100.0% 100.0% 100.0%
Renter Substandard Units
Nation State Region Market1.00 persons per room or less 88.3% 92.3% 94.8% 94.3%1.01 to 1.50 persons per room 5.1% 3.7% 2.7% 2.8%1.51 persons per room or more 5.6% 2.9% 1.5% 1.8%Complete Plumbing 99.0% 98.9% 99.0% 98.9%
1.00 persons per room or less 0.7% 0.9% 1.0% 1.0%1.01 to 1.50 persons per room 0.1% 0.1% 0.0% 0.0%1.51 persons per room or more 0.2% 0.1% 0.1% 0.1%Lacking Complete Plumbing 1.0% 1.1% 1.0% 1.1%
Standard 88.3% 92.3% 94.8% 94.3%Substandard 11.7% 7.7% 5.2% 5.7%Total 100.0% 100.0% 100.0% 100.0%
Our research suggests that 5.7 percent of occupied renter housing units in the market area are substandard. This is compared with 5.2, 7.7 and 11.7 percent for the region, state and nation, respectively.
Renter Substandard Units
Source: U.S. Census Bureau
Owner Substandard Units
Source: U.S. Census Bureau
Our research suggests that 1.0 percent of occupied owner housing units in the market area are substandard. This is compared with 1.4, 2.1 and 3.5 percent for the region, state and nation, respectively.
The U.S. Census Bureau defines substandard housing units as follows: (1) Units without complete plumbing; or (2) Units with 1.00 or more persons per room.
The following tables give owner substandard housing unit data for occupied housing units in the nation, state, region and market area. The data comes from the U.S. Census Bureau:
The following tables give renter substandard housing unit data for occupied housing units in the nation, state, region and market area. The data comes from the U.S. Census Bureau:
Section 9 - Demographic Characteristics Allen and Associates Consulting

Owner Movership
1 Person 2 Person 3 Person 4 Person 5 Person 6 Person 7+ Person TotalOwner to Owner 2.9% 4.6% 5.9% 5.9% 6.3% 6.9% 8.0% 4.9%Owner to Renter 2.8% 2.6% 4.7% 4.4% 4.3% 6.6% 10.0% 3.6%Owner Movership Rate 5.7% 7.2% 10.6% 10.2% 10.7% 13.4% 18.0% 8.4%
1 Person 2 Person 3 Person 4 Person 5 Person 6 Person 7+ Person TotalOwner to Owner 2.0% 2.8% 2.3% 1.6% 3.1% 1.0% 3.7% 2.4%Owner to Renter 1.7% 0.8% 1.4% 2.1% 0.6% 2.6% 0.0% 1.2%Owner Movership Rate 3.7% 3.7% 3.7% 3.7% 3.7% 3.7% 3.7% 3.7%
Renter Movership
1 Person 2 Person 3 Person 4 Person 5 Person 6 Person 7+ Person TotalRenter to Renter 13.3% 29.6% 41.8% 50.2% 50.8% 55.0% 84.9% 30.0%Renter to Owner 3.2% 12.1% 12.3% 15.7% 17.2% 13.3% 15.7% 9.5%Renter Movership Rate 16.5% 41.7% 54.1% 65.9% 68.0% 68.3% 100.6% 39.5%
1 Person 2 Person 3 Person 4 Person 5 Person 6 Person 7+ Person TotalRenter to Renter 7.4% 6.6% 7.2% 7.6% 6.0% 7.8% 0.0% 7.1%Renter to Owner 0.6% 1.4% 0.7% 0.4% 2.0% 0.2% 8.0% 0.9%Renter Movership Rate 8.0% 8.0% 8.0% 8.0% 8.0% 8.0% 8.0% 8.0%
Our research suggests a renter movership rate of 39.5 percent, consisting of 30.0 percent renter to renter and 9.5 percent renter to owner movership.
Renter Movership, by Size
Our research suggests an elderly renter movership rate of 8.0 percent, consisting of 7.1 percent renter to renter and 0.9 percent renter to owner movership.
Elderly Renter Movership, by SizeAHS Survey
Source: U.S. Census, American Housing Survey; Allen & Associates
Source: U.S. Census, American Housing Survey; Allen & Associates
Elderly Owner Movership, by SizeAHS Survey
Source: U.S. Census, American Housing Survey; Allen & Associates
Market Area
Our research suggests an elderly owner movership rate of 3.7 percent, consisting of 2.4 percent owner to owner and 1.2 percent owner to renter movership.
The following tables give renter household movership data for the market area with an estimated breakout by household size. The data comes from the U.S. Census Bureau and the American Housing Survey:
The following tables give owner household movership data for the market area with an estimated breakout by household size. The data comes from the U.S. Census Bureau and the American Housing Survey:
Our research suggests an owner movership rate of 8.4 percent, consisting of 4.9 percent owner to owner and 3.6 percent owner to renter movership.
Owner Movership, by Size
Source: U.S. Census, American Housing Survey; Allen & Associates
Market Area
Section 9 - Demographic Characteristics Allen and Associates Consulting
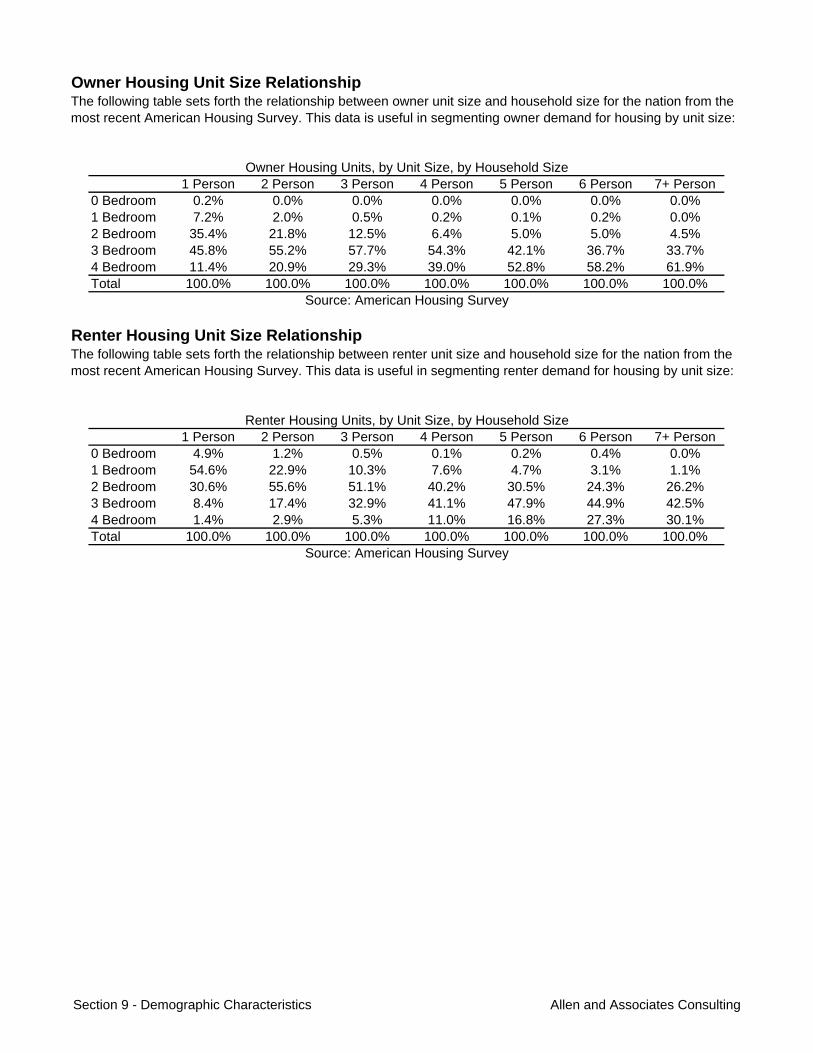
Owner Housing Unit Size Relationship
1 Person 2 Person 3 Person 4 Person 5 Person 6 Person 7+ Person0 Bedroom 0.2% 0.0% 0.0% 0.0% 0.0% 0.0% 0.0%1 Bedroom 7.2% 2.0% 0.5% 0.2% 0.1% 0.2% 0.0%2 Bedroom 35.4% 21.8% 12.5% 6.4% 5.0% 5.0% 4.5%3 Bedroom 45.8% 55.2% 57.7% 54.3% 42.1% 36.7% 33.7%4 Bedroom 11.4% 20.9% 29.3% 39.0% 52.8% 58.2% 61.9%Total 100.0% 100.0% 100.0% 100.0% 100.0% 100.0% 100.0%
Renter Housing Unit Size Relationship
1 Person 2 Person 3 Person 4 Person 5 Person 6 Person 7+ Person0 Bedroom 4.9% 1.2% 0.5% 0.1% 0.2% 0.4% 0.0%1 Bedroom 54.6% 22.9% 10.3% 7.6% 4.7% 3.1% 1.1%2 Bedroom 30.6% 55.6% 51.1% 40.2% 30.5% 24.3% 26.2%3 Bedroom 8.4% 17.4% 32.9% 41.1% 47.9% 44.9% 42.5%4 Bedroom 1.4% 2.9% 5.3% 11.0% 16.8% 27.3% 30.1%Total 100.0% 100.0% 100.0% 100.0% 100.0% 100.0% 100.0%
Source: American Housing Survey
Owner Housing Units, by Unit Size, by Household Size
Source: American Housing Survey
The following table sets forth the relationship between owner unit size and household size for the nation from the most recent American Housing Survey. This data is useful in segmenting owner demand for housing by unit size:
The following table sets forth the relationship between renter unit size and household size for the nation from the most recent American Housing Survey. This data is useful in segmenting renter demand for housing by unit size:
Renter Housing Units, by Unit Size, by Household Size
Section 9 - Demographic Characteristics Allen and Associates Consulting
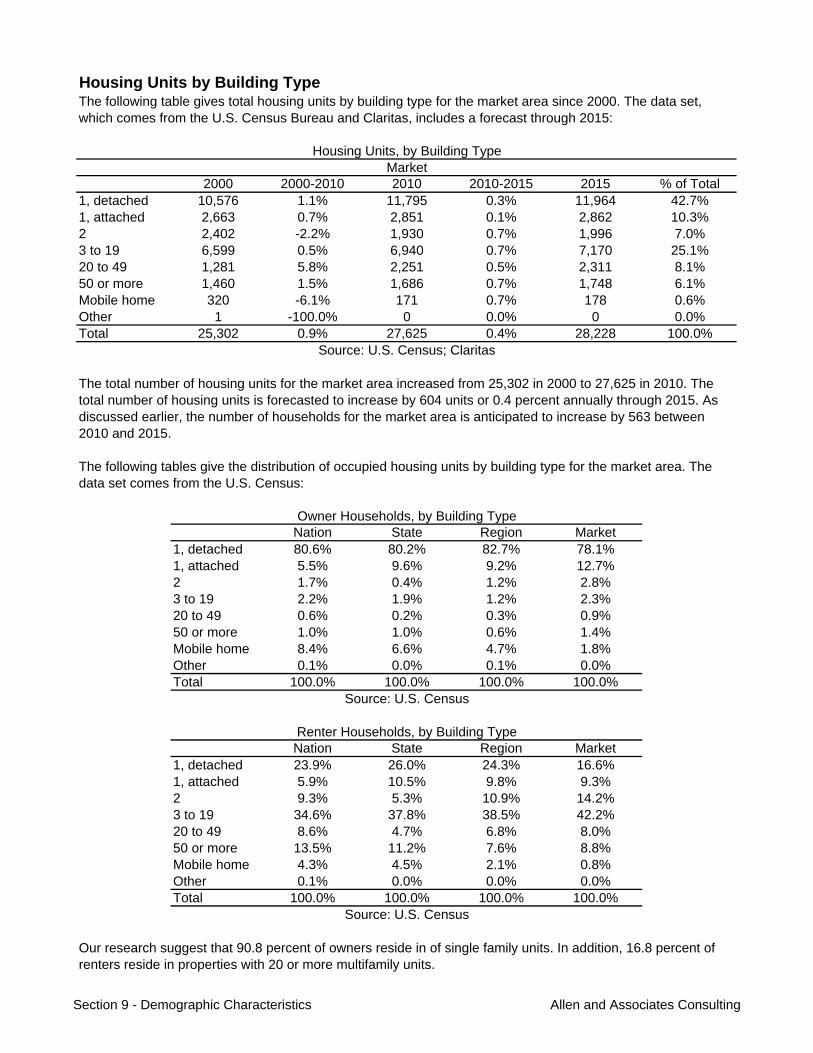
Housing Units by Building Type
2000 2000-2010 2010 2010-2015 2015 % of Total1, detached 10,576 1.1% 11,795 0.3% 11,964 42.7%1, attached 2,663 0.7% 2,851 0.1% 2,862 10.3%2 2,402 -2.2% 1,930 0.7% 1,996 7.0%3 to 19 6,599 0.5% 6,940 0.7% 7,170 25.1%20 to 49 1,281 5.8% 2,251 0.5% 2,311 8.1%50 or more 1,460 1.5% 1,686 0.7% 1,748 6.1%Mobile home 320 -6.1% 171 0.7% 178 0.6%Other 1 -100.0% 0 0.0% 0 0.0%Total 25,302 0.9% 27,625 0.4% 28,228 100.0%
Nation State Region Market1, detached 80.6% 80.2% 82.7% 78.1%1, attached 5.5% 9.6% 9.2% 12.7%2 1.7% 0.4% 1.2% 2.8%3 to 19 2.2% 1.9% 1.2% 2.3%20 to 49 0.6% 0.2% 0.3% 0.9%50 or more 1.0% 1.0% 0.6% 1.4%Mobile home 8.4% 6.6% 4.7% 1.8%Other 0.1% 0.0% 0.1% 0.0%Total 100.0% 100.0% 100.0% 100.0%
Nation State Region Market1, detached 23.9% 26.0% 24.3% 16.6%1, attached 5.9% 10.5% 9.8% 9.3%2 9.3% 5.3% 10.9% 14.2%3 to 19 34.6% 37.8% 38.5% 42.2%20 to 49 8.6% 4.7% 6.8% 8.0%50 or more 13.5% 11.2% 7.6% 8.8%Mobile home 4.3% 4.5% 2.1% 0.8%Other 0.1% 0.0% 0.0% 0.0%Total 100.0% 100.0% 100.0% 100.0%
Market
The following tables give the distribution of occupied housing units by building type for the market area. The data set comes from the U.S. Census:
Our research suggest that 90.8 percent of owners reside in of single family units. In addition, 16.8 percent of renters reside in properties with 20 or more multifamily units.
The following table gives total housing units by building type for the market area since 2000. The data set, which comes from the U.S. Census Bureau and Claritas, includes a forecast through 2015:
The total number of housing units for the market area increased from 25,302 in 2000 to 27,625 in 2010. The total number of housing units is forecasted to increase by 604 units or 0.4 percent annually through 2015. As discussed earlier, the number of households for the market area is anticipated to increase by 563 between 2010 and 2015.
Source: U.S. Census; Claritas
Housing Units, by Building Type
Source: U.S. Census
Owner Households, by Building Type
Renter Households, by Building Type
Source: U.S. Census
Section 9 - Demographic Characteristics Allen and Associates Consulting
Overview
Our supply analysis includes a breakdown of confirmed market area properties by rent type, project status, year built, and financing source. We also include a rent, unit mix, and amenity summary for confirmed market area properties. Finally, we provide summary of vouchers, concessions, and waiting lists for the properties included in this report. This information is also found in the pages that follow.
SUPPLY ANALYSIS
After accounting for any unconfirmed properties and any properties that are located outside the defined market area, we arrived at a list of confirmed market area properties. This is the listing of properties upon which our analysis is based. In our opinion, the properties included on this list give a credible picture of market conditions as of the effective date of this report. This listing is found in the pages that follow.
In conducting our analysis, we attempted to obtain information on every multifamily property with 20 or more units in the market area. Our analysis included conventionally financed multifamily communities as well as properties financed by the local housing authority and the state housing finance agency. Our analysis also included properties financed by and/or subsidized by USDA and/or HUD. Finally, our analysis included properties that are either proposed or currently under construction. The result was a comprehensive listing of projects with 20 or more units - whether existing, under construction, or proposed - for this area. Our rental property inventory listing is found in the pages that follow.
A map showing the location of the properties included in the rental property inventory is found in the pages that follow. Properties identified with red pushpins have 100 percent market rate units (market rate properties), properties identified with yellow pushpins have a mixture of market rate / restricted / subsidized units (restricted properties), and properties identified with blue pushpins have 100 percent project-based rental assistance (subsidized properties).
In this section we conduct an analysis of multifamily housing supply for the market area. Our analysis uses the market area definition presented previously in this report.
Section 10 - Supply Analysis Allen and Associates Consulting
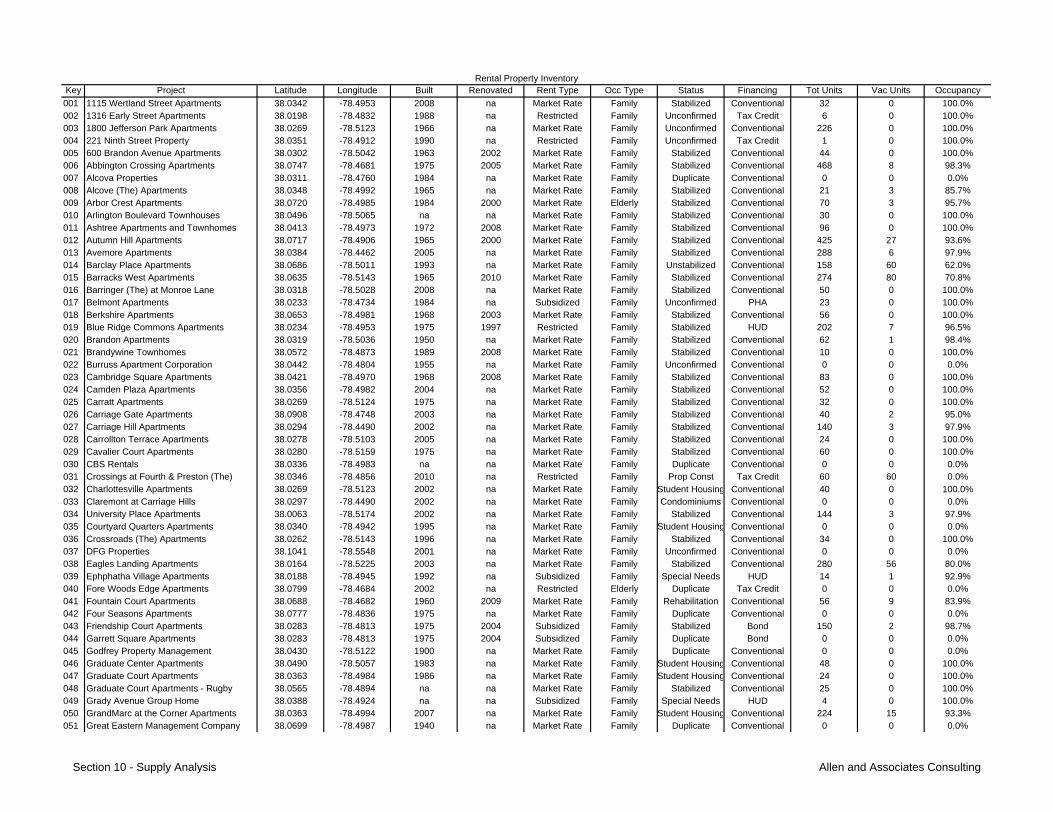
Key Project Latitude Longitude Built Renovated Rent Type Occ Type Status Financing Tot Units Vac Units Occupancy
001 1115 Wertland Street Apartments 38.0342 -78.4953 2008 na Market Rate Family Stabilized Conventional 32 0 100.0%002 1316 Early Street Apartments 38.0198 -78.4832 1988 na Restricted Family Unconfirmed Tax Credit 6 0 100.0%003 1800 Jefferson Park Apartments 38.0269 -78.5123 1966 na Market Rate Family Unconfirmed Conventional 226 0 100.0%004 221 Ninth Street Property 38.0351 -78.4912 1990 na Restricted Family Unconfirmed Tax Credit 1 0 100.0%005 600 Brandon Avenue Apartments 38.0302 -78.5042 1963 2002 Market Rate Family Stabilized Conventional 44 0 100.0%006 Abbington Crossing Apartments 38.0747 -78.4681 1975 2005 Market Rate Family Stabilized Conventional 468 8 98.3%007 Alcova Properties 38.0311 -78.4760 1984 na Market Rate Family Duplicate Conventional 0 0 0.0%008 Alcove (The) Apartments 38.0348 -78.4992 1965 na Market Rate Family Stabilized Conventional 21 3 85.7%009 Arbor Crest Apartments 38.0720 -78.4985 1984 2000 Market Rate Elderly Stabilized Conventional 70 3 95.7%010 Arlington Boulevard Townhouses 38.0496 -78.5065 na na Market Rate Family Stabilized Conventional 30 0 100.0%011 Ashtree Apartments and Townhomes 38.0413 -78.4973 1972 2008 Market Rate Family Stabilized Conventional 96 0 100.0%012 Autumn Hill Apartments 38.0717 -78.4906 1965 2000 Market Rate Family Stabilized Conventional 425 27 93.6%013 Avemore Apartments 38.0384 -78.4462 2005 na Market Rate Family Stabilized Conventional 288 6 97.9%014 Barclay Place Apartments 38.0686 -78.5011 1993 na Market Rate Family Unstabilized Conventional 158 60 62.0%015 Barracks West Apartments 38.0635 -78.5143 1965 2010 Market Rate Family Stabilized Conventional 274 80 70.8%016 Barringer (The) at Monroe Lane 38.0318 -78.5028 2008 na Market Rate Family Stabilized Conventional 50 0 100.0%017 Belmont Apartments 38.0233 -78.4734 1984 na Subsidized Family Unconfirmed PHA 23 0 100.0%018 Berkshire Apartments 38.0653 -78.4981 1968 2003 Market Rate Family Stabilized Conventional 56 0 100.0%019 Blue Ridge Commons Apartments 38.0234 -78.4953 1975 1997 Restricted Family Stabilized HUD 202 7 96.5%020 Brandon Apartments 38.0319 -78.5036 1950 na Market Rate Family Stabilized Conventional 62 1 98.4%021 Brandywine Townhomes 38.0572 -78.4873 1989 2008 Market Rate Family Stabilized Conventional 10 0 100.0%022 Burruss Apartment Corporation 38.0442 -78.4804 1955 na Market Rate Family Unconfirmed Conventional 0 0 0.0%023 Cambridge Square Apartments 38.0421 -78.4970 1968 2008 Market Rate Family Stabilized Conventional 83 0 100.0%024 Camden Plaza Apartments 38.0356 -78.4982 2004 na Market Rate Family Stabilized Conventional 52 0 100.0%025 Carratt Apartments 38.0269 -78.5124 1975 na Market Rate Family Stabilized Conventional 32 0 100.0%026 Carriage Gate Apartments 38.0908 -78.4748 2003 na Market Rate Family Stabilized Conventional 40 2 95.0%027 Carriage Hill Apartments 38.0294 -78.4490 2002 na Market Rate Family Stabilized Conventional 140 3 97.9%028 Carrollton Terrace Apartments 38.0278 -78.5103 2005 na Market Rate Family Stabilized Conventional 24 0 100.0%029 Cavalier Court Apartments 38.0280 -78.5159 1975 na Market Rate Family Stabilized Conventional 60 0 100.0%030 CBS Rentals 38.0336 -78.4983 na na Market Rate Family Duplicate Conventional 0 0 0.0%031 Crossings at Fourth & Preston (The) 38.0346 -78.4856 2010 na Restricted Family Prop Const Tax Credit 60 60 0.0%032 Charlottesville Apartments 38.0269 -78.5123 2002 na Market Rate Family Student Housing Conventional 40 0 100.0%033 Claremont at Carriage Hills 38.0297 -78.4490 2002 na Market Rate Family Condominiums Conventional 0 0 0.0%034 University Place Apartments 38.0063 -78.5174 2002 na Market Rate Family Stabilized Conventional 144 3 97.9%035 Courtyard Quarters Apartments 38.0340 -78.4942 1995 na Market Rate Family Student Housing Conventional 0 0 0.0%036 Crossroads (The) Apartments 38.0262 -78.5143 1996 na Market Rate Family Stabilized Conventional 34 0 100.0%037 DFG Properties 38.1041 -78.5548 2001 na Market Rate Family Unconfirmed Conventional 0 0 0.0%038 Eagles Landing Apartments 38.0164 -78.5225 2003 na Market Rate Family Stabilized Conventional 280 56 80.0%039 Ephphatha Village Apartments 38.0188 -78.4945 1992 na Subsidized Family Special Needs HUD 14 1 92.9%040 Fore Woods Edge Apartments 38.0799 -78.4684 2002 na Restricted Elderly Duplicate Tax Credit 0 0 0.0%041 Fountain Court Apartments 38.0688 -78.4682 1960 2009 Market Rate Family Rehabilitation Conventional 56 9 83.9%042 Four Seasons Apartments 38.0777 -78.4836 1975 na Market Rate Family Duplicate Conventional 0 0 0.0%043 Friendship Court Apartments 38.0283 -78.4813 1975 2004 Subsidized Family Stabilized Bond 150 2 98.7%044 Garrett Square Apartments 38.0283 -78.4813 1975 2004 Subsidized Family Duplicate Bond 0 0 0.0%045 Godfrey Property Management 38.0430 -78.5122 1900 na Market Rate Family Duplicate Conventional 0 0 0.0%046 Graduate Center Apartments 38.0490 -78.5057 1983 na Market Rate Family Student Housing Conventional 48 0 100.0%047 Graduate Court Apartments 38.0363 -78.4984 1986 na Market Rate Family Student Housing Conventional 24 0 100.0%048 Graduate Court Apartments - Rugby 38.0565 -78.4894 na na Market Rate Family Stabilized Conventional 25 0 100.0%049 Grady Avenue Group Home 38.0388 -78.4924 na na Subsidized Family Special Needs HUD 4 0 100.0%050 GrandMarc at the Corner Apartments 38.0363 -78.4994 2007 na Market Rate Family Student Housing Conventional 224 15 93.3%051 Great Eastern Management Company 38.0699 -78.4987 1940 na Market Rate Family Duplicate Conventional 0 0 0.0%
Rental Property Inventory
Section 10 - Supply Analysis Allen and Associates Consulting
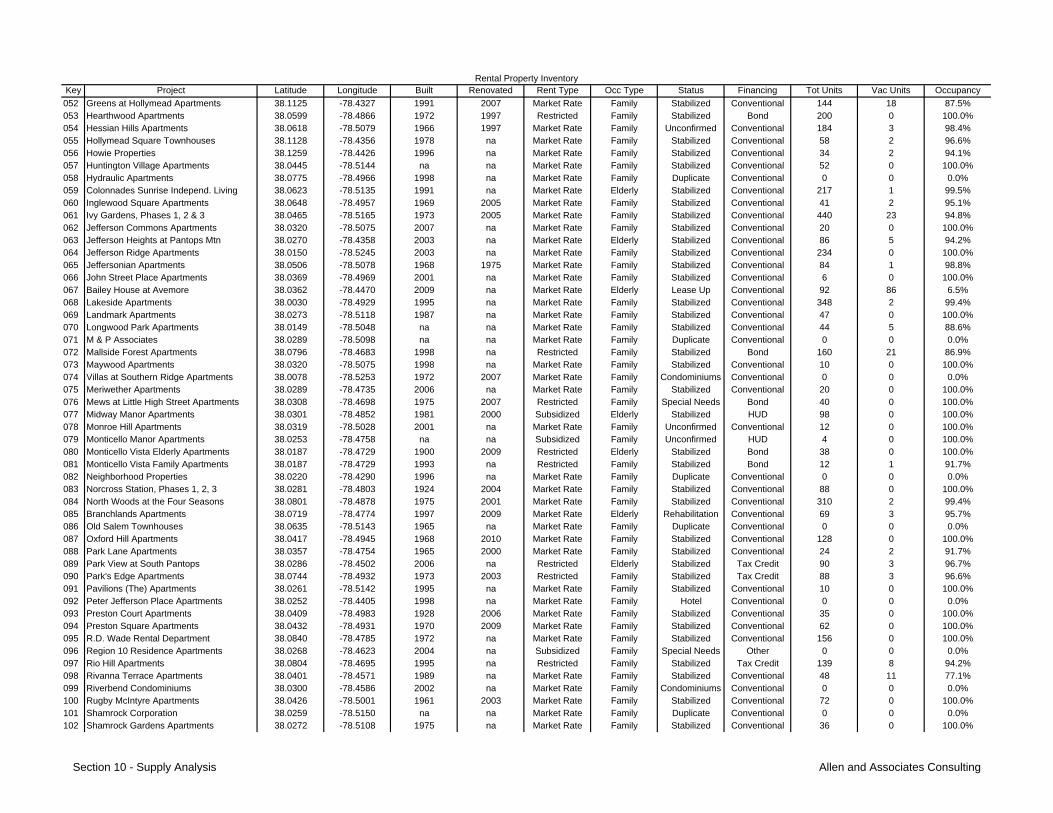
Key Project Latitude Longitude Built Renovated Rent Type Occ Type Status Financing Tot Units Vac Units OccupancyRental Property Inventory
052 Greens at Hollymead Apartments 38.1125 -78.4327 1991 2007 Market Rate Family Stabilized Conventional 144 18 87.5%053 Hearthwood Apartments 38.0599 -78.4866 1972 1997 Restricted Family Stabilized Bond 200 0 100.0%054 Hessian Hills Apartments 38.0618 -78.5079 1966 1997 Market Rate Family Unconfirmed Conventional 184 3 98.4%055 Hollymead Square Townhouses 38.1128 -78.4356 1978 na Market Rate Family Stabilized Conventional 58 2 96.6%056 Howie Properties 38.1259 -78.4426 1996 na Market Rate Family Stabilized Conventional 34 2 94.1%057 Huntington Village Apartments 38.0445 -78.5144 na na Market Rate Family Stabilized Conventional 52 0 100.0%058 Hydraulic Apartments 38.0775 -78.4966 1998 na Market Rate Family Duplicate Conventional 0 0 0.0%059 Colonnades Sunrise Independ. Living 38.0623 -78.5135 1991 na Market Rate Elderly Stabilized Conventional 217 1 99.5%060 Inglewood Square Apartments 38.0648 -78.4957 1969 2005 Market Rate Family Stabilized Conventional 41 2 95.1%061 Ivy Gardens, Phases 1, 2 & 3 38.0465 -78.5165 1973 2005 Market Rate Family Stabilized Conventional 440 23 94.8%062 Jefferson Commons Apartments 38.0320 -78.5075 2007 na Market Rate Family Stabilized Conventional 20 0 100.0%063 Jefferson Heights at Pantops Mtn 38.0270 -78.4358 2003 na Market Rate Elderly Stabilized Conventional 86 5 94.2%064 Jefferson Ridge Apartments 38.0150 -78.5245 2003 na Market Rate Family Stabilized Conventional 234 0 100.0%065 Jeffersonian Apartments 38.0506 -78.5078 1968 1975 Market Rate Family Stabilized Conventional 84 1 98.8%066 John Street Place Apartments 38.0369 -78.4969 2001 na Market Rate Family Stabilized Conventional 6 0 100.0%067 Bailey House at Avemore 38.0362 -78.4470 2009 na Market Rate Elderly Lease Up Conventional 92 86 6.5%068 Lakeside Apartments 38.0030 -78.4929 1995 na Market Rate Family Stabilized Conventional 348 2 99.4%069 Landmark Apartments 38.0273 -78.5118 1987 na Market Rate Family Stabilized Conventional 47 0 100.0%070 Longwood Park Apartments 38.0149 -78.5048 na na Market Rate Family Stabilized Conventional 44 5 88.6%071 M & P Associates 38.0289 -78.5098 na na Market Rate Family Duplicate Conventional 0 0 0.0%072 Mallside Forest Apartments 38.0796 -78.4683 1998 na Restricted Family Stabilized Bond 160 21 86.9%073 Maywood Apartments 38.0320 -78.5075 1998 na Market Rate Family Stabilized Conventional 10 0 100.0%074 Villas at Southern Ridge Apartments 38.0078 -78.5253 1972 2007 Market Rate Family Condominiums Conventional 0 0 0.0%075 Meriwether Apartments 38.0289 -78.4735 2006 na Market Rate Family Stabilized Conventional 20 0 100.0%076 Mews at Little High Street Apartments 38.0308 -78.4698 1975 2007 Restricted Family Special Needs Bond 40 0 100.0%077 Midway Manor Apartments 38.0301 -78.4852 1981 2000 Subsidized Elderly Stabilized HUD 98 0 100.0%078 Monroe Hill Apartments 38.0319 -78.5028 2001 na Market Rate Family Unconfirmed Conventional 12 0 100.0%079 Monticello Manor Apartments 38.0253 -78.4758 na na Subsidized Family Unconfirmed HUD 4 0 100.0%080 Monticello Vista Elderly Apartments 38.0187 -78.4729 1900 2009 Restricted Elderly Stabilized Bond 38 0 100.0%081 Monticello Vista Family Apartments 38.0187 -78.4729 1993 na Restricted Family Stabilized Bond 12 1 91.7%082 Neighborhood Properties 38.0220 -78.4290 1996 na Market Rate Family Duplicate Conventional 0 0 0.0%083 Norcross Station, Phases 1, 2, 3 38.0281 -78.4803 1924 2004 Market Rate Family Stabilized Conventional 88 0 100.0%084 North Woods at the Four Seasons 38.0801 -78.4878 1975 2001 Market Rate Family Stabilized Conventional 310 2 99.4%085 Branchlands Apartments 38.0719 -78.4774 1997 2009 Market Rate Elderly Rehabilitation Conventional 69 3 95.7%086 Old Salem Townhouses 38.0635 -78.5143 1965 na Market Rate Family Duplicate Conventional 0 0 0.0%087 Oxford Hill Apartments 38.0417 -78.4945 1968 2010 Market Rate Family Stabilized Conventional 128 0 100.0%088 Park Lane Apartments 38.0357 -78.4754 1965 2000 Market Rate Family Stabilized Conventional 24 2 91.7%089 Park View at South Pantops 38.0286 -78.4502 2006 na Restricted Elderly Stabilized Tax Credit 90 3 96.7%090 Park's Edge Apartments 38.0744 -78.4932 1973 2003 Restricted Family Stabilized Tax Credit 88 3 96.6%091 Pavilions (The) Apartments 38.0261 -78.5142 1995 na Market Rate Family Stabilized Conventional 10 0 100.0%092 Peter Jefferson Place Apartments 38.0252 -78.4405 1998 na Market Rate Family Hotel Conventional 0 0 0.0%093 Preston Court Apartments 38.0409 -78.4983 1928 2006 Market Rate Family Stabilized Conventional 35 0 100.0%094 Preston Square Apartments 38.0432 -78.4931 1970 2009 Market Rate Family Stabilized Conventional 62 0 100.0%095 R.D. Wade Rental Department 38.0840 -78.4785 1972 na Market Rate Family Stabilized Conventional 156 0 100.0%096 Region 10 Residence Apartments 38.0268 -78.4623 2004 na Subsidized Family Special Needs Other 0 0 0.0%097 Rio Hill Apartments 38.0804 -78.4695 1995 na Restricted Family Stabilized Tax Credit 139 8 94.2%098 Rivanna Terrace Apartments 38.0401 -78.4571 1989 na Market Rate Family Stabilized Conventional 48 11 77.1%099 Riverbend Condominiums 38.0300 -78.4586 2002 na Market Rate Family Condominiums Conventional 0 0 0.0%100 Rugby McIntyre Apartments 38.0426 -78.5001 1961 2003 Market Rate Family Stabilized Conventional 72 0 100.0%101 Shamrock Corporation 38.0259 -78.5150 na na Market Rate Family Duplicate Conventional 0 0 0.0%102 Shamrock Gardens Apartments 38.0272 -78.5108 1975 na Market Rate Family Stabilized Conventional 36 0 100.0%
Section 10 - Supply Analysis Allen and Associates Consulting
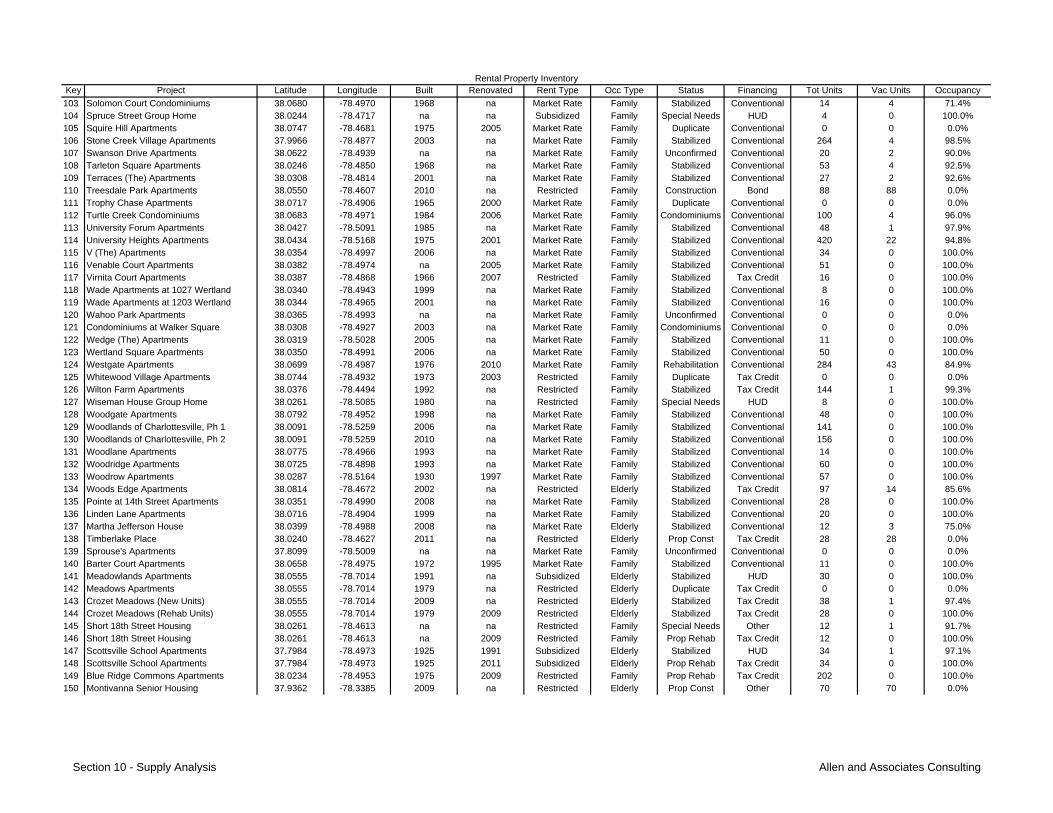
Key Project Latitude Longitude Built Renovated Rent Type Occ Type Status Financing Tot Units Vac Units OccupancyRental Property Inventory
103 Solomon Court Condominiums 38.0680 -78.4970 1968 na Market Rate Family Stabilized Conventional 14 4 71.4%104 Spruce Street Group Home 38.0244 -78.4717 na na Subsidized Family Special Needs HUD 4 0 100.0%105 Squire Hill Apartments 38.0747 -78.4681 1975 2005 Market Rate Family Duplicate Conventional 0 0 0.0%106 Stone Creek Village Apartments 37.9966 -78.4877 2003 na Market Rate Family Stabilized Conventional 264 4 98.5%107 Swanson Drive Apartments 38.0622 -78.4939 na na Market Rate Family Unconfirmed Conventional 20 2 90.0%108 Tarleton Square Apartments 38.0246 -78.4850 1968 na Market Rate Family Stabilized Conventional 53 4 92.5%109 Terraces (The) Apartments 38.0308 -78.4814 2001 na Market Rate Family Stabilized Conventional 27 2 92.6%110 Treesdale Park Apartments 38.0550 -78.4607 2010 na Restricted Family Construction Bond 88 88 0.0%111 Trophy Chase Apartments 38.0717 -78.4906 1965 2000 Market Rate Family Duplicate Conventional 0 0 0.0%112 Turtle Creek Condominiums 38.0683 -78.4971 1984 2006 Market Rate Family Condominiums Conventional 100 4 96.0%113 University Forum Apartments 38.0427 -78.5091 1985 na Market Rate Family Stabilized Conventional 48 1 97.9%114 University Heights Apartments 38.0434 -78.5168 1975 2001 Market Rate Family Stabilized Conventional 420 22 94.8%115 V (The) Apartments 38.0354 -78.4997 2006 na Market Rate Family Stabilized Conventional 34 0 100.0%116 Venable Court Apartments 38.0382 -78.4974 na 2005 Market Rate Family Stabilized Conventional 51 0 100.0%117 Virnita Court Apartments 38.0387 -78.4868 1966 2007 Restricted Family Stabilized Tax Credit 16 0 100.0%118 Wade Apartments at 1027 Wertland 38.0340 -78.4943 1999 na Market Rate Family Stabilized Conventional 8 0 100.0%119 Wade Apartments at 1203 Wertland 38.0344 -78.4965 2001 na Market Rate Family Stabilized Conventional 16 0 100.0%120 Wahoo Park Apartments 38.0365 -78.4993 na na Market Rate Family Unconfirmed Conventional 0 0 0.0%121 Condominiums at Walker Square 38.0308 -78.4927 2003 na Market Rate Family Condominiums Conventional 0 0 0.0%122 Wedge (The) Apartments 38.0319 -78.5028 2005 na Market Rate Family Stabilized Conventional 11 0 100.0%123 Wertland Square Apartments 38.0350 -78.4991 2006 na Market Rate Family Stabilized Conventional 50 0 100.0%124 Westgate Apartments 38.0699 -78.4987 1976 2010 Market Rate Family Rehabilitation Conventional 284 43 84.9%125 Whitewood Village Apartments 38.0744 -78.4932 1973 2003 Restricted Family Duplicate Tax Credit 0 0 0.0%126 Wilton Farm Apartments 38.0376 -78.4494 1992 na Restricted Family Stabilized Tax Credit 144 1 99.3%127 Wiseman House Group Home 38.0261 -78.5085 1980 na Restricted Family Special Needs HUD 8 0 100.0%128 Woodgate Apartments 38.0792 -78.4952 1998 na Market Rate Family Stabilized Conventional 48 0 100.0%129 Woodlands of Charlottesville, Ph 1 38.0091 -78.5259 2006 na Market Rate Family Stabilized Conventional 141 0 100.0%130 Woodlands of Charlottesville, Ph 2 38.0091 -78.5259 2010 na Market Rate Family Stabilized Conventional 156 0 100.0%131 Woodlane Apartments 38.0775 -78.4966 1993 na Market Rate Family Stabilized Conventional 14 0 100.0%132 Woodridge Apartments 38.0725 -78.4898 1993 na Market Rate Family Stabilized Conventional 60 0 100.0%133 Woodrow Apartments 38.0287 -78.5164 1930 1997 Market Rate Family Stabilized Conventional 57 0 100.0%134 Woods Edge Apartments 38.0814 -78.4672 2002 na Restricted Elderly Stabilized Tax Credit 97 14 85.6%135 Pointe at 14th Street Apartments 38.0351 -78.4990 2008 na Market Rate Family Stabilized Conventional 28 0 100.0%136 Linden Lane Apartments 38.0716 -78.4904 1999 na Market Rate Family Stabilized Conventional 20 0 100.0%137 Martha Jefferson House 38.0399 -78.4988 2008 na Market Rate Elderly Stabilized Conventional 12 3 75.0%138 Timberlake Place 38.0240 -78.4627 2011 na Restricted Elderly Prop Const Tax Credit 28 28 0.0%139 Sprouse's Apartments 37.8099 -78.5009 na na Market Rate Family Unconfirmed Conventional 0 0 0.0%140 Barter Court Apartments 38.0658 -78.4975 1972 1995 Market Rate Family Stabilized Conventional 11 0 100.0%141 Meadowlands Apartments 38.0555 -78.7014 1991 na Subsidized Elderly Stabilized HUD 30 0 100.0%142 Meadows Apartments 38.0555 -78.7014 1979 na Restricted Elderly Duplicate Tax Credit 0 0 0.0%143 Crozet Meadows (New Units) 38.0555 -78.7014 2009 na Restricted Elderly Stabilized Tax Credit 38 1 97.4%144 Crozet Meadows (Rehab Units) 38.0555 -78.7014 1979 2009 Restricted Elderly Stabilized Tax Credit 28 0 100.0%145 Short 18th Street Housing 38.0261 -78.4613 na na Restricted Family Special Needs Other 12 1 91.7%146 Short 18th Street Housing 38.0261 -78.4613 na 2009 Restricted Family Prop Rehab Tax Credit 12 0 100.0%147 Scottsville School Apartments 37.7984 -78.4973 1925 1991 Subsidized Elderly Stabilized HUD 34 1 97.1%148 Scottsville School Apartments 37.7984 -78.4973 1925 2011 Subsidized Elderly Prop Rehab Tax Credit 34 0 100.0%149 Blue Ridge Commons Apartments 38.0234 -78.4953 1975 2009 Restricted Family Prop Rehab Tax Credit 202 0 100.0%150 Montivanna Senior Housing 37.9362 -78.3385 2009 na Restricted Elderly Prop Const Other 70 70 0.0%
Section 10 - Supply Analysis Allen and Associates Consulting
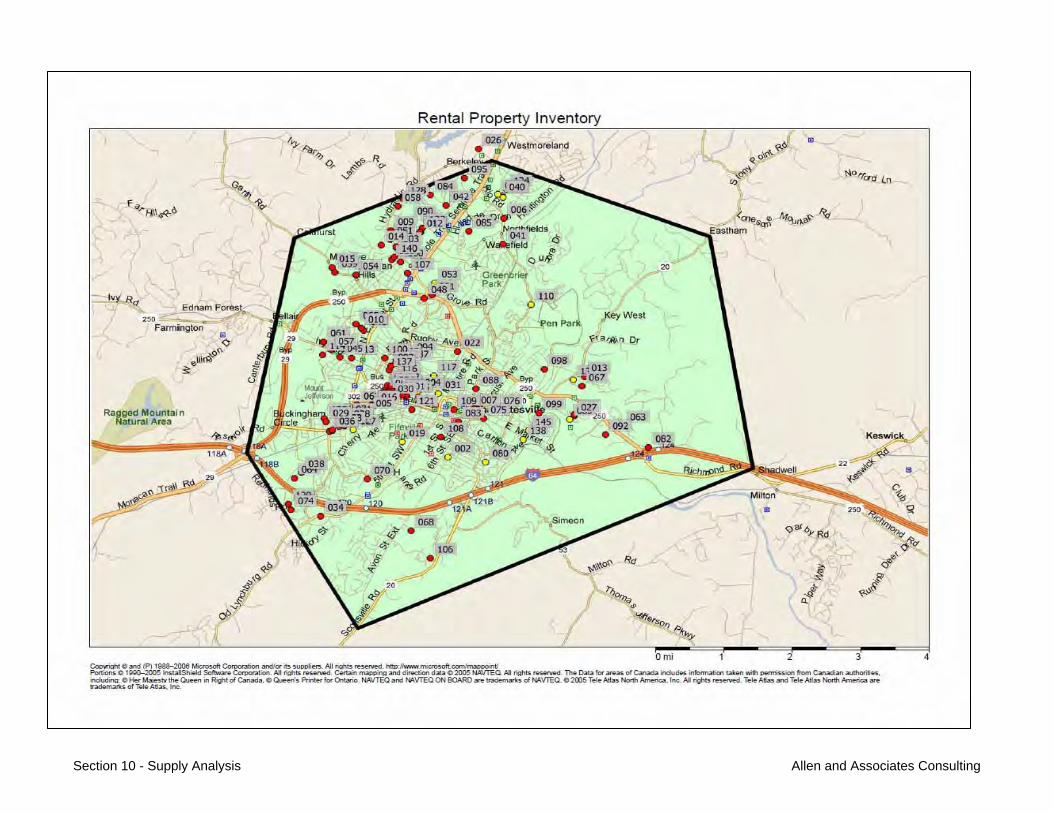
Rental Property Inventory.pdf
Section 10 - Supply Analysis Allen and Associates Consulting
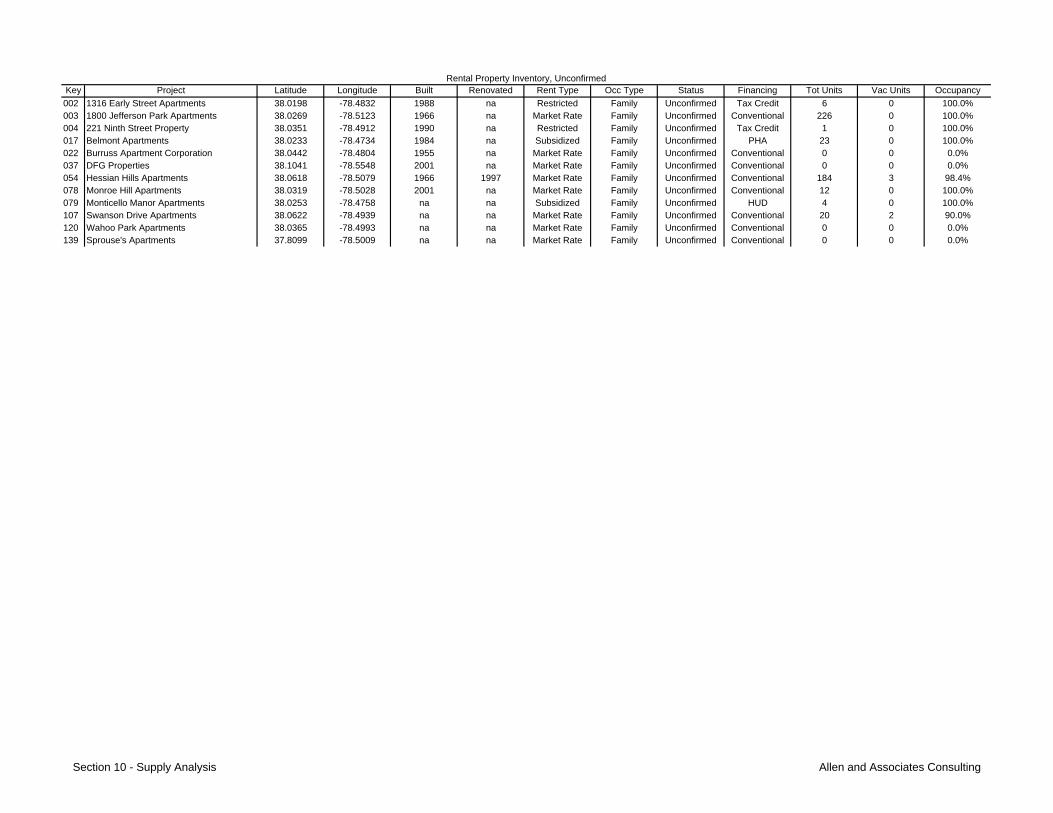
Key Project Latitude Longitude Built Renovated Rent Type Occ Type Status Financing Tot Units Vac Units Occupancy
002 1316 Early Street Apartments 38.0198 -78.4832 1988 na Restricted Family Unconfirmed Tax Credit 6 0 100.0%003 1800 Jefferson Park Apartments 38.0269 -78.5123 1966 na Market Rate Family Unconfirmed Conventional 226 0 100.0%004 221 Ninth Street Property 38.0351 -78.4912 1990 na Restricted Family Unconfirmed Tax Credit 1 0 100.0%017 Belmont Apartments 38.0233 -78.4734 1984 na Subsidized Family Unconfirmed PHA 23 0 100.0%022 Burruss Apartment Corporation 38.0442 -78.4804 1955 na Market Rate Family Unconfirmed Conventional 0 0 0.0%037 DFG Properties 38.1041 -78.5548 2001 na Market Rate Family Unconfirmed Conventional 0 0 0.0%054 Hessian Hills Apartments 38.0618 -78.5079 1966 1997 Market Rate Family Unconfirmed Conventional 184 3 98.4%078 Monroe Hill Apartments 38.0319 -78.5028 2001 na Market Rate Family Unconfirmed Conventional 12 0 100.0%079 Monticello Manor Apartments 38.0253 -78.4758 na na Subsidized Family Unconfirmed HUD 4 0 100.0%107 Swanson Drive Apartments 38.0622 -78.4939 na na Market Rate Family Unconfirmed Conventional 20 2 90.0%120 Wahoo Park Apartments 38.0365 -78.4993 na na Market Rate Family Unconfirmed Conventional 0 0 0.0%139 Sprouse's Apartments 37.8099 -78.5009 na na Market Rate Family Unconfirmed Conventional 0 0 0.0%
Rental Property Inventory, Unconfirmed
Section 10 - Supply Analysis Allen and Associates Consulting
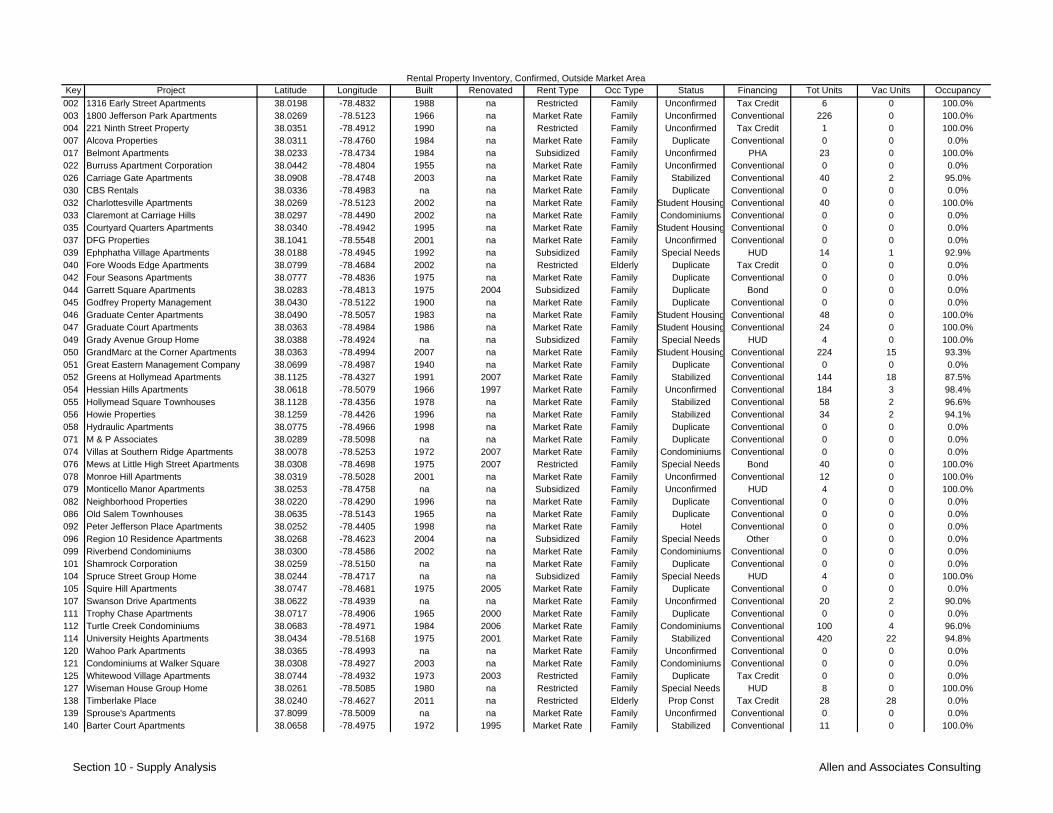
Key Project Latitude Longitude Built Renovated Rent Type Occ Type Status Financing Tot Units Vac Units Occupancy
002 1316 Early Street Apartments 38.0198 -78.4832 1988 na Restricted Family Unconfirmed Tax Credit 6 0 100.0%003 1800 Jefferson Park Apartments 38.0269 -78.5123 1966 na Market Rate Family Unconfirmed Conventional 226 0 100.0%004 221 Ninth Street Property 38.0351 -78.4912 1990 na Restricted Family Unconfirmed Tax Credit 1 0 100.0%007 Alcova Properties 38.0311 -78.4760 1984 na Market Rate Family Duplicate Conventional 0 0 0.0%017 Belmont Apartments 38.0233 -78.4734 1984 na Subsidized Family Unconfirmed PHA 23 0 100.0%022 Burruss Apartment Corporation 38.0442 -78.4804 1955 na Market Rate Family Unconfirmed Conventional 0 0 0.0%026 Carriage Gate Apartments 38.0908 -78.4748 2003 na Market Rate Family Stabilized Conventional 40 2 95.0%030 CBS Rentals 38.0336 -78.4983 na na Market Rate Family Duplicate Conventional 0 0 0.0%032 Charlottesville Apartments 38.0269 -78.5123 2002 na Market Rate Family Student Housing Conventional 40 0 100.0%033 Claremont at Carriage Hills 38.0297 -78.4490 2002 na Market Rate Family Condominiums Conventional 0 0 0.0%035 Courtyard Quarters Apartments 38.0340 -78.4942 1995 na Market Rate Family Student Housing Conventional 0 0 0.0%037 DFG Properties 38.1041 -78.5548 2001 na Market Rate Family Unconfirmed Conventional 0 0 0.0%039 Ephphatha Village Apartments 38.0188 -78.4945 1992 na Subsidized Family Special Needs HUD 14 1 92.9%040 Fore Woods Edge Apartments 38.0799 -78.4684 2002 na Restricted Elderly Duplicate Tax Credit 0 0 0.0%042 Four Seasons Apartments 38.0777 -78.4836 1975 na Market Rate Family Duplicate Conventional 0 0 0.0%044 Garrett Square Apartments 38.0283 -78.4813 1975 2004 Subsidized Family Duplicate Bond 0 0 0.0%045 Godfrey Property Management 38.0430 -78.5122 1900 na Market Rate Family Duplicate Conventional 0 0 0.0%046 Graduate Center Apartments 38.0490 -78.5057 1983 na Market Rate Family Student Housing Conventional 48 0 100.0%047 Graduate Court Apartments 38.0363 -78.4984 1986 na Market Rate Family Student Housing Conventional 24 0 100.0%049 Grady Avenue Group Home 38.0388 -78.4924 na na Subsidized Family Special Needs HUD 4 0 100.0%050 GrandMarc at the Corner Apartments 38.0363 -78.4994 2007 na Market Rate Family Student Housing Conventional 224 15 93.3%051 Great Eastern Management Company 38.0699 -78.4987 1940 na Market Rate Family Duplicate Conventional 0 0 0.0%052 Greens at Hollymead Apartments 38.1125 -78.4327 1991 2007 Market Rate Family Stabilized Conventional 144 18 87.5%054 Hessian Hills Apartments 38.0618 -78.5079 1966 1997 Market Rate Family Unconfirmed Conventional 184 3 98.4%055 Hollymead Square Townhouses 38.1128 -78.4356 1978 na Market Rate Family Stabilized Conventional 58 2 96.6%056 Howie Properties 38.1259 -78.4426 1996 na Market Rate Family Stabilized Conventional 34 2 94.1%058 Hydraulic Apartments 38.0775 -78.4966 1998 na Market Rate Family Duplicate Conventional 0 0 0.0%071 M & P Associates 38.0289 -78.5098 na na Market Rate Family Duplicate Conventional 0 0 0.0%074 Villas at Southern Ridge Apartments 38.0078 -78.5253 1972 2007 Market Rate Family Condominiums Conventional 0 0 0.0%076 Mews at Little High Street Apartments 38.0308 -78.4698 1975 2007 Restricted Family Special Needs Bond 40 0 100.0%078 Monroe Hill Apartments 38.0319 -78.5028 2001 na Market Rate Family Unconfirmed Conventional 12 0 100.0%079 Monticello Manor Apartments 38.0253 -78.4758 na na Subsidized Family Unconfirmed HUD 4 0 100.0%082 Neighborhood Properties 38.0220 -78.4290 1996 na Market Rate Family Duplicate Conventional 0 0 0.0%086 Old Salem Townhouses 38.0635 -78.5143 1965 na Market Rate Family Duplicate Conventional 0 0 0.0%092 Peter Jefferson Place Apartments 38.0252 -78.4405 1998 na Market Rate Family Hotel Conventional 0 0 0.0%096 Region 10 Residence Apartments 38.0268 -78.4623 2004 na Subsidized Family Special Needs Other 0 0 0.0%099 Riverbend Condominiums 38.0300 -78.4586 2002 na Market Rate Family Condominiums Conventional 0 0 0.0%101 Shamrock Corporation 38.0259 -78.5150 na na Market Rate Family Duplicate Conventional 0 0 0.0%104 Spruce Street Group Home 38.0244 -78.4717 na na Subsidized Family Special Needs HUD 4 0 100.0%105 Squire Hill Apartments 38.0747 -78.4681 1975 2005 Market Rate Family Duplicate Conventional 0 0 0.0%107 Swanson Drive Apartments 38.0622 -78.4939 na na Market Rate Family Unconfirmed Conventional 20 2 90.0%111 Trophy Chase Apartments 38.0717 -78.4906 1965 2000 Market Rate Family Duplicate Conventional 0 0 0.0%112 Turtle Creek Condominiums 38.0683 -78.4971 1984 2006 Market Rate Family Condominiums Conventional 100 4 96.0%114 University Heights Apartments 38.0434 -78.5168 1975 2001 Market Rate Family Stabilized Conventional 420 22 94.8%120 Wahoo Park Apartments 38.0365 -78.4993 na na Market Rate Family Unconfirmed Conventional 0 0 0.0%121 Condominiums at Walker Square 38.0308 -78.4927 2003 na Market Rate Family Condominiums Conventional 0 0 0.0%125 Whitewood Village Apartments 38.0744 -78.4932 1973 2003 Restricted Family Duplicate Tax Credit 0 0 0.0%127 Wiseman House Group Home 38.0261 -78.5085 1980 na Restricted Family Special Needs HUD 8 0 100.0%138 Timberlake Place 38.0240 -78.4627 2011 na Restricted Elderly Prop Const Tax Credit 28 28 0.0%139 Sprouse's Apartments 37.8099 -78.5009 na na Market Rate Family Unconfirmed Conventional 0 0 0.0%140 Barter Court Apartments 38.0658 -78.4975 1972 1995 Market Rate Family Stabilized Conventional 11 0 100.0%
Rental Property Inventory, Confirmed, Outside Market Area
Section 10 - Supply Analysis Allen and Associates Consulting

Key Project Latitude Longitude Built Renovated Rent Type Occ Type Status Financing Tot Units Vac Units OccupancyRental Property Inventory, Confirmed, Outside Market Area
141 Meadowlands Apartments 38.0555 -78.7014 1991 na Subsidized Elderly Stabilized HUD 30 0 100.0%142 Meadows Apartments 38.0555 -78.7014 1979 na Restricted Elderly Duplicate Tax Credit 0 0 0.0%143 Crozet Meadows (New Units) 38.0555 -78.7014 2009 na Restricted Elderly Stabilized Tax Credit 38 1 97.4%144 Crozet Meadows (Rehab Units) 38.0555 -78.7014 1979 2009 Restricted Elderly Stabilized Tax Credit 28 0 100.0%145 Short 18th Street Housing 38.0261 -78.4613 na na Restricted Family Special Needs Other 12 1 91.7%147 Scottsville School Apartments 37.7984 -78.4973 1925 1991 Subsidized Elderly Stabilized HUD 34 1 97.1%148 Scottsville School Apartments 37.7984 -78.4973 1925 2011 Subsidized Elderly Prop Rehab Tax Credit 34 0 100.0%150 Montivanna Senior Housing 37.9362 -78.3385 2009 na Restricted Elderly Prop Const Other 70 70 0.0%
Section 10 - Supply Analysis Allen and Associates Consulting
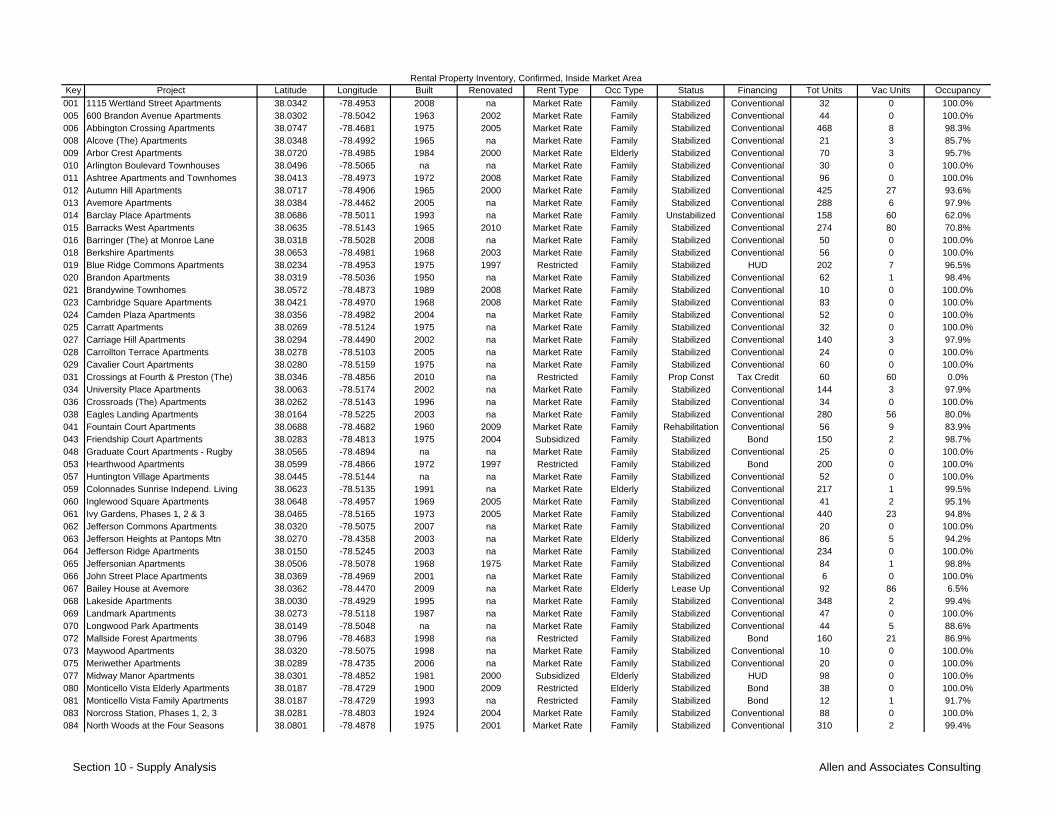
Key Project Latitude Longitude Built Renovated Rent Type Occ Type Status Financing Tot Units Vac Units Occupancy
001 1115 Wertland Street Apartments 38.0342 -78.4953 2008 na Market Rate Family Stabilized Conventional 32 0 100.0%005 600 Brandon Avenue Apartments 38.0302 -78.5042 1963 2002 Market Rate Family Stabilized Conventional 44 0 100.0%006 Abbington Crossing Apartments 38.0747 -78.4681 1975 2005 Market Rate Family Stabilized Conventional 468 8 98.3%008 Alcove (The) Apartments 38.0348 -78.4992 1965 na Market Rate Family Stabilized Conventional 21 3 85.7%009 Arbor Crest Apartments 38.0720 -78.4985 1984 2000 Market Rate Elderly Stabilized Conventional 70 3 95.7%010 Arlington Boulevard Townhouses 38.0496 -78.5065 na na Market Rate Family Stabilized Conventional 30 0 100.0%011 Ashtree Apartments and Townhomes 38.0413 -78.4973 1972 2008 Market Rate Family Stabilized Conventional 96 0 100.0%012 Autumn Hill Apartments 38.0717 -78.4906 1965 2000 Market Rate Family Stabilized Conventional 425 27 93.6%013 Avemore Apartments 38.0384 -78.4462 2005 na Market Rate Family Stabilized Conventional 288 6 97.9%014 Barclay Place Apartments 38.0686 -78.5011 1993 na Market Rate Family Unstabilized Conventional 158 60 62.0%015 Barracks West Apartments 38.0635 -78.5143 1965 2010 Market Rate Family Stabilized Conventional 274 80 70.8%016 Barringer (The) at Monroe Lane 38.0318 -78.5028 2008 na Market Rate Family Stabilized Conventional 50 0 100.0%018 Berkshire Apartments 38.0653 -78.4981 1968 2003 Market Rate Family Stabilized Conventional 56 0 100.0%019 Blue Ridge Commons Apartments 38.0234 -78.4953 1975 1997 Restricted Family Stabilized HUD 202 7 96.5%020 Brandon Apartments 38.0319 -78.5036 1950 na Market Rate Family Stabilized Conventional 62 1 98.4%021 Brandywine Townhomes 38.0572 -78.4873 1989 2008 Market Rate Family Stabilized Conventional 10 0 100.0%023 Cambridge Square Apartments 38.0421 -78.4970 1968 2008 Market Rate Family Stabilized Conventional 83 0 100.0%024 Camden Plaza Apartments 38.0356 -78.4982 2004 na Market Rate Family Stabilized Conventional 52 0 100.0%025 Carratt Apartments 38.0269 -78.5124 1975 na Market Rate Family Stabilized Conventional 32 0 100.0%027 Carriage Hill Apartments 38.0294 -78.4490 2002 na Market Rate Family Stabilized Conventional 140 3 97.9%028 Carrollton Terrace Apartments 38.0278 -78.5103 2005 na Market Rate Family Stabilized Conventional 24 0 100.0%029 Cavalier Court Apartments 38.0280 -78.5159 1975 na Market Rate Family Stabilized Conventional 60 0 100.0%031 Crossings at Fourth & Preston (The) 38.0346 -78.4856 2010 na Restricted Family Prop Const Tax Credit 60 60 0.0%034 University Place Apartments 38.0063 -78.5174 2002 na Market Rate Family Stabilized Conventional 144 3 97.9%036 Crossroads (The) Apartments 38.0262 -78.5143 1996 na Market Rate Family Stabilized Conventional 34 0 100.0%038 Eagles Landing Apartments 38.0164 -78.5225 2003 na Market Rate Family Stabilized Conventional 280 56 80.0%041 Fountain Court Apartments 38.0688 -78.4682 1960 2009 Market Rate Family Rehabilitation Conventional 56 9 83.9%043 Friendship Court Apartments 38.0283 -78.4813 1975 2004 Subsidized Family Stabilized Bond 150 2 98.7%048 Graduate Court Apartments - Rugby 38.0565 -78.4894 na na Market Rate Family Stabilized Conventional 25 0 100.0%053 Hearthwood Apartments 38.0599 -78.4866 1972 1997 Restricted Family Stabilized Bond 200 0 100.0%057 Huntington Village Apartments 38.0445 -78.5144 na na Market Rate Family Stabilized Conventional 52 0 100.0%059 Colonnades Sunrise Independ. Living 38.0623 -78.5135 1991 na Market Rate Elderly Stabilized Conventional 217 1 99.5%060 Inglewood Square Apartments 38.0648 -78.4957 1969 2005 Market Rate Family Stabilized Conventional 41 2 95.1%061 Ivy Gardens, Phases 1, 2 & 3 38.0465 -78.5165 1973 2005 Market Rate Family Stabilized Conventional 440 23 94.8%062 Jefferson Commons Apartments 38.0320 -78.5075 2007 na Market Rate Family Stabilized Conventional 20 0 100.0%063 Jefferson Heights at Pantops Mtn 38.0270 -78.4358 2003 na Market Rate Elderly Stabilized Conventional 86 5 94.2%064 Jefferson Ridge Apartments 38.0150 -78.5245 2003 na Market Rate Family Stabilized Conventional 234 0 100.0%065 Jeffersonian Apartments 38.0506 -78.5078 1968 1975 Market Rate Family Stabilized Conventional 84 1 98.8%066 John Street Place Apartments 38.0369 -78.4969 2001 na Market Rate Family Stabilized Conventional 6 0 100.0%067 Bailey House at Avemore 38.0362 -78.4470 2009 na Market Rate Elderly Lease Up Conventional 92 86 6.5%068 Lakeside Apartments 38.0030 -78.4929 1995 na Market Rate Family Stabilized Conventional 348 2 99.4%069 Landmark Apartments 38.0273 -78.5118 1987 na Market Rate Family Stabilized Conventional 47 0 100.0%070 Longwood Park Apartments 38.0149 -78.5048 na na Market Rate Family Stabilized Conventional 44 5 88.6%072 Mallside Forest Apartments 38.0796 -78.4683 1998 na Restricted Family Stabilized Bond 160 21 86.9%073 Maywood Apartments 38.0320 -78.5075 1998 na Market Rate Family Stabilized Conventional 10 0 100.0%075 Meriwether Apartments 38.0289 -78.4735 2006 na Market Rate Family Stabilized Conventional 20 0 100.0%077 Midway Manor Apartments 38.0301 -78.4852 1981 2000 Subsidized Elderly Stabilized HUD 98 0 100.0%080 Monticello Vista Elderly Apartments 38.0187 -78.4729 1900 2009 Restricted Elderly Stabilized Bond 38 0 100.0%081 Monticello Vista Family Apartments 38.0187 -78.4729 1993 na Restricted Family Stabilized Bond 12 1 91.7%083 Norcross Station, Phases 1, 2, 3 38.0281 -78.4803 1924 2004 Market Rate Family Stabilized Conventional 88 0 100.0%084 North Woods at the Four Seasons 38.0801 -78.4878 1975 2001 Market Rate Family Stabilized Conventional 310 2 99.4%
Rental Property Inventory, Confirmed, Inside Market Area
Section 10 - Supply Analysis Allen and Associates Consulting
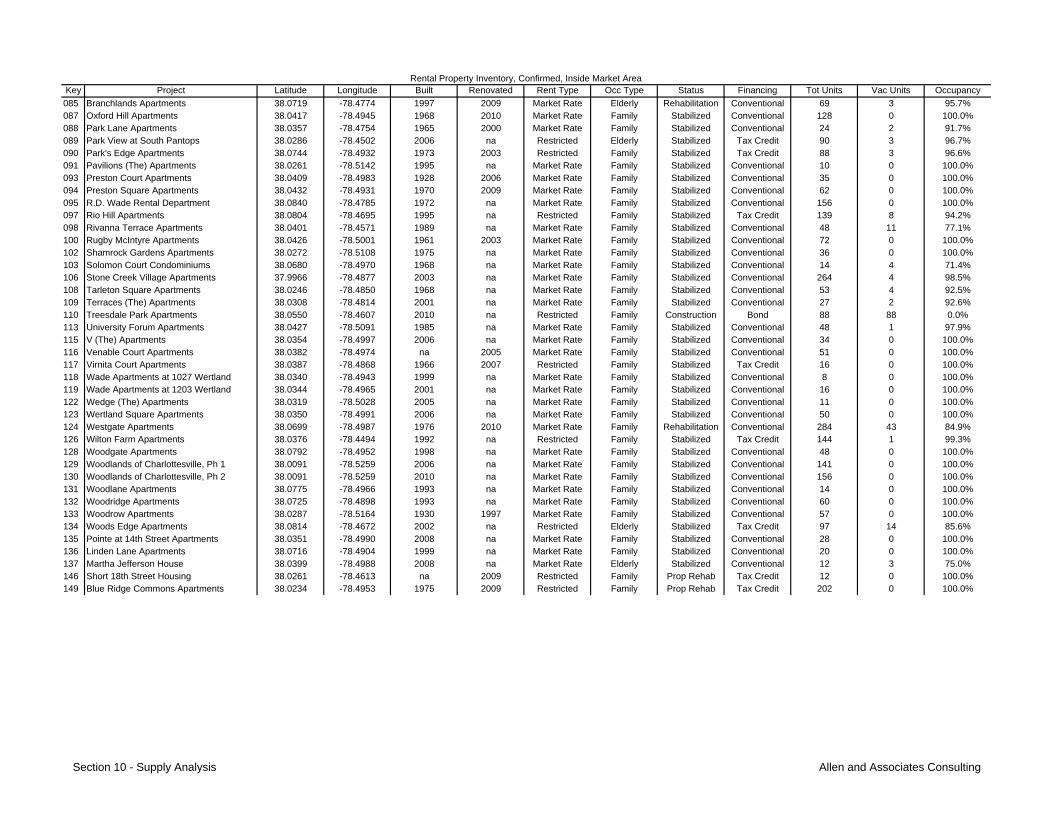
Key Project Latitude Longitude Built Renovated Rent Type Occ Type Status Financing Tot Units Vac Units OccupancyRental Property Inventory, Confirmed, Inside Market Area
085 Branchlands Apartments 38.0719 -78.4774 1997 2009 Market Rate Elderly Rehabilitation Conventional 69 3 95.7%087 Oxford Hill Apartments 38.0417 -78.4945 1968 2010 Market Rate Family Stabilized Conventional 128 0 100.0%088 Park Lane Apartments 38.0357 -78.4754 1965 2000 Market Rate Family Stabilized Conventional 24 2 91.7%089 Park View at South Pantops 38.0286 -78.4502 2006 na Restricted Elderly Stabilized Tax Credit 90 3 96.7%090 Park's Edge Apartments 38.0744 -78.4932 1973 2003 Restricted Family Stabilized Tax Credit 88 3 96.6%091 Pavilions (The) Apartments 38.0261 -78.5142 1995 na Market Rate Family Stabilized Conventional 10 0 100.0%093 Preston Court Apartments 38.0409 -78.4983 1928 2006 Market Rate Family Stabilized Conventional 35 0 100.0%094 Preston Square Apartments 38.0432 -78.4931 1970 2009 Market Rate Family Stabilized Conventional 62 0 100.0%095 R.D. Wade Rental Department 38.0840 -78.4785 1972 na Market Rate Family Stabilized Conventional 156 0 100.0%097 Rio Hill Apartments 38.0804 -78.4695 1995 na Restricted Family Stabilized Tax Credit 139 8 94.2%098 Rivanna Terrace Apartments 38.0401 -78.4571 1989 na Market Rate Family Stabilized Conventional 48 11 77.1%100 Rugby McIntyre Apartments 38.0426 -78.5001 1961 2003 Market Rate Family Stabilized Conventional 72 0 100.0%102 Shamrock Gardens Apartments 38.0272 -78.5108 1975 na Market Rate Family Stabilized Conventional 36 0 100.0%103 Solomon Court Condominiums 38.0680 -78.4970 1968 na Market Rate Family Stabilized Conventional 14 4 71.4%106 Stone Creek Village Apartments 37.9966 -78.4877 2003 na Market Rate Family Stabilized Conventional 264 4 98.5%108 Tarleton Square Apartments 38.0246 -78.4850 1968 na Market Rate Family Stabilized Conventional 53 4 92.5%109 Terraces (The) Apartments 38.0308 -78.4814 2001 na Market Rate Family Stabilized Conventional 27 2 92.6%110 Treesdale Park Apartments 38.0550 -78.4607 2010 na Restricted Family Construction Bond 88 88 0.0%113 University Forum Apartments 38.0427 -78.5091 1985 na Market Rate Family Stabilized Conventional 48 1 97.9%115 V (The) Apartments 38.0354 -78.4997 2006 na Market Rate Family Stabilized Conventional 34 0 100.0%116 Venable Court Apartments 38.0382 -78.4974 na 2005 Market Rate Family Stabilized Conventional 51 0 100.0%117 Virnita Court Apartments 38.0387 -78.4868 1966 2007 Restricted Family Stabilized Tax Credit 16 0 100.0%118 Wade Apartments at 1027 Wertland 38.0340 -78.4943 1999 na Market Rate Family Stabilized Conventional 8 0 100.0%119 Wade Apartments at 1203 Wertland 38.0344 -78.4965 2001 na Market Rate Family Stabilized Conventional 16 0 100.0%122 Wedge (The) Apartments 38.0319 -78.5028 2005 na Market Rate Family Stabilized Conventional 11 0 100.0%123 Wertland Square Apartments 38.0350 -78.4991 2006 na Market Rate Family Stabilized Conventional 50 0 100.0%124 Westgate Apartments 38.0699 -78.4987 1976 2010 Market Rate Family Rehabilitation Conventional 284 43 84.9%126 Wilton Farm Apartments 38.0376 -78.4494 1992 na Restricted Family Stabilized Tax Credit 144 1 99.3%128 Woodgate Apartments 38.0792 -78.4952 1998 na Market Rate Family Stabilized Conventional 48 0 100.0%129 Woodlands of Charlottesville, Ph 1 38.0091 -78.5259 2006 na Market Rate Family Stabilized Conventional 141 0 100.0%130 Woodlands of Charlottesville, Ph 2 38.0091 -78.5259 2010 na Market Rate Family Stabilized Conventional 156 0 100.0%131 Woodlane Apartments 38.0775 -78.4966 1993 na Market Rate Family Stabilized Conventional 14 0 100.0%132 Woodridge Apartments 38.0725 -78.4898 1993 na Market Rate Family Stabilized Conventional 60 0 100.0%133 Woodrow Apartments 38.0287 -78.5164 1930 1997 Market Rate Family Stabilized Conventional 57 0 100.0%134 Woods Edge Apartments 38.0814 -78.4672 2002 na Restricted Elderly Stabilized Tax Credit 97 14 85.6%135 Pointe at 14th Street Apartments 38.0351 -78.4990 2008 na Market Rate Family Stabilized Conventional 28 0 100.0%136 Linden Lane Apartments 38.0716 -78.4904 1999 na Market Rate Family Stabilized Conventional 20 0 100.0%137 Martha Jefferson House 38.0399 -78.4988 2008 na Market Rate Elderly Stabilized Conventional 12 3 75.0%146 Short 18th Street Housing 38.0261 -78.4613 na 2009 Restricted Family Prop Rehab Tax Credit 12 0 100.0%149 Blue Ridge Commons Apartments 38.0234 -78.4953 1975 2009 Restricted Family Prop Rehab Tax Credit 202 0 100.0%
Section 10 - Supply Analysis Allen and Associates Consulting
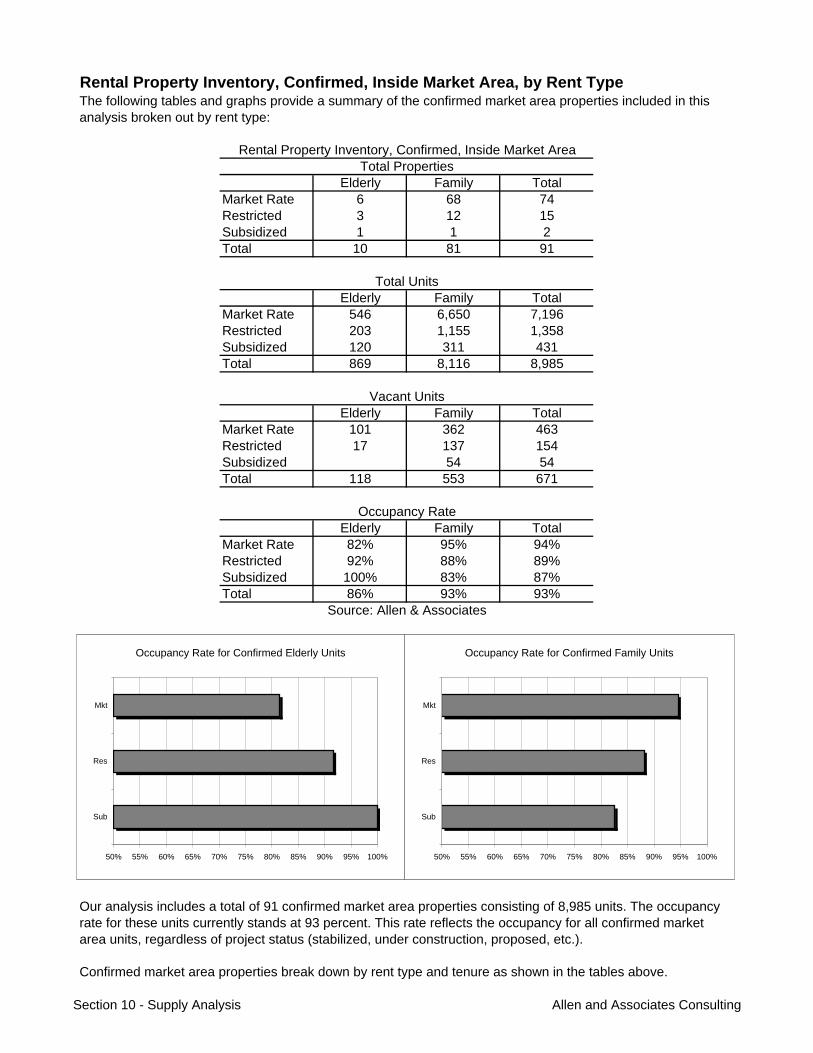
Rental Property Inventory, Confirmed, Inside Market Area, by Rent Type
Elderly Family TotalMarket Rate 6 68 74Restricted 3 12 15Subsidized 1 1 2Total 10 81 91
Elderly Family TotalMarket Rate 546 6,650 7,196Restricted 203 1,155 1,358Subsidized 120 311 431Total 869 8,116 8,985
Elderly Family TotalMarket Rate 101 362 463Restricted 17 137 154Subsidized 54 54Total 118 553 671
Elderly Family TotalMarket Rate 82% 95% 94%Restricted 92% 88% 89%Subsidized 100% 83% 87%Total 86% 93% 93%
Confirmed market area properties break down by rent type and tenure as shown in the tables above.
The following tables and graphs provide a summary of the confirmed market area properties included in this analysis broken out by rent type:
Our analysis includes a total of 91 confirmed market area properties consisting of 8,985 units. The occupancy rate for these units currently stands at 93 percent. This rate reflects the occupancy for all confirmed market area units, regardless of project status (stabilized, under construction, proposed, etc.).
Vacant Units
Occupancy Rate
Source: Allen & Associates
Total PropertiesRental Property Inventory, Confirmed, Inside Market Area
Total Units
Occupancy Rate for Confirmed Elderly Units
50% 55% 60% 65% 70% 75% 80% 85% 90% 95% 100%
Sub
Res
Mkt
Occupancy Rate for Confirmed Family Units
50% 55% 60% 65% 70% 75% 80% 85% 90% 95% 100%
Sub
Res
Mkt
Section 10 - Supply Analysis Allen and Associates Consulting
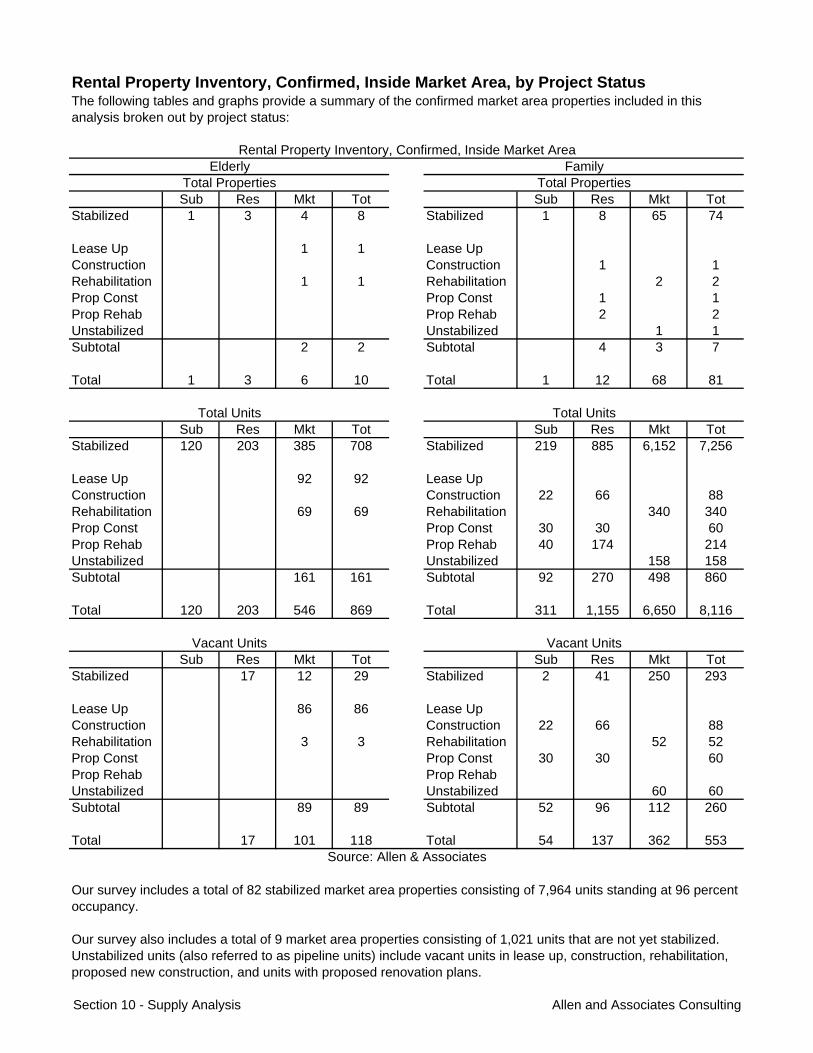
Rental Property Inventory, Confirmed, Inside Market Area, by Project Status
Sub Res Mkt Tot Sub Res Mkt TotStabilized 1 3 4 8 Stabilized 1 8 65 74
Lease Up 1 1 Lease UpConstruction Construction 1 1Rehabilitation 1 1 Rehabilitation 2 2Prop Const Prop Const 1 1Prop Rehab Prop Rehab 2 2Unstabilized Unstabilized 1 1Subtotal 2 2 Subtotal 4 3 7
Total 1 3 6 10 Total 1 12 68 81
Sub Res Mkt Tot Sub Res Mkt TotStabilized 120 203 385 708 Stabilized 219 885 6,152 7,256
Lease Up 92 92 Lease UpConstruction Construction 22 66 88Rehabilitation 69 69 Rehabilitation 340 340Prop Const Prop Const 30 30 60Prop Rehab Prop Rehab 40 174 214Unstabilized Unstabilized 158 158Subtotal 161 161 Subtotal 92 270 498 860
Total 120 203 546 869 Total 311 1,155 6,650 8,116
Sub Res Mkt Tot Sub Res Mkt TotStabilized 17 12 29 Stabilized 2 41 250 293
Lease Up 86 86 Lease UpConstruction Construction 22 66 88Rehabilitation 3 3 Rehabilitation 52 52Prop Const Prop Const 30 30 60Prop Rehab Prop RehabUnstabilized Unstabilized 60 60Subtotal 89 89 Subtotal 52 96 112 260
Total 17 101 118 Total 54 137 362 553
Total Properties Total Properties
Vacant Units
Source: Allen & Associates
Our survey includes a total of 82 stabilized market area properties consisting of 7,964 units standing at 96 percent occupancy.
The following tables and graphs provide a summary of the confirmed market area properties included in this analysis broken out by project status:
Rental Property Inventory, Confirmed, Inside Market AreaElderly Family
Total Units
Vacant Units
Total Units
Our survey also includes a total of 9 market area properties consisting of 1,021 units that are not yet stabilized. Unstabilized units (also referred to as pipeline units) include vacant units in lease up, construction, rehabilitation, proposed new construction, and units with proposed renovation plans.
Section 10 - Supply Analysis Allen and Associates Consulting
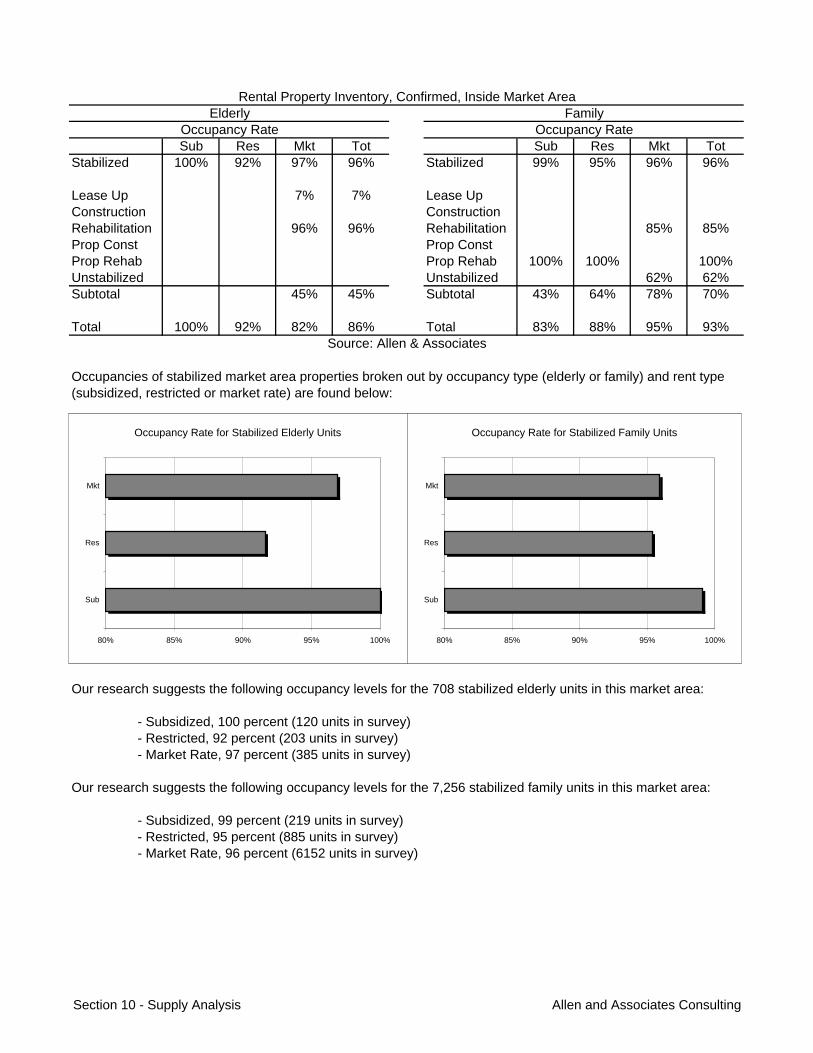
Sub Res Mkt Tot Sub Res Mkt TotStabilized 100% 92% 97% 96% Stabilized 99% 95% 96% 96%
Lease Up 7% 7% Lease UpConstruction ConstructionRehabilitation 96% 96% Rehabilitation 85% 85%Prop Const Prop ConstProp Rehab Prop Rehab 100% 100% 100%Unstabilized Unstabilized 62% 62%Subtotal 45% 45% Subtotal 43% 64% 78% 70%
Total 100% 92% 82% 86% Total 83% 88% 95% 93%
- Restricted, 95 percent (885 units in survey)- Market Rate, 96 percent (6152 units in survey)
Occupancies of stabilized market area properties broken out by occupancy type (elderly or family) and rent type (subsidized, restricted or market rate) are found below:
Our research suggests the following occupancy levels for the 7,256 stabilized family units in this market area:
- Subsidized, 99 percent (219 units in survey)
Our research suggests the following occupancy levels for the 708 stabilized elderly units in this market area:
- Subsidized, 100 percent (120 units in survey)- Restricted, 92 percent (203 units in survey)- Market Rate, 97 percent (385 units in survey)
Source: Allen & Associates
Rental Property Inventory, Confirmed, Inside Market AreaElderly Family
Occupancy Rate Occupancy Rate
Occupancy Rate for Stabilized Elderly Units
80% 85% 90% 95% 100%
Sub
Res
Mkt
Occupancy Rate for Stabilized Family Units
80% 85% 90% 95% 100%
Sub
Res
Mkt
Section 10 - Supply Analysis Allen and Associates Consulting
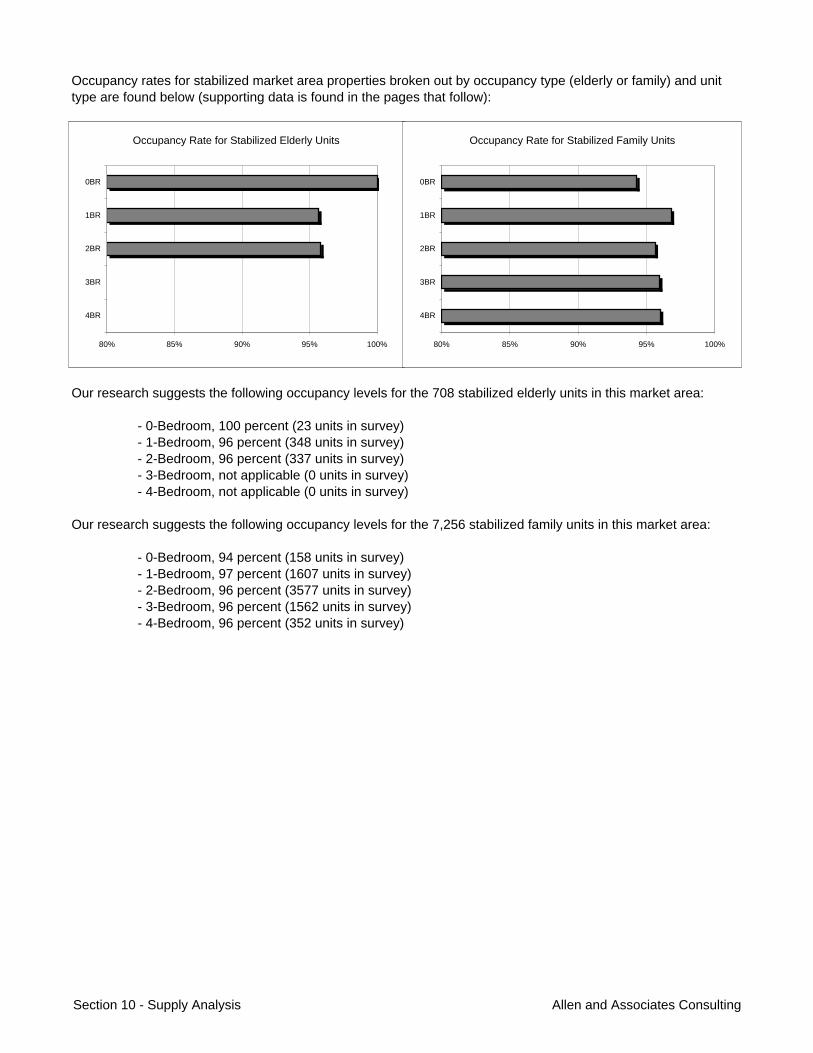
- 3-Bedroom, 96 percent (1562 units in survey)- 4-Bedroom, 96 percent (352 units in survey)
Occupancy rates for stabilized market area properties broken out by occupancy type (elderly or family) and unit type are found below (supporting data is found in the pages that follow):
Our research suggests the following occupancy levels for the 7,256 stabilized family units in this market area:
- 0-Bedroom, 94 percent (158 units in survey)- 1-Bedroom, 97 percent (1607 units in survey)- 2-Bedroom, 96 percent (3577 units in survey)
- 1-Bedroom, 96 percent (348 units in survey)- 2-Bedroom, 96 percent (337 units in survey)- 3-Bedroom, not applicable (0 units in survey)- 4-Bedroom, not applicable (0 units in survey)
Our research suggests the following occupancy levels for the 708 stabilized elderly units in this market area:
- 0-Bedroom, 100 percent (23 units in survey)
Occupancy Rate for Stabilized Elderly Units
80% 85% 90% 95% 100%
4BR
3BR
2BR
1BR
0BR
Occupancy Rate for Stabilized Family Units
80% 85% 90% 95% 100%
4BR
3BR
2BR
1BR
0BR
Section 10 - Supply Analysis Allen and Associates Consulting
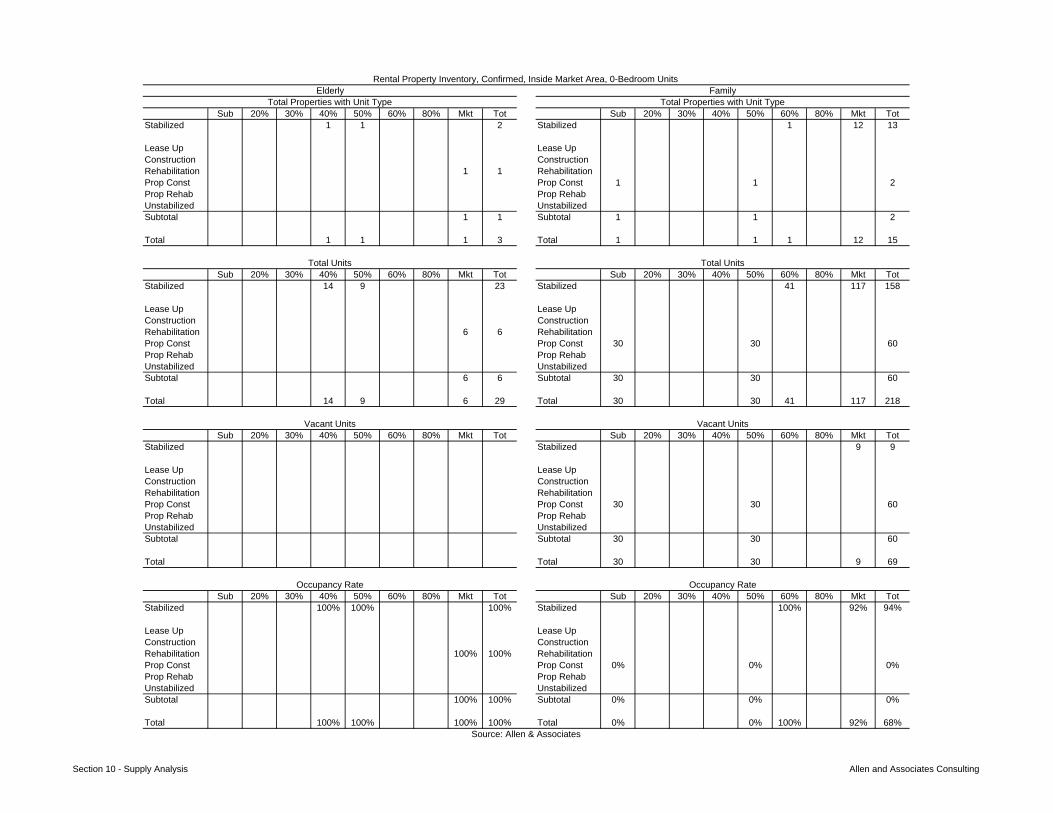
Sub 20% 30% 40% 50% 60% 80% Mkt Tot Sub 20% 30% 40% 50% 60% 80% Mkt TotStabilized 1 1 2 Stabilized 1 12 13
Lease Up Lease UpConstruction ConstructionRehabilitation 1 1 RehabilitationProp Const Prop Const 1 1 2Prop Rehab Prop RehabUnstabilized UnstabilizedSubtotal 1 1 Subtotal 1 1 2
Total 1 1 1 3 Total 1 1 1 12 15
Sub 20% 30% 40% 50% 60% 80% Mkt Tot Sub 20% 30% 40% 50% 60% 80% Mkt TotStabilized 14 9 23 Stabilized 41 117 158
Lease Up Lease UpConstruction ConstructionRehabilitation 6 6 RehabilitationProp Const Prop Const 30 30 60Prop Rehab Prop RehabUnstabilized UnstabilizedSubtotal 6 6 Subtotal 30 30 60
Total 14 9 6 29 Total 30 30 41 117 218
Sub 20% 30% 40% 50% 60% 80% Mkt Tot Sub 20% 30% 40% 50% 60% 80% Mkt TotStabilized Stabilized 9 9
Lease Up Lease UpConstruction ConstructionRehabilitation RehabilitationProp Const Prop Const 30 30 60Prop Rehab Prop RehabUnstabilized UnstabilizedSubtotal Subtotal 30 30 60
Total Total 30 30 9 69
Sub 20% 30% 40% 50% 60% 80% Mkt Tot Sub 20% 30% 40% 50% 60% 80% Mkt TotStabilized 100% 100% 100% Stabilized 100% 92% 94%
Lease Up Lease UpConstruction ConstructionRehabilitation 100% 100% RehabilitationProp Const Prop Const 0% 0% 0%Prop Rehab Prop RehabUnstabilized UnstabilizedSubtotal 100% 100% Subtotal 0% 0% 0%
Total 100% 100% 100% 100% Total 0% 0% 100% 92% 68%
Rental Property Inventory, Confirmed, Inside Market Area, 0-Bedroom Units
Source: Allen & Associates
Occupancy Rate
Elderly Family
Total Units
Vacant Units
Occupancy Rate
Total Units
Vacant Units
Total Properties with Unit Type Total Properties with Unit Type
Section 10 - Supply Analysis Allen and Associates Consulting
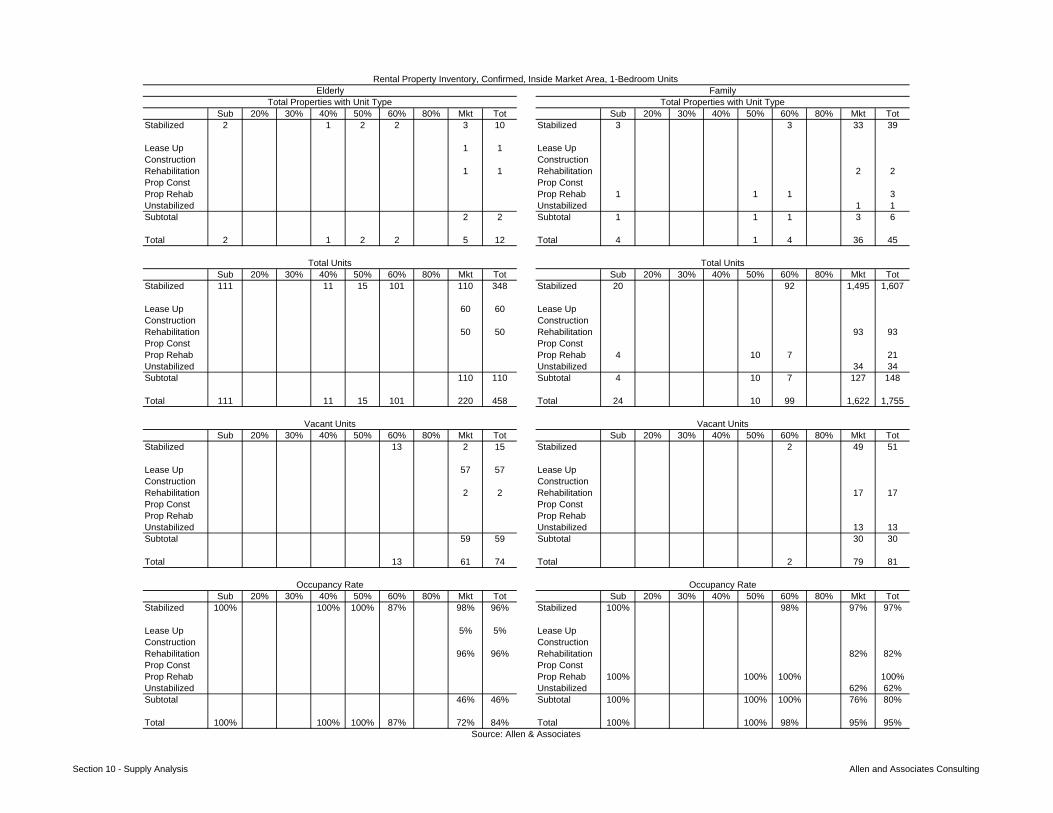
Sub 20% 30% 40% 50% 60% 80% Mkt Tot Sub 20% 30% 40% 50% 60% 80% Mkt TotStabilized 2 1 2 2 3 10 Stabilized 3 3 33 39
Lease Up 1 1 Lease UpConstruction ConstructionRehabilitation 1 1 Rehabilitation 2 2Prop Const Prop ConstProp Rehab Prop Rehab 1 1 1 3Unstabilized Unstabilized 1 1Subtotal 2 2 Subtotal 1 1 1 3 6
Total 2 1 2 2 5 12 Total 4 1 4 36 45
Sub 20% 30% 40% 50% 60% 80% Mkt Tot Sub 20% 30% 40% 50% 60% 80% Mkt TotStabilized 111 11 15 101 110 348 Stabilized 20 92 1,495 1,607
Lease Up 60 60 Lease UpConstruction ConstructionRehabilitation 50 50 Rehabilitation 93 93Prop Const Prop ConstProp Rehab Prop Rehab 4 10 7 21Unstabilized Unstabilized 34 34Subtotal 110 110 Subtotal 4 10 7 127 148
Total 111 11 15 101 220 458 Total 24 10 99 1,622 1,755
Sub 20% 30% 40% 50% 60% 80% Mkt Tot Sub 20% 30% 40% 50% 60% 80% Mkt TotStabilized 13 2 15 Stabilized 2 49 51
Lease Up 57 57 Lease UpConstruction ConstructionRehabilitation 2 2 Rehabilitation 17 17Prop Const Prop ConstProp Rehab Prop RehabUnstabilized Unstabilized 13 13Subtotal 59 59 Subtotal 30 30
Total 13 61 74 Total 2 79 81
Sub 20% 30% 40% 50% 60% 80% Mkt Tot Sub 20% 30% 40% 50% 60% 80% Mkt TotStabilized 100% 100% 100% 87% 98% 96% Stabilized 100% 98% 97% 97%
Lease Up 5% 5% Lease UpConstruction ConstructionRehabilitation 96% 96% Rehabilitation 82% 82%Prop Const Prop ConstProp Rehab Prop Rehab 100% 100% 100% 100%Unstabilized Unstabilized 62% 62%Subtotal 46% 46% Subtotal 100% 100% 100% 76% 80%
Total 100% 100% 100% 87% 72% 84% Total 100% 100% 98% 95% 95%
Rental Property Inventory, Confirmed, Inside Market Area, 1-Bedroom Units
Source: Allen & Associates
Occupancy Rate
Elderly Family
Total Units
Vacant Units
Occupancy Rate
Total Units
Vacant Units
Total Properties with Unit Type Total Properties with Unit Type
Section 10 - Supply Analysis Allen and Associates Consulting

Sub 20% 30% 40% 50% 60% 80% Mkt Tot Sub 20% 30% 40% 50% 60% 80% Mkt TotStabilized 2 1 2 4 9 Stabilized 3 4 7 53 67
Lease Up 1 1 Lease UpConstruction Construction 1 1 2Rehabilitation 1 1 Rehabilitation 2 2Prop Const Prop ConstProp Rehab Prop Rehab 1 1 1 3Unstabilized Unstabilized 1 1Subtotal 2 2 Subtotal 2 2 1 3 8
Total 2 1 2 6 11 Total 5 6 8 56 75
Sub 20% 30% 40% 50% 60% 80% Mkt Tot Sub 20% 30% 40% 50% 60% 80% Mkt TotStabilized 9 2 51 275 337 Stabilized 110 72 442 2,953 3,577
Lease Up 32 32 Lease UpConstruction Construction 6 58 64Rehabilitation 13 13 Rehabilitation 218 218Prop Const Prop ConstProp Rehab Prop Rehab 19 71 7 97Unstabilized Unstabilized 104 104Subtotal 45 45 Subtotal 25 129 7 322 483
Total 9 2 51 320 382 Total 135 201 449 3,275 4,060
Sub 20% 30% 40% 50% 60% 80% Mkt Tot Sub 20% 30% 40% 50% 60% 80% Mkt TotStabilized 4 10 14 Stabilized 1 2 21 132 156
Lease Up 29 29 Lease UpConstruction Construction 6 58 64Rehabilitation 1 1 Rehabilitation 31 31Prop Const Prop ConstProp Rehab Prop RehabUnstabilized Unstabilized 39 39Subtotal 30 30 Subtotal 6 58 70 134
Total 4 40 44 Total 7 60 21 202 290
Sub 20% 30% 40% 50% 60% 80% Mkt Tot Sub 20% 30% 40% 50% 60% 80% Mkt TotStabilized 100% 100% 92% 96% 96% Stabilized 99% 97% 95% 96% 96%
Lease Up 9% 9% Lease UpConstruction Construction 0% 0% 0%Rehabilitation 92% 92% Rehabilitation 86% 86%Prop Const Prop ConstProp Rehab Prop Rehab 100% 100% 100% 100%Unstabilized Unstabilized 63% 63%Subtotal 33% 33% Subtotal 76% 55% 100% 78% 72%
Total 100% 100% 92% 88% 88% Total 95% 70% 95% 94% 93%
Rental Property Inventory, Confirmed, Inside Market Area, 2-Bedroom Units
Source: Allen & Associates
Occupancy Rate
Elderly Family
Total Units
Vacant Units
Occupancy Rate
Total Units
Vacant Units
Total Properties with Unit Type Total Properties with Unit Type
Section 10 - Supply Analysis Allen and Associates Consulting
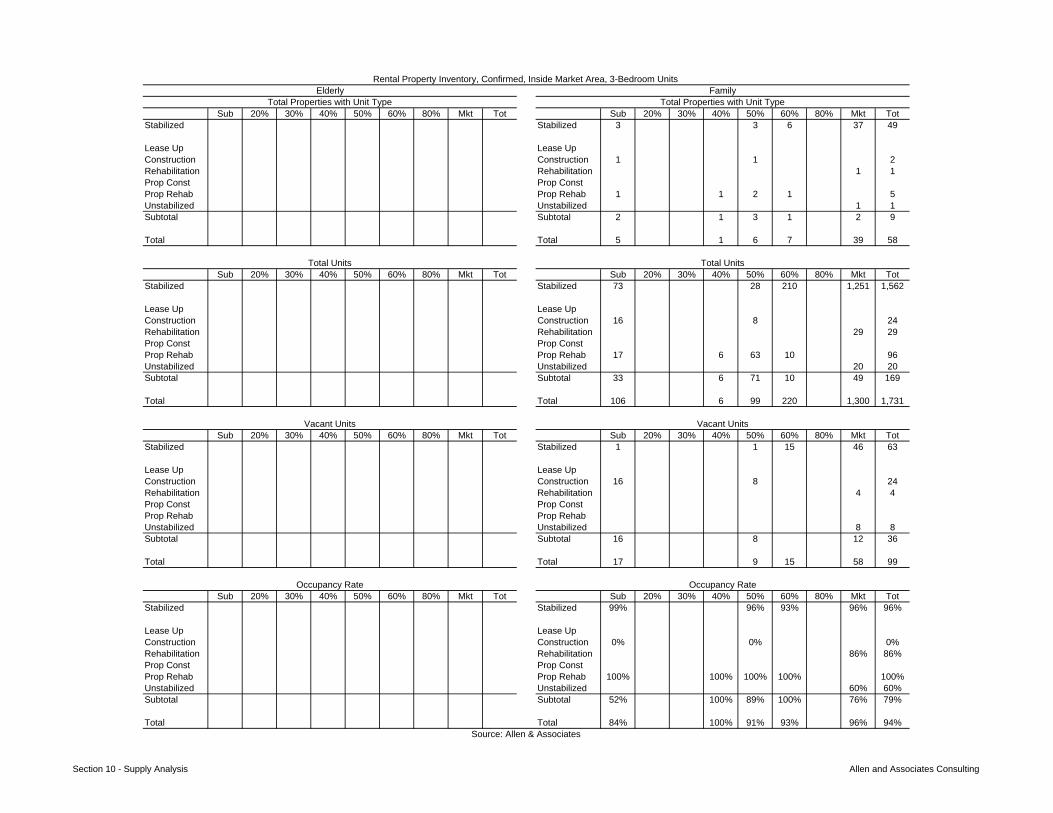
Sub 20% 30% 40% 50% 60% 80% Mkt Tot Sub 20% 30% 40% 50% 60% 80% Mkt TotStabilized Stabilized 3 3 6 37 49
Lease Up Lease UpConstruction Construction 1 1 2Rehabilitation Rehabilitation 1 1Prop Const Prop ConstProp Rehab Prop Rehab 1 1 2 1 5Unstabilized Unstabilized 1 1Subtotal Subtotal 2 1 3 1 2 9
Total Total 5 1 6 7 39 58
Sub 20% 30% 40% 50% 60% 80% Mkt Tot Sub 20% 30% 40% 50% 60% 80% Mkt TotStabilized Stabilized 73 28 210 1,251 1,562
Lease Up Lease UpConstruction Construction 16 8 24Rehabilitation Rehabilitation 29 29Prop Const Prop ConstProp Rehab Prop Rehab 17 6 63 10 96Unstabilized Unstabilized 20 20Subtotal Subtotal 33 6 71 10 49 169
Total Total 106 6 99 220 1,300 1,731
Sub 20% 30% 40% 50% 60% 80% Mkt Tot Sub 20% 30% 40% 50% 60% 80% Mkt TotStabilized Stabilized 1 1 15 46 63
Lease Up Lease UpConstruction Construction 16 8 24Rehabilitation Rehabilitation 4 4Prop Const Prop ConstProp Rehab Prop RehabUnstabilized Unstabilized 8 8Subtotal Subtotal 16 8 12 36
Total Total 17 9 15 58 99
Sub 20% 30% 40% 50% 60% 80% Mkt Tot Sub 20% 30% 40% 50% 60% 80% Mkt TotStabilized Stabilized 99% 96% 93% 96% 96%
Lease Up Lease UpConstruction Construction 0% 0% 0%Rehabilitation Rehabilitation 86% 86%Prop Const Prop ConstProp Rehab Prop Rehab 100% 100% 100% 100% 100%Unstabilized Unstabilized 60% 60%Subtotal Subtotal 52% 100% 89% 100% 76% 79%
Total Total 84% 100% 91% 93% 96% 94%
Rental Property Inventory, Confirmed, Inside Market Area, 3-Bedroom Units
Source: Allen & Associates
Occupancy Rate
Elderly Family
Total Units
Vacant Units
Occupancy Rate
Total Units
Vacant Units
Total Properties with Unit Type Total Properties with Unit Type
Section 10 - Supply Analysis Allen and Associates Consulting
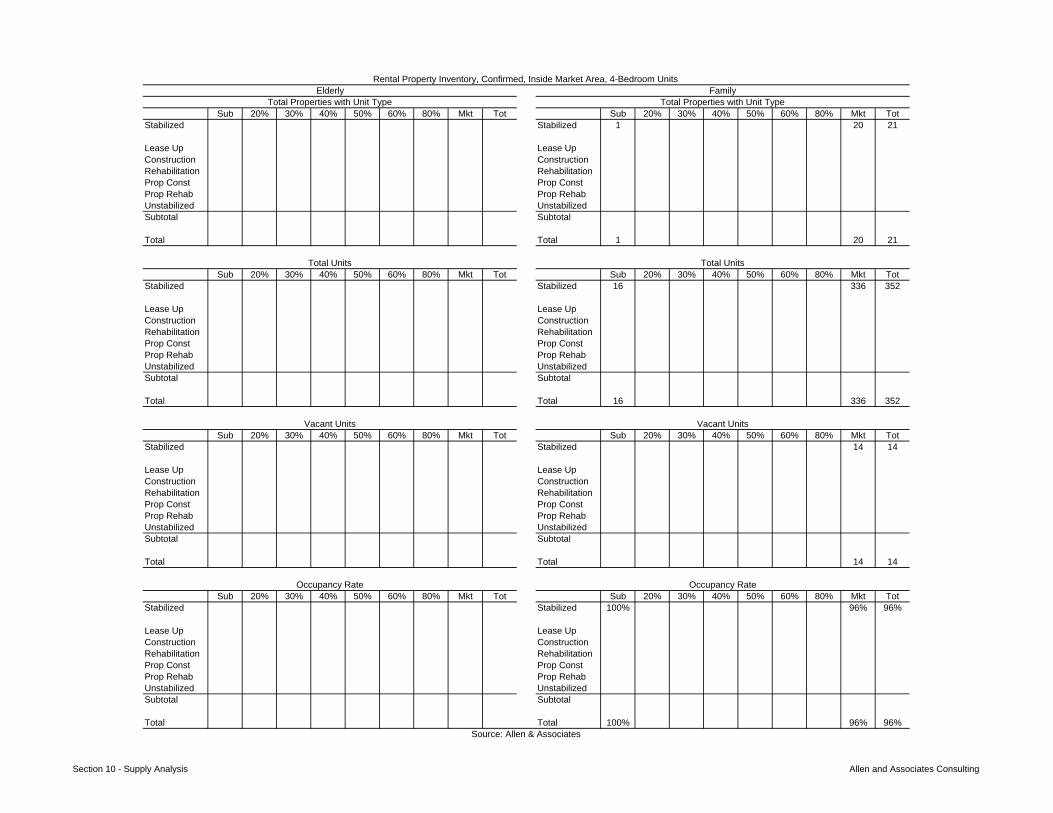
Sub 20% 30% 40% 50% 60% 80% Mkt Tot Sub 20% 30% 40% 50% 60% 80% Mkt TotStabilized Stabilized 1 20 21
Lease Up Lease UpConstruction ConstructionRehabilitation RehabilitationProp Const Prop ConstProp Rehab Prop RehabUnstabilized UnstabilizedSubtotal Subtotal
Total Total 1 20 21
Sub 20% 30% 40% 50% 60% 80% Mkt Tot Sub 20% 30% 40% 50% 60% 80% Mkt TotStabilized Stabilized 16 336 352
Lease Up Lease UpConstruction ConstructionRehabilitation RehabilitationProp Const Prop ConstProp Rehab Prop RehabUnstabilized UnstabilizedSubtotal Subtotal
Total Total 16 336 352
Sub 20% 30% 40% 50% 60% 80% Mkt Tot Sub 20% 30% 40% 50% 60% 80% Mkt TotStabilized Stabilized 14 14
Lease Up Lease UpConstruction ConstructionRehabilitation RehabilitationProp Const Prop ConstProp Rehab Prop RehabUnstabilized UnstabilizedSubtotal Subtotal
Total Total 14 14
Sub 20% 30% 40% 50% 60% 80% Mkt Tot Sub 20% 30% 40% 50% 60% 80% Mkt TotStabilized Stabilized 100% 96% 96%
Lease Up Lease UpConstruction ConstructionRehabilitation RehabilitationProp Const Prop ConstProp Rehab Prop RehabUnstabilized UnstabilizedSubtotal Subtotal
Total Total 100% 96% 96%
Rental Property Inventory, Confirmed, Inside Market Area, 4-Bedroom Units
Source: Allen & Associates
Occupancy Rate
Elderly Family
Total Units
Vacant Units
Occupancy Rate
Total Units
Vacant Units
Total Properties with Unit Type Total Properties with Unit Type
Section 10 - Supply Analysis Allen and Associates Consulting
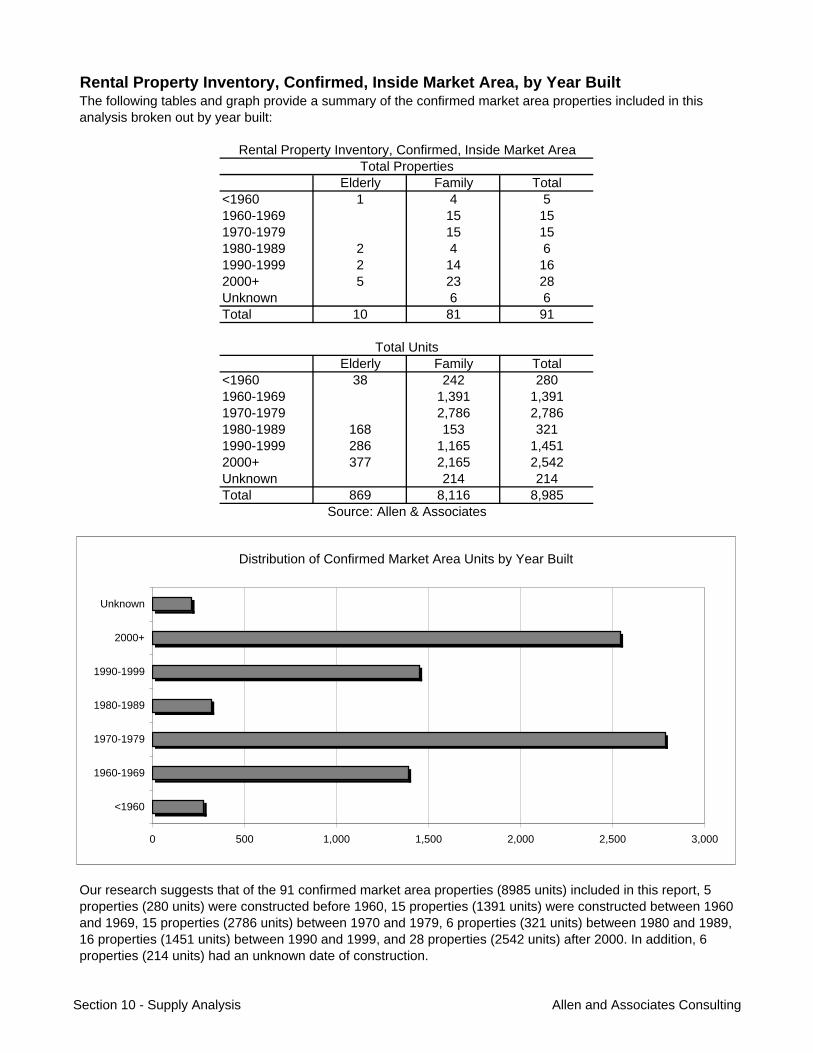
Rental Property Inventory, Confirmed, Inside Market Area, by Year Built
Elderly Family Total<1960 1 4 51960-1969 15 151970-1979 15 151980-1989 2 4 61990-1999 2 14 162000+ 5 23 28Unknown 6 6Total 10 81 91
Elderly Family Total<1960 38 242 2801960-1969 1,391 1,3911970-1979 2,786 2,7861980-1989 168 153 3211990-1999 286 1,165 1,4512000+ 377 2,165 2,542Unknown 214 214Total 869 8,116 8,985
The following tables and graph provide a summary of the confirmed market area properties included in this analysis broken out by year built:
Our research suggests that of the 91 confirmed market area properties (8985 units) included in this report, 5 properties (280 units) were constructed before 1960, 15 properties (1391 units) were constructed between 1960 and 1969, 15 properties (2786 units) between 1970 and 1979, 6 properties (321 units) between 1980 and 1989, 16 properties (1451 units) between 1990 and 1999, and 28 properties (2542 units) after 2000. In addition, 6 properties (214 units) had an unknown date of construction.
Rental Property Inventory, Confirmed, Inside Market AreaTotal Properties
Total Units
Source: Allen & Associates
Distribution of Confirmed Market Area Units by Year Built
0 500 1,000 1,500 2,000 2,500 3,000
<1960
1960-1969
1970-1979
1980-1989
1990-1999
2000+
Unknown
Section 10 - Supply Analysis Allen and Associates Consulting
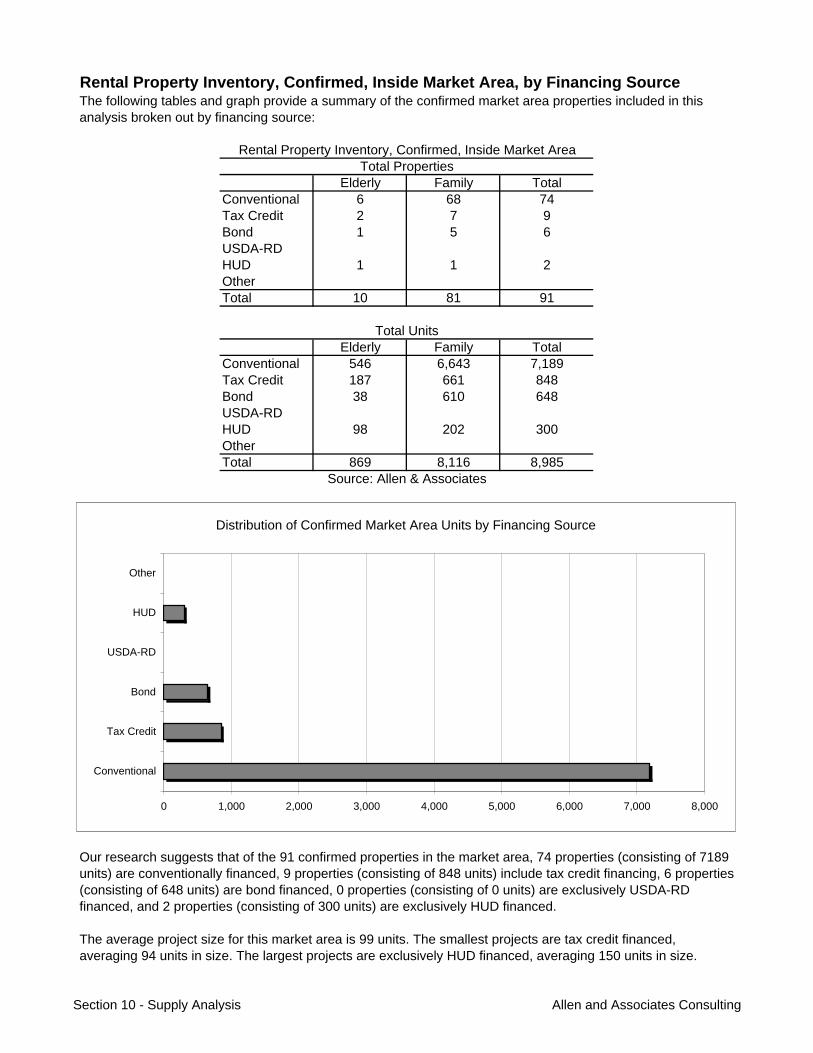
Rental Property Inventory, Confirmed, Inside Market Area, by Financing Source
Elderly Family TotalConventional 6 68 74Tax Credit 2 7 9Bond 1 5 6USDA-RDHUD 1 1 2OtherTotal 10 81 91
Elderly Family TotalConventional 546 6,643 7,189Tax Credit 187 661 848Bond 38 610 648USDA-RDHUD 98 202 300OtherTotal 869 8,116 8,985
The average project size for this market area is 99 units. The smallest projects are tax credit financed, averaging 94 units in size. The largest projects are exclusively HUD financed, averaging 150 units in size.
The following tables and graph provide a summary of the confirmed market area properties included in this analysis broken out by financing source:
Our research suggests that of the 91 confirmed properties in the market area, 74 properties (consisting of 7189 units) are conventionally financed, 9 properties (consisting of 848 units) include tax credit financing, 6 properties (consisting of 648 units) are bond financed, 0 properties (consisting of 0 units) are exclusively USDA-RD financed, and 2 properties (consisting of 300 units) are exclusively HUD financed.
Rental Property Inventory, Confirmed, Inside Market AreaTotal Properties
Total Units
Source: Allen & Associates
Distribution of Confirmed Market Area Units by Financing Source
0 1,000 2,000 3,000 4,000 5,000 6,000 7,000 8,000
Conventional
Tax Credit
Bond
USDA-RD
HUD
Other
Section 10 - Supply Analysis Allen and Associates Consulting
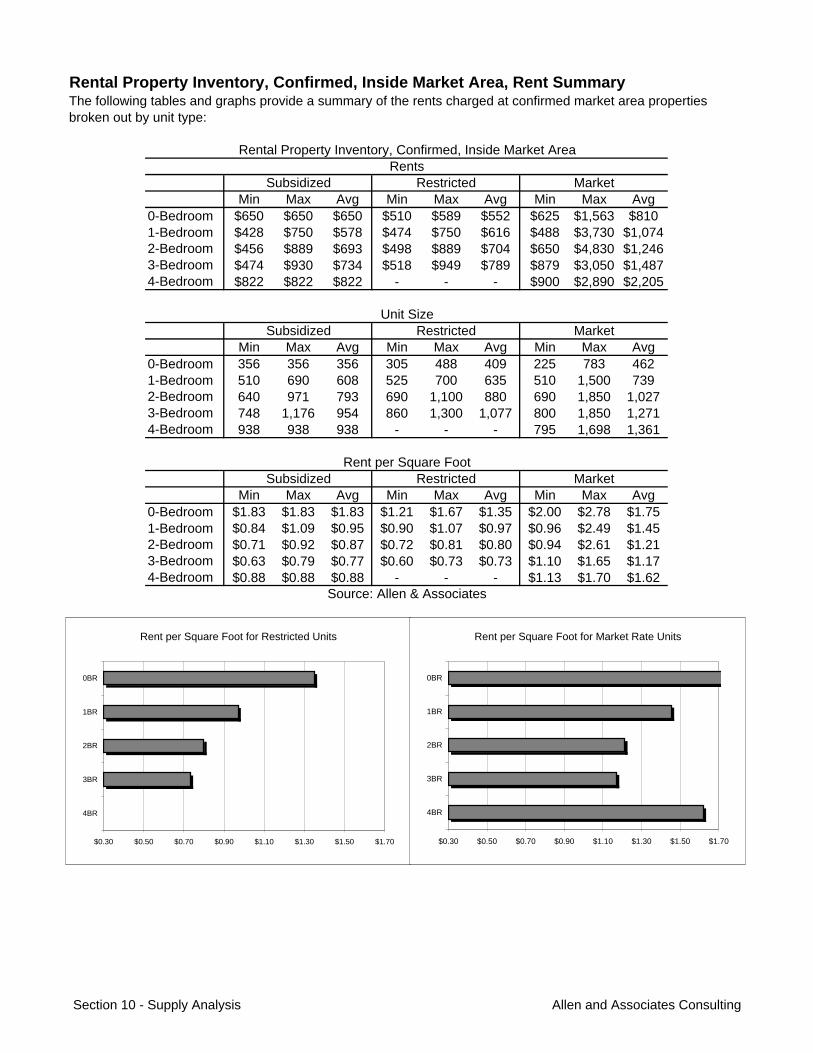
Rental Property Inventory, Confirmed, Inside Market Area, Rent Summary
Min Max Avg Min Max Avg Min Max Avg0-Bedroom $650 $650 $650 $510 $589 $552 $625 $1,563 $8101-Bedroom $428 $750 $578 $474 $750 $616 $488 $3,730 $1,0742-Bedroom $456 $889 $693 $498 $889 $704 $650 $4,830 $1,2463-Bedroom $474 $930 $734 $518 $949 $789 $879 $3,050 $1,4874-Bedroom $822 $822 $822 - - - $900 $2,890 $2,205
Min Max Avg Min Max Avg Min Max Avg0-Bedroom 356 356 356 305 488 409 225 783 4621-Bedroom 510 690 608 525 700 635 510 1,500 7392-Bedroom 640 971 793 690 1,100 880 690 1,850 1,0273-Bedroom 748 1,176 954 860 1,300 1,077 800 1,850 1,2714-Bedroom 938 938 938 - - - 795 1,698 1,361
Min Max Avg Min Max Avg Min Max Avg0-Bedroom $1.83 $1.83 $1.83 $1.21 $1.67 $1.35 $2.00 $2.78 $1.751-Bedroom $0.84 $1.09 $0.95 $0.90 $1.07 $0.97 $0.96 $2.49 $1.452-Bedroom $0.71 $0.92 $0.87 $0.72 $0.81 $0.80 $0.94 $2.61 $1.213-Bedroom $0.63 $0.79 $0.77 $0.60 $0.73 $0.73 $1.10 $1.65 $1.174-Bedroom $0.88 $0.88 $0.88 - - - $1.13 $1.70 $1.62
The following tables and graphs provide a summary of the rents charged at confirmed market area properties broken out by unit type:
Market
Source: Allen & Associates
RentsRental Property Inventory, Confirmed, Inside Market Area
Subsidized Restricted Market
Unit SizeSubsidized Restricted
Rent per Square FootSubsidized Restricted Market
Rent per Square Foot for Restricted Units
$0.30 $0.50 $0.70 $0.90 $1.10 $1.30 $1.50 $1.70
4BR
3BR
2BR
1BR
0BR
Rent per Square Foot for Market Rate Units
$0.30 $0.50 $0.70 $0.90 $1.10 $1.30 $1.50 $1.70
4BR
3BR
2BR
1BR
0BR
Section 10 - Supply Analysis Allen and Associates Consulting
A detailed listing of rents and floor areas for confirmed market area properties by unit type and income target is found in the following pages.
- 1-Bedroom, $1.45 per square foot- 2-Bedroom, $1.21 per square foot- 3-Bedroom, $1.17 per square foot- 4-Bedroom, $1.62 per square foot
- 3-Bedroom, $0.73 per square foot- 4-Bedroom, not applicable
Our research suggests the following average rent levels for confirmed market rate units:
- 0-Bedroom, $1.75 per square foot
Our research suggests the following average rent levels for confirmed restricted rent units:
- 0-Bedroom, $1.35 per square foot- 1-Bedroom, $0.97 per square foot- 2-Bedroom, $0.80 per square foot
Section 10 - Supply Analysis Allen and Associates Consulting

Key Property Name Built Renovated Rent Type Occ Type Status Sub 20% 30% 40% 50% 60% 80% Mkt Sub 20% 30% 40% 50% 60% 80% Mkt
001 1115 Wertland Street Apartments 2008 na Market Rate Family Stabilized005 600 Brandon Avenue Apartments 1963 2002 Market Rate Family Stabilized006 Abbington Crossing Apartments 1975 2005 Market Rate Family Stabilized008 Alcove (The) Apartments 1965 na Market Rate Family Stabilized $625 390009 Arbor Crest Apartments 1984 2000 Market Rate Elderly Stabilized010 Arlington Boulevard Townhouses na na Market Rate Family Stabilized011 Ashtree Apartments and Townhomes 1972 2008 Market Rate Family Stabilized012 Autumn Hill Apartments 1965 2000 Market Rate Family Stabilized013 Avemore Apartments 2005 na Market Rate Family Stabilized014 Barclay Place Apartments 1993 na Market Rate Family Unstabilized015 Barracks West Apartments 1965 2010 Market Rate Family Stabilized $625 459016 Barringer (The) at Monroe Lane 2008 na Market Rate Family Stabilized018 Berkshire Apartments 1968 2003 Market Rate Family Stabilized019 Blue Ridge Commons Apartments 1975 1997 Restricted Family Stabilized020 Brandon Apartments 1950 na Market Rate Family Stabilized $650 400021 Brandywine Townhomes 1989 2008 Market Rate Family Stabilized023 Cambridge Square Apartments 1968 2008 Market Rate Family Stabilized $650 350024 Camden Plaza Apartments 2004 na Market Rate Family Stabilized $699 500025 Carratt Apartments 1975 na Market Rate Family Stabilized027 Carriage Hill Apartments 2002 na Market Rate Family Stabilized028 Carrollton Terrace Apartments 2005 na Market Rate Family Stabilized029 Cavalier Court Apartments 1975 na Market Rate Family Stabilized031 Crossings at Fourth & Preston (The) 2010 na Restricted Family Prop Const $650 $510 356 356034 University Place Apartments 2002 na Market Rate Family Stabilized036 Crossroads (The) Apartments 1996 na Market Rate Family Stabilized038 Eagles Landing Apartments 2003 na Market Rate Family Stabilized041 Fountain Court Apartments 1960 2009 Market Rate Family Rehabilitation043 Friendship Court Apartments 1975 2004 Subsidized Family Stabilized048 Graduate Court Apartments - Rugby na na Market Rate Family Stabilized053 Hearthwood Apartments 1972 1997 Restricted Family Stabilized $589 305057 Huntington Village Apartments na na Market Rate Family Stabilized059 Colonnades Sunrise Independ. Living 1991 na Market Rate Elderly Stabilized060 Inglewood Square Apartments 1969 2005 Market Rate Family Stabilized061 Ivy Gardens, Phases 1, 2 & 3 1973 2005 Market Rate Family Stabilized062 Jefferson Commons Apartments 2007 na Market Rate Family Stabilized063 Jefferson Heights at Pantops Mtn 2003 na Market Rate Elderly Stabilized064 Jefferson Ridge Apartments 2003 na Market Rate Family Stabilized065 Jeffersonian Apartments 1968 1975 Market Rate Family Stabilized066 John Street Place Apartments 2001 na Market Rate Family Stabilized067 Bailey House at Avemore 2009 na Market Rate Elderly Lease Up068 Lakeside Apartments 1995 na Market Rate Family Stabilized069 Landmark Apartments 1987 na Market Rate Family Stabilized070 Longwood Park Apartments na na Market Rate Family Stabilized072 Mallside Forest Apartments 1998 na Restricted Family Stabilized073 Maywood Apartments 1998 na Market Rate Family Stabilized075 Meriwether Apartments 2006 na Market Rate Family Stabilized077 Midway Manor Apartments 1981 2000 Subsidized Elderly Stabilized080 Monticello Vista Elderly Apartments 1900 2009 Restricted Elderly Stabilized $565 $545 488 488081 Monticello Vista Family Apartments 1993 na Restricted Family Stabilized083 Norcross Station, Phases 1, 2, 3 1924 2004 Market Rate Family Stabilized084 North Woods at the Four Seasons 1975 2001 Market Rate Family Stabilized085 Branchlands Apartments 1997 2009 Market Rate Elderly Rehabilitation $1,563 513087 Oxford Hill Apartments 1968 2010 Market Rate Family Stabilized088 Park Lane Apartments 1965 2000 Market Rate Family Stabilized089 Park View at South Pantops 2006 na Restricted Elderly Stabilized090 Park's Edge Apartments 1973 2003 Restricted Family Stabilized091 Pavilions (The) Apartments 1995 na Market Rate Family Stabilized093 Preston Court Apartments 1928 2006 Market Rate Family Stabilized094 Preston Square Apartments 1970 2009 Market Rate Family Stabilized $690 450
Rental Property Inventory, Confirmed, Inside Market Area, 0-Bedroom UnitsUnit SizeRentsOverview
Section 10 - Supply Analysis Allen and Associates Consulting
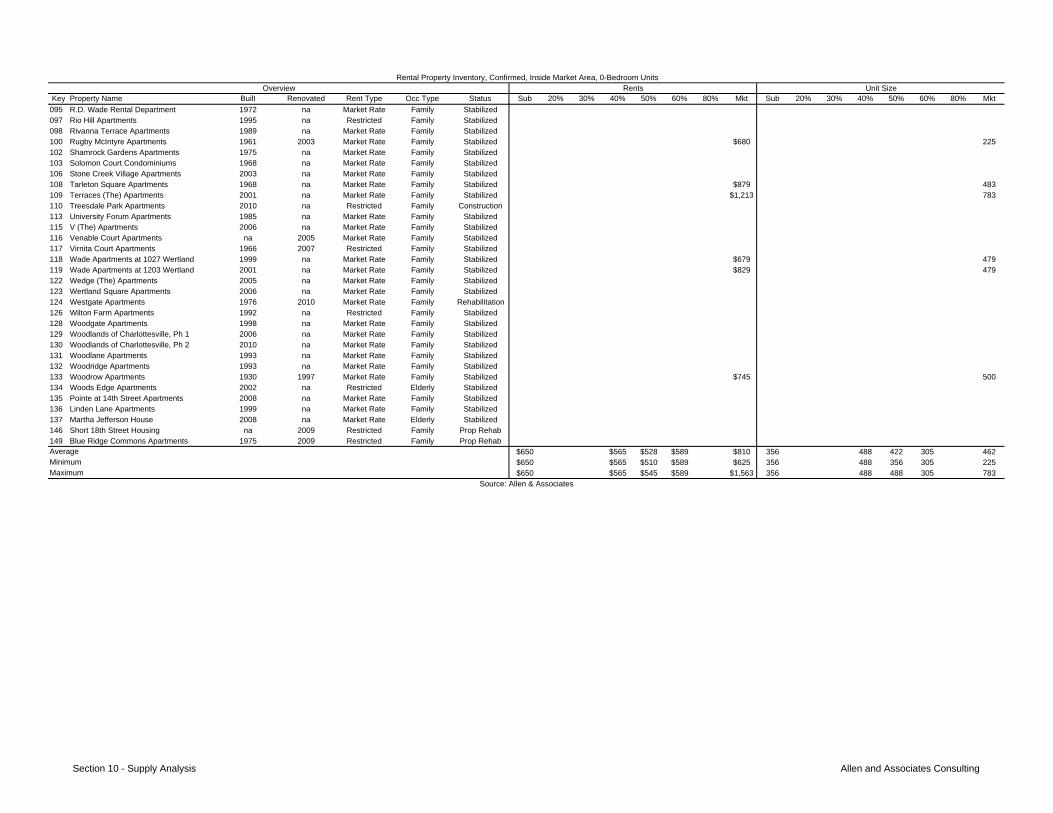
Key Property Name Built Renovated Rent Type Occ Type Status Sub 20% 30% 40% 50% 60% 80% Mkt Sub 20% 30% 40% 50% 60% 80% Mkt
Rental Property Inventory, Confirmed, Inside Market Area, 0-Bedroom UnitsUnit SizeRentsOverview
095 R.D. Wade Rental Department 1972 na Market Rate Family Stabilized097 Rio Hill Apartments 1995 na Restricted Family Stabilized098 Rivanna Terrace Apartments 1989 na Market Rate Family Stabilized100 Rugby McIntyre Apartments 1961 2003 Market Rate Family Stabilized $680 225102 Shamrock Gardens Apartments 1975 na Market Rate Family Stabilized103 Solomon Court Condominiums 1968 na Market Rate Family Stabilized106 Stone Creek Village Apartments 2003 na Market Rate Family Stabilized108 Tarleton Square Apartments 1968 na Market Rate Family Stabilized $879 483109 Terraces (The) Apartments 2001 na Market Rate Family Stabilized $1,213 783110 Treesdale Park Apartments 2010 na Restricted Family Construction113 University Forum Apartments 1985 na Market Rate Family Stabilized115 V (The) Apartments 2006 na Market Rate Family Stabilized116 Venable Court Apartments na 2005 Market Rate Family Stabilized117 Virnita Court Apartments 1966 2007 Restricted Family Stabilized118 Wade Apartments at 1027 Wertland 1999 na Market Rate Family Stabilized $679 479119 Wade Apartments at 1203 Wertland 2001 na Market Rate Family Stabilized $829 479122 Wedge (The) Apartments 2005 na Market Rate Family Stabilized123 Wertland Square Apartments 2006 na Market Rate Family Stabilized124 Westgate Apartments 1976 2010 Market Rate Family Rehabilitation126 Wilton Farm Apartments 1992 na Restricted Family Stabilized128 Woodgate Apartments 1998 na Market Rate Family Stabilized129 Woodlands of Charlottesville, Ph 1 2006 na Market Rate Family Stabilized130 Woodlands of Charlottesville, Ph 2 2010 na Market Rate Family Stabilized131 Woodlane Apartments 1993 na Market Rate Family Stabilized132 Woodridge Apartments 1993 na Market Rate Family Stabilized133 Woodrow Apartments 1930 1997 Market Rate Family Stabilized $745 500134 Woods Edge Apartments 2002 na Restricted Elderly Stabilized135 Pointe at 14th Street Apartments 2008 na Market Rate Family Stabilized136 Linden Lane Apartments 1999 na Market Rate Family Stabilized137 Martha Jefferson House 2008 na Market Rate Elderly Stabilized146 Short 18th Street Housing na 2009 Restricted Family Prop Rehab149 Blue Ridge Commons Apartments 1975 2009 Restricted Family Prop Rehab
$650 $565 $528 $589 $810 356 488 422 305 462$650 $565 $510 $589 $625 356 488 356 305 225$650 $565 $545 $589 $1,563 356 488 488 305 783
Average
Source: Allen & Associates
MinimumMaximum
Section 10 - Supply Analysis Allen and Associates Consulting
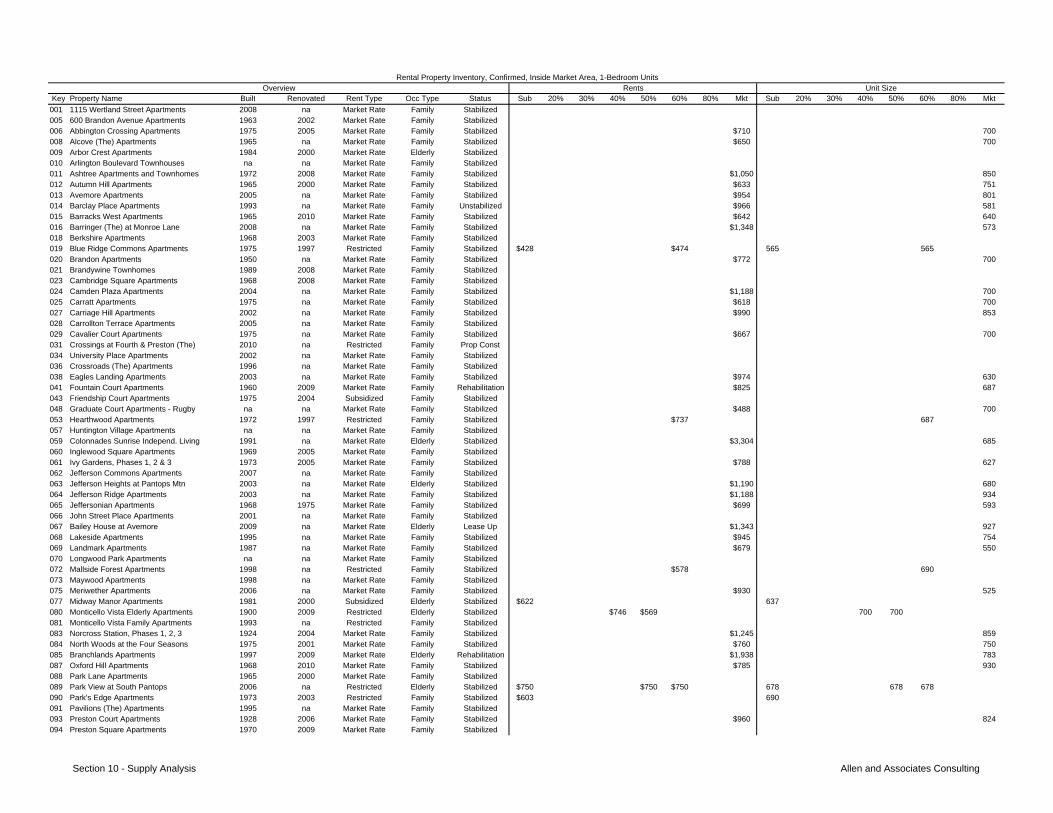
Key Property Name Built Renovated Rent Type Occ Type Status Sub 20% 30% 40% 50% 60% 80% Mkt Sub 20% 30% 40% 50% 60% 80% Mkt
001 1115 Wertland Street Apartments 2008 na Market Rate Family Stabilized005 600 Brandon Avenue Apartments 1963 2002 Market Rate Family Stabilized006 Abbington Crossing Apartments 1975 2005 Market Rate Family Stabilized $710 700008 Alcove (The) Apartments 1965 na Market Rate Family Stabilized $650 700009 Arbor Crest Apartments 1984 2000 Market Rate Elderly Stabilized010 Arlington Boulevard Townhouses na na Market Rate Family Stabilized011 Ashtree Apartments and Townhomes 1972 2008 Market Rate Family Stabilized $1,050 850012 Autumn Hill Apartments 1965 2000 Market Rate Family Stabilized $633 751013 Avemore Apartments 2005 na Market Rate Family Stabilized $954 801014 Barclay Place Apartments 1993 na Market Rate Family Unstabilized $966 581015 Barracks West Apartments 1965 2010 Market Rate Family Stabilized $642 640016 Barringer (The) at Monroe Lane 2008 na Market Rate Family Stabilized $1,348 573018 Berkshire Apartments 1968 2003 Market Rate Family Stabilized019 Blue Ridge Commons Apartments 1975 1997 Restricted Family Stabilized $428 $474 565 565020 Brandon Apartments 1950 na Market Rate Family Stabilized $772 700021 Brandywine Townhomes 1989 2008 Market Rate Family Stabilized023 Cambridge Square Apartments 1968 2008 Market Rate Family Stabilized024 Camden Plaza Apartments 2004 na Market Rate Family Stabilized $1,188 700025 Carratt Apartments 1975 na Market Rate Family Stabilized $618 700027 Carriage Hill Apartments 2002 na Market Rate Family Stabilized $990 853028 Carrollton Terrace Apartments 2005 na Market Rate Family Stabilized029 Cavalier Court Apartments 1975 na Market Rate Family Stabilized $667 700031 Crossings at Fourth & Preston (The) 2010 na Restricted Family Prop Const034 University Place Apartments 2002 na Market Rate Family Stabilized036 Crossroads (The) Apartments 1996 na Market Rate Family Stabilized038 Eagles Landing Apartments 2003 na Market Rate Family Stabilized $974 630041 Fountain Court Apartments 1960 2009 Market Rate Family Rehabilitation $825 687043 Friendship Court Apartments 1975 2004 Subsidized Family Stabilized048 Graduate Court Apartments - Rugby na na Market Rate Family Stabilized $488 700053 Hearthwood Apartments 1972 1997 Restricted Family Stabilized $737 687057 Huntington Village Apartments na na Market Rate Family Stabilized059 Colonnades Sunrise Independ. Living 1991 na Market Rate Elderly Stabilized $3,304 685060 Inglewood Square Apartments 1969 2005 Market Rate Family Stabilized061 Ivy Gardens, Phases 1, 2 & 3 1973 2005 Market Rate Family Stabilized $788 627062 Jefferson Commons Apartments 2007 na Market Rate Family Stabilized063 Jefferson Heights at Pantops Mtn 2003 na Market Rate Elderly Stabilized $1,190 680064 Jefferson Ridge Apartments 2003 na Market Rate Family Stabilized $1,188 934065 Jeffersonian Apartments 1968 1975 Market Rate Family Stabilized $699 593066 John Street Place Apartments 2001 na Market Rate Family Stabilized067 Bailey House at Avemore 2009 na Market Rate Elderly Lease Up $1,343 927068 Lakeside Apartments 1995 na Market Rate Family Stabilized $945 754069 Landmark Apartments 1987 na Market Rate Family Stabilized $679 550070 Longwood Park Apartments na na Market Rate Family Stabilized072 Mallside Forest Apartments 1998 na Restricted Family Stabilized $578 690073 Maywood Apartments 1998 na Market Rate Family Stabilized075 Meriwether Apartments 2006 na Market Rate Family Stabilized $930 525077 Midway Manor Apartments 1981 2000 Subsidized Elderly Stabilized $622 637080 Monticello Vista Elderly Apartments 1900 2009 Restricted Elderly Stabilized $746 $569 700 700081 Monticello Vista Family Apartments 1993 na Restricted Family Stabilized083 Norcross Station, Phases 1, 2, 3 1924 2004 Market Rate Family Stabilized $1,245 859084 North Woods at the Four Seasons 1975 2001 Market Rate Family Stabilized $760 750085 Branchlands Apartments 1997 2009 Market Rate Elderly Rehabilitation $1,938 783087 Oxford Hill Apartments 1968 2010 Market Rate Family Stabilized $785 930088 Park Lane Apartments 1965 2000 Market Rate Family Stabilized089 Park View at South Pantops 2006 na Restricted Elderly Stabilized $750 $750 $750 678 678 678090 Park's Edge Apartments 1973 2003 Restricted Family Stabilized $603 690091 Pavilions (The) Apartments 1995 na Market Rate Family Stabilized093 Preston Court Apartments 1928 2006 Market Rate Family Stabilized $960 824094 Preston Square Apartments 1970 2009 Market Rate Family Stabilized
Rental Property Inventory, Confirmed, Inside Market Area, 1-Bedroom UnitsUnit SizeRentsOverview
Section 10 - Supply Analysis Allen and Associates Consulting
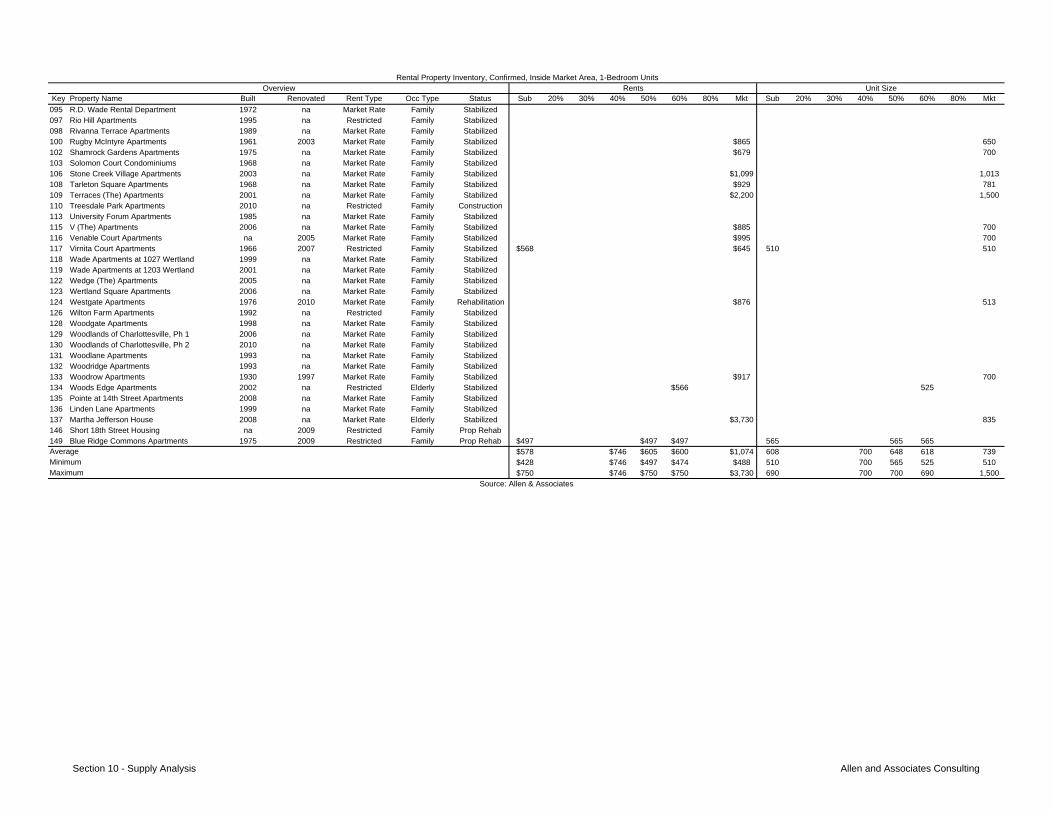
Key Property Name Built Renovated Rent Type Occ Type Status Sub 20% 30% 40% 50% 60% 80% Mkt Sub 20% 30% 40% 50% 60% 80% Mkt
Rental Property Inventory, Confirmed, Inside Market Area, 1-Bedroom UnitsUnit SizeRentsOverview
095 R.D. Wade Rental Department 1972 na Market Rate Family Stabilized097 Rio Hill Apartments 1995 na Restricted Family Stabilized098 Rivanna Terrace Apartments 1989 na Market Rate Family Stabilized100 Rugby McIntyre Apartments 1961 2003 Market Rate Family Stabilized $865 650102 Shamrock Gardens Apartments 1975 na Market Rate Family Stabilized $679 700103 Solomon Court Condominiums 1968 na Market Rate Family Stabilized106 Stone Creek Village Apartments 2003 na Market Rate Family Stabilized $1,099 1,013108 Tarleton Square Apartments 1968 na Market Rate Family Stabilized $929 781109 Terraces (The) Apartments 2001 na Market Rate Family Stabilized $2,200 1,500110 Treesdale Park Apartments 2010 na Restricted Family Construction113 University Forum Apartments 1985 na Market Rate Family Stabilized115 V (The) Apartments 2006 na Market Rate Family Stabilized $885 700116 Venable Court Apartments na 2005 Market Rate Family Stabilized $995 700117 Virnita Court Apartments 1966 2007 Restricted Family Stabilized $568 $645 510 510118 Wade Apartments at 1027 Wertland 1999 na Market Rate Family Stabilized119 Wade Apartments at 1203 Wertland 2001 na Market Rate Family Stabilized122 Wedge (The) Apartments 2005 na Market Rate Family Stabilized123 Wertland Square Apartments 2006 na Market Rate Family Stabilized124 Westgate Apartments 1976 2010 Market Rate Family Rehabilitation $876 513126 Wilton Farm Apartments 1992 na Restricted Family Stabilized128 Woodgate Apartments 1998 na Market Rate Family Stabilized129 Woodlands of Charlottesville, Ph 1 2006 na Market Rate Family Stabilized130 Woodlands of Charlottesville, Ph 2 2010 na Market Rate Family Stabilized131 Woodlane Apartments 1993 na Market Rate Family Stabilized132 Woodridge Apartments 1993 na Market Rate Family Stabilized133 Woodrow Apartments 1930 1997 Market Rate Family Stabilized $917 700134 Woods Edge Apartments 2002 na Restricted Elderly Stabilized $566 525135 Pointe at 14th Street Apartments 2008 na Market Rate Family Stabilized136 Linden Lane Apartments 1999 na Market Rate Family Stabilized137 Martha Jefferson House 2008 na Market Rate Elderly Stabilized $3,730 835146 Short 18th Street Housing na 2009 Restricted Family Prop Rehab149 Blue Ridge Commons Apartments 1975 2009 Restricted Family Prop Rehab $497 $497 $497 565 565 565
$578 $746 $605 $600 $1,074 608 700 648 618 739$428 $746 $497 $474 $488 510 700 565 525 510$750 $746 $750 $750 $3,730 690 700 700 690 1,500
Average
Source: Allen & Associates
MinimumMaximum
Section 10 - Supply Analysis Allen and Associates Consulting
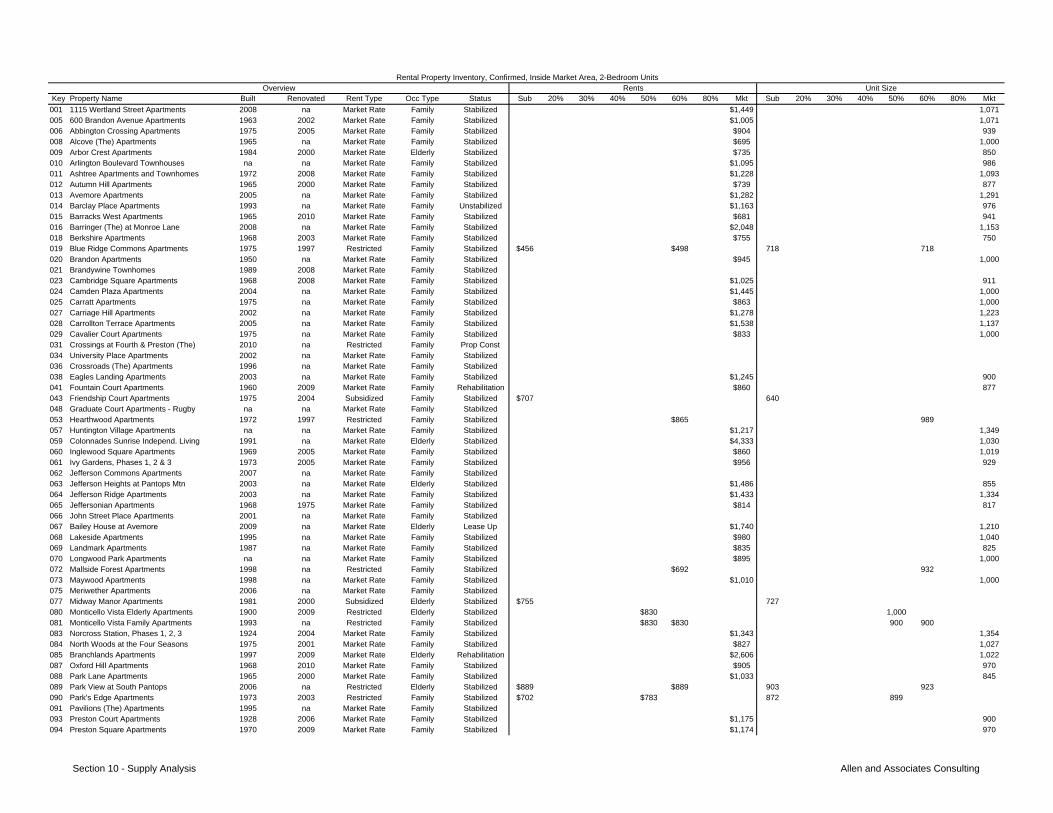
Key Property Name Built Renovated Rent Type Occ Type Status Sub 20% 30% 40% 50% 60% 80% Mkt Sub 20% 30% 40% 50% 60% 80% Mkt
001 1115 Wertland Street Apartments 2008 na Market Rate Family Stabilized $1,449 1,071005 600 Brandon Avenue Apartments 1963 2002 Market Rate Family Stabilized $1,005 1,071006 Abbington Crossing Apartments 1975 2005 Market Rate Family Stabilized $904 939008 Alcove (The) Apartments 1965 na Market Rate Family Stabilized $695 1,000009 Arbor Crest Apartments 1984 2000 Market Rate Elderly Stabilized $735 850010 Arlington Boulevard Townhouses na na Market Rate Family Stabilized $1,095 986011 Ashtree Apartments and Townhomes 1972 2008 Market Rate Family Stabilized $1,228 1,093012 Autumn Hill Apartments 1965 2000 Market Rate Family Stabilized $739 877013 Avemore Apartments 2005 na Market Rate Family Stabilized $1,282 1,291014 Barclay Place Apartments 1993 na Market Rate Family Unstabilized $1,163 976015 Barracks West Apartments 1965 2010 Market Rate Family Stabilized $681 941016 Barringer (The) at Monroe Lane 2008 na Market Rate Family Stabilized $2,048 1,153018 Berkshire Apartments 1968 2003 Market Rate Family Stabilized $755 750019 Blue Ridge Commons Apartments 1975 1997 Restricted Family Stabilized $456 $498 718 718020 Brandon Apartments 1950 na Market Rate Family Stabilized $945 1,000021 Brandywine Townhomes 1989 2008 Market Rate Family Stabilized023 Cambridge Square Apartments 1968 2008 Market Rate Family Stabilized $1,025 911024 Camden Plaza Apartments 2004 na Market Rate Family Stabilized $1,445 1,000025 Carratt Apartments 1975 na Market Rate Family Stabilized $863 1,000027 Carriage Hill Apartments 2002 na Market Rate Family Stabilized $1,278 1,223028 Carrollton Terrace Apartments 2005 na Market Rate Family Stabilized $1,538 1,137029 Cavalier Court Apartments 1975 na Market Rate Family Stabilized $833 1,000031 Crossings at Fourth & Preston (The) 2010 na Restricted Family Prop Const034 University Place Apartments 2002 na Market Rate Family Stabilized036 Crossroads (The) Apartments 1996 na Market Rate Family Stabilized038 Eagles Landing Apartments 2003 na Market Rate Family Stabilized $1,245 900041 Fountain Court Apartments 1960 2009 Market Rate Family Rehabilitation $860 877043 Friendship Court Apartments 1975 2004 Subsidized Family Stabilized $707 640048 Graduate Court Apartments - Rugby na na Market Rate Family Stabilized053 Hearthwood Apartments 1972 1997 Restricted Family Stabilized $865 989057 Huntington Village Apartments na na Market Rate Family Stabilized $1,217 1,349059 Colonnades Sunrise Independ. Living 1991 na Market Rate Elderly Stabilized $4,333 1,030060 Inglewood Square Apartments 1969 2005 Market Rate Family Stabilized $860 1,019061 Ivy Gardens, Phases 1, 2 & 3 1973 2005 Market Rate Family Stabilized $956 929062 Jefferson Commons Apartments 2007 na Market Rate Family Stabilized063 Jefferson Heights at Pantops Mtn 2003 na Market Rate Elderly Stabilized $1,486 855064 Jefferson Ridge Apartments 2003 na Market Rate Family Stabilized $1,433 1,334065 Jeffersonian Apartments 1968 1975 Market Rate Family Stabilized $814 817066 John Street Place Apartments 2001 na Market Rate Family Stabilized067 Bailey House at Avemore 2009 na Market Rate Elderly Lease Up $1,740 1,210068 Lakeside Apartments 1995 na Market Rate Family Stabilized $980 1,040069 Landmark Apartments 1987 na Market Rate Family Stabilized $835 825070 Longwood Park Apartments na na Market Rate Family Stabilized $895 1,000072 Mallside Forest Apartments 1998 na Restricted Family Stabilized $692 932073 Maywood Apartments 1998 na Market Rate Family Stabilized $1,010 1,000075 Meriwether Apartments 2006 na Market Rate Family Stabilized077 Midway Manor Apartments 1981 2000 Subsidized Elderly Stabilized $755 727080 Monticello Vista Elderly Apartments 1900 2009 Restricted Elderly Stabilized $830 1,000081 Monticello Vista Family Apartments 1993 na Restricted Family Stabilized $830 $830 900 900083 Norcross Station, Phases 1, 2, 3 1924 2004 Market Rate Family Stabilized $1,343 1,354084 North Woods at the Four Seasons 1975 2001 Market Rate Family Stabilized $827 1,027085 Branchlands Apartments 1997 2009 Market Rate Elderly Rehabilitation $2,606 1,022087 Oxford Hill Apartments 1968 2010 Market Rate Family Stabilized $905 970088 Park Lane Apartments 1965 2000 Market Rate Family Stabilized $1,033 845089 Park View at South Pantops 2006 na Restricted Elderly Stabilized $889 $889 903 923090 Park's Edge Apartments 1973 2003 Restricted Family Stabilized $702 $783 872 899091 Pavilions (The) Apartments 1995 na Market Rate Family Stabilized093 Preston Court Apartments 1928 2006 Market Rate Family Stabilized $1,175 900094 Preston Square Apartments 1970 2009 Market Rate Family Stabilized $1,174 970
Rental Property Inventory, Confirmed, Inside Market Area, 2-Bedroom UnitsUnit SizeRentsOverview
Section 10 - Supply Analysis Allen and Associates Consulting
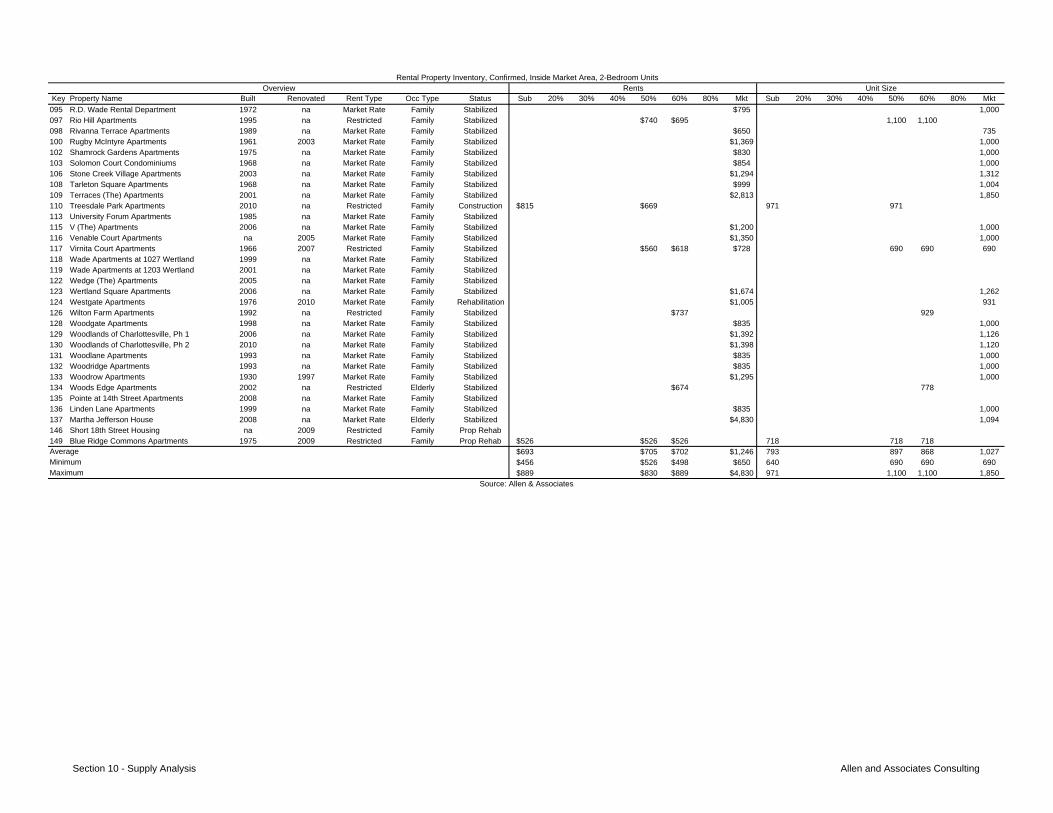
Key Property Name Built Renovated Rent Type Occ Type Status Sub 20% 30% 40% 50% 60% 80% Mkt Sub 20% 30% 40% 50% 60% 80% Mkt
Rental Property Inventory, Confirmed, Inside Market Area, 2-Bedroom UnitsUnit SizeRentsOverview
095 R.D. Wade Rental Department 1972 na Market Rate Family Stabilized $795 1,000097 Rio Hill Apartments 1995 na Restricted Family Stabilized $740 $695 1,100 1,100098 Rivanna Terrace Apartments 1989 na Market Rate Family Stabilized $650 735100 Rugby McIntyre Apartments 1961 2003 Market Rate Family Stabilized $1,369 1,000102 Shamrock Gardens Apartments 1975 na Market Rate Family Stabilized $830 1,000103 Solomon Court Condominiums 1968 na Market Rate Family Stabilized $854 1,000106 Stone Creek Village Apartments 2003 na Market Rate Family Stabilized $1,294 1,312108 Tarleton Square Apartments 1968 na Market Rate Family Stabilized $999 1,004109 Terraces (The) Apartments 2001 na Market Rate Family Stabilized $2,813 1,850110 Treesdale Park Apartments 2010 na Restricted Family Construction $815 $669 971 971113 University Forum Apartments 1985 na Market Rate Family Stabilized115 V (The) Apartments 2006 na Market Rate Family Stabilized $1,200 1,000116 Venable Court Apartments na 2005 Market Rate Family Stabilized $1,350 1,000117 Virnita Court Apartments 1966 2007 Restricted Family Stabilized $560 $618 $728 690 690 690118 Wade Apartments at 1027 Wertland 1999 na Market Rate Family Stabilized119 Wade Apartments at 1203 Wertland 2001 na Market Rate Family Stabilized122 Wedge (The) Apartments 2005 na Market Rate Family Stabilized123 Wertland Square Apartments 2006 na Market Rate Family Stabilized $1,674 1,262124 Westgate Apartments 1976 2010 Market Rate Family Rehabilitation $1,005 931126 Wilton Farm Apartments 1992 na Restricted Family Stabilized $737 929128 Woodgate Apartments 1998 na Market Rate Family Stabilized $835 1,000129 Woodlands of Charlottesville, Ph 1 2006 na Market Rate Family Stabilized $1,392 1,126130 Woodlands of Charlottesville, Ph 2 2010 na Market Rate Family Stabilized $1,398 1,120131 Woodlane Apartments 1993 na Market Rate Family Stabilized $835 1,000132 Woodridge Apartments 1993 na Market Rate Family Stabilized $835 1,000133 Woodrow Apartments 1930 1997 Market Rate Family Stabilized $1,295 1,000134 Woods Edge Apartments 2002 na Restricted Elderly Stabilized $674 778135 Pointe at 14th Street Apartments 2008 na Market Rate Family Stabilized136 Linden Lane Apartments 1999 na Market Rate Family Stabilized $835 1,000137 Martha Jefferson House 2008 na Market Rate Elderly Stabilized $4,830 1,094146 Short 18th Street Housing na 2009 Restricted Family Prop Rehab149 Blue Ridge Commons Apartments 1975 2009 Restricted Family Prop Rehab $526 $526 $526 718 718 718
$693 $705 $702 $1,246 793 897 868 1,027$456 $526 $498 $650 640 690 690 690$889 $830 $889 $4,830 971 1,100 1,100 1,850
Average
Source: Allen & Associates
MinimumMaximum
Section 10 - Supply Analysis Allen and Associates Consulting
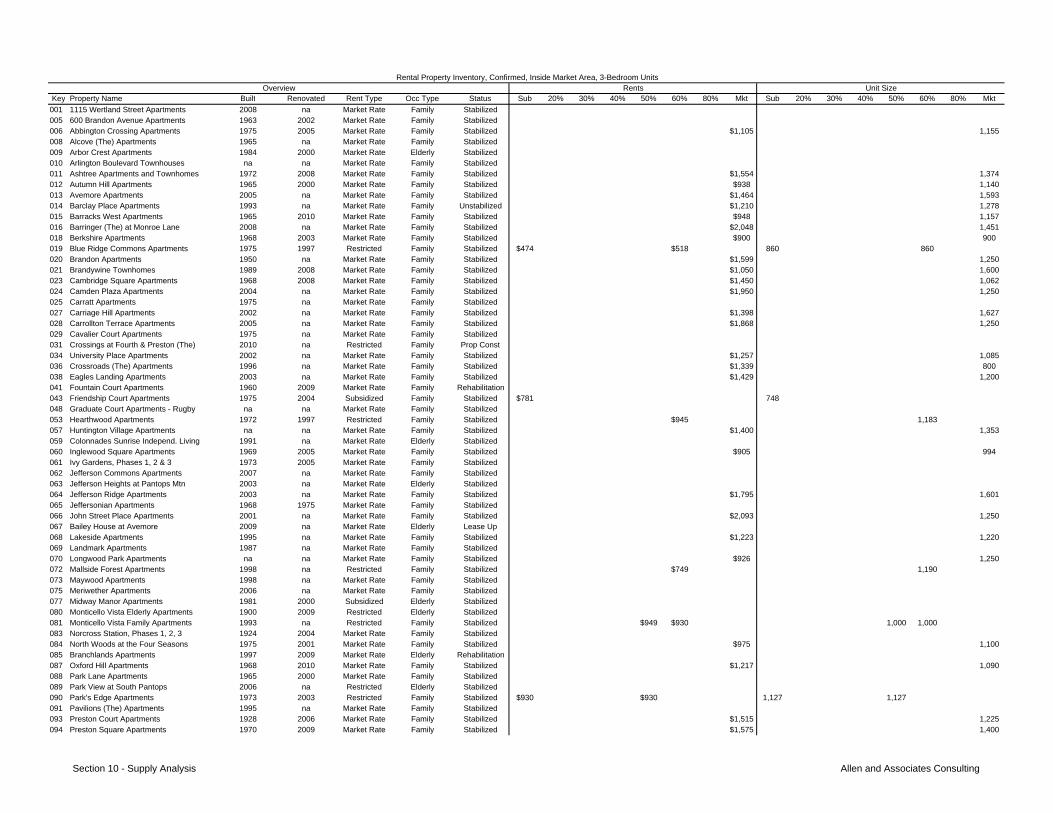
Key Property Name Built Renovated Rent Type Occ Type Status Sub 20% 30% 40% 50% 60% 80% Mkt Sub 20% 30% 40% 50% 60% 80% Mkt
001 1115 Wertland Street Apartments 2008 na Market Rate Family Stabilized005 600 Brandon Avenue Apartments 1963 2002 Market Rate Family Stabilized006 Abbington Crossing Apartments 1975 2005 Market Rate Family Stabilized $1,105 1,155008 Alcove (The) Apartments 1965 na Market Rate Family Stabilized009 Arbor Crest Apartments 1984 2000 Market Rate Elderly Stabilized010 Arlington Boulevard Townhouses na na Market Rate Family Stabilized011 Ashtree Apartments and Townhomes 1972 2008 Market Rate Family Stabilized $1,554 1,374012 Autumn Hill Apartments 1965 2000 Market Rate Family Stabilized $938 1,140013 Avemore Apartments 2005 na Market Rate Family Stabilized $1,464 1,593014 Barclay Place Apartments 1993 na Market Rate Family Unstabilized $1,210 1,278015 Barracks West Apartments 1965 2010 Market Rate Family Stabilized $948 1,157016 Barringer (The) at Monroe Lane 2008 na Market Rate Family Stabilized $2,048 1,451018 Berkshire Apartments 1968 2003 Market Rate Family Stabilized $900 900019 Blue Ridge Commons Apartments 1975 1997 Restricted Family Stabilized $474 $518 860 860020 Brandon Apartments 1950 na Market Rate Family Stabilized $1,599 1,250021 Brandywine Townhomes 1989 2008 Market Rate Family Stabilized $1,050 1,600023 Cambridge Square Apartments 1968 2008 Market Rate Family Stabilized $1,450 1,062024 Camden Plaza Apartments 2004 na Market Rate Family Stabilized $1,950 1,250025 Carratt Apartments 1975 na Market Rate Family Stabilized027 Carriage Hill Apartments 2002 na Market Rate Family Stabilized $1,398 1,627028 Carrollton Terrace Apartments 2005 na Market Rate Family Stabilized $1,868 1,250029 Cavalier Court Apartments 1975 na Market Rate Family Stabilized031 Crossings at Fourth & Preston (The) 2010 na Restricted Family Prop Const034 University Place Apartments 2002 na Market Rate Family Stabilized $1,257 1,085036 Crossroads (The) Apartments 1996 na Market Rate Family Stabilized $1,339 800038 Eagles Landing Apartments 2003 na Market Rate Family Stabilized $1,429 1,200041 Fountain Court Apartments 1960 2009 Market Rate Family Rehabilitation043 Friendship Court Apartments 1975 2004 Subsidized Family Stabilized $781 748048 Graduate Court Apartments - Rugby na na Market Rate Family Stabilized053 Hearthwood Apartments 1972 1997 Restricted Family Stabilized $945 1,183057 Huntington Village Apartments na na Market Rate Family Stabilized $1,400 1,353059 Colonnades Sunrise Independ. Living 1991 na Market Rate Elderly Stabilized060 Inglewood Square Apartments 1969 2005 Market Rate Family Stabilized $905 994061 Ivy Gardens, Phases 1, 2 & 3 1973 2005 Market Rate Family Stabilized062 Jefferson Commons Apartments 2007 na Market Rate Family Stabilized063 Jefferson Heights at Pantops Mtn 2003 na Market Rate Elderly Stabilized064 Jefferson Ridge Apartments 2003 na Market Rate Family Stabilized $1,795 1,601065 Jeffersonian Apartments 1968 1975 Market Rate Family Stabilized066 John Street Place Apartments 2001 na Market Rate Family Stabilized $2,093 1,250067 Bailey House at Avemore 2009 na Market Rate Elderly Lease Up068 Lakeside Apartments 1995 na Market Rate Family Stabilized $1,223 1,220069 Landmark Apartments 1987 na Market Rate Family Stabilized070 Longwood Park Apartments na na Market Rate Family Stabilized $926 1,250072 Mallside Forest Apartments 1998 na Restricted Family Stabilized $749 1,190073 Maywood Apartments 1998 na Market Rate Family Stabilized075 Meriwether Apartments 2006 na Market Rate Family Stabilized077 Midway Manor Apartments 1981 2000 Subsidized Elderly Stabilized080 Monticello Vista Elderly Apartments 1900 2009 Restricted Elderly Stabilized081 Monticello Vista Family Apartments 1993 na Restricted Family Stabilized $949 $930 1,000 1,000083 Norcross Station, Phases 1, 2, 3 1924 2004 Market Rate Family Stabilized084 North Woods at the Four Seasons 1975 2001 Market Rate Family Stabilized $975 1,100085 Branchlands Apartments 1997 2009 Market Rate Elderly Rehabilitation087 Oxford Hill Apartments 1968 2010 Market Rate Family Stabilized $1,217 1,090088 Park Lane Apartments 1965 2000 Market Rate Family Stabilized089 Park View at South Pantops 2006 na Restricted Elderly Stabilized090 Park's Edge Apartments 1973 2003 Restricted Family Stabilized $930 $930 1,127 1,127091 Pavilions (The) Apartments 1995 na Market Rate Family Stabilized093 Preston Court Apartments 1928 2006 Market Rate Family Stabilized $1,515 1,225094 Preston Square Apartments 1970 2009 Market Rate Family Stabilized $1,575 1,400
Rental Property Inventory, Confirmed, Inside Market Area, 3-Bedroom UnitsUnit SizeRentsOverview
Section 10 - Supply Analysis Allen and Associates Consulting
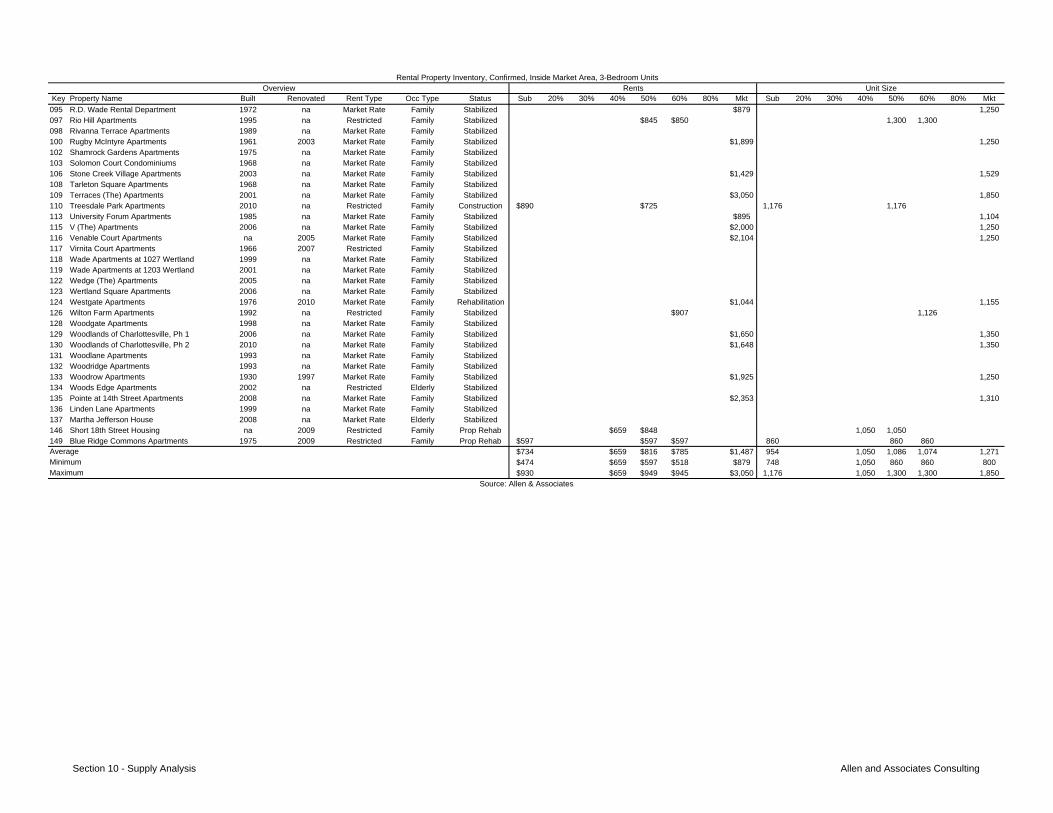
Key Property Name Built Renovated Rent Type Occ Type Status Sub 20% 30% 40% 50% 60% 80% Mkt Sub 20% 30% 40% 50% 60% 80% Mkt
Rental Property Inventory, Confirmed, Inside Market Area, 3-Bedroom UnitsUnit SizeRentsOverview
095 R.D. Wade Rental Department 1972 na Market Rate Family Stabilized $879 1,250097 Rio Hill Apartments 1995 na Restricted Family Stabilized $845 $850 1,300 1,300098 Rivanna Terrace Apartments 1989 na Market Rate Family Stabilized100 Rugby McIntyre Apartments 1961 2003 Market Rate Family Stabilized $1,899 1,250102 Shamrock Gardens Apartments 1975 na Market Rate Family Stabilized103 Solomon Court Condominiums 1968 na Market Rate Family Stabilized106 Stone Creek Village Apartments 2003 na Market Rate Family Stabilized $1,429 1,529108 Tarleton Square Apartments 1968 na Market Rate Family Stabilized109 Terraces (The) Apartments 2001 na Market Rate Family Stabilized $3,050 1,850110 Treesdale Park Apartments 2010 na Restricted Family Construction $890 $725 1,176 1,176113 University Forum Apartments 1985 na Market Rate Family Stabilized $895 1,104115 V (The) Apartments 2006 na Market Rate Family Stabilized $2,000 1,250116 Venable Court Apartments na 2005 Market Rate Family Stabilized $2,104 1,250117 Virnita Court Apartments 1966 2007 Restricted Family Stabilized118 Wade Apartments at 1027 Wertland 1999 na Market Rate Family Stabilized119 Wade Apartments at 1203 Wertland 2001 na Market Rate Family Stabilized122 Wedge (The) Apartments 2005 na Market Rate Family Stabilized123 Wertland Square Apartments 2006 na Market Rate Family Stabilized124 Westgate Apartments 1976 2010 Market Rate Family Rehabilitation $1,044 1,155126 Wilton Farm Apartments 1992 na Restricted Family Stabilized $907 1,126128 Woodgate Apartments 1998 na Market Rate Family Stabilized129 Woodlands of Charlottesville, Ph 1 2006 na Market Rate Family Stabilized $1,650 1,350130 Woodlands of Charlottesville, Ph 2 2010 na Market Rate Family Stabilized $1,648 1,350131 Woodlane Apartments 1993 na Market Rate Family Stabilized132 Woodridge Apartments 1993 na Market Rate Family Stabilized133 Woodrow Apartments 1930 1997 Market Rate Family Stabilized $1,925 1,250134 Woods Edge Apartments 2002 na Restricted Elderly Stabilized135 Pointe at 14th Street Apartments 2008 na Market Rate Family Stabilized $2,353 1,310136 Linden Lane Apartments 1999 na Market Rate Family Stabilized137 Martha Jefferson House 2008 na Market Rate Elderly Stabilized146 Short 18th Street Housing na 2009 Restricted Family Prop Rehab $659 $848 1,050 1,050149 Blue Ridge Commons Apartments 1975 2009 Restricted Family Prop Rehab $597 $597 $597 860 860 860
$734 $659 $816 $785 $1,487 954 1,050 1,086 1,074 1,271$474 $659 $597 $518 $879 748 1,050 860 860 800$930 $659 $949 $945 $3,050 1,176 1,050 1,300 1,300 1,850
Average
Source: Allen & Associates
MinimumMaximum
Section 10 - Supply Analysis Allen and Associates Consulting
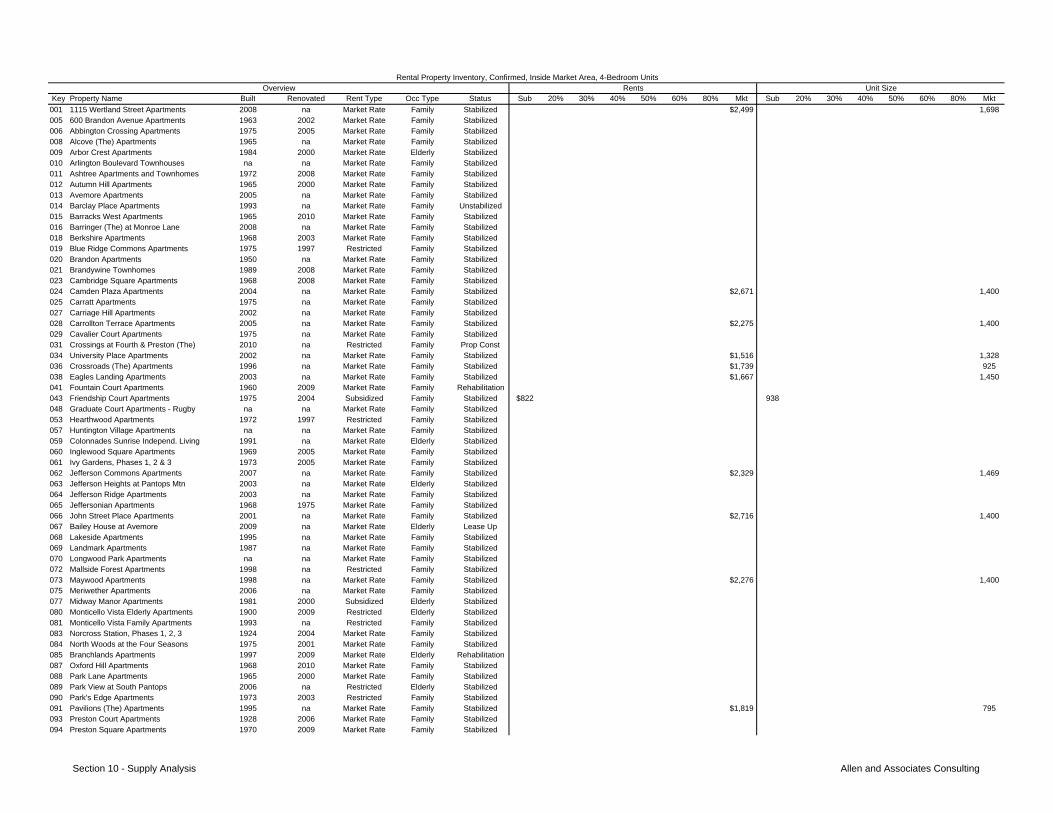
Key Property Name Built Renovated Rent Type Occ Type Status Sub 20% 30% 40% 50% 60% 80% Mkt Sub 20% 30% 40% 50% 60% 80% Mkt
001 1115 Wertland Street Apartments 2008 na Market Rate Family Stabilized $2,499 1,698005 600 Brandon Avenue Apartments 1963 2002 Market Rate Family Stabilized006 Abbington Crossing Apartments 1975 2005 Market Rate Family Stabilized008 Alcove (The) Apartments 1965 na Market Rate Family Stabilized009 Arbor Crest Apartments 1984 2000 Market Rate Elderly Stabilized010 Arlington Boulevard Townhouses na na Market Rate Family Stabilized011 Ashtree Apartments and Townhomes 1972 2008 Market Rate Family Stabilized012 Autumn Hill Apartments 1965 2000 Market Rate Family Stabilized013 Avemore Apartments 2005 na Market Rate Family Stabilized014 Barclay Place Apartments 1993 na Market Rate Family Unstabilized015 Barracks West Apartments 1965 2010 Market Rate Family Stabilized016 Barringer (The) at Monroe Lane 2008 na Market Rate Family Stabilized018 Berkshire Apartments 1968 2003 Market Rate Family Stabilized019 Blue Ridge Commons Apartments 1975 1997 Restricted Family Stabilized020 Brandon Apartments 1950 na Market Rate Family Stabilized021 Brandywine Townhomes 1989 2008 Market Rate Family Stabilized023 Cambridge Square Apartments 1968 2008 Market Rate Family Stabilized024 Camden Plaza Apartments 2004 na Market Rate Family Stabilized $2,671 1,400025 Carratt Apartments 1975 na Market Rate Family Stabilized027 Carriage Hill Apartments 2002 na Market Rate Family Stabilized028 Carrollton Terrace Apartments 2005 na Market Rate Family Stabilized $2,275 1,400029 Cavalier Court Apartments 1975 na Market Rate Family Stabilized031 Crossings at Fourth & Preston (The) 2010 na Restricted Family Prop Const034 University Place Apartments 2002 na Market Rate Family Stabilized $1,516 1,328036 Crossroads (The) Apartments 1996 na Market Rate Family Stabilized $1,739 925038 Eagles Landing Apartments 2003 na Market Rate Family Stabilized $1,667 1,450041 Fountain Court Apartments 1960 2009 Market Rate Family Rehabilitation043 Friendship Court Apartments 1975 2004 Subsidized Family Stabilized $822 938048 Graduate Court Apartments - Rugby na na Market Rate Family Stabilized053 Hearthwood Apartments 1972 1997 Restricted Family Stabilized057 Huntington Village Apartments na na Market Rate Family Stabilized059 Colonnades Sunrise Independ. Living 1991 na Market Rate Elderly Stabilized060 Inglewood Square Apartments 1969 2005 Market Rate Family Stabilized061 Ivy Gardens, Phases 1, 2 & 3 1973 2005 Market Rate Family Stabilized062 Jefferson Commons Apartments 2007 na Market Rate Family Stabilized $2,329 1,469063 Jefferson Heights at Pantops Mtn 2003 na Market Rate Elderly Stabilized064 Jefferson Ridge Apartments 2003 na Market Rate Family Stabilized065 Jeffersonian Apartments 1968 1975 Market Rate Family Stabilized066 John Street Place Apartments 2001 na Market Rate Family Stabilized $2,716 1,400067 Bailey House at Avemore 2009 na Market Rate Elderly Lease Up068 Lakeside Apartments 1995 na Market Rate Family Stabilized069 Landmark Apartments 1987 na Market Rate Family Stabilized070 Longwood Park Apartments na na Market Rate Family Stabilized072 Mallside Forest Apartments 1998 na Restricted Family Stabilized073 Maywood Apartments 1998 na Market Rate Family Stabilized $2,276 1,400075 Meriwether Apartments 2006 na Market Rate Family Stabilized077 Midway Manor Apartments 1981 2000 Subsidized Elderly Stabilized080 Monticello Vista Elderly Apartments 1900 2009 Restricted Elderly Stabilized081 Monticello Vista Family Apartments 1993 na Restricted Family Stabilized083 Norcross Station, Phases 1, 2, 3 1924 2004 Market Rate Family Stabilized084 North Woods at the Four Seasons 1975 2001 Market Rate Family Stabilized085 Branchlands Apartments 1997 2009 Market Rate Elderly Rehabilitation087 Oxford Hill Apartments 1968 2010 Market Rate Family Stabilized088 Park Lane Apartments 1965 2000 Market Rate Family Stabilized089 Park View at South Pantops 2006 na Restricted Elderly Stabilized090 Park's Edge Apartments 1973 2003 Restricted Family Stabilized091 Pavilions (The) Apartments 1995 na Market Rate Family Stabilized $1,819 795093 Preston Court Apartments 1928 2006 Market Rate Family Stabilized094 Preston Square Apartments 1970 2009 Market Rate Family Stabilized
Rental Property Inventory, Confirmed, Inside Market Area, 4-Bedroom UnitsUnit SizeRentsOverview
Section 10 - Supply Analysis Allen and Associates Consulting
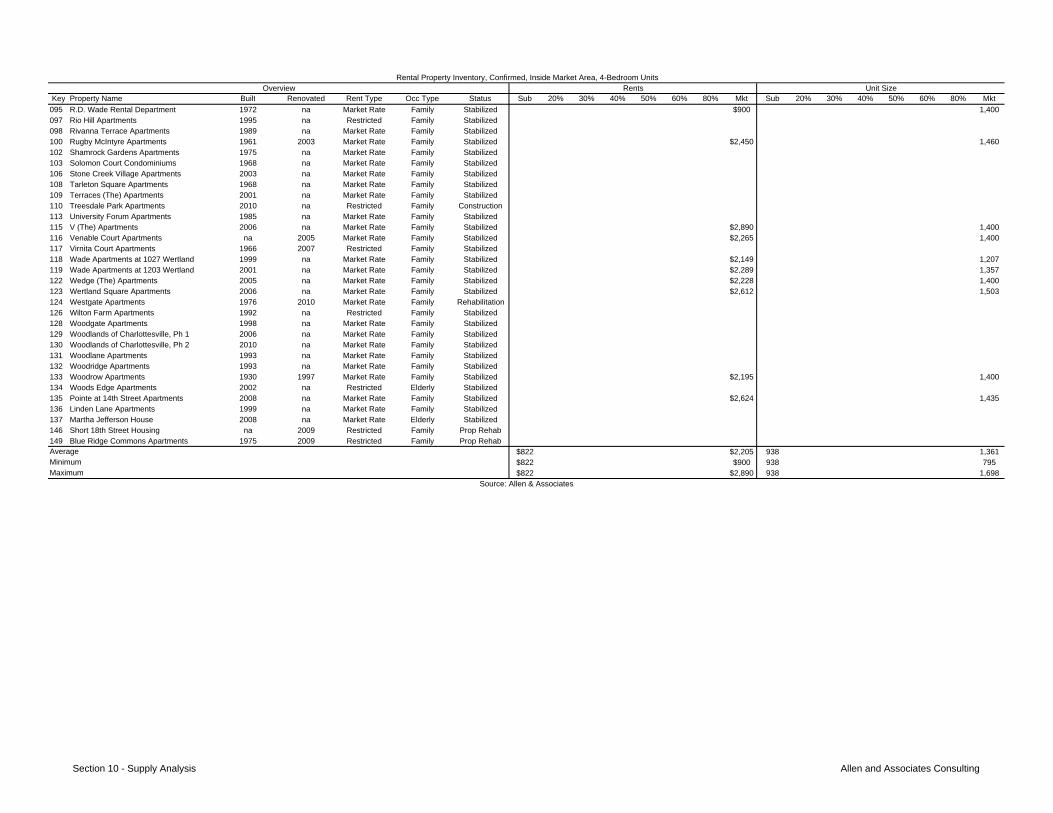
Key Property Name Built Renovated Rent Type Occ Type Status Sub 20% 30% 40% 50% 60% 80% Mkt Sub 20% 30% 40% 50% 60% 80% Mkt
Rental Property Inventory, Confirmed, Inside Market Area, 4-Bedroom UnitsUnit SizeRentsOverview
095 R.D. Wade Rental Department 1972 na Market Rate Family Stabilized $900 1,400097 Rio Hill Apartments 1995 na Restricted Family Stabilized098 Rivanna Terrace Apartments 1989 na Market Rate Family Stabilized100 Rugby McIntyre Apartments 1961 2003 Market Rate Family Stabilized $2,450 1,460102 Shamrock Gardens Apartments 1975 na Market Rate Family Stabilized103 Solomon Court Condominiums 1968 na Market Rate Family Stabilized106 Stone Creek Village Apartments 2003 na Market Rate Family Stabilized108 Tarleton Square Apartments 1968 na Market Rate Family Stabilized109 Terraces (The) Apartments 2001 na Market Rate Family Stabilized110 Treesdale Park Apartments 2010 na Restricted Family Construction113 University Forum Apartments 1985 na Market Rate Family Stabilized115 V (The) Apartments 2006 na Market Rate Family Stabilized $2,890 1,400116 Venable Court Apartments na 2005 Market Rate Family Stabilized $2,265 1,400117 Virnita Court Apartments 1966 2007 Restricted Family Stabilized118 Wade Apartments at 1027 Wertland 1999 na Market Rate Family Stabilized $2,149 1,207119 Wade Apartments at 1203 Wertland 2001 na Market Rate Family Stabilized $2,289 1,357122 Wedge (The) Apartments 2005 na Market Rate Family Stabilized $2,228 1,400123 Wertland Square Apartments 2006 na Market Rate Family Stabilized $2,612 1,503124 Westgate Apartments 1976 2010 Market Rate Family Rehabilitation126 Wilton Farm Apartments 1992 na Restricted Family Stabilized128 Woodgate Apartments 1998 na Market Rate Family Stabilized129 Woodlands of Charlottesville, Ph 1 2006 na Market Rate Family Stabilized130 Woodlands of Charlottesville, Ph 2 2010 na Market Rate Family Stabilized131 Woodlane Apartments 1993 na Market Rate Family Stabilized132 Woodridge Apartments 1993 na Market Rate Family Stabilized133 Woodrow Apartments 1930 1997 Market Rate Family Stabilized $2,195 1,400134 Woods Edge Apartments 2002 na Restricted Elderly Stabilized135 Pointe at 14th Street Apartments 2008 na Market Rate Family Stabilized $2,624 1,435136 Linden Lane Apartments 1999 na Market Rate Family Stabilized137 Martha Jefferson House 2008 na Market Rate Elderly Stabilized146 Short 18th Street Housing na 2009 Restricted Family Prop Rehab149 Blue Ridge Commons Apartments 1975 2009 Restricted Family Prop Rehab
$822 $2,205 938 1,361$822 $900 938 795$822 $2,890 938 1,698
Average
Source: Allen & Associates
MinimumMaximum
Section 10 - Supply Analysis Allen and Associates Consulting
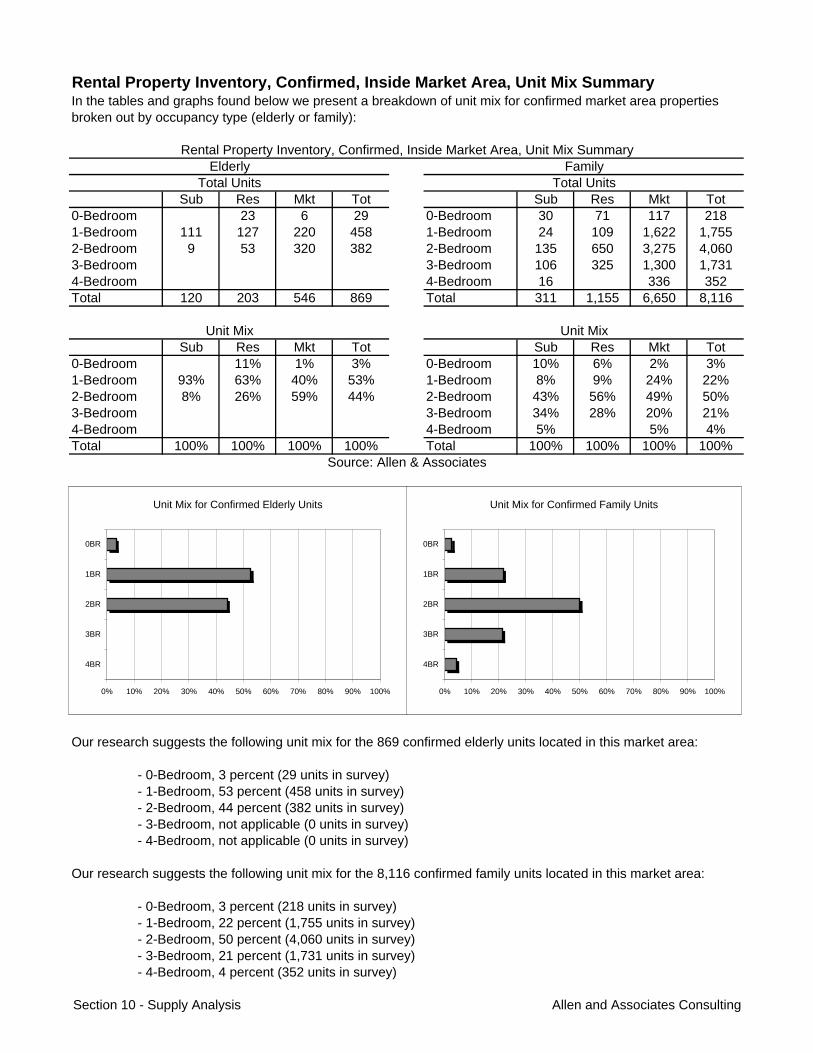
Rental Property Inventory, Confirmed, Inside Market Area, Unit Mix Summary
Sub Res Mkt Tot Sub Res Mkt Tot0-Bedroom 23 6 29 0-Bedroom 30 71 117 2181-Bedroom 111 127 220 458 1-Bedroom 24 109 1,622 1,7552-Bedroom 9 53 320 382 2-Bedroom 135 650 3,275 4,0603-Bedroom 3-Bedroom 106 325 1,300 1,7314-Bedroom 4-Bedroom 16 336 352Total 120 203 546 869 Total 311 1,155 6,650 8,116
Sub Res Mkt Tot Sub Res Mkt Tot0-Bedroom 11% 1% 3% 0-Bedroom 10% 6% 2% 3%1-Bedroom 93% 63% 40% 53% 1-Bedroom 8% 9% 24% 22%2-Bedroom 8% 26% 59% 44% 2-Bedroom 43% 56% 49% 50%3-Bedroom 3-Bedroom 34% 28% 20% 21%4-Bedroom 4-Bedroom 5% 5% 4%Total 100% 100% 100% 100% Total 100% 100% 100% 100%
- 1-Bedroom, 22 percent (1,755 units in survey)- 2-Bedroom, 50 percent (4,060 units in survey)
- 3-Bedroom, not applicable (0 units in survey)- 4-Bedroom, not applicable (0 units in survey)
Unit Mix
- 2-Bedroom, 44 percent (382 units in survey)
Our research suggests the following unit mix for the 8,116 confirmed family units located in this market area:
- 0-Bedroom, 3 percent (218 units in survey)
Our research suggests the following unit mix for the 869 confirmed elderly units located in this market area:
- 0-Bedroom, 3 percent (29 units in survey)- 1-Bedroom, 53 percent (458 units in survey)
In the tables and graphs found below we present a breakdown of unit mix for confirmed market area properties broken out by occupancy type (elderly or family):
- 3-Bedroom, 21 percent (1,731 units in survey)- 4-Bedroom, 4 percent (352 units in survey)
Source: Allen & Associates
Rental Property Inventory, Confirmed, Inside Market Area, Unit Mix SummaryElderly Family
Total Units Total Units
Unit Mix
Unit Mix for Confirmed Elderly Units
0% 10% 20% 30% 40% 50% 60% 70% 80% 90% 100%
4BR
3BR
2BR
1BR
0BR
Unit Mix for Confirmed Family Units
0% 10% 20% 30% 40% 50% 60% 70% 80% 90% 100%
4BR
3BR
2BR
1BR
0BR
Section 10 - Supply Analysis Allen and Associates Consulting
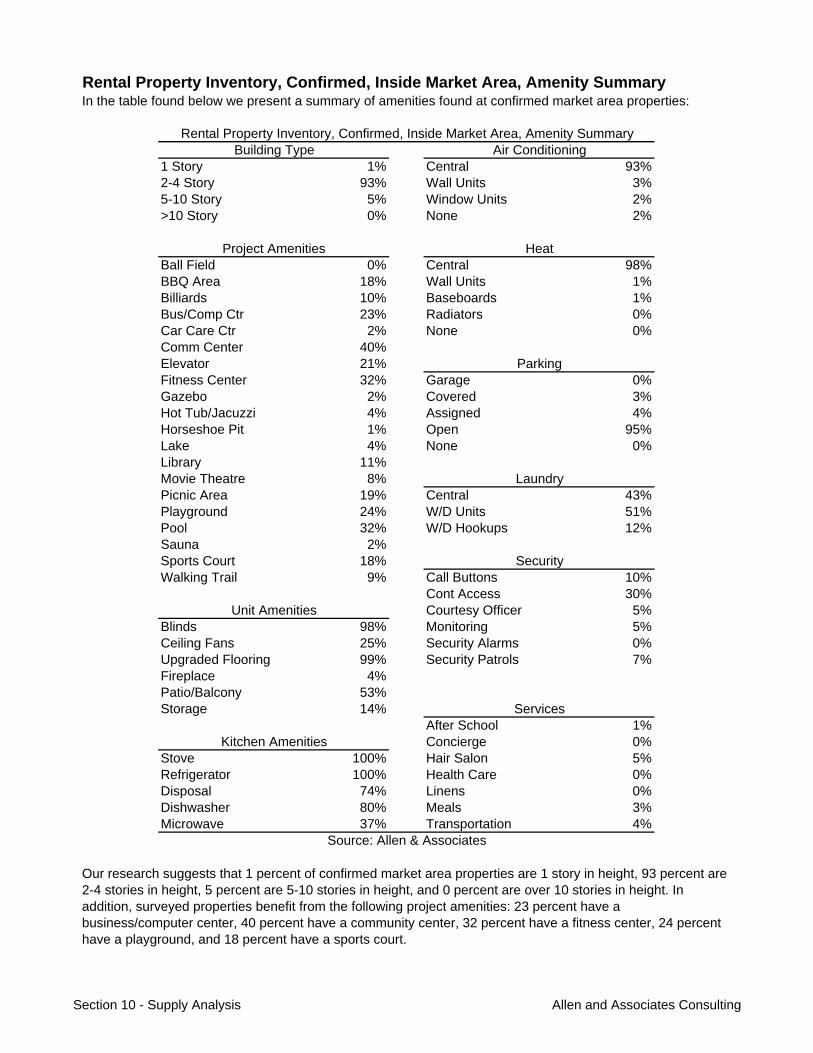
Rental Property Inventory, Confirmed, Inside Market Area, Amenity Summary
1 Story 1% Central 93%2-4 Story 93% Wall Units 3%5-10 Story 5% Window Units 2%>10 Story 0% None 2%
Ball Field 0% Central 98%BBQ Area 18% Wall Units 1%Billiards 10% Baseboards 1%Bus/Comp Ctr 23% Radiators 0%Car Care Ctr 2% None 0%Comm Center 40%Elevator 21%Fitness Center 32% Garage 0%Gazebo 2% Covered 3%Hot Tub/Jacuzzi 4% Assigned 4%Horseshoe Pit 1% Open 95%Lake 4% None 0%Library 11%Movie Theatre 8%Picnic Area 19% Central 43%Playground 24% W/D Units 51%Pool 32% W/D Hookups 12%Sauna 2%Sports Court 18%Walking Trail 9% Call Buttons 10%
Cont Access 30%Courtesy Officer 5%
Blinds 98% Monitoring 5%Ceiling Fans 25% Security Alarms 0%Upgraded Flooring 99% Security Patrols 7%Fireplace 4%Patio/Balcony 53%Storage 14%
After School 1%Concierge 0%
Stove 100% Hair Salon 5%Refrigerator 100% Health Care 0%Disposal 74% Linens 0%Dishwasher 80% Meals 3%Microwave 37% Transportation 4%
Security
Our research suggests that 1 percent of confirmed market area properties are 1 story in height, 93 percent are 2-4 stories in height, 5 percent are 5-10 stories in height, and 0 percent are over 10 stories in height. In addition, surveyed properties benefit from the following project amenities: 23 percent have a business/computer center, 40 percent have a community center, 32 percent have a fitness center, 24 percent have a playground, and 18 percent have a sports court.
Unit Amenities
Kitchen Amenities
In the table found below we present a summary of amenities found at confirmed market area properties:
Rental Property Inventory, Confirmed, Inside Market Area, Amenity Summary
Source: Allen & Associates
Air Conditioning
Services
Heat
Parking
Laundry
Building Type
Project Amenities
Section 10 - Supply Analysis Allen and Associates Consulting

Our research also suggests that the following unit amenities are present at surveyed properties: 98 percent have blinds, 99 percent have carpeting, 53 percent have patios/balconies, and 14 percent have outside storage. Surveyed properties also include the following kitchen amenities: 100 percent have a stove, 100 percent have a refrigerator, 74 percent have a disposal, 80 percent have a dishwasher, and 37 percent have a microwave.
In addition, 98 percent of confirmed market area properties have central heat while 93 percent have central air. Our research also suggests that 95 percent of surveyed properties have open parking. A total of 43 percent of area properties have central laundry facilities, while 12 percent have washer/dryer hookups, and 51 percent have washer/dryer units in each residential unit.
A total of 10 percent of confirmed market area properties have call buttons, 30 percent have controlled access, and 0 percent have security alarms.
It is also our understanding that the majority of confirmed market area properties provide cable access.
Finally, in the following pages we provide summary of vouchers, concessions and waiting lists for the confirmed market area properties included in this report.
Section 10 - Supply Analysis Allen and Associates Consulting
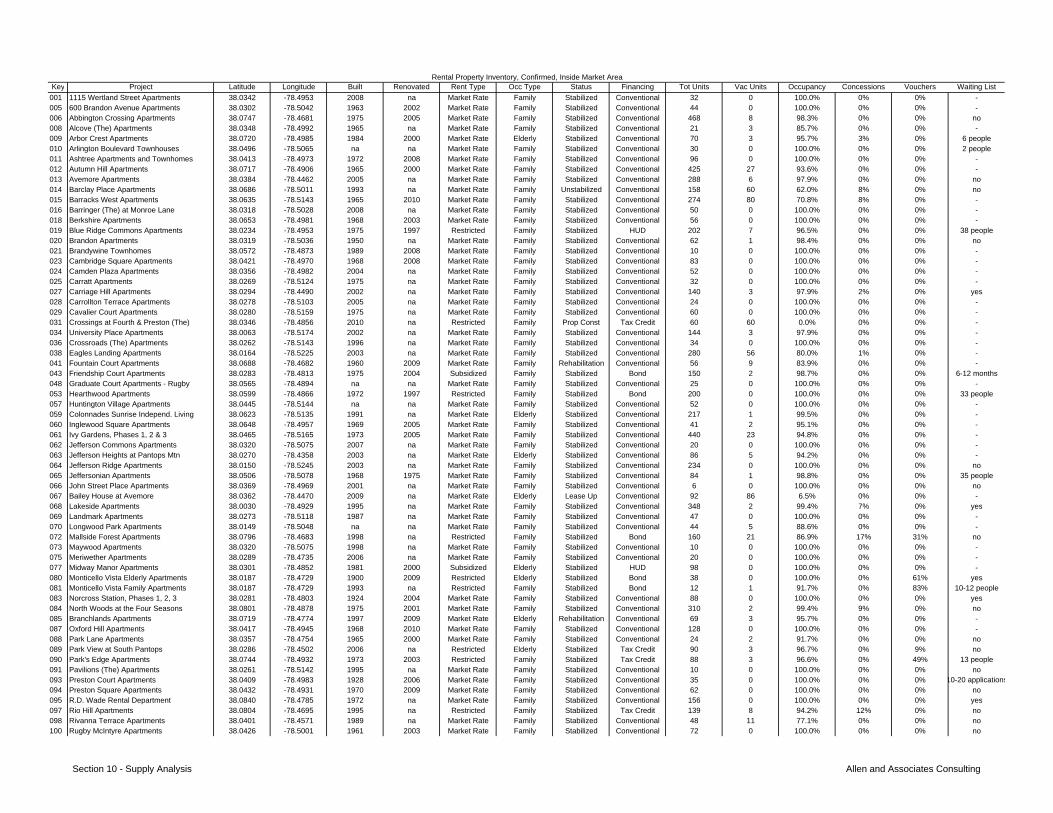
Key Project Latitude Longitude Built Renovated Rent Type Occ Type Status Financing Tot Units Vac Units Occupancy Concessions Vouchers Waiting List
001 1115 Wertland Street Apartments 38.0342 -78.4953 2008 na Market Rate Family Stabilized Conventional 32 0 100.0% 0% 0% -005 600 Brandon Avenue Apartments 38.0302 -78.5042 1963 2002 Market Rate Family Stabilized Conventional 44 0 100.0% 0% 0% -006 Abbington Crossing Apartments 38.0747 -78.4681 1975 2005 Market Rate Family Stabilized Conventional 468 8 98.3% 0% 0% no008 Alcove (The) Apartments 38.0348 -78.4992 1965 na Market Rate Family Stabilized Conventional 21 3 85.7% 0% 0% -009 Arbor Crest Apartments 38.0720 -78.4985 1984 2000 Market Rate Elderly Stabilized Conventional 70 3 95.7% 3% 0% 6 people010 Arlington Boulevard Townhouses 38.0496 -78.5065 na na Market Rate Family Stabilized Conventional 30 0 100.0% 0% 0% 2 people011 Ashtree Apartments and Townhomes 38.0413 -78.4973 1972 2008 Market Rate Family Stabilized Conventional 96 0 100.0% 0% 0% -012 Autumn Hill Apartments 38.0717 -78.4906 1965 2000 Market Rate Family Stabilized Conventional 425 27 93.6% 0% 0% -013 Avemore Apartments 38.0384 -78.4462 2005 na Market Rate Family Stabilized Conventional 288 6 97.9% 0% 0% no014 Barclay Place Apartments 38.0686 -78.5011 1993 na Market Rate Family Unstabilized Conventional 158 60 62.0% 8% 0% no015 Barracks West Apartments 38.0635 -78.5143 1965 2010 Market Rate Family Stabilized Conventional 274 80 70.8% 8% 0% -016 Barringer (The) at Monroe Lane 38.0318 -78.5028 2008 na Market Rate Family Stabilized Conventional 50 0 100.0% 0% 0% -018 Berkshire Apartments 38.0653 -78.4981 1968 2003 Market Rate Family Stabilized Conventional 56 0 100.0% 0% 0% -019 Blue Ridge Commons Apartments 38.0234 -78.4953 1975 1997 Restricted Family Stabilized HUD 202 7 96.5% 0% 0% 38 people020 Brandon Apartments 38.0319 -78.5036 1950 na Market Rate Family Stabilized Conventional 62 1 98.4% 0% 0% no021 Brandywine Townhomes 38.0572 -78.4873 1989 2008 Market Rate Family Stabilized Conventional 10 0 100.0% 0% 0% -023 Cambridge Square Apartments 38.0421 -78.4970 1968 2008 Market Rate Family Stabilized Conventional 83 0 100.0% 0% 0% -024 Camden Plaza Apartments 38.0356 -78.4982 2004 na Market Rate Family Stabilized Conventional 52 0 100.0% 0% 0% -025 Carratt Apartments 38.0269 -78.5124 1975 na Market Rate Family Stabilized Conventional 32 0 100.0% 0% 0% -027 Carriage Hill Apartments 38.0294 -78.4490 2002 na Market Rate Family Stabilized Conventional 140 3 97.9% 2% 0% yes028 Carrollton Terrace Apartments 38.0278 -78.5103 2005 na Market Rate Family Stabilized Conventional 24 0 100.0% 0% 0% -029 Cavalier Court Apartments 38.0280 -78.5159 1975 na Market Rate Family Stabilized Conventional 60 0 100.0% 0% 0% -031 Crossings at Fourth & Preston (The) 38.0346 -78.4856 2010 na Restricted Family Prop Const Tax Credit 60 60 0.0% 0% 0% -034 University Place Apartments 38.0063 -78.5174 2002 na Market Rate Family Stabilized Conventional 144 3 97.9% 0% 0% -036 Crossroads (The) Apartments 38.0262 -78.5143 1996 na Market Rate Family Stabilized Conventional 34 0 100.0% 0% 0% -038 Eagles Landing Apartments 38.0164 -78.5225 2003 na Market Rate Family Stabilized Conventional 280 56 80.0% 1% 0% -041 Fountain Court Apartments 38.0688 -78.4682 1960 2009 Market Rate Family Rehabilitation Conventional 56 9 83.9% 0% 0% -043 Friendship Court Apartments 38.0283 -78.4813 1975 2004 Subsidized Family Stabilized Bond 150 2 98.7% 0% 0% 6-12 months048 Graduate Court Apartments - Rugby 38.0565 -78.4894 na na Market Rate Family Stabilized Conventional 25 0 100.0% 0% 0% -053 Hearthwood Apartments 38.0599 -78.4866 1972 1997 Restricted Family Stabilized Bond 200 0 100.0% 0% 0% 33 people057 Huntington Village Apartments 38.0445 -78.5144 na na Market Rate Family Stabilized Conventional 52 0 100.0% 0% 0% -059 Colonnades Sunrise Independ. Living 38.0623 -78.5135 1991 na Market Rate Elderly Stabilized Conventional 217 1 99.5% 0% 0% -060 Inglewood Square Apartments 38.0648 -78.4957 1969 2005 Market Rate Family Stabilized Conventional 41 2 95.1% 0% 0% -061 Ivy Gardens, Phases 1, 2 & 3 38.0465 -78.5165 1973 2005 Market Rate Family Stabilized Conventional 440 23 94.8% 0% 0% -062 Jefferson Commons Apartments 38.0320 -78.5075 2007 na Market Rate Family Stabilized Conventional 20 0 100.0% 0% 0% -063 Jefferson Heights at Pantops Mtn 38.0270 -78.4358 2003 na Market Rate Elderly Stabilized Conventional 86 5 94.2% 0% 0% -064 Jefferson Ridge Apartments 38.0150 -78.5245 2003 na Market Rate Family Stabilized Conventional 234 0 100.0% 0% 0% no065 Jeffersonian Apartments 38.0506 -78.5078 1968 1975 Market Rate Family Stabilized Conventional 84 1 98.8% 0% 0% 35 people066 John Street Place Apartments 38.0369 -78.4969 2001 na Market Rate Family Stabilized Conventional 6 0 100.0% 0% 0% no067 Bailey House at Avemore 38.0362 -78.4470 2009 na Market Rate Elderly Lease Up Conventional 92 86 6.5% 0% 0% -068 Lakeside Apartments 38.0030 -78.4929 1995 na Market Rate Family Stabilized Conventional 348 2 99.4% 7% 0% yes069 Landmark Apartments 38.0273 -78.5118 1987 na Market Rate Family Stabilized Conventional 47 0 100.0% 0% 0% -070 Longwood Park Apartments 38.0149 -78.5048 na na Market Rate Family Stabilized Conventional 44 5 88.6% 0% 0% -072 Mallside Forest Apartments 38.0796 -78.4683 1998 na Restricted Family Stabilized Bond 160 21 86.9% 17% 31% no073 Maywood Apartments 38.0320 -78.5075 1998 na Market Rate Family Stabilized Conventional 10 0 100.0% 0% 0% -075 Meriwether Apartments 38.0289 -78.4735 2006 na Market Rate Family Stabilized Conventional 20 0 100.0% 0% 0% -077 Midway Manor Apartments 38.0301 -78.4852 1981 2000 Subsidized Elderly Stabilized HUD 98 0 100.0% 0% 0% -080 Monticello Vista Elderly Apartments 38.0187 -78.4729 1900 2009 Restricted Elderly Stabilized Bond 38 0 100.0% 0% 61% yes081 Monticello Vista Family Apartments 38.0187 -78.4729 1993 na Restricted Family Stabilized Bond 12 1 91.7% 0% 83% 10-12 people083 Norcross Station, Phases 1, 2, 3 38.0281 -78.4803 1924 2004 Market Rate Family Stabilized Conventional 88 0 100.0% 0% 0% yes084 North Woods at the Four Seasons 38.0801 -78.4878 1975 2001 Market Rate Family Stabilized Conventional 310 2 99.4% 9% 0% no085 Branchlands Apartments 38.0719 -78.4774 1997 2009 Market Rate Elderly Rehabilitation Conventional 69 3 95.7% 0% 0% -087 Oxford Hill Apartments 38.0417 -78.4945 1968 2010 Market Rate Family Stabilized Conventional 128 0 100.0% 0% 0% -088 Park Lane Apartments 38.0357 -78.4754 1965 2000 Market Rate Family Stabilized Conventional 24 2 91.7% 0% 0% no089 Park View at South Pantops 38.0286 -78.4502 2006 na Restricted Elderly Stabilized Tax Credit 90 3 96.7% 0% 9% no090 Park's Edge Apartments 38.0744 -78.4932 1973 2003 Restricted Family Stabilized Tax Credit 88 3 96.6% 0% 49% 13 people091 Pavilions (The) Apartments 38.0261 -78.5142 1995 na Market Rate Family Stabilized Conventional 10 0 100.0% 0% 0% no093 Preston Court Apartments 38.0409 -78.4983 1928 2006 Market Rate Family Stabilized Conventional 35 0 100.0% 0% 0% 10-20 applications094 Preston Square Apartments 38.0432 -78.4931 1970 2009 Market Rate Family Stabilized Conventional 62 0 100.0% 0% 0% no095 R.D. Wade Rental Department 38.0840 -78.4785 1972 na Market Rate Family Stabilized Conventional 156 0 100.0% 0% 0% yes097 Rio Hill Apartments 38.0804 -78.4695 1995 na Restricted Family Stabilized Tax Credit 139 8 94.2% 12% 0% no098 Rivanna Terrace Apartments 38.0401 -78.4571 1989 na Market Rate Family Stabilized Conventional 48 11 77.1% 0% 0% no100 Rugby McIntyre Apartments 38.0426 -78.5001 1961 2003 Market Rate Family Stabilized Conventional 72 0 100.0% 0% 0% no
Rental Property Inventory, Confirmed, Inside Market Area
Section 10 - Supply Analysis Allen and Associates Consulting
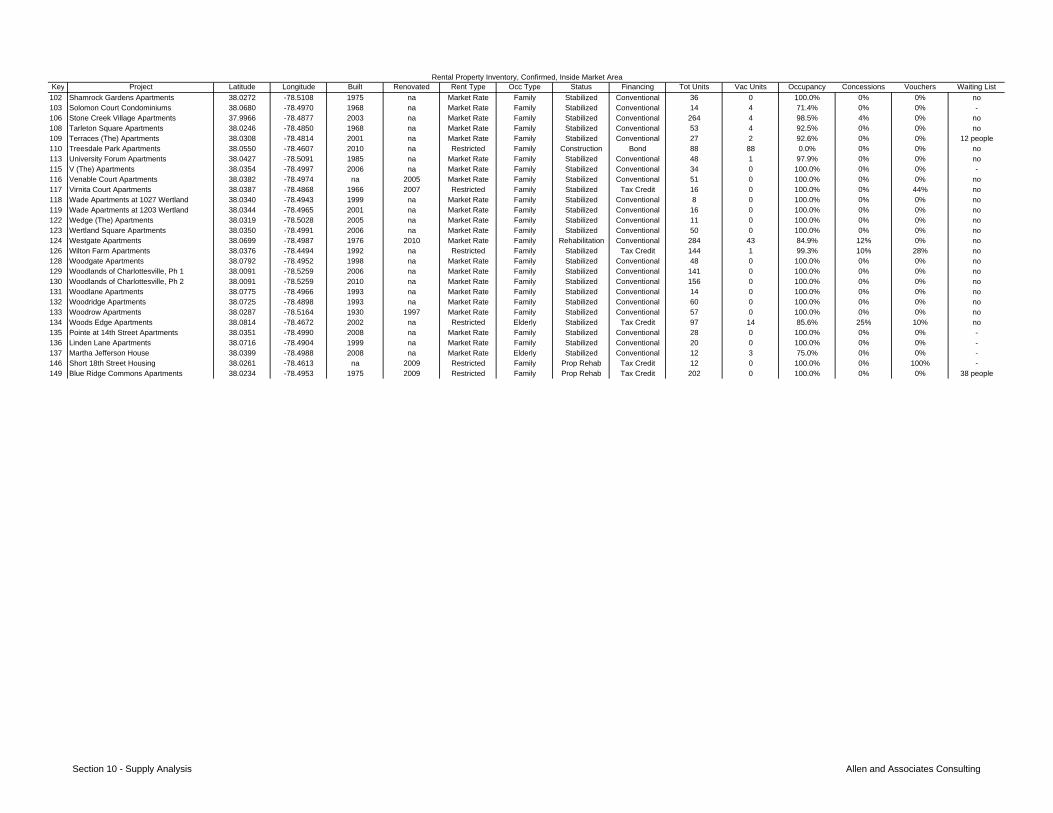
Key Project Latitude Longitude Built Renovated Rent Type Occ Type Status Financing Tot Units Vac Units Occupancy Concessions Vouchers Waiting ListRental Property Inventory, Confirmed, Inside Market Area
102 Shamrock Gardens Apartments 38.0272 -78.5108 1975 na Market Rate Family Stabilized Conventional 36 0 100.0% 0% 0% no103 Solomon Court Condominiums 38.0680 -78.4970 1968 na Market Rate Family Stabilized Conventional 14 4 71.4% 0% 0% -106 Stone Creek Village Apartments 37.9966 -78.4877 2003 na Market Rate Family Stabilized Conventional 264 4 98.5% 4% 0% no108 Tarleton Square Apartments 38.0246 -78.4850 1968 na Market Rate Family Stabilized Conventional 53 4 92.5% 0% 0% no109 Terraces (The) Apartments 38.0308 -78.4814 2001 na Market Rate Family Stabilized Conventional 27 2 92.6% 0% 0% 12 people110 Treesdale Park Apartments 38.0550 -78.4607 2010 na Restricted Family Construction Bond 88 88 0.0% 0% 0% no113 University Forum Apartments 38.0427 -78.5091 1985 na Market Rate Family Stabilized Conventional 48 1 97.9% 0% 0% no115 V (The) Apartments 38.0354 -78.4997 2006 na Market Rate Family Stabilized Conventional 34 0 100.0% 0% 0% -116 Venable Court Apartments 38.0382 -78.4974 na 2005 Market Rate Family Stabilized Conventional 51 0 100.0% 0% 0% no117 Virnita Court Apartments 38.0387 -78.4868 1966 2007 Restricted Family Stabilized Tax Credit 16 0 100.0% 0% 44% no118 Wade Apartments at 1027 Wertland 38.0340 -78.4943 1999 na Market Rate Family Stabilized Conventional 8 0 100.0% 0% 0% no119 Wade Apartments at 1203 Wertland 38.0344 -78.4965 2001 na Market Rate Family Stabilized Conventional 16 0 100.0% 0% 0% no122 Wedge (The) Apartments 38.0319 -78.5028 2005 na Market Rate Family Stabilized Conventional 11 0 100.0% 0% 0% no123 Wertland Square Apartments 38.0350 -78.4991 2006 na Market Rate Family Stabilized Conventional 50 0 100.0% 0% 0% no124 Westgate Apartments 38.0699 -78.4987 1976 2010 Market Rate Family Rehabilitation Conventional 284 43 84.9% 12% 0% no126 Wilton Farm Apartments 38.0376 -78.4494 1992 na Restricted Family Stabilized Tax Credit 144 1 99.3% 10% 28% no128 Woodgate Apartments 38.0792 -78.4952 1998 na Market Rate Family Stabilized Conventional 48 0 100.0% 0% 0% no129 Woodlands of Charlottesville, Ph 1 38.0091 -78.5259 2006 na Market Rate Family Stabilized Conventional 141 0 100.0% 0% 0% no130 Woodlands of Charlottesville, Ph 2 38.0091 -78.5259 2010 na Market Rate Family Stabilized Conventional 156 0 100.0% 0% 0% no131 Woodlane Apartments 38.0775 -78.4966 1993 na Market Rate Family Stabilized Conventional 14 0 100.0% 0% 0% no132 Woodridge Apartments 38.0725 -78.4898 1993 na Market Rate Family Stabilized Conventional 60 0 100.0% 0% 0% no133 Woodrow Apartments 38.0287 -78.5164 1930 1997 Market Rate Family Stabilized Conventional 57 0 100.0% 0% 0% no134 Woods Edge Apartments 38.0814 -78.4672 2002 na Restricted Elderly Stabilized Tax Credit 97 14 85.6% 25% 10% no135 Pointe at 14th Street Apartments 38.0351 -78.4990 2008 na Market Rate Family Stabilized Conventional 28 0 100.0% 0% 0% -136 Linden Lane Apartments 38.0716 -78.4904 1999 na Market Rate Family Stabilized Conventional 20 0 100.0% 0% 0% -137 Martha Jefferson House 38.0399 -78.4988 2008 na Market Rate Elderly Stabilized Conventional 12 3 75.0% 0% 0% -146 Short 18th Street Housing 38.0261 -78.4613 na 2009 Restricted Family Prop Rehab Tax Credit 12 0 100.0% 0% 100% -149 Blue Ridge Commons Apartments 38.0234 -78.4953 1975 2009 Restricted Family Prop Rehab Tax Credit 202 0 100.0% 0% 0% 38 people
Section 10 - Supply Analysis Allen and Associates Consulting