market feasibility study sterling, co
TRANSCRIPT

Market Feasibility Study
Sterling, CO
For more information regarding this report, contact:
Core Distinction Group LLC(612) 849-9775
C
ore D
istin
ction
Gro
up L
LC

Introduction/Objective …………………………………………………..…………………………………………….3General Market Overview …………………………………………………………………………………………………..4-5
General Market Location & Characteristics
* General Market (Map)
Site Analysis ………………………………………………………………………………………………………………………….6-8Economic Overview ……………………………………………………………………………………………………………9-59
Population
Eating and Drinking Place Sales
Effective Buying Income
Retain Sales
Workforce/Employment Distribution
Top Employers Profile Information
Unemployment/Labor Supply/Wage Pressures
Travel Patterns
* Colorado Profile 2010 Census
* Logan County Economic Development Corporation (LCEDC)
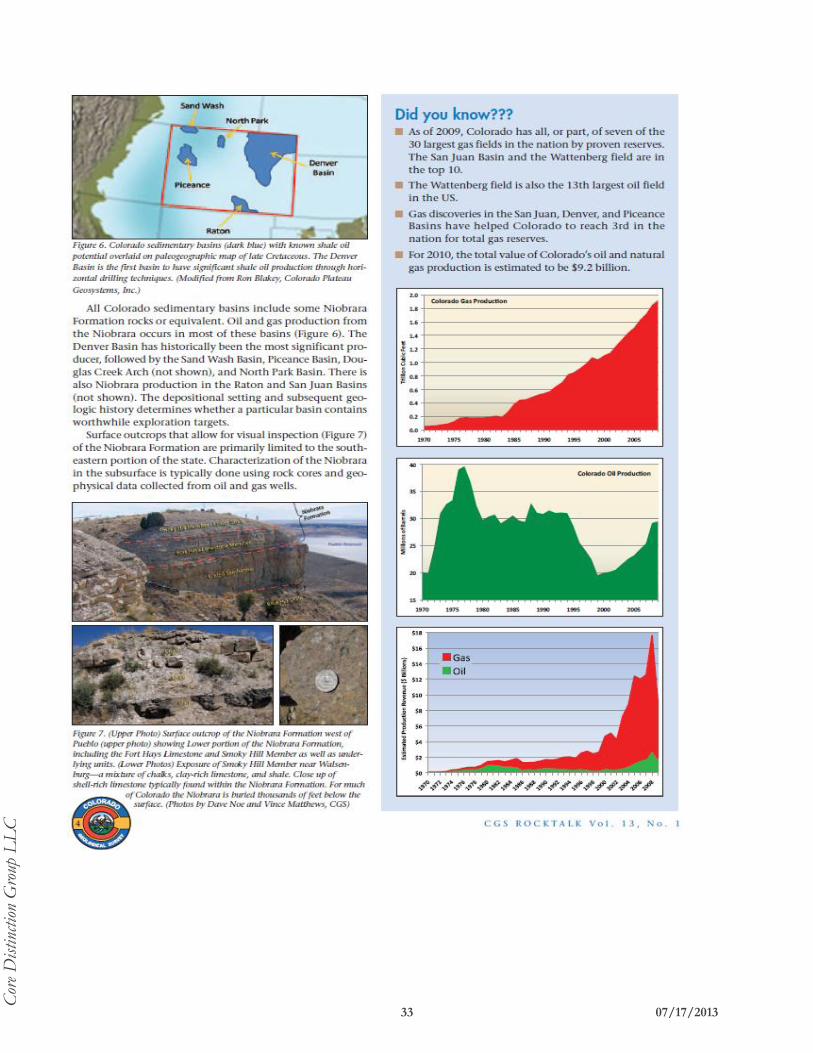
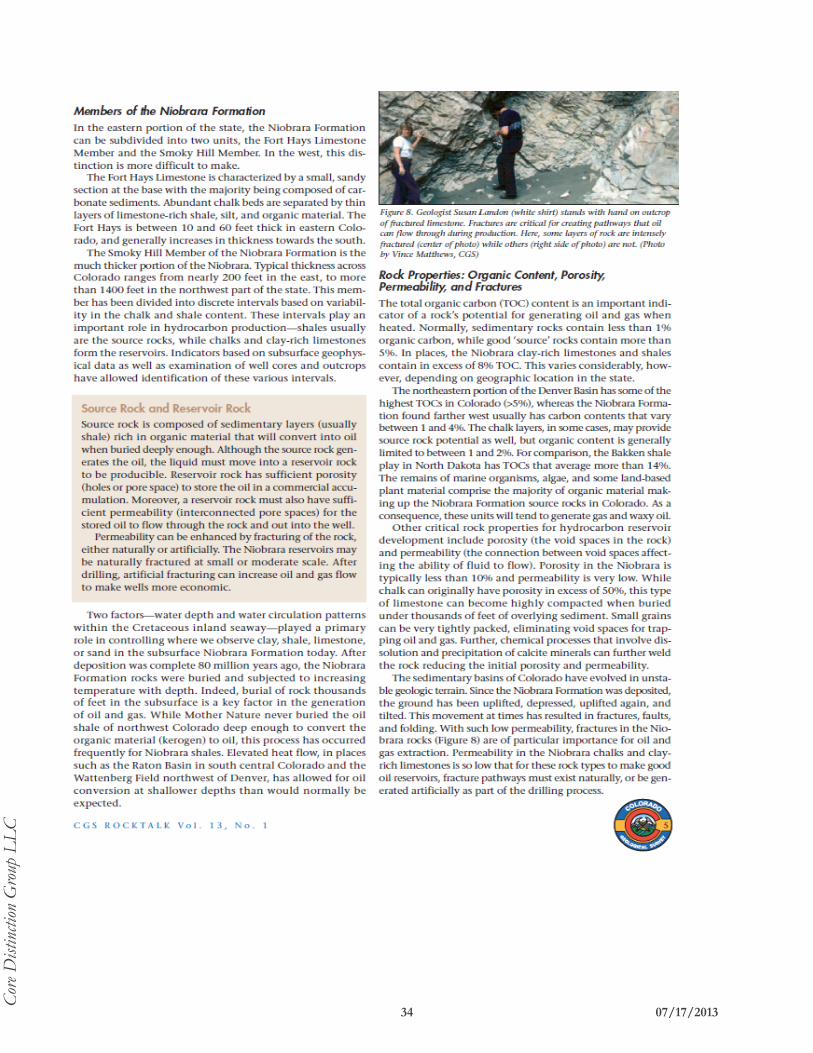
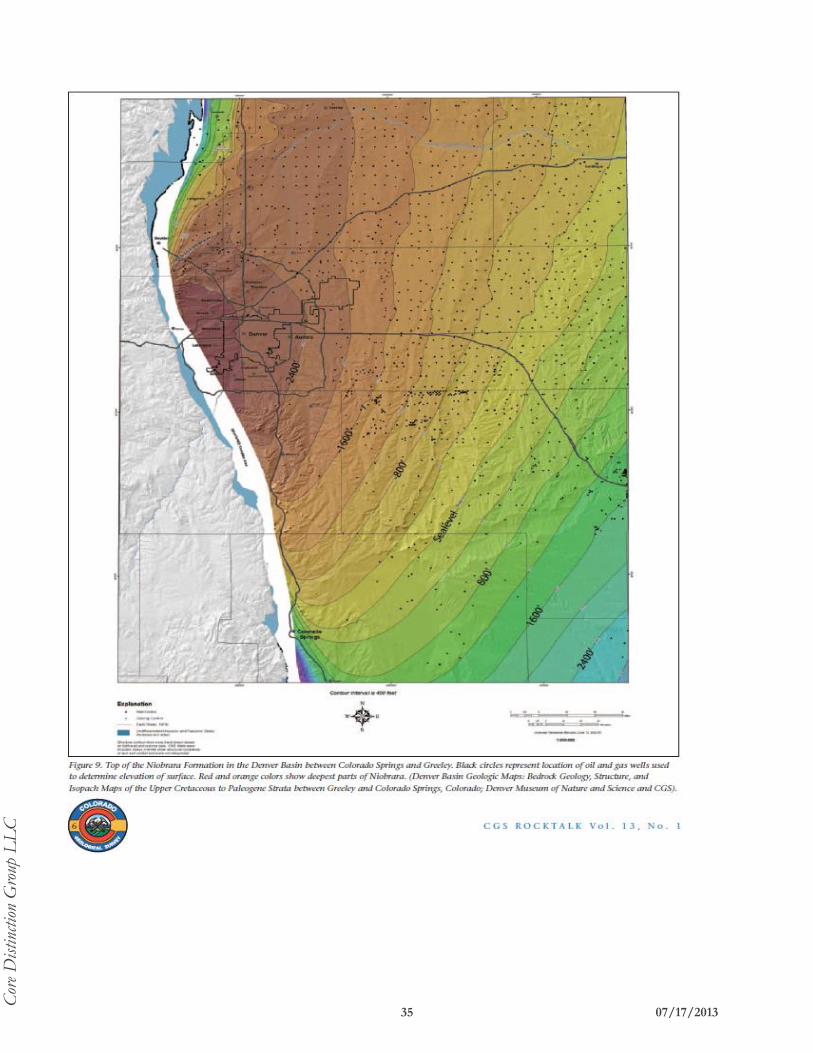
* Rock Talk (Oil Boom)
* Peetz Table / Logan Wind Energy Centers
* Sterling Ethanol
* Downtown Urban Renewal Area
* Traffic Flow Mapping
Lodging Demand …………………………………………………………………………………………………………………..60-68Market Segmentation
Lodging Demand Potential Index
Seasonality of Lodging Demand
Rate Sensitivity
Feeder Markets
Unaccommodated Lodging Demand
* Local Attractions
Lodging Supply ……………………………………………………………………………………………………………………..69-80Competitive Hotel Properties
Projected Average Daily Room Rate & Positioning
Competitive Property Performance
* STR Trending Data
Conclusions …………………………………………………………………………………………………………………………81-87Property Recommendations
Property Type, size, and rate strategy
Property Features, Amenities, and Services
Sleeping Room Configuration
Brand Affiliation
Opening Date
Development Budget & Projections
Introduction
C
ore D
istin
ction
Gro
up L
LC

Introduction
This Market Study report provides statistical support and highlighted narrative to support the conclusions
regarding the market area and it's ability to support the proposed hotel. This report should be acceptable
for external investing and/or lending purposes. Core Distinction Group LLC will be available to answer
any questions related to this Market Feasibility Report.
This report will present projections for stabilized hotel operation based upon current operating
performance in the market area. Occupancy, Average Daily Room Rate, and Sales Revenue projections
for the hotel were based upon a detailed review of the field research data. Also, recommendations as to
the property type, suggested property size, brand affiliation, services, and amenities were included. These
projections and recommendations were based upon the market demand research for the proposed facility.
In addition, recommendations were provided as to the preferred site for development of this hotel project.
This consultant from Core Distinction Group LLC met with representatives of the community and
surrounding area to gather information pertinent to the proposed hotel development and the operating in
the community. Comprehensive research was performed and reviewed regarding the community's
economic indicators, competitive lodging supply, and lodging demand generators. CDG performed filed
research to determine the relationship between the community and proposed facility's lodging supply
competitors and it's lodging demand generators. Economic indicators were studied to determine the
stability and future growth potential of the general market. The research conducted as a macro and micro
market analysis of the Sterling area and the areas immediately surrounding the proposed hotel to
determine their viability to support the proposed hotel.
Core Distinction Group LLC (CDG) has been engaged by the Northeastern Junior College (NJC) and the
potential developer Brimark Builders to provide this comprehensive Market Study Report of the City of
Sterling, Colorado Market. This Market Study provides an overview of information concerning the
market area and the factors that would affect the possible development of a hotel facility in this
community. This document is written in a format that highlights key information and offers a preliminary
indication of this market's ability to support the proposed hotel development.
This report will feature information concerning the market in which the proposed hotel will operate. A
possible brand being considered a 44 room Cobblestone Inn.
The following Comprehensive Market Study Report will review the proposed development of an upper
economy, limited-service hotel in the city of Sterling, CO. At the time of this report, the style, type, and
size of hotel determined would be between 40-45 guestrooms. The site for the proposed hotel has been
determined located on Highway 14 at the west end of the city.
3 07/17/2013
C
ore D
istin
ction
Gro
up L
LC

General Market LocationGeneral Market Overview
The City of Sterling is a Home Rule Municipality that is the county seat and the most populous city of
Logan County, CO. The city population was 14,777 at the 2010 census.
The closest major metropolitan area to Sterling, CO:
* Denver, CO located approximately 125 miles southwest on Interstate 76.
The closest major urban area to Sterling, CO:
* Fort Morgan, CO located approximately 45 miles southwest on Interstate 76.
Located in eastern central Colorado there are several smaller communities within short driving distance,
these cities offer a variety of local support for retail, dining options, and community.
Sterling, CO is located on Interstate 76,on the "eastern plains" of northeastern Colorado.
The hub of northeastern Colorado, Sterling is the largest town in Logan County. It is home to more than
13,000 residents and provides a huge array of retail services, annual events and activities to approximately
45,000 residents in the trade area. Sterling was platted and became the junction of the Union Pacific and
Burlington Railroads, providing an ideal location for commerce and industry to bloom. Other settlers
began moving to the new town by 1883 and the community was incorporated in 1884.
Interstate 76 connects Sterling to Denver (128 miles (206 km) southwest) and northeast to Interstate 80,
in Big Springs, Nebraska, along the South Platte River.
Business Loop 76 starts on the intersection of Interstate 76 and US 6, going through East Chestnut
Street, North and South 4th Street, South Division Avenue, returning to US 6, connecting Sterling to
Atwood and Merino.
US 6 runs east-west linking Provincetown, Massachusetts with Bishop, California, via Nevada,
Colorado, Illinois and 8 other states.
US 138 Runs parallel to Interstate 76, connecting Sterling to US 30, north of Big Springs, Ne
State Highway 14 connects Sterling to Fort Collins located 102 miles (164 km) to the west.
4 07/17/2013
C
ore D
istin
ction
Gro
up L
LC

General Market Overview (Map)
5 07/17/2013
C
ore D
istin
ction
Gro
up L
LC

This section of the report describes the site identified for the purposed hotel.
Chosen Site - Highway 14
Poor Fair Good ExcellentPoor Fair Good ExcellentPoor Fair Good ExcellentPoor Fair Good Excellent
Poor Fair Good ExcellentPoor Fair Good Excellent
Poor Fair Good Excellent
Poor Fair Good ExcellentPoor Fair Good ExcellentPoor Fair Good Excellent
Competition Position
Area Support Services
Architectural Controls
Zoning
The Competitive Position of this site was felt to be "Excellent" since this site is located along a major
traffic route through and into the city.
Overall Result
Site Analysis
Site preparation for this site are some what unknown. Wetland, water drainage, seepage or flood plain
issues were not directly addressed but they do not appear to be present here. A detailed Environmental
Impact study was not within the scope of this report. The developer should conduct necessary
environmental impact testing to ensure the subject site is in compliance with local ordinances and
environmental regulations. Major utilities are available in the area, but not "on site" as it is believed City
water and sewer will need to be brought to the site.
Site is located on the south side of Highway 14. This hotel site would give the hotel excellent visibility for
travelers on Highway 14. This site is located at the far west section of town.
Major Utilities
Environmental
Site Prep
Accessibility
Subject Site EvaluationRATINGCATEGORY
Visibility
6 07/17/2013
C
ore D
istin
ction
Gro
up L
LC

7 07/17/2013
C
ore D
istin
ction
Gro
up L
LC

8 07/17/2013
C
ore D
istin
ction
Gro
up L
LC

Economic Overview
Eating and Drinking Places * Local Restaurants Currently AvailableTaco John's
This section describes the preliminary general economic conditions observed in this area through various research sources.
Sterling, CO is driven by several economic segments including Education, Health, and Social Services
the primary segment; followed by Retail Trade, Arts, Entertainment, Accommodation, and Food
Service, Public Administration, and Construction.
The City of Sterling is a Home Rule Municipality that is the county seat and the most populous city of
Logan County, Colorado, United States. The city population was 14,777 at the 2010 census. Sterling
is the largest city in Northeastern Colorado and the county seat of Logan County and the site of the
domed Logan County courthouse, built in 1909. Logan County is the 23rd most extensive of the 64
counties of the State of Colorado of the United States. The county was named for General John A.
Logan. The county population was 22,709 at U.S. Census 2010. The county seat is Sterling
Population
Surf
KFC
Henry's Pub & Club
Daylight Donuts Long John Silver's Jimmy's Pizza
Arby'sMi Ranchito Burger King
Baja Taco's Sonic Drive In
Parco Restaurants
Flat Grill Burgers
Wonderful House Restaurant
Pizza Hut Taste of Philly Chester's Pub
Bamboo Garden McDonalds J & L Café
Fiesta Mexican Restaurant Quiznos Subs Hot Java Café
Old Town Bistro Subway Pi Kappa Cino Coffee
Country Kitchen Santiago's Mexican Restaurant
RKJ's Family Dining Papa Murphy's Pizza
Village Inn Domino's
Plainsman GrillGallagher's River City Grill
Delgado's Dugout Momma Conde's Mexican
9 07/17/2013
C
ore D
istin
ction
Gro
up L
LC

10 07/17/2013
C
ore D
istin
ction
Gro
up L
LC

11 07/17/2013
C
ore D
istin
ction
Gro
up L
LC

Effective Buying Income
Information is deemed reliable but not guaranteed. Demographic Information FAQ
Household Income: Data on
consumer income collected by the
Census Bureau covers money
income received (exclusive of
certain money receipts such as
capital gains) before payments for
personal income taxes, social
security, union dues, medicare
deductions, etc. Therefore, money
income does not reflect the fact
that some families receive part of
their income in the form of non-
cash benefits, such as food stamps,
health benefits, rent-free housing,
and goods produced and consumed
on the farm.
12 07/17/2013
C
ore D
istin
ction
Gro
up L
LC

13 07/17/2013
C
ore D
istin
ction
Gro
up L
LC

14 07/17/2013
C
ore D
istin
ction
Gro
up L
LC

Workforce/Employment Distribution
Major Employers (Public Sector)
Employment leaders in Sterling,
CO are the industries as follows:
Education, Health, and Social
Services (23%); Retail Trade
(10%); Arts, Entertainment,
Accommodation, and Food
Service (10%); Public
Administration (8%); and
Construction (8%).
Major Employers (Private Sector)
15 07/17/2013
C
ore D
istin
ction
Gro
up L
LC

Colorado Department of Corrections (SCF) is a Level V facility designed to house offenders of all
custody levels. SCF is the largest correctional facility within the Colorado Department of Corrections,
with a capacity of 2,485. SCF employs approximately 800 people. SCF is located approximately 120
miles north east of Denver on Interstate 76. The mission of the Colorado Department of Corrections
is: To Protect the Citizens of Colorado by Holding Offenders Accountable and Engaging Them in
Opportunities to Make Positive Behavioral Changes and Become Law-Abiding Productive Citizens.
Programs: Offenders have the opportunity to participate in a wide range of religious and volunteer
programs. We are privileged to have 3 volunteer chaplains who work closely with the offender
population and the volunteer coordinator. AA and NA are available. Educational programs are
inclusive of Adult Basic Education, Pre-GED, GED and English as a Second Language. Career and
Technical Education programs are inclusive of Business Entrepreneurship, Computer Information
Systems, Construction Technology, Custodial Training, Electronics Technology, Food Production
Management, Graphics Media and Desktop Design, Heavy Equipment, Print Technology, Welding,
and Upholstery. Self Improvement Classes are available to include Coping Skills, Parenting, and Pre-
Vocational. College classes are available but do require offenders to pay tuition. Academic classes are
available in Administrative Segregation. Post GED classes are also available for offenders meeting the
criteria.
SYKES Enterprises is a global leader in providing customer contact management solutions and
services in the business process outsourcing (BPO) arena. SYKES provides an array of sophisticated
customer contact management solutions to Fortune 1000 companies around the world, primarily in
the communications, financial services, healthcare, technology and transportation and leisure
industries. SYKES specializes in providing flexible, high quality customer support outsourcing
solutions with an emphasis on inbound technical support and customer service. Headquartered in
Tampa, Florida, with customer contact management centers throughout the world, SYKES provides
services through multiple communication channels including phone, email, web and chat. Utilizing its
integrated onshore/offshore global delivery model, SYKES serves its clients through two geographic
operating segments: the Americas (United States, Canada, Latin America and Asia Pacific) and EMEA
(Europe, Middle East and Africa). SYKES also provides various enterprise support services in the
Americas and fulfillment services in EMEA, which include multi-lingual sales order processing,
payment processing, inventory control, product delivery and product returns handling.
16 07/17/2013
C
ore D
istin
ction
Gro
up L
LC

Sterling Regional MedCenter has provided outstanding medical care to residents of northeastern
Colorado and the surrounding area since 1938. We are a 25-bed acute-care hospital with state-of-the-
art technology, a full range of health care services, and a staff dedicated to providing our patients with
excellent care. We are also home to the David Walsh Cancer Center, which offers an unprecedented
level of cancer care to northeastern Colorado residents. Our hospital offers cutting-edge technology
such as eICU, a remote monitoring system and an intelligent OB program, a computerized system
designed to reduce the chance of complications during labor. Our medical imaging department
includes a new 1.5 Magnet MRI, digital mammography and a 16-slice CT scan.
Sterling Regional MedCenter provides individuals facing cancer with a caring environment, specialized
staff and a patient-first approach. Dedicated in September 2010, the 8,600 square-foot David Walsh Cancer Center gives residents throughout northeastern Colorado the opportunity to remain close to
home for radiation oncology, chemotherapy and infusion services. Cancer care begins with obtaining
an accurate diagnosis and designing a personalized treatment plan. Our expert team works closely
with patients and their families. Whenever possible, patients are treated at the Cancer Center, where
they can receive radiation therapy, intravenous chemotherapy and other infusion services to help ease
symptoms or provide pain relief, hydration or nutrition. When patients require more advanced
diagnostic, surgical or non-surgical cancer care, Sterling works closely with the Cancer Institute at
North Colorado Medical Center. Accredited by the American College of Surgeons Commission on
Cancer as a "Comprehensive Community Cancer Program," this sister Banner Health hospital in
Greeley provides access to advanced cancer detection tools and treatment options along with national
research studies. In addition to experienced physicians and staff, exceptional detection and treatment
practices and a warm, holistic approach to care, the David Walsh Cancer Center offers a variety of
patient support and education services.
17 07/17/2013
C
ore D
istin
ction
Gro
up L
LC

RE-1 Valley School District encompasses an area of approximately 850 square miles that includes
the city of Sterling, and the towns of Atwood, Iliff, Proctor, Padroni and Crook. Logan County
education is rated among the best in the state. The district is home to 2,143 K-12 students who are
housed in three grade-level elementary buildings (K-2, 3-5 and K-6); two middle school buildings (6-8
and 7-8); two high schools (9-12); and two alternative high school program choices. There are 160
certified teachers; 10 administrators; and 216 classified staff. According to the Colorado Department
of Education’s 2012 District Performance Framework, RE-1 Valley Schools are either meeting or
approaching the academic achievement, academic growth, academic growth gaps, and post-secondary
and workforce readiness performance indicators. The continued focus on individual student
achievement and growth goals has produced these results.
Northeastern Community College (NJC) is a two-year junior college located in Sterling, CO. It is a
member college of the Colorado Community College System. The college offers over 80 programs of
study, with classes held at the campus or online. In addition to traditional course offerings, the college
offers classes in agriculture, including equine management and turf management, cosmetology,
nursing, and wind energy technology. NJC offers team sports in baseball, men's and women's
basketball, golf, rodeo, softball, soccer, and volleyball. The college owns and operates the
Northeastern 18 golf course, which it uses for its golf team and also for its turf management
curriculum. The golf course has a restaurant called the Plainsman Grill which the college uses for its
culinary arts classes.
18 07/17/2013
C
ore D
istin
ction
Gro
up L
LC

Economic Profile: The fertile agricultural lands that stretch outward from the South
Platte River to the prime grasslands have made Logan County one of the leading
agricultural producers in the state. While the economy is still largely reliant on
agriculture, manufacturing, renewable energy, and business services has emerged as
dominant forces. These sectors, combined with the City of Sterling’s “retail hub”
status, have diversified Logan County’s economy and work force. Northeastern
Colorado has been an important oil and gas region. Recent discoveries and new
technology has generated considerable interest in new exploration. Colorado recently
passed a Renewable Energy Standard requiring 30% renewable energy by 2020. The
400 megawatt Peetz “wind farm,” built between 2000 and 2009, is the cornerstone of
renewable energy development in Logan County.
The State of Colorado’s first commercial ethanol plant is located in Sterling. In
addition, as a result of the state-of-the-art telecommunications infrastructure in Logan
County, the City of Sterling is home to Sykes Enterprise, Inc. Two major interstate
natural gas pipelines have been completed recently. Goods manufactured in Logan
County also include farming tools, oil and gas well drilling equipment, equipment for
feeding livestock, scales and weighing machines, truck beds, flatbed trailers and trailers
for hauling cars.
It is not surprising that several distributors of industrial equipment and supplies, steel
fabricators and machine shops are also located in Logan County. Growth in
manufacturing has also attracted the attention of retailers and other service businesses.
The City of Sterling is rapidly becoming the commercial and retail hub for the
Northeastern Colorado and the Nebraska Panhandle, with a mix of healthy Main
Street and new commercial development. A new Wal-Mart Supercenter opened in
2000 and a new Home Depot store opened in June 2005 and a new Walgreens store
opened in 2007. Several new restaurants and other retail centers have recently been
developed while still more are expected to be opened within the next 12 months. All
of this speaks of the high quality of the work force and the attractiveness of the
community for people to come live and work in.
19 07/17/2013
C
ore D
istin
ction
Gro
up L
LC

Recent Business Openings: Several new businesses have recently located or been developed in
Logan County. From big-box retailers to large renewable energy projects, Logan County has seen an
increase in diversity of its economic base over the last 3 years and continues to build on this
momentum.
The Home Depot – The Home Depot Corporation recently opened its 123,700 square foot home
improvement center located on West Main Street in Sterling, Colorado. The grand opening was held
in June 2005.
Sterling Ethanol, LLC – The Sterling Ethanol LLC, a $52 million 42 million gallon per year ethanol
production facility completed construction and began operations in November 2005. From the start
of development to the first shipment of ethanol being sent from the facility was less than 18 months.
NextEra Energy Resources (formerly Florida Power & Light) – NextEra Energy currently has 427
turbines operating in Peetz, Colorado. This 608 megawatt wind farm is the largest in Colorado.
Additional development efforts are underway for a larger wind power project and transmission line.
There have been 750 permits issued.
Recent Business Expansions: Several existing businesses have recently expanded their operations
in Logan County. From fiber optic cable installation by Kentec Corp to a total refurbishment of an
old industrial building by Trinidad Benham, Logan County’s existing businesses are investing for their
futures.
Trinidad Benham – After signing a ten-year lease with the City of Sterling in 2001 on an abandon
industrial site, Trindad Benham has invested a significant amount of effort and capital in redesigning
and refurbishing the facility. Trinidad Benham expects to relocate and expand its current operations in
Sterling, Colorado to this newly redone facility. Consolidation of other facilities into this new
operation are under review.
Industrial Welding Services – With the increased activity in the oil and gas industry, Industrial
Welding Services has been awarded several long-term contracts for the construction of oil and gas
drilling rigs. Industrial Welding has significantly increased its employee base in the last two years and
added much needed working space to its manufacturing facility in Logan County.
Kentec Communications – Kentec Communication recently undertook an effort to add fiber optic
service to its line of services. With an anchor customer, Kentec installed a significant amount of
speculative fiber optic capacity with the expectation that demand would soon follow. The strategy
proved to be a good one with the signing of Logan County government to its fiber optic service.
Kentec Communications is a great example of the progressiveness of the local entrepreneurial culture
of Logan County.
20 07/17/2013
C
ore D
istin
ction
Gro
up L
LC

Incentives
There are several economic incentives available to an expanding or relocating business
within Logan County. The State of Colorado offers job creation grants, job training
grants, business loans, tax credits, and other economic development stimulus. The
local communities within Logan County and Logan County also are willing to provide
economic incentives to expanding or relocating businesses, each handled on a case-by-
case basis. The cities and Logan County can negotiate tax rebates, infrastructure
improvements, and other financing to stimulate job creation and capital improvement.
State of Colorado
Economic Development – Job Creation Grants: Business incentive funds are available for
businesses that commit to meet certain job creation requirements (for businesses with significant state
or regional impact, retained jobs may be considered). The Economic Development Commission
reviews and approves all requests for funding. Incentives vary based upon a number of factors;
however, requests generally range between $1,000-$3,000 per each full-time job created.
Job Training Grant Funds: Through the Colorado FIRST Program (targeted to new jobs being
created that need training) and the Existing Industry Program (targeted to existing jobs that need
retraining for the business to remain competitive), the state has funds available to assist with employee
training for specific businesses. Generally, up to $800 per employee trained may be provided.
Venture Capital: The State of Colorado has provided two venture capital funding models –
Certified Capital Companies and the Venture Capital Authority. The state has 6 Certified Capital
Companies that make loans and provide equity to Colorado businesses. The Certified Capital
Companies are independently operated and generally make funding decisions. The Venture Capital
Authority, an independent authority, will provide seed- and early-stage capital to Colorado based
businesses.
21 07/17/2013
C
ore D
istin
ction
Gro
up L
LC

Enterprise Zone Tax Credits: Logan County is designated as a Colorado Enterprise Zone, allowing
qualifying businesses to take advantage of several tax credits.
Enhanced Rural EZ Job Credit: House Bill 02-1161, sponsored by Rep. Brad Young (Lamar) and
Sen. Mark Hillman (Burlington), created Enhanced Rural Enterprise Zones, which offer greater
financial incentives to businesses that create new jobs in economically depressed rural areas. (39-30-
103.2, C.R.S.) These credits are available for tax years beginning on or after January 1, 2003. More
information …
Three Percent Investment Tax Credit: Businesses making investments in equipment used
exclusively in an enterprise zone which would have qualified for the pre-1986 federal investment tax
credit may claim a credit against their Colorado income taxes equal to three percent of the amount of
the investment, subject to limitations on the amount which can be claimed in any one year.
Investment which results from an in-state relocation is not eligible for the credit unless the new
location qualifies as an expansion. Excess credits may be carried back three years and forward twelve.
$500 Job Tax Credit: Businesses hiring new employees in connection with a “new business facility”
located in an enterprise zone may claim a tax credit against state income taxes of $500 for each such
employee. An expansion of an existing facility may be considered a “new business facility” if the
expansion adds at least 10 employees or a 10 percent increase over the previous annual average, if it is
at least $1 million in investment, or, if less, at least doubles the original investment in the facility. The
credit may be taken in subsequent years of the enterprise zone for each additional employee above the
maximum number employed in any prior tax year. Excess credits may be carried forward five years.
Double Job Tax Credit for Agricultural Processing: An additional credit of $500 per new
business facility employee may be claimed by businesses which add value to agricultural commodities
through manufacturing or processing.
$200 Job Tax Credit for Employer Health Insurance: In order to encourage employer-sponsored
health insurance plans, a taxpayer with a qualifying new business facility is allowed a two-year $200 tax
credit for each new business facility employee who is insured under a qualifying employer-sponsored
health insurance program.
R & D Tax Credit: Taxpayers who make private expenditures on research and experimental
activities (as defined in federal tax law) conducted in an enterprise zone qualify for an income tax
credit. This credit equals three percent of the amount of the increase in the taxpayer’s R & D
expenditures within the zone for the current tax year above the average of R&D expenditures within
the zone area in the previous two years. No more than one fourth of the allowable credit may be
taken in any one tax year.
22 07/17/2013
C
ore D
istin
ction
Gro
up L
LC

Credit to Rehabilitate Vacant Buildings: Owners or tenants of commercial buildings in an
enterprise zone which are at least 20 years old and which have been vacant for at least two years may
claim a credit of 25 percent of the cost of rehabilitating each building. The credit is limited to $50,000.
Ten Percent Job Training Credit: Beginning in 1997 tax year, employers who carry out qualified
job training program for their enterprise zone employees may claim an income tax credit of 10
percent of their eligible training costs.
Exemption from State Sales & Use Tax for Manufacturing & Mining Equipment: Manufacturing Machinery, Machine Tools; and Machine Parts are exempt from the three percent state
sales and use tax statewide, regardless of where within the state the equipment is used. When used
solely within an enterprise zone this exemption may also be claimed for purchases of: Mining
Equipment and Materials Used to Make Eligible Machinery. Eligible purchases used in an enterprise
zone are exempt whether the purchases are capitalized or expensed for accounting purposes.
Local Government Tax Incentives: The cities and county are authorized to negotiate with
individual taxpayers who have qualifying new business facilities (a) an incentive payment equal to not
more than the amount of the increase in property tax liability over pre-enterprise zone levels; and (b) a
refund of local sales and use taxes on purchases of equipment, machinery, machine tools, or supplies
used in the taxpayer’s business in the enterprise zone. Sterling Urban Renewal Authority (SURA)
grant programs are available for qualified applicants in the Sterling Downtown District. Please
contact the Logan County Economic Development Corporation office for more information. SURA
meetings are open to the public and meetings for the remainder of 2013 are : June 11, August 13,
October 8, December 10.
23 07/17/2013
C
ore D
istin
ction
Gro
up L
LC

Air and Rail Service
Crosson Field Municipal Airport serves Sterling, but there are no scheduled flights available from
there. The closest airport served by scheduled flights is Denver International Airport, located 121
miles (195 km) away. Sterling is also served by railroads, although only freight carriers serve the town.
The main rail operator is Burlington Northern Santa Fe (BNSF), but other operators, like Union
Pacific, serve Sterling as well. The closest Amtrak station is located in Fort Morgan, about 47 miles
(76 km) away.
UnemploymentSince 2005 the unemployment rate in Sterling, Colorado has ranged from 2.4% in April 2007 to 7.9%
in January 2012. The current unemployment rate for Sterling is 5.7% in March 2013.
Labor SupplyThe labor supply is felt to be adequate to support a hotel development. The hotel could draw
employment from the broad geographic area of Logan County or entice commuting community
members to stay closer to home for work rather than commuting to cities outside Sterling, CO. The
unemployment levels in the county should not place any major limitations on labor supply needed for
this build.
Wage PressuresWage pressures were not reported to be a concern in attracting Service employees for a hotel. Wage
competition was indicated as normal.
Travel Patterns
State Highway 14 AADT Traffic Counts (2012) Shown on Graph to follow
State Highway 14 connects Sterling to Fort Collins located 102 miles (164 km) to the west.
Business Loop 76 starts on the intersection of Interstate 76 and US 6, going through East
Chestnut Street, North and South 4th Street, South Division Avenue, returning to US 6,
connecting Sterling to Atwood and Merino.
US 6 runs east-west linking Provincetown, Massachusetts with Bishop, California, via Nevada,
Colorado, Illinois and 8 other states.
US 138 Runs parallel to Interstate 76, connecting Sterling to US 30, n of Big Springs, Ne
The Western Interstate 76 (I-76) is a diagonal route leading from transcontinental I-80 southwest into Denver.
I-76 was formerly Interstate 80S, and the designation was changed when most suffixed routes were eliminated.
Passing through the eastern plains of CO, I-76 serves the communities of Fort Morgan, Sterling, and Julesburg
along the banks of the South Platte River. The Platte River is not commercially navigable as a result, which is
typical of many western rivers. However, development has sprung up along this corridor, partially due to the
presence of I-76. In fact, the South Platte River valley even has its own U.S. route, U.S. 138, between Sterling
and Big Spring, NE. I-76 in Colorado also boasts one of the longest business routes in the country, Business
Loop I-76 along U.S. 6 from Fort Morgan northeast to Sterling.
Interstate 76 connects Sterling to Denver (128 miles (206 km) southwest) and northeast to
Interstate 80, in Big Springs, Nebraska, along the South Platte River.
24 07/17/2013
C
ore D
istin
ction
Gro
up L
LC

25 07/17/2013
C
ore D
istin
ction
Gro
up L
LC

The Logan County Economic Development Corporation (LCEDC) is a not-
for-profit corporation whose activities involving the promotion of Logan County
are strongly endorsed by both public and private entities. There are 14 members of
the Board of Directors representing various business sectors and communities. The
Board of Directors includes two City of Sterling City Council Members and one
Logan County Commissioner. Additionally, various advisory committees made up
of individuals who represent private business in Logan County also provides
oversight and advice to LCEDC. The LCEDC Board believes in balancing the
expansion of existing businesses with growth from new businesses.
What We Do •Retention & expansion of existing businesses accounts for more than 70% of
economic growth in communities. By working with local businesses to improve the
business climate, jobs can be saved and new jobs created through expansion. This
paves the way for recruitment of new businesses to the community.
•Recruitment of new industry targets businesses that complement and diversify
Logan County’s existing economic base.
•Infrastructure Development helps make Logan County a more attractive place to
live and do business. Infrastructure improvements, such as enhanced
telecommunications, are important to the future growth of Logan County.
LCEDC will serve as your point of contact in any efforts to expand or relocate your
business to Logan County. We can assist in tapping multiple sources of financing,
local and state incentive packages, and obtaining state and federal grants, where
applicable. The LCEDC also assists in facilitating between the local governmental
bodies and relocation logistics. Contact us if we can assist you.
26 07/17/2013
C
ore D
istin
ction
Gro
up L
LC

27 07/17/2013
C
ore D
istin
ction
Gro
up L
LC

28 07/17/2013
C
ore D
istin
ction
Gro
up L
LC

29 07/17/2013
C
ore D
istin
ction
Gro
up L
LC

30 07/17/2013
C
ore D
istin
ction
Gro
up L
LC

31 07/17/2013
C
ore D
istin
ction
Gro
up L
LC

32 07/17/2013
C
ore D
istin
ction
Gro
up L
LC
33 07/17/2013
C
ore D
istin
ction
Gro
up L
LC
34 07/17/2013
C
ore D
istin
ction
Gro
up L
LC
35 07/17/2013
C
ore D
istin
ction
Gro
up L
LC

36 07/17/2013
C
ore D
istin
ction
Gro
up L
LC

37 07/17/2013
C
ore D
istin
ction
Gro
up L
LC

38 07/17/2013
C
ore D
istin
ction
Gro
up L
LC

39 07/17/2013
C
ore D
istin
ction
Gro
up L
LC

40 07/17/2013
C
ore D
istin
ction
Gro
up L
LC
41 07/17/2013
C
ore D
istin
ction
Gro
up L
LC

42 07/17/2013
C
ore D
istin
ction
Gro
up L
LC

43 07/17/2013
C
ore D
istin
ction
Gro
up L
LC

44 07/17/2013
C
ore D
istin
ction
Gro
up L
LC

45 07/17/2013
C
ore D
istin
ction
Gro
up L
LC

Noble Energy, Inc. Operations GrowingLooking to extend area in Wattenberg FieldBy Callie Jones Journal-Advocate staff writer
Posted: 05/12/2012 10:00:00 AM MDT
STERLING -- Jonathan Ekstrom, public relations director for Noble Energy, Inc., was in Sterling Wednesday, to speak at a Rotary Club meeting as part of the
groups "Distinguished Speakers" series. "Energizing the world, bettering peoples live; that is our company's purpose," he said.
Noble has five key operating areas: onshore in the U.S., in Weld County, primarily in the DJ Basin and the Marcellus Shale; in the deepwater Gulf of Mexico; offshore
Eastern Mediterranean; and offshore West Africa. All five of their core areas have substantial growth. The DJ Basin includes northeast Colorado, it goes to southeast
Denver and it goes to parts of Wyoming, Nebraska and Kansas. Within that is the Wattenberg Horizontal Niobrara, which is what they're targeting now. "We always
knew that the Niobrara was there, it just wasn't economical to access," Ekstrom said. It's economical now because of advances in horizontal drilling. "We have over
400,000 net acres in Colorado alone and an additional 400,000 in Wyoming," Ekstrom said. They're working on extending their area of the Wattenberg Niobrara.
"When I talk about expanding the Wattenberg Field, what we're talking about is moving further north, moving closer to here," Ekstrom said. He could not say if
Noble has leased acres in Logan County.
Some of the things they've accomplished in their Wattenberg drilling program include having the best producing well in Wattenberg, the Gemini Well; proving
horizontal viability in vertically developed areas; and the longest extended reach lateral. "From one path, we're going further distance wise underground, than we ever
have," Ekstrom said. Additionally, they have record drill time, which reduces the impact and in 2008-2009 they partnered with industry to establish new field rules
with the Colorado Oil and Gas Conservation Commission. "We're very proud of those rules, the industries better for them," Ekstrom said. Noble has gone to an
entirely closed-loop drilling system. "We've done away with pits, it's all closed leaf drilling," he said. "It goes from a tank to underground, it's followed back into
another tank. Which is much more environmentally friendly." They've also been able to accomplish testing 80-acre density, lessening their impact, and they have the
first EcoNode Multi-Well Facility. "Now not only are we drilling one well from one location, we're drilling multiple wells from one location," Ekstrom said. "Which
again, limits the surface impact." Plus, they expanded the Wattenberg Field limits with low GNO (gas oil ratio) areas.
Ekstrom talked about the money Noble is putting into northeast Colorado. They will be investing $8 billion in Weld County over the next five years, $1.3 billion in
2012 alone. "This is something we are very committed to, we want to be a good neighbor and a positive force in our community, by producing and planting resources
that benefit consumers and strengthen the local economy," Ekstrom said. Noble is increasing their production at 170 plus active wells by 32 percent. "We expect
those to double by the end of the year," Ekstrom said. He also pointed out there is potential for 10,000 plus new jobs created. Noble utilizes more than 120 different
vendors and contractors in Weld County alone. "Sometimes people ask me, 'Why do you do that?' It's like any business; you use companies that specialize in things."
"The business that we do, requires a lot of other businesses to function." They will add jobs when they open their new Greeley office, which will house over 300 field
employees.
Ekstrom also noted that Noble's annual severance and ad valorem tax revenues are over $350 million in Colorado. "It's all for the good of the community," he said.
"That goes to things like school districts, fire districts, police districts, parks, recreation centers." Additionally, he talked about Noble's operation improvements. The
Greeley and Fort Collins area in EPA region 8, in terms of air quality, they're in a non-attainment area for ozone, which means cars now have to get emission tested.
"Most of that is as a result of mobile sources, that's cars and things like that," Ekstrom said. The oil and gas industry does have some things that produce emissions,
he said. One of the things Noble is looking to do is partner on compressed natural gas and liquid natural gas. "We're converting our truck fleet to compressed natural
gas," Ekstrom said. "CNG produces about 20 to 30 percent less CO2 than regular diesel or petroleum, it produces I think it's 70 percent less NOx and it produces 90
percent less volatile compounds." "So we're looking to improve the air quality in everything that we do."
Ekstrom also talked about Noble's initiatives, which include a global EHS management system, to monitor wells remotely; engaging local stakeholders; and
participating in the carbon disclosure project and hydraulic fracture and chemical disclosure. "There's been a lot of talk about hydraulic fracture and we understand
why the community's concerned, we're going underground, your water is underground, you want to know that it's protected," Ekstrom said. Noble is on
http://fracfocus.org, a joint venture between the Ground Water Protection Council and the Interstate Oil and Gas Commission. "For every well that we drill we list
all the chemicals that we use," Ekstrom said. "You can look up any well, see what was used, see when it was used, see when the well was drilled."
Another one of their initiatives is a comprehensive water management strategy. Noble is currently partnered with Colorado State University to expand on water issues
in Weld County and Colorado. "We're looking for alternative sources, we're looking for water outside the hydrologic cycle," Ekstrom said. "We're looking for ways to
recycle and we're increasing efficiency."
46 07/17/2013
C
ore D
istin
ction
Gro
up L
LC

47 07/17/2013
C
ore D
istin
ction
Gro
up L
LC

48 07/17/2013
C
ore D
istin
ction
Gro
up L
LC

49 07/17/2013
C
ore D
istin
ction
Gro
up L
LC

50 07/17/2013
C
ore D
istin
ction
Gro
up L
LC

51 07/17/2013
C
ore D
istin
ction
Gro
up L
LC

52 07/17/2013
C
ore D
istin
ction
Gro
up L
LC

53 07/17/2013
C
ore D
istin
ction
Gro
up L
LC

54 07/17/2013
C
ore D
istin
ction
Gro
up L
LC

55 07/17/2013
C
ore D
istin
ction
Gro
up L
LC

56 07/17/2013
C
ore D
istin
ction
Gro
up L
LC

57 07/17/2013
C
ore D
istin
ction
Gro
up L
LC

58 07/17/2013
C
ore D
istin
ction
Gro
up L
LC

59 07/17/2013
C
ore D
istin
ction
Gro
up L
LC

Market Segmentation Projection for Sterling, CO are as follows:
40%
20%
15%
10%
10%
5%
100%
This section of the report is a brief overview of the Lodging Demand highlights identified in this market.
Corporate
Base/Long Term
Total:
Lodging Demand
At this time, the proposed hotel should experience the same Market Segmentation as the overall market.
The proposed hotel in Sterling, CO would be the only branded hotel and the newest hotel in the
immediate regional area. The proposed hotel would be positioned to serve a wide variety of Lodging
Demand. Also, as a proposed upper economy hotel, it would be able to flex rates, facilities, and services
to accommodate a full range of Lodging Demand identified for this market.
Government
Medical
Education
Group
Notable locations in Sterling: Camp Bright (A), Life Care Medical Ambulance (B),
Overland Trail Museum (C), Sterling Fire Department (D).
60 07/17/2013
C
ore D
istin
ction
Gro
up L
LC

Market Segmentation Profiles
Average
Average
AboveAverage
Average
Average
AboveAverage
Average
Average
Average
Average
AboveAbove
T
T = Transient
E = Extended
G = Group
T, E, G
T
T, E
Area Recreation
Average
Average
Average
Average
Average
T
T
Average
Average
T
T
T, G, E
T, E
T
T
Outdoor Recreation
Entertainment
T, E, G
Government
Health Care
Education
Distribution
Utilities
Real Estate
E, G
T, G
Social/Leisure Markets
Training Groups
Company Parties, Awards Dinners, and Celebrations
Inventory and Auditing Companies
Highway Travelers
G
Average
AverageT, E
T
T
Above
Average
T
T, E
T, G
SMERF (Weddings, Reunions) G Average
Demand Potential
Corporate/Commercial Markets
Agriculture
Manufacturing
Construction
Transportation
Retail/Commercial
Professional Services
Insurance
Below, Average, Above
AboveAboveAboveAverage
T, E
Area Sites, Entertainment, and General Tourism
As described in the above chart, the overall market potential appears to be above average. Additionally,
the development of a hotel in the western portion of the city could encourage continued growth in the
market area.
Sterling, CO
Average
G Average
Association Groups
Amateur/Youth Sports
Events & Festivals
Regional Shopping
T, E, G
T
T
Relocation-Real Estate
Distressed Social-Interim Housing
Vendors & Suppliers to Local Market
Meetings and Seminars
Corporate
Association
T
T, E, G
T
61 07/17/2013
C
ore D
istin
ction
Gro
up L
LC

Due to the rural nature of the cities surrounding Sterling, visitors to the communities
surrounding have the potential to use Sterling for lodging as there are a limited number of
branded hotels in the county.
It is likely these employers will bring in vendors, suppliers, technicians, administrators,
clients, and marketing personnel into the area. These visitors reportedly are staying either
at the hotels off highway 76 on the east end of town or in areas outside of the city due to
the limited number of available adequate hotels in the area. They are seeking a mid-priced,
limited service property and the proposed hotel would enable the city to keep these
visitors and their lodging dollars in Sterling.
62 07/17/2013
C
ore D
istin
ction
Gro
up L
LC
Seasonality of Lodging Demand
January February March1,271 1,148 1,271
45% 55% 60%
572 631 763
85.00 89.00 89.00
$48,616 $56,195 $67,871April May June1,230 1,271 1,230
65% 75% 90%
800 953 1,107
94.00 94.00 101.00
$75,153 $89,606 $111,807July August September
1,271 1,271 1,230
95% 90% 80%
1,207 1,144 984
105.00 101.00 94.00
$126,782 $115,534 $92,496October November December TOTAL1,271 1,230 1,271 14,965
75% 60% 55% 70.5%
953 738 699 10,551
89.00 84.00 79.00 $93.46
$84,839 $61,992 $55,225 986,116
Lodging Rooms Available
1st Quarter (Jan-Mar)
Average Daily Rate
Lodging Occupancy %
Total Occ. Rooms
Average Daily Rate
Lodging Rooms Available
Lodging Occupancy %
Total Occ. Rooms
Lodging Rooms Available
Lodging Rooms Available
Lodging Occupancy %
Total Occ. Rooms
Average Daily Rate
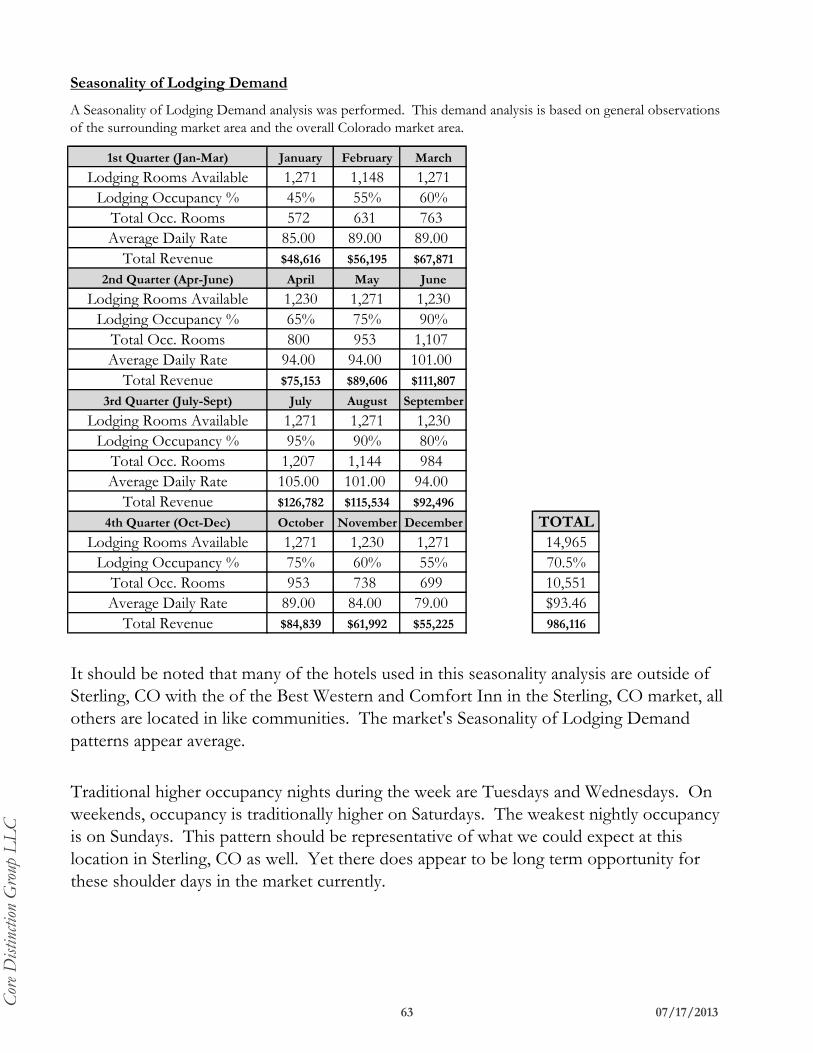
A Seasonality of Lodging Demand analysis was performed. This demand analysis is based on general observations
of the surrounding market area and the overall Colorado market area.
Total Revenue
Total Revenue
Total Revenue
Total Revenue
Traditional higher occupancy nights during the week are Tuesdays and Wednesdays. On
weekends, occupancy is traditionally higher on Saturdays. The weakest nightly occupancy
is on Sundays. This pattern should be representative of what we could expect at this
location in Sterling, CO as well. Yet there does appear to be long term opportunity for
these shoulder days in the market currently.
It should be noted that many of the hotels used in this seasonality analysis are outside of
Sterling, CO with the of the Best Western and Comfort Inn in the Sterling, CO market, all
others are located in like communities. The market's Seasonality of Lodging Demand
patterns appear average.
2nd Quarter (Apr-June)
3rd Quarter (July-Sept)
4th Quarter (Oct-Dec)
Average Daily Rate
Total Occ. Rooms
Lodging Occupancy %
63 07/17/2013
C
ore D
istin
ction
Gro
up L
LC

Rate Sensitivity
Feeder Markets
Unaccommodated Lodging Demand
A secondary definition of Unaccommodated Lodging Demand is demand desiring to stay in other markets
but having to stay in Sterling or other surrounding markets due to lack of Lodging Supply in the primary
market desired. This type of Unaccommodated Lodging Demand has potential to occur in Sterling. Also,
some of the smaller communities surrounding Sterling could affect this Lodging Demand potential as they
require lodging accommodation for their visitors as well.
Unaccommodated Lodging Demand maybe occurring in this market primarily due to the adequate lodging
options in the immediate market.
The Feeder Markets for this hotel will be regional and local. Social/Leisure feeder markets tend to be
generated from the region. Typical Corporate/Commercial market segments tend to be more national or
international yet this market may not see this type of business in the immediate future.
Traditionally social/leisure/group rates will be discounted on weekends with special rates and packages
for 10 or more guestrooms utilized. At this location a group maybe also considered 5 or more guestrooms
utilized for a period of time.
This market should have normal to low rate sensitivity. Traditionally, the social/leisure market will be
more rate sensitive than the corporate/commercial markets. This pattern should be represented in the
Sterling Market. There maybe additional ADR opportunities as well during peak demand periods when
festivals and city events bring more travelers to the market creating demand to force ADR's higher than
average.
64 07/17/2013
C
ore D
istin
ction
Gro
up L
LC
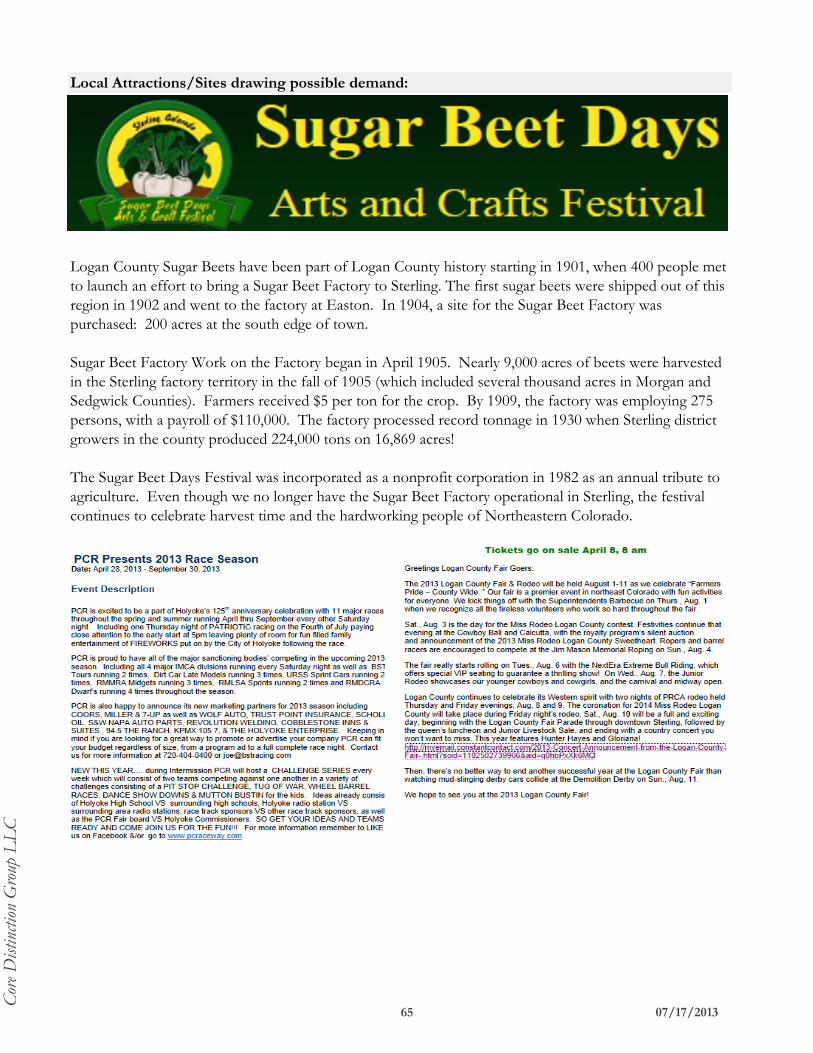
Local Attractions/Sites drawing possible demand:
Logan County Sugar Beets have been part of Logan County history starting in 1901, when 400 people met
to launch an effort to bring a Sugar Beet Factory to Sterling. The first sugar beets were shipped out of this
region in 1902 and went to the factory at Easton. In 1904, a site for the Sugar Beet Factory was
purchased: 200 acres at the south edge of town.
Sugar Beet Factory Work on the Factory began in April 1905. Nearly 9,000 acres of beets were harvested
in the Sterling factory territory in the fall of 1905 (which included several thousand acres in Morgan and
Sedgwick Counties). Farmers received $5 per ton for the crop. By 1909, the factory was employing 275
persons, with a payroll of $110,000. The factory processed record tonnage in 1930 when Sterling district
growers in the county produced 224,000 tons on 16,869 acres!
The Sugar Beet Days Festival was incorporated as a nonprofit corporation in 1982 as an annual tribute to
agriculture. Even though we no longer have the Sugar Beet Factory operational in Sterling, the festival
continues to celebrate harvest time and the hardworking people of Northeastern Colorado.
65 07/17/2013
C
ore D
istin
ction
Gro
up L
LC

66 07/17/2013
C
ore D
istin
ction
Gro
up L
LC

Boating and Fishing
As of April 14, boats that have undergone inspection can be put in the water at North Sterling State Park .
(Courtesy Journal Advocate) STERLING – North Sterling State Park has opened for boating. Due to early season
conditions, boaters must keep a lookout for possible floating debris and always be aware that unmarked hazards
may exist. If debris or hazards are discovered, please notify the park staff. Before boating, check that your vessel has
all of the required safety items on board. All trailered vessels must go through an aquatic nuisance species (ANS)
inspection prior to launching. The boat inspections are required prior to launch, so stop by the park office for more
information. If you wish to boat outside of inspection hours, you must obtain a seal from a certified ANS boat
inspector and go through the proper pre-inspection procedure. Remember to always clean, drain and dry your
vessel to help prevent the spread of ANS. North Sterling State Park, located in the northeastern Colorado town of
Sterling, is a boater’s paradise offering nearly 3,000 acres of pristine waters. The large, deep reservoir provides water
related activities throughout summer months. An additional 2,800 acres of land support a wide variety of
recreational activities, including bird-watching, wildlife viewing, hiking and more. The region is home to a diversity
of wildlife and has a rich historical heritage. Additional information on North Sterling State Park is available at:
www.parks.state.co.us/Parks/North Sterling. Prewitt Reservoir With 900 acres of water, Prewitt Reservoir offers
bird-watching, fishing and hunting. Fish include trout, wiper, yellow perch, crappie, largemouth bass, channel
catfish, white bass, saugeye and walleye. The entire lake is wakeless but there are no motor restrictions and the lake
has a boat ramp. Every person 19 -64 must purchase a habitat stamp before entering onto the site. Habitat stamps
are $5 with hunting or fishing license or $10 a person without a license. Stamps can be purchased through a licensed
vendor, online at www.wildlife.state.co.us or by calling (800)244-5613.
When you pass through the doors of the Overland Trail Museum, its like a walk back in time. Its a time machine, a
tangible photo album of how things used to be. Memories of the Overland Trail are kept in pristine condition
thanks to the hard work of its dedicated curators. Its the community's history, well preserved for future generation
to see and experience the birth, struggles and triumphs of past generations. Patrons will develop a new feel on how
life was generations ago when all the convenience of the modern world which we now enjoy are nonexistent. A
fireplace built using petrified wood welcomes patrons as they enter the front room built in 1936. Vintage rifles and
an assortment of taxidermy animals greet you. Items we have here were items the first settlers brought with them
and items donated by their families, said museum curator Kay Rich. This museum has so much! Built in 1965, the
first addition in the museum is the downstairs area which exhibits a two-headed calf, a crowd favorite. From the old
courthouse to the existing one, photos of the old Sterling downtown district is a site to see as it fills the hallways of
the museum. The transformation of Sterling and nearby towns is well documented in the photographs and gives the
viewers a glance of the past. Tourist and locals alike are amazed by the museums collection of vintage clothing,
electronics such as radios, television sets and phonographs. This museum has something for everyone, such as a
collection of handmade toys and dolls, some looking like they just came out of their boxes. The rural electrification
exhibit was dedicated to Dave Hamil in 2002 and was made possible with the help of public donations and grants.
Trees, native grasses and wildflowers can be seen on the grounds with a well-shaded picnic area offers an idea
resting place. Scattered throughout the grounds are pieces of pioneer farm machinery provide patrons with a
glimpse on how farming was done back in the homestead days. The Village exhibit is a collection of several
buildings which include the Stoney Buttes one-room school, a county Evangelical Lutheran Concordia Church,
Dailey Country Store, a blacksmith shop, a barbershop and a print shop. For information on hours and fees call
(970)522-3895.
Overland Trail Museum
67 07/17/2013
C
ore D
istin
ction
Gro
up L
LC

Golf
Two18-hole courses are in play in the heart of Logan County. There is the public course, Riverview Golf Club.
Riverview is the host of many spring and summer charity tournaments; it is also the home of the Riverview Ladies
Golf Association, which competes there every Tuesday in the spring and summer. Riverview is open to anyone with
$13 for nine holes or $19 for 18 holes. For nine holes, carts are $7 per person and $11 for 18. The club also offers
memberships. Riverview, a par 71 course, is located at 13064 County Road 370. Northeastern 18 is located at
17408 Hwy 14. The city also offers a disc golf course at Pioneer Park on Hwy 14 that is expanding to 18 holes.. The
course features water hazards hills and holes in the woods. It is free and open to the public. The hunt is on. If gold
isn't for you, then why not try antiquing? There are many options for antiquing in Sterling. Heart of the Plains,
located at 116 Main Street, has costume jewelry salt and pepper shakers and a little bit of everything, all organized
for easy browsing. Sterlings other antiquing options are Eastman Brothers, located at 326 N. Front Street,
Warehouse Antiques, 327 N. Front Street and County Charms Gifts Antiques located at 330 N. 3rd Ave. (Not sure
about these now. Isn't Warehouse Antiques now the Rialto?)Adventurous antique hunters can also find bargains at
Stoneham Antiques in Stoneham, 23 miles west of Sterling on Hwy 14 and Prairie Inspirations, located on CR 33.5
in an old church just west of Sterling, of Hwy 14.
Hunting & FishingLogan County is truly a sportsman’s paradise, touting world class fishing as well as both small and big game
hunting. Dove, quail, ring-necked pheasant, rabbit, raccoon, bobcat, coyote, deer and pronghorn are the most
popular game. The land is vast and this is prime hunting ground. The North Sterling Reservoir State Park is home
to some of the best goose hunting, boasting premier flights of Canada and snow geese. The Proctor area is a
popular site for quail, pheasant and waterfowl hunting. Sterling was recently named one of the “25 Best Pheasant
Hunting Towns in America” by Pheasants Forever. Logan County has more than 16,000 acres of public hunting
land, plus about 17,000 acres in the Walk-In Access program which allows licensed hunters to use certain private
land for hunting of small game, waterfowl or furbearers.
Bradford Reah, Sculptor
Bradford Rhea Sculptor turns trees into living art...He was in his 20s working as a diagnostic technician at the
Logan County Hospital when he realized that he needed to pursue his passion to be a sculptor. Soon, Sterling was
known as the City of Living Trees when Bradford Rheas tree sculptures started sprouting around town. I always
wanted to do marble sculptures but could not afford it, Rhea said adding that he approached city officials 27 years
ago when he heard that they were planning on removing dying trees around the city. Rhea carved a total of 17 tree
sculptures, some of which can be seen on a self-guided tour of the city. Some of his works are in the process of
being restored. In his art studio in merino, Rhea stood in front of his marble creation, the Exordium cut out of a
21,000-pound piece of marble as he expressed his deep appreciation for the community that supported him through
the years. I count my blessings every day of my life. I consider myself very fortunate, Rhea said citing all of the
opportunities and love the community provided him. There are nine sculptures situated in different city landmarks
for easy public access and self-guided tours. Created in 1987, the Scion carved from a 100-year-old cottonwood tree
is displayed at the Ramada Inn Courtyard on U.S. Highway 6 and Interstate 76. The piece is available for viewing all
year round. Park lovers can view the Sky grazers gracing the west entrance of Columbine Park. What is known as
the symbol of the City of Living Trees was originally dedicated in 1984. In 2000, it was recast to bronze where the
original wood sculpture stood. The original is currently being restored. Greeting tourists at the tourist center is the
Metamorphosis. The original wood carving is now located at the French Hall of the Northeastern Junior College
and is available for viewing during business hours. Available for viewing 24 hours a day, the bronze version was
created in 2002. One of the most memorable moments for Rhea was when he was commissioned by the
Department of State to create a walking stick for then President Clinton to present to Pope John Paul II during his
visit in 1993. The sculptures are more about the people in Sterling than me. I had a lot of help from a lot of friends
in this good community and the Lord has been good to me, Rhea said as he describes himself as more persistence
than talent.
68 07/17/2013
C
ore D
istin
ction
Gro
up L
LC

Competitive Hotel Properties
SINGLE DOUBLE WEEKEND CORP
Above $109.00 $99.00 $89.00 $79.00 $94.00
Average $139.99 $125.99 $119.00 $95.00 $120.00
Below $69.00 $69.00 $69.00 $59.00 $66.50
Average $105.00 $95.00 $89.00 $79.00 $92.00
$93.12
SINGLE DOUBLE WEEKEND CORP
Above $129.00 $125.00 $109.00 $99.00 $115.50
Average $125.00 $115.00 $115.00 $99.00 $113.50
Average $129.00 $119.00 $99.00 $89.00 $109.00
Average $139.99 $125.99 $119.00 $95.00 $120.00
Above $109.00 $99.00 $89.00 $79.00 $94.00
$110.40
SINGLE DOUBLE WEEKEND CORP
Above $109.00 $99.00 $89.00 $79.00 $94.00
Average $139.99 $125.99 $119.00 $95.00 $120.00
Below $59.00 $49.00 $49.00 $49.00 $51.50
Below $69.00 $69.00 $69.00 $59.00 $66.50
Average $105.00 $95.00 $89.00 $79.00 $92.00
Below $45.00 $39.00 $39.00 $35.00 $39.50
$77.25
Comfort Inn Sterling, CO
Best Western Sterling, CO
STERLING, CO - Hotel Occupancy & Rates (4)
PropertyOcc
Perform
RATE ANALYSIS Projected
ADR
COMPETITIVE MARKET AVERAGE DAILY ROOM RATE (ADR):Ramada Sterling, CO
Super 8 Sterling, CO
RATE ANALYSIS
Competitive Hotel Occupancy & RatesProjected
ADR
Holiday Inn Sidney, NE
Best Western Sterling, CO
Hampton Inn Sidney, NE
PropertyOcc
Perform
Ramada Sterling, CO
Sterling Motor Lodge Sterling, CO
Comfort Inn Sterling, CO
COMPETITIVE MARKET AVERAGE DAILY ROOM RATE (ADR):
Lodging SupplyThis section of the report describes the primary competitive Lodging Supply that will affect the property, particularly for hotel room demand.
The Overall/Statistical Competitive Set was pared down to four properties which will help to generate preliminary rate positioning for the proposed hotel.
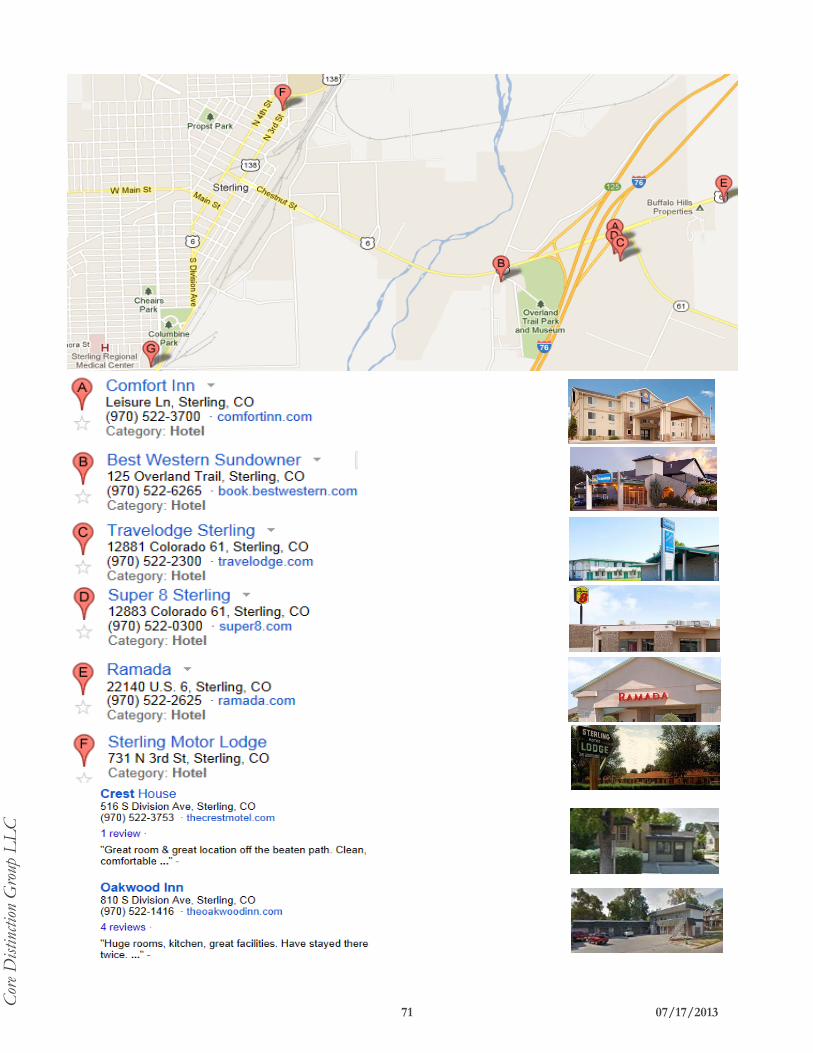
There are currently 5 other branded hotels in the city of Sterling, CO; all located on Highway 76 at the east
end of town. There are two additional hotels in the market independent in branding. These hotels are
running May 2013 rates from $39-139. STR Lodging data pulled from two of the hotels in the market due
to reporting availability as well as from Sidney, NE and Greely, CO over 40 miles away in larger
surrounding communities.
Fairfield Inn Greeley, CO
STERLING, CO - Hotel Occupancy & Rates
PropertyOcc
Perform
RATE ANALYSIS Projected
ADR
Comfort Inn Sterling, CO
Best Western Sterling, CO
Travelodge Sterling, CO
Super 8 Sterling, CO
COMPETITIVE MARKET AVERAGE DAILY ROOM RATE (ADR):
69 07/17/2013
C
ore D
istin
ction
Gro
up L
LC

Typically a new property should experience a rate premium in the market with it's new and better offerings
to area travelers. At this time, it is felt that this property should try to achieve a rate structure higher than
the current independent hotels in the immediate market as well compete under the rates of those hotels in
the larger markets of Colorado. Being the newest hotel in the market and conveniently located to main
traffic routes should also give this proposed hotel a competitive advantage.
Room rate competition for a limited-service hotel in this market will be present throughout the year. This
rate competition will be dictated by the rate structure of the hotels in the surrounding regional area. With
proper rate positioning the hotel should achieve a yield to the overall regional market of 120% which is
above average and would assist in mitigating any rate sensitivity. Revenue/yield Management does not
currently appear to be present in this current high demand market and this will be an important aspect of
the ADR growth of this hotel on a daily basis.
The statistical competitive market has not seen any new supply growth in the past 8 years as the newest
hotel in the market is the Comfort Inn which opened in July of 2005 over 8 years ago. At the time of this
report there was no other indication of another hotel building in the surrounding regional area. Still, this
should be monitored closely throughout the development process. No additional supply growth was
factored into the projections at this time.
The proposed hotel will directly serve the Sterling, CO market and will attract the Lodging Demand
identified in this report. It will offer the newest, most current hotel product in Logan County and will serve
as the newest branded hotel in Sterling, CO. As a result, it should be the premier property in Sterling and
should attract any Unaccommodated Lodging Demand being displaced elsewhere in the market due to ta
lack of adequate accommodation in the city. Its facilities will be developed to match the expectations of
today's travelers. This property could be established with a national or regional brand. Working with a
brand which has experience in the lodging market will establish quality assurance for the hotel. Its defined
rate positioning should establish the property as a highly competitive hotel for it's Lodging Demand.
Assuming that a brand is selected for this property, an Area of Franchise Protection should be addressed by
the proposed hotel owner. This Area of Franchise Protection should be reviewed to ensure it's
compatibility with the Sterling Market. It should also be compared with the brand's Incremental Impact
Policy. The owner should seek the largest Area of Franchise Protection that can possibly be obtained. At
times, using the Incremental Impact Policy may provide the most protection. This market should be
protected from similar brand development within the regional Sterling market area and a larger area of
protection may not be feasible. It is recommended that the necessary impact research be performed in
relation to these markets prior to development.
70 07/17/2013
C
ore D
istin
ction
Gro
up L
LC
71 07/17/2013
C
ore D
istin
ction
Gro
up L
LC

United Kingdom United States
Blue Fin Building 735 East Main Street
110 Southwark Street Hendersonville
London SE1 0TA TN 37075
Phone: +44 (0)20 7922 1930 Phone: +1 (615) 824 8664
Fax: +44 (0)20 7922 1931 Fax: +1 (615) 824 3848
www.strglobal.com
Sterling, CO Selected Properties
Job Number: 455844_SADIM Staff: SS Created: November 07, 2012
Currency: USD - US Dollar
TabTable of Contents 1
Data by Measure 2
Percent Change by Measure 3
Percent Change by Year 4
Twelve Month Moving Average 5
Day of Week Analysis 6
Raw Data 7
Classic 8
Response Report 9
Help 10
Terms and Conditions 11
January 2006 to September 2012
72 07/17/2013
C
ore D
istin
ction
Gro
up L
LC
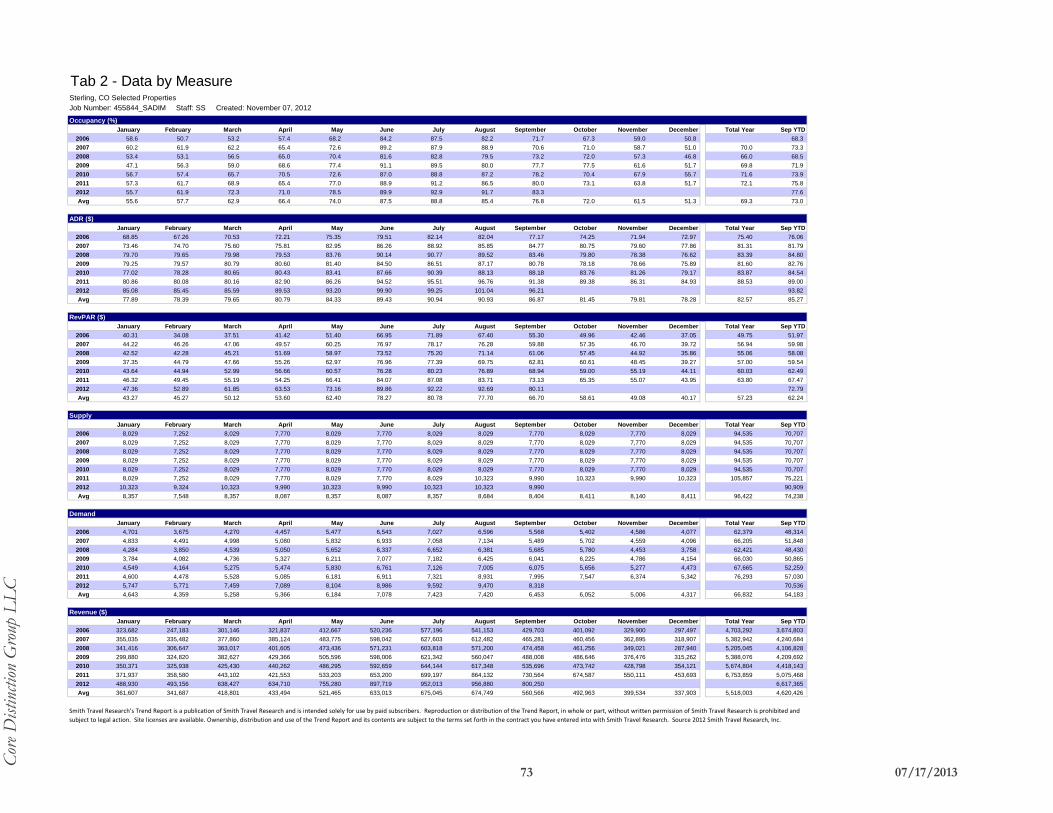
Tab 2 - Data by MeasureSterling, CO Selected Properties
Job Number: 455844_SADIM Staff: SS Created: November 07, 2012
Occupancy (%)
January February March April May June July August September October November December Total Year Sep YTD
2006 58.6 50.7 53.2 57.4 68.2 84.2 87.5 82.2 71.7 67.3 59.0 50.8 68.3
2007 60.2 61.9 62.2 65.4 72.6 89.2 87.9 88.9 70.6 71.0 58.7 51.0 70.0 73.3
2008 53.4 53.1 56.5 65.0 70.4 81.6 82.8 79.5 73.2 72.0 57.3 46.8 66.0 68.5
2009 47.1 56.3 59.0 68.6 77.4 91.1 89.5 80.0 77.7 77.5 61.6 51.7 69.8 71.9
2010 56.7 57.4 65.7 70.5 72.6 87.0 88.8 87.2 78.2 70.4 67.9 55.7 71.6 73.9
2011 57.3 61.7 68.9 65.4 77.0 88.9 91.2 86.5 80.0 73.1 63.8 51.7 72.1 75.8
2012 55.7 61.9 72.3 71.0 78.5 89.9 92.9 91.7 83.3 77.6
Avg 55.6 57.7 62.9 66.4 74.0 87.5 88.8 85.4 76.8 72.0 61.5 51.3 69.3 73.0
ADR ($)
January February March April May June July August September October November December Total Year Sep YTD
2006 68.85 67.26 70.53 72.21 75.35 79.51 82.14 82.04 77.17 74.25 71.94 72.97 75.40 76.06
2007 73.46 74.70 75.60 75.81 82.95 86.26 88.92 85.85 84.77 80.75 79.60 77.86 81.31 81.79
2008 79.70 79.65 79.98 79.53 83.76 90.14 90.77 89.52 83.46 79.80 78.38 76.62 83.39 84.80
2009 79.25 79.57 80.79 80.60 81.40 84.50 86.51 87.17 80.78 78.18 78.66 75.89 81.60 82.76
2010 77.02 78.28 80.65 80.43 83.41 87.66 90.39 88.13 88.18 83.76 81.26 79.17 83.87 84.54
2011 80.86 80.08 80.16 82.90 86.26 94.52 95.51 96.76 91.38 89.38 86.31 84.93 88.53 89.00
2012 85.08 85.45 85.59 89.53 93.20 99.90 99.25 101.04 96.21 93.82
Avg 77.89 78.39 79.65 80.79 84.33 89.43 90.94 90.93 86.87 81.45 79.81 78.28 82.57 85.27
RevPAR ($)
January February March April May June July August September October November December Total Year Sep YTD
2006 40.31 34.08 37.51 41.42 51.40 66.95 71.89 67.40 55.30 49.96 42.46 37.05 49.75 51.97
2007 44.22 46.26 47.06 49.57 60.25 76.97 78.17 76.28 59.88 57.35 46.70 39.72 56.94 59.98
2008 42.52 42.28 45.21 51.69 58.97 73.52 75.20 71.14 61.06 57.45 44.92 35.86 55.06 58.08
2009 37.35 44.79 47.66 55.26 62.97 76.96 77.39 69.75 62.81 60.61 48.45 39.27 57.00 59.54
2010 43.64 44.94 52.99 56.66 60.57 76.28 80.23 76.89 68.94 59.00 55.19 44.11 60.03 62.49
2011 46.32 49.45 55.19 54.25 66.41 84.07 87.08 83.71 73.13 65.35 55.07 43.95 63.80 67.47
2012 47.36 52.89 61.85 63.53 73.16 89.86 92.22 92.69 80.11 72.79
Avg 43.27 45.27 50.12 53.60 62.40 78.27 80.78 77.70 66.70 58.61 49.08 40.17 57.23 62.24
Supply
January February March April May June July August September October November December Total Year Sep YTD
2006 8,029 7,252 8,029 7,770 8,029 7,770 8,029 8,029 7,770 8,029 7,770 8,029 94,535 70,707
2007 8,029 7,252 8,029 7,770 8,029 7,770 8,029 8,029 7,770 8,029 7,770 8,029 94,535 70,707
2008 8,029 7,252 8,029 7,770 8,029 7,770 8,029 8,029 7,770 8,029 7,770 8,029 94,535 70,707
2009 8,029 7,252 8,029 7,770 8,029 7,770 8,029 8,029 7,770 8,029 7,770 8,029 94,535 70,707
2010 8,029 7,252 8,029 7,770 8,029 7,770 8,029 8,029 7,770 8,029 7,770 8,029 94,535 70,707
2011 8,029 7,252 8,029 7,770 8,029 7,770 8,029 10,323 9,990 10,323 9,990 10,323 105,857 75,221
2012 10,323 9,324 10,323 9,990 10,323 9,990 10,323 10,323 9,990 90,909
Avg 8,357 7,548 8,357 8,087 8,357 8,087 8,357 8,684 8,404 8,411 8,140 8,411 96,422 74,238
Demand
January February March April May June July August September October November December Total Year Sep YTD
2006 4,701 3,675 4,270 4,457 5,477 6,543 7,027 6,596 5,568 5,402 4,586 4,077 62,379 48,314
2007 4,833 4,491 4,998 5,080 5,832 6,933 7,058 7,134 5,489 5,702 4,559 4,096 66,205 51,848
2008 4,284 3,850 4,539 5,050 5,652 6,337 6,652 6,381 5,685 5,780 4,453 3,758 62,421 48,430
2009 3,784 4,082 4,736 5,327 6,211 7,077 7,182 6,425 6,041 6,225 4,786 4,154 66,030 50,865
2010 4,549 4,164 5,275 5,474 5,830 6,761 7,126 7,005 6,075 5,656 5,277 4,473 67,665 52,259
2011 4,600 4,478 5,528 5,085 6,181 6,911 7,321 8,931 7,995 7,547 6,374 5,342 76,293 57,030
2012 5,747 5,771 7,459 7,089 8,104 8,986 9,592 9,470 8,318 70,536
Avg 4,643 4,359 5,258 5,366 6,184 7,078 7,423 7,420 6,453 6,052 5,006 4,317 66,832 54,183
Revenue ($)
January February March April May June July August September October November December Total Year Sep YTD
2006 323,682 247,183 301,146 321,837 412,667 520,236 577,196 541,153 429,703 401,092 329,900 297,497 4,703,292 3,674,803
2007 355,035 335,482 377,860 385,124 483,775 598,042 627,603 612,482 465,281 460,456 362,895 318,907 5,382,942 4,240,684
2008 341,416 306,647 363,017 401,605 473,436 571,231 603,818 571,200 474,458 461,256 349,021 287,940 5,205,045 4,106,828
2009 299,880 324,820 382,627 429,366 505,596 598,006 621,342 560,047 488,008 486,646 376,476 315,262 5,388,076 4,209,692
2010 350,371 325,938 425,430 440,262 486,295 592,659 644,144 617,348 535,696 473,742 428,798 354,121 5,674,804 4,418,143
2011 371,937 358,580 443,102 421,553 533,203 653,200 699,197 864,132 730,564 674,587 550,111 453,693 6,753,859 5,075,468
2012 488,930 493,156 638,427 634,710 755,280 897,719 952,013 956,880 800,250 6,617,365
Avg 361,607 341,687 418,801 433,494 521,465 633,013 675,045 674,749 560,566 492,963 399,534 337,903 5,518,003 4,620,426
Smith Travel Research’s Trend Report is a publication of Smith Travel Research and is intended solely for use by paid subscribers. Reproduction or distribution of the Trend Report, in whole or part, without written permission of Smith Travel Research is prohibited and
subject to legal action. Site licenses are available. Ownership, distribution and use of the Trend Report and its contents are subject to the terms set forth in the contract you have entered into with Smith Travel Research. Source 2012 Smith Travel Research, Inc.
73 07/17/2013
C
ore D
istin
ction
Gro
up L
LC
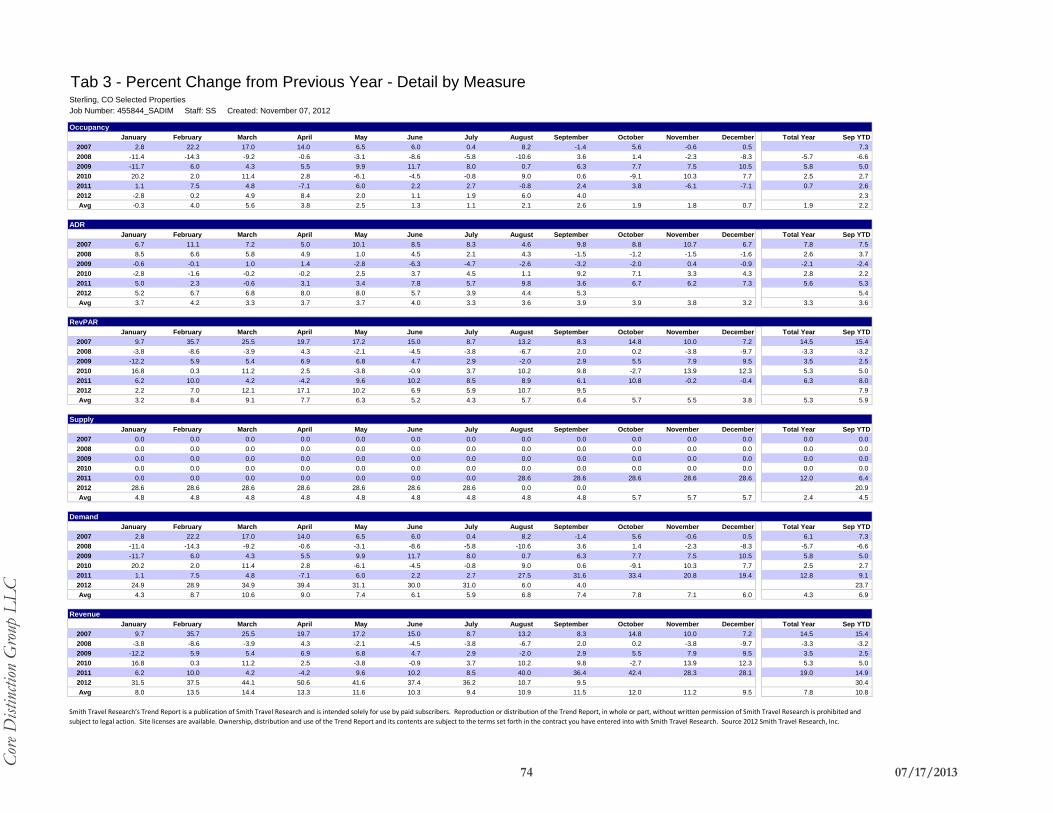
Tab 3 - Percent Change from Previous Year - Detail by MeasureSterling, CO Selected Properties
Job Number: 455844_SADIM Staff: SS Created: November 07, 2012
Occupancy
January February March April May June July August September October November December Total Year Sep YTD
2007 2.8 22.2 17.0 14.0 6.5 6.0 0.4 8.2 -1.4 5.6 -0.6 0.5 7.3
2008 -11.4 -14.3 -9.2 -0.6 -3.1 -8.6 -5.8 -10.6 3.6 1.4 -2.3 -8.3 -5.7 -6.6
2009 -11.7 6.0 4.3 5.5 9.9 11.7 8.0 0.7 6.3 7.7 7.5 10.5 5.8 5.0
2010 20.2 2.0 11.4 2.8 -6.1 -4.5 -0.8 9.0 0.6 -9.1 10.3 7.7 2.5 2.7
2011 1.1 7.5 4.8 -7.1 6.0 2.2 2.7 -0.8 2.4 3.8 -6.1 -7.1 0.7 2.6
2012 -2.8 0.2 4.9 8.4 2.0 1.1 1.9 6.0 4.0 2.3
Avg -0.3 4.0 5.6 3.8 2.5 1.3 1.1 2.1 2.6 1.9 1.8 0.7 1.9 2.2
ADR
January February March April May June July August September October November December Total Year Sep YTD
2007 6.7 11.1 7.2 5.0 10.1 8.5 8.3 4.6 9.8 8.8 10.7 6.7 7.8 7.5
2008 8.5 6.6 5.8 4.9 1.0 4.5 2.1 4.3 -1.5 -1.2 -1.5 -1.6 2.6 3.7
2009 -0.6 -0.1 1.0 1.4 -2.8 -6.3 -4.7 -2.6 -3.2 -2.0 0.4 -0.9 -2.1 -2.4
2010 -2.8 -1.6 -0.2 -0.2 2.5 3.7 4.5 1.1 9.2 7.1 3.3 4.3 2.8 2.2
2011 5.0 2.3 -0.6 3.1 3.4 7.8 5.7 9.8 3.6 6.7 6.2 7.3 5.6 5.3
2012 5.2 6.7 6.8 8.0 8.0 5.7 3.9 4.4 5.3 5.4
Avg 3.7 4.2 3.3 3.7 3.7 4.0 3.3 3.6 3.9 3.9 3.8 3.2 3.3 3.6
RevPAR
January February March April May June July August September October November December Total Year Sep YTD
2007 9.7 35.7 25.5 19.7 17.2 15.0 8.7 13.2 8.3 14.8 10.0 7.2 14.5 15.4
2008 -3.8 -8.6 -3.9 4.3 -2.1 -4.5 -3.8 -6.7 2.0 0.2 -3.8 -9.7 -3.3 -3.2
2009 -12.2 5.9 5.4 6.9 6.8 4.7 2.9 -2.0 2.9 5.5 7.9 9.5 3.5 2.5
2010 16.8 0.3 11.2 2.5 -3.8 -0.9 3.7 10.2 9.8 -2.7 13.9 12.3 5.3 5.0
2011 6.2 10.0 4.2 -4.2 9.6 10.2 8.5 8.9 6.1 10.8 -0.2 -0.4 6.3 8.0
2012 2.2 7.0 12.1 17.1 10.2 6.9 5.9 10.7 9.5 7.9
Avg 3.2 8.4 9.1 7.7 6.3 5.2 4.3 5.7 6.4 5.7 5.5 3.8 5.3 5.9
Supply
January February March April May June July August September October November December Total Year Sep YTD
2007 0.0 0.0 0.0 0.0 0.0 0.0 0.0 0.0 0.0 0.0 0.0 0.0 0.0 0.0
2008 0.0 0.0 0.0 0.0 0.0 0.0 0.0 0.0 0.0 0.0 0.0 0.0 0.0 0.0
2009 0.0 0.0 0.0 0.0 0.0 0.0 0.0 0.0 0.0 0.0 0.0 0.0 0.0 0.0
2010 0.0 0.0 0.0 0.0 0.0 0.0 0.0 0.0 0.0 0.0 0.0 0.0 0.0 0.0
2011 0.0 0.0 0.0 0.0 0.0 0.0 0.0 28.6 28.6 28.6 28.6 28.6 12.0 6.4
2012 28.6 28.6 28.6 28.6 28.6 28.6 28.6 0.0 0.0 20.9
Avg 4.8 4.8 4.8 4.8 4.8 4.8 4.8 4.8 4.8 5.7 5.7 5.7 2.4 4.5
Demand
January February March April May June July August September October November December Total Year Sep YTD
2007 2.8 22.2 17.0 14.0 6.5 6.0 0.4 8.2 -1.4 5.6 -0.6 0.5 6.1 7.3
2008 -11.4 -14.3 -9.2 -0.6 -3.1 -8.6 -5.8 -10.6 3.6 1.4 -2.3 -8.3 -5.7 -6.6
2009 -11.7 6.0 4.3 5.5 9.9 11.7 8.0 0.7 6.3 7.7 7.5 10.5 5.8 5.0
2010 20.2 2.0 11.4 2.8 -6.1 -4.5 -0.8 9.0 0.6 -9.1 10.3 7.7 2.5 2.7
2011 1.1 7.5 4.8 -7.1 6.0 2.2 2.7 27.5 31.6 33.4 20.8 19.4 12.8 9.1
2012 24.9 28.9 34.9 39.4 31.1 30.0 31.0 6.0 4.0 23.7
Avg 4.3 8.7 10.6 9.0 7.4 6.1 5.9 6.8 7.4 7.8 7.1 6.0 4.3 6.9
Revenue
January February March April May June July August September October November December Total Year Sep YTD
2007 9.7 35.7 25.5 19.7 17.2 15.0 8.7 13.2 8.3 14.8 10.0 7.2 14.5 15.4
2008 -3.8 -8.6 -3.9 4.3 -2.1 -4.5 -3.8 -6.7 2.0 0.2 -3.8 -9.7 -3.3 -3.2
2009 -12.2 5.9 5.4 6.9 6.8 4.7 2.9 -2.0 2.9 5.5 7.9 9.5 3.5 2.5
2010 16.8 0.3 11.2 2.5 -3.8 -0.9 3.7 10.2 9.8 -2.7 13.9 12.3 5.3 5.0
2011 6.2 10.0 4.2 -4.2 9.6 10.2 8.5 40.0 36.4 42.4 28.3 28.1 19.0 14.9
2012 31.5 37.5 44.1 50.6 41.6 37.4 36.2 10.7 9.5 30.4
Avg 8.0 13.5 14.4 13.3 11.6 10.3 9.4 10.9 11.5 12.0 11.2 9.5 7.8 10.8
Smith Travel Research’s Trend Report is a publication of Smith Travel Research and is intended solely for use by paid subscribers. Reproduction or distribution of the Trend Report, in whole or part, without written permission of Smith Travel Research is prohibited and
subject to legal action. Site licenses are available. Ownership, distribution and use of the Trend Report and its contents are subject to the terms set forth in the contract you have entered into with Smith Travel Research. Source 2012 Smith Travel Research, Inc.
74 07/17/2013
C
ore D
istin
ction
Gro
up L
LC

Tab 4 - Percent Change from Previous Year - Detail by YearSterling, CO Selected Properties
Job Number: 455844_SADIM Staff: SS Created: November 07, 2012
Jan 07 Feb 07 Mar 07 Apr 07 May 07 Jun 07 Jul 07 Aug 07 Sep 07 Oct 07 Nov 07 Dec 07 Total Year Sep YTD
Occ 2.8 22.2 17.0 14.0 6.5 6.0 0.4 8.2 -1.4 5.6 -0.6 0.5 6.1 7.3
ADR 6.7 11.1 7.2 5.0 10.1 8.5 8.3 4.6 9.8 8.8 10.7 6.7 7.5
RevPAR 9.7 35.7 25.5 19.7 17.2 15.0 8.7 13.2 8.3 14.8 10.0 7.2 14.5 15.4
Supply 0.0 0.0 0.0 0.0 0.0 0.0 0.0 0.0 0.0 0.0 0.0 0.0 0.0 0.0
Demand 2.8 22.2 17.0 14.0 6.5 6.0 0.4 8.2 -1.4 5.6 -0.6 0.5 6.1 7.3
Revenue 9.7 35.7 25.5 19.7 17.2 15.0 8.7 13.2 8.3 14.8 10.0 7.2 14.5 15.4
Jan 08 Feb 08 Mar 08 Apr 08 May 08 Jun 08 Jul 08 Aug 08 Sep 08 Oct 08 Nov 08 Dec 08 Total Year Sep YTD
Occ -11.4 -14.3 -9.2 -0.6 -3.1 -8.6 -5.8 -10.6 3.6 1.4 -2.3 -8.3 -5.7 -6.6
ADR 8.5 6.6 5.8 4.9 1.0 4.5 2.1 4.3 -1.5 -1.2 -1.5 -1.6 2.6 3.7
RevPAR -3.8 -8.6 -3.9 4.3 -2.1 -4.5 -3.8 -6.7 2.0 0.2 -3.8 -9.7 -3.3 -3.2
Supply 0.0 0.0 0.0 0.0 0.0 0.0 0.0 0.0 0.0 0.0 0.0 0.0 0.0 0.0
Demand -11.4 -14.3 -9.2 -0.6 -3.1 -8.6 -5.8 -10.6 3.6 1.4 -2.3 -8.3 -5.7 -6.6
Revenue -3.8 -8.6 -3.9 4.3 -2.1 -4.5 -3.8 -6.7 2.0 0.2 -3.8 -9.7 -3.3 -3.2
Jan 09 Feb 09 Mar 09 Apr 09 May 09 Jun 09 Jul 09 Aug 09 Sep 09 Oct 09 Nov 09 Dec 09 Total Year Sep YTD
Occ -11.7 6.0 4.3 5.5 9.9 11.7 8.0 0.7 6.3 7.7 7.5 10.5 5.8 5.0
ADR -0.6 -0.1 1.0 1.4 -2.8 -6.3 -4.7 -2.6 -3.2 -2.0 0.4 -0.9 -2.1 -2.4
RevPAR -12.2 5.9 5.4 6.9 6.8 4.7 2.9 -2.0 2.9 5.5 7.9 9.5 3.5 2.5
Supply 0.0 0.0 0.0 0.0 0.0 0.0 0.0 0.0 0.0 0.0 0.0 0.0 0.0 0.0
Demand -11.7 6.0 4.3 5.5 9.9 11.7 8.0 0.7 6.3 7.7 7.5 10.5 5.8 5.0
Revenue -12.2 5.9 5.4 6.9 6.8 4.7 2.9 -2.0 2.9 5.5 7.9 9.5 3.5 2.5
Jan 10 Feb 10 Mar 10 Apr 10 May 10 Jun 10 Jul 10 Aug 10 Sep 10 Oct 10 Nov 10 Dec 10 Total Year Sep YTD
Occ 20.2 2.0 11.4 2.8 -6.1 -4.5 -0.8 9.0 0.6 -9.1 10.3 7.7 2.5 2.7
ADR -2.8 -1.6 -0.2 -0.2 2.5 3.7 4.5 1.1 9.2 7.1 3.3 4.3 2.8 2.2
RevPAR 16.8 0.3 11.2 2.5 -3.8 -0.9 3.7 10.2 9.8 -2.7 13.9 12.3 5.3 5.0
Supply 0.0 0.0 0.0 0.0 0.0 0.0 0.0 0.0 0.0 0.0 0.0 0.0 0.0 0.0
Demand 20.2 2.0 11.4 2.8 -6.1 -4.5 -0.8 9.0 0.6 -9.1 10.3 7.7 2.5 2.7
Revenue 16.8 0.3 11.2 2.5 -3.8 -0.9 3.7 10.2 9.8 -2.7 13.9 12.3 5.3 5.0
Jan 11 Feb 11 Mar 11 Apr 11 May 11 Jun 11 Jul 11 Aug 11 Sep 11 Oct 11 Nov 11 Dec 11 Total Year Sep YTD
Occ 1.1 7.5 4.8 -7.1 6.0 2.2 2.7 -0.8 2.4 3.8 -6.1 -7.1 0.7 2.6
ADR 5.0 2.3 -0.6 3.1 3.4 7.8 5.7 9.8 3.6 6.7 6.2 7.3 5.6 5.3
RevPAR 6.2 10.0 4.2 -4.2 9.6 10.2 8.5 8.9 6.1 10.8 -0.2 -0.4 6.3 8.0
Supply 0.0 0.0 0.0 0.0 0.0 0.0 0.0 28.6 28.6 28.6 28.6 28.6 12.0 6.4
Demand 1.1 7.5 4.8 -7.1 6.0 2.2 2.7 27.5 31.6 33.4 20.8 19.4 12.8 9.1
Revenue 6.2 10.0 4.2 -4.2 9.6 10.2 8.5 40.0 36.4 42.4 28.3 28.1 19.0 14.9
Jan 12 Feb 12 Mar 12 Apr 12 May 12 Jun 12 Jul 12 Aug 12 Sep 12 Oct 12 Nov 12 Dec 12 Total Year Sep YTD
Occ -2.8 0.2 4.9 8.4 2.0 1.1 1.9 6.0 4.0 2.3
ADR 5.2 6.7 6.8 8.0 8.0 5.7 3.9 4.4 5.3 5.4
RevPAR 2.2 7.0 12.1 17.1 10.2 6.9 5.9 10.7 9.5 7.9
Supply 28.6 28.6 28.6 28.6 28.6 28.6 28.6 0.0 0.0 20.9
Demand 24.9 28.9 34.9 39.4 31.1 30.0 31.0 6.0 4.0 23.7
Revenue 31.5 37.5 44.1 50.6 41.6 37.4 36.2 10.7 9.5 30.4
Smith Travel Research’s Trend Report is a publication of Smith Travel Research and is intended solely for use by paid subscribers. Reproduction or distribution of the Trend Report, in whole or part, without written permission of Smith Travel Research is prohibited and subject to
legal action. Site licenses are available. Ownership, distribution and use of the Trend Report and its contents are subject to the terms set forth in the contract you have entered into with Smith Travel Research. Source 2012 Smith Travel Research, Inc.
75 07/17/2013
C
ore D
istin
ction
Gro
up L
LC
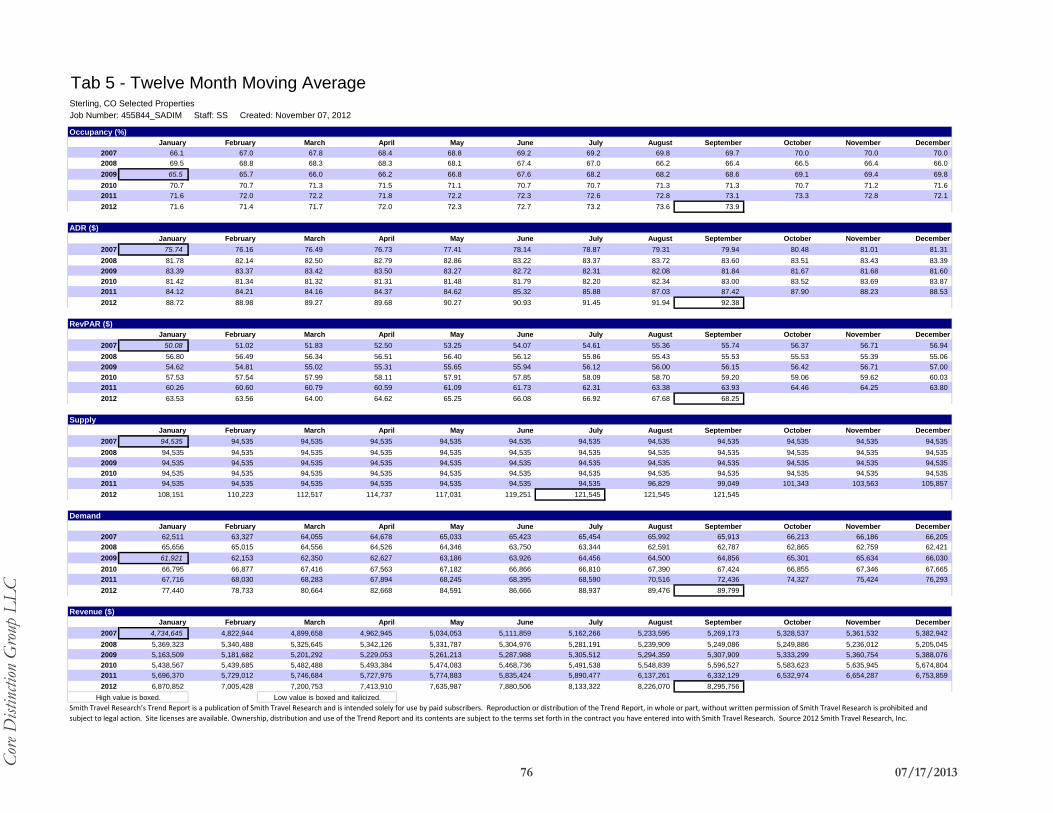
Tab 5 - Twelve Month Moving AverageSterling, CO Selected Properties
Job Number: 455844_SADIM Staff: SS Created: November 07, 2012
Occupancy (%)
January February March April May June July August September October November December
2007 66.1 67.0 67.8 68.4 68.8 69.2 69.2 69.8 69.7 70.0 70.0 70.0
2008 69.5 68.8 68.3 68.3 68.1 67.4 67.0 66.2 66.4 66.5 66.4 66.0
2009 65.5 65.7 66.0 66.2 66.8 67.6 68.2 68.2 68.6 69.1 69.4 69.8
2010 70.7 70.7 71.3 71.5 71.1 70.7 70.7 71.3 71.3 70.7 71.2 71.6
2011 71.6 72.0 72.2 71.8 72.2 72.3 72.6 72.8 73.1 73.3 72.8 72.1
2012 71.6 71.4 71.7 72.0 72.3 72.7 73.2 73.6 73.9
ADR ($)
January February March April May June July August September October November December
2007 75.74 76.16 76.49 76.73 77.41 78.14 78.87 79.31 79.94 80.48 81.01 81.31
2008 81.78 82.14 82.50 82.79 82.86 83.22 83.37 83.72 83.60 83.51 83.43 83.39
2009 83.39 83.37 83.42 83.50 83.27 82.72 82.31 82.08 81.84 81.67 81.68 81.60
2010 81.42 81.34 81.32 81.31 81.48 81.79 82.20 82.34 83.00 83.52 83.69 83.87
2011 84.12 84.21 84.16 84.37 84.62 85.32 85.88 87.03 87.42 87.90 88.23 88.53
2012 88.72 88.98 89.27 89.68 90.27 90.93 91.45 91.94 92.38
RevPAR ($)
January February March April May June July August September October November December
2007 50.08 51.02 51.83 52.50 53.25 54.07 54.61 55.36 55.74 56.37 56.71 56.94
2008 56.80 56.49 56.34 56.51 56.40 56.12 55.86 55.43 55.53 55.53 55.39 55.06
2009 54.62 54.81 55.02 55.31 55.65 55.94 56.12 56.00 56.15 56.42 56.71 57.00
2010 57.53 57.54 57.99 58.11 57.91 57.85 58.09 58.70 59.20 59.06 59.62 60.03
2011 60.26 60.60 60.79 60.59 61.09 61.73 62.31 63.38 63.93 64.46 64.25 63.80
2012 63.53 63.56 64.00 64.62 65.25 66.08 66.92 67.68 68.25
Supply
January February March April May June July August September October November December
2007 94,535 94,535 94,535 94,535 94,535 94,535 94,535 94,535 94,535 94,535 94,535 94,535
2008 94,535 94,535 94,535 94,535 94,535 94,535 94,535 94,535 94,535 94,535 94,535 94,535
2009 94,535 94,535 94,535 94,535 94,535 94,535 94,535 94,535 94,535 94,535 94,535 94,535
2010 94,535 94,535 94,535 94,535 94,535 94,535 94,535 94,535 94,535 94,535 94,535 94,535
2011 94,535 94,535 94,535 94,535 94,535 94,535 94,535 96,829 99,049 101,343 103,563 105,857
2012 108,151 110,223 112,517 114,737 117,031 119,251 121,545 121,545 121,545
Demand
January February March April May June July August September October November December
2007 62,511 63,327 64,055 64,678 65,033 65,423 65,454 65,992 65,913 66,213 66,186 66,205
2008 65,656 65,015 64,556 64,526 64,346 63,750 63,344 62,591 62,787 62,865 62,759 62,421
2009 61,921 62,153 62,350 62,627 63,186 63,926 64,456 64,500 64,856 65,301 65,634 66,030
2010 66,795 66,877 67,416 67,563 67,182 66,866 66,810 67,390 67,424 66,855 67,346 67,665
2011 67,716 68,030 68,283 67,894 68,245 68,395 68,590 70,516 72,436 74,327 75,424 76,293
2012 77,440 78,733 80,664 82,668 84,591 86,666 88,937 89,476 89,799
Revenue ($)
January February March April May June July August September October November December
2007 4,734,645 4,822,944 4,899,658 4,962,945 5,034,053 5,111,859 5,162,266 5,233,595 5,269,173 5,328,537 5,361,532 5,382,942
2008 5,369,323 5,340,488 5,325,645 5,342,126 5,331,787 5,304,976 5,281,191 5,239,909 5,249,086 5,249,886 5,236,012 5,205,045
2009 5,163,509 5,181,682 5,201,292 5,229,053 5,261,213 5,287,988 5,305,512 5,294,359 5,307,909 5,333,299 5,360,754 5,388,076
2010 5,438,567 5,439,685 5,482,488 5,493,384 5,474,083 5,468,736 5,491,538 5,548,839 5,596,527 5,583,623 5,635,945 5,674,804
2011 5,696,370 5,729,012 5,746,684 5,727,975 5,774,883 5,835,424 5,890,477 6,137,261 6,332,129 6,532,974 6,654,287 6,753,859
2012 6,870,852 7,005,428 7,200,753 7,413,910 7,635,987 7,880,506 8,133,322 8,226,070 8,295,756
High value is boxed. Low value is boxed and italicized.
Smith Travel Research’s Trend Report is a publication of Smith Travel Research and is intended solely for use by paid subscribers. Reproduction or distribution of the Trend Report, in whole or part, without written permission of Smith Travel Research is prohibited and
subject to legal action. Site licenses are available. Ownership, distribution and use of the Trend Report and its contents are subject to the terms set forth in the contract you have entered into with Smith Travel Research. Source 2012 Smith Travel Research, Inc.
76 07/17/2013
C
ore D
istin
ction
Gro
up L
LC

Tab 6 - Day of Week AnalysisSterling, CO Selected Properties
Job Number: 455844_SADIM Staff: SS Created: November 07, 2012
Occupancy (%) Three Year Occupancy (%)
Sun Mon Tue Wed Thu Fri Sat Total Month Sun Mon Tue Wed Thu Fri Sat Total Year
Oct - 11 47.3 80.1 90.4 93.7 77.7 60.3 68.3 73.1 Oct 09 - Sep 10
Nov - 11 36.2 71.0 79.7 76.8 64.4 57.2 54.2 63.8 Oct 10 - Sep 11 53.9 76.8 84.8 82.7 74.2 70.5 68.9 73.1Dec - 11 35.5 65.9 68.1 64.0 51.1 42.3 40.7 51.7 Oct 11 - Sep 12 54.7 81.2 87.3 86.3 75.0 65.9 67.2 73.9
Jan - 12 38.1 61.2 71.1 70.2 58.1 43.2 47.0 55.7 Total 3 Yr 53.2 78.6 84.9 83.8 73.8 68.2 67.8 72.9
Feb - 12 40.3 70.6 77.0 78.7 56.8 53.5 52.3 61.9Mar - 12 50.1 86.9 92.8 86.1 71.6 62.6 61.1 72.3
Apr - 12 49.0 84.2 94.5 90.3 71.9 51.7 57.1 71.0May - 12 58.9 77.6 92.2 92.4 77.3 71.6 72.9 78.5
Jun - 12 71.0 97.9 96.1 98.2 92.7 86.5 88.6 89.9Jul - 12 85.0 96.1 95.1 92.2 93.3 93.8 95.5 92.9
Aug - 12 75.4 98.5 98.3 97.1 93.7 87.5 90.7 91.7Sep - 12 65.8 84.9 94.7 95.8 92.2 77.0 78.0 83.3
Total Year 54.7 81.2 87.3 86.3 75.0 65.9 67.2 73.9
ADR Three Year ADRSun Mon Tue Wed Thu Fri Sat Total Month Sun Mon Tue Wed Thu Fri Sat Total Year
Oct - 11 90.09 89.36 90.67 94.63 88.63 86.23 84.73 89.38 Oct 09 - Sep 10
Nov - 11 84.25 86.50 87.23 87.73 87.60 83.75 84.36 86.31 Oct 10 - Sep 11 85.57 87.38 87.66 88.23 87.77 86.80 87.90 87.42Dec - 11 83.23 88.42 87.62 85.73 82.72 82.17 82.64 84.93 Oct 11 - Sep 12 90.97 92.09 93.06 93.57 92.52 91.63 92.08 92.38
Jan - 12 83.40 86.93 87.55 86.63 85.55 79.43 81.37 85.08 Total 3 Yr 86.68 87.77 88.41 88.84 88.23 87.57 88.42 88.06
Feb - 12 83.25 86.94 86.35 87.12 83.33 82.34 86.19 85.45Mar - 12 84.10 87.54 88.77 87.80 84.45 81.82 83.21 85.59
Apr - 12 88.00 90.02 91.51 90.54 89.13 88.29 87.06 89.53May - 12 89.98 91.96 94.21 95.39 92.59 92.84 93.18 93.20
Jun - 12 96.17 98.84 98.89 101.87 100.96 99.87 101.51 99.90Jul - 12 99.35 96.12 96.13 96.87 100.50 103.76 103.61 99.25
Aug - 12 98.28 99.90 100.82 102.11 103.02 101.34 100.49 101.04Sep - 12 91.04 96.34 102.41 98.47 96.35 92.28 95.16 96.21
Total Year 90.97 92.09 93.06 93.57 92.52 91.63 92.08 92.38
RevPAR Three Year RevPAR
Sun Mon Tue Wed Thu Fri Sat Total Month Sun Mon Tue Wed Thu Fri Sat Total Year
Oct - 11 42.62 71.57 81.92 88.62 68.84 52.03 57.84 65.35 Oct 09 - Sep 10
Nov - 11 30.52 61.38 69.51 67.38 56.38 47.87 45.75 55.07 Oct 10 - Sep 11 46.12 67.14 74.34 72.93 65.13 61.22 60.56 63.93Dec - 11 29.53 58.23 59.67 54.85 42.24 34.76 33.67 43.95 Oct 11 - Sep 12 49.75 74.77 81.24 80.77 69.38 60.43 61.92 68.25
Jan - 12 31.79 53.17 62.22 60.84 49.68 34.33 38.22 47.36 Total 3 Yr 46.12 68.98 75.07 74.42 65.14 59.71 59.96 64.18
Feb - 12 33.53 61.36 66.48 68.55 47.34 44.02 45.05 52.89Mar - 12 42.11 76.04 82.37 75.60 60.46 51.26 50.83 61.85
Apr - 12 43.14 75.82 86.52 81.79 64.12 45.68 49.69 63.53May - 12 52.96 71.38 86.85 88.16 71.62 66.49 67.92 73.16
Jun - 12 68.32 96.72 94.99 100.00 93.64 86.34 89.90 89.86Jul - 12 84.49 92.37 91.45 89.31 93.78 97.30 98.95 92.22
Aug - 12 74.15 98.44 99.13 99.19 96.54 88.64 91.19 92.69Sep - 12 59.93 81.80 97.03 94.33 88.83 71.08 74.24 80.11
Total Year 49.75 74.77 81.24 80.77 69.38 60.43 61.92 68.25
Smith Travel Research’s Trend Report is a publication of Smith Travel Research and is intended solely for use by paid subscribers. Reproduction or distribution of the Trend Report, in whole or part, without written permission of Smith Travel Research is prohibited and
subject to legal action. Site licenses are available. Ownership, distribution and use of the Trend Report and its contents are subject to the terms set forth in the contract you have entered into with Smith Travel Research. Source 2012 Smith Travel Research, Inc.
77 07/17/2013
C
ore D
istin
ction
Gro
up L
LC

Tab 7 - Raw Data
Sterling, CO Selected PropertiesJob Number: 455844_SADIM Staff: SS Created: November 07, 2012
Date Occupancy ADR RevPar Supply Demand Revenue Census & Sample %
This
Year % Chg
This
Year % Chg
This
Year % Chg This Year % Chg This Year % Chg This Year % Chg Census Props Census Rooms
% Rooms STAR
Participants
Jan 06 58.6 68.85 40.31 8,029 4,701 323,682 4 100.0
Feb 06 50.7 67.26 34.08 7,252 3,675 247,183 4 259 100.0
Mar 06 53.2 70.53 37.51 8,029 4,270 301,146 4 259 100.0
Apr 06 57.4 72.21 41.42 7,770 4,457 321,837 4 259 100.0
May 06 68.2 75.35 51.40 8,029 5,477 412,667 4 259 100.0
Jun 06 84.2 79.51 66.95 7,770 6,543 520,236 4 259 100.0
Jul 06 87.5 82.14 71.89 8,029 7,027 577,196 4 259 100.0
Aug 06 82.2 82.04 67.40 8,029 6,596 541,153 4 259 100.0
Sep 06 71.7 77.17 55.30 7,770 5,568 429,703 4 259 100.0
Oct 06 67.3 74.25 49.96 8,029 5,402 401,092 4 259 100.0
Nov 06 59.0 71.94 42.46 7,770 4,586 329,900 4 259 100.0
Dec 06 50.8 72.97 37.05 8,029 4,077 297,497 4 259 100.0
Jan 07 60.2 2.8 73.46 6.7 44.22 9.7 8,029 0.0 4,833 2.8 355,035 9.7 4 259 100.0
Feb 07 61.9 22.2 74.70 11.1 46.26 35.7 7,252 0.0 4,491 22.2 335,482 35.7 4 259 100.0
Mar 07 62.2 17.0 75.60 7.2 47.06 25.5 8,029 0.0 4,998 17.0 377,860 25.5 4 259 100.0
Apr 07 65.4 14.0 75.81 5.0 49.57 19.7 7,770 0.0 5,080 14.0 385,124 19.7 4 259 100.0
May 07 72.6 6.5 82.95 10.1 60.25 17.2 8,029 0.0 5,832 6.5 483,775 17.2 4 259 100.0
Jun 07 89.2 6.0 86.26 8.5 76.97 15.0 7,770 0.0 6,933 6.0 598,042 15.0 4 259 100.0
Jul 07 87.9 0.4 88.92 8.3 78.17 8.7 8,029 0.0 7,058 0.4 627,603 8.7 4 259 100.0
Aug 07 88.9 8.2 85.85 4.6 76.28 13.2 8,029 0.0 7,134 8.2 612,482 13.2 4 259 100.0
Sep 07 70.6 -1.4 84.77 9.8 59.88 8.3 7,770 0.0 5,489 -1.4 465,281 8.3 4 259 100.0
Oct 07 71.0 5.6 80.75 8.8 57.35 14.8 8,029 0.0 5,702 5.6 460,456 14.8 4 259 100.0
Nov 07 58.7 -0.6 79.60 10.7 46.70 10.0 7,770 0.0 4,559 -0.6 362,895 10.0 4 259 100.0
Dec 07 51.0 0.5 77.86 6.7 39.72 7.2 8,029 0.0 4,096 0.5 318,907 7.2 4 259 100.0
Jan 08 53.4 -11.4 79.70 8.5 42.52 -3.8 8,029 0.0 4,284 -11.4 341,416 -3.8 4 259 100.0
Feb 08 53.1 -14.3 79.65 6.6 42.28 -8.6 7,252 0.0 3,850 -14.3 306,647 -8.6 4 259 100.0
Mar 08 56.5 -9.2 79.98 5.8 45.21 -3.9 8,029 0.0 4,539 -9.2 363,017 -3.9 4 259 100.0
Apr 08 65.0 -0.6 79.53 4.9 51.69 4.3 7,770 0.0 5,050 -0.6 401,605 4.3 4 259 100.0
May 08 70.4 -3.1 83.76 1.0 58.97 -2.1 8,029 0.0 5,652 -3.1 473,436 -2.1 4 259 100.0
Jun 08 81.6 -8.6 90.14 4.5 73.52 -4.5 7,770 0.0 6,337 -8.6 571,231 -4.5 4 259 100.0
Jul 08 82.8 -5.8 90.77 2.1 75.20 -3.8 8,029 0.0 6,652 -5.8 603,818 -3.8 4 259 100.0
Aug 08 79.5 -10.6 89.52 4.3 71.14 -6.7 8,029 0.0 6,381 -10.6 571,200 -6.7 4 259 100.0
Sep 08 73.2 3.6 83.46 -1.5 61.06 2.0 7,770 0.0 5,685 3.6 474,458 2.0 4 259 100.0
Oct 08 72.0 1.4 79.80 -1.2 57.45 0.2 8,029 0.0 5,780 1.4 461,256 0.2 4 259 100.0
Nov 08 57.3 -2.3 78.38 -1.5 44.92 -3.8 7,770 0.0 4,453 -2.3 349,021 -3.8 4 259 100.0
Dec 08 46.8 -8.3 76.62 -1.6 35.86 -9.7 8,029 0.0 3,758 -8.3 287,940 -9.7 4 259 100.0
Jan 09 47.1 -11.7 79.25 -0.6 37.35 -12.2 8,029 0.0 3,784 -11.7 299,880 -12.2 4 259 100.0
Feb 09 56.3 6.0 79.57 -0.1 44.79 5.9 7,252 0.0 4,082 6.0 324,820 5.9 4 259 100.0
Mar 09 59.0 4.3 80.79 1.0 47.66 5.4 8,029 0.0 4,736 4.3 382,627 5.4 4 259 100.0
Apr 09 68.6 5.5 80.60 1.4 55.26 6.9 7,770 0.0 5,327 5.5 429,366 6.9 4 259 100.0
May 09 77.4 9.9 81.40 -2.8 62.97 6.8 8,029 0.0 6,211 9.9 505,596 6.8 4 259 100.0
Jun 09 91.1 11.7 84.50 -6.3 76.96 4.7 7,770 0.0 7,077 11.7 598,006 4.7 4 259 100.0
Jul 09 89.5 8.0 86.51 -4.7 77.39 2.9 8,029 0.0 7,182 8.0 621,342 2.9 4 259 100.0
Aug 09 80.0 0.7 87.17 -2.6 69.75 -2.0 8,029 0.0 6,425 0.7 560,047 -2.0 4 259 100.0
Sep 09 77.7 6.3 80.78 -3.2 62.81 2.9 7,770 0.0 6,041 6.3 488,008 2.9 4 259 100.0
Oct 09 77.5 7.7 78.18 -2.0 60.61 5.5 8,029 0.0 6,225 7.7 486,646 5.5 4 259 100.0
Nov 09 61.6 7.5 78.66 0.4 48.45 7.9 7,770 0.0 4,786 7.5 376,476 7.9 4 259 100.0
Dec 09 51.7 10.5 75.89 -0.9 39.27 9.5 8,029 0.0 4,154 10.5 315,262 9.5 4 259 100.0
Jan 10 56.7 20.2 77.02 -2.8 43.64 16.8 8,029 0.0 4,549 20.2 350,371 16.8 4 259 100.0
Feb 10 57.4 2.0 78.28 -1.6 44.94 0.3 7,252 0.0 4,164 2.0 325,938 0.3 4 259 100.0
Mar 10 65.7 11.4 80.65 -0.2 52.99 11.2 8,029 0.0 5,275 11.4 425,430 11.2 4 259 100.0
Apr 10 70.5 2.8 80.43 -0.2 56.66 2.5 7,770 0.0 5,474 2.8 440,262 2.5 4 259 100.0
May 10 72.6 -6.1 83.41 2.5 60.57 -3.8 8,029 0.0 5,830 -6.1 486,295 -3.8 4 259 100.0
Jun 10 87.0 -4.5 87.66 3.7 76.28 -0.9 7,770 0.0 6,761 -4.5 592,659 -0.9 4 259 100.0
Jul 10 88.8 -0.8 90.39 4.5 80.23 3.7 8,029 0.0 7,126 -0.8 644,144 3.7 4 259 100.0
Aug 10 87.2 9.0 88.13 1.1 76.89 10.2 8,029 0.0 7,005 9.0 617,348 10.2 4 259 100.0
Sep 10 78.2 0.6 88.18 9.2 68.94 9.8 7,770 0.0 6,075 0.6 535,696 9.8 4 259 100.0
Oct 10 70.4 -9.1 83.76 7.1 59.00 -2.7 8,029 0.0 5,656 -9.1 473,742 -2.7 4 259 100.0
Nov 10 67.9 10.3 81.26 3.3 55.19 13.9 7,770 0.0 5,277 10.3 428,798 13.9 4 259 100.0
Dec 10 55.7 7.7 79.17 4.3 44.11 12.3 8,029 0.0 4,473 7.7 354,121 12.3 4 259 100.0
Jan 11 57.3 1.1 80.86 5.0 46.32 6.2 8,029 0.0 4,600 1.1 371,937 6.2 4 259 100.0
Feb 11 61.7 7.5 80.08 2.3 49.45 10.0 7,252 0.0 4,478 7.5 358,580 10.0 4 259 100.0
Mar 11 68.9 4.8 80.16 -0.6 55.19 4.2 8,029 0.0 5,528 4.8 443,102 4.2 4 259 100.0
Apr 11 65.4 -7.1 82.90 3.1 54.25 -4.2 7,770 0.0 5,085 -7.1 421,553 -4.2 4 259 100.0
May 11 77.0 6.0 86.26 3.4 66.41 9.6 8,029 0.0 6,181 6.0 533,203 9.6 4 259 100.0
Jun 11 88.9 2.2 94.52 7.8 84.07 10.2 7,770 0.0 6,911 2.2 653,200 10.2 4 259 100.0
Jul 11 91.2 2.7 95.51 5.7 87.08 8.5 8,029 0.0 7,321 2.7 699,197 8.5 4 259 100.0
Aug 11 86.5 -0.8 96.76 9.8 83.71 8.9 10,323 28.6 8,931 27.5 864,132 40.0 5 333 77.8
Sep 11 80.0 2.4 91.38 3.6 73.13 6.1 9,990 28.6 7,995 31.6 730,564 36.4 5 333 100.0
Oct 11 73.1 3.8 89.38 6.7 65.35 10.8 10,323 28.6 7,547 33.4 674,587 42.4 5 333 100.0
Nov 11 63.8 -6.1 86.31 6.2 55.07 -0.2 9,990 28.6 6,374 20.8 550,111 28.3 5 333 100.0
Dec 11 51.7 -7.1 84.93 7.3 43.95 -0.4 10,323 28.6 5,342 19.4 453,693 28.1 5 333 100.0
Jan 12 55.7 -2.8 85.08 5.2 47.36 2.2 10,323 28.6 5,747 24.9 488,930 31.5 5 333 100.0
Feb 12 61.9 0.2 85.45 6.7 52.89 7.0 9,324 28.6 5,771 28.9 493,156 37.5 5 333 100.0
Mar 12 72.3 4.9 85.59 6.8 61.85 12.1 10,323 28.6 7,459 34.9 638,427 44.1 5 333 100.0
Apr 12 71.0 8.4 89.53 8.0 63.53 17.1 9,990 28.6 7,089 39.4 634,710 50.6 5 333 100.0
May 12 78.5 2.0 93.20 8.0 73.16 10.2 10,323 28.6 8,104 31.1 755,280 41.6 5 333 100.0
Jun 12 89.9 1.1 99.90 5.7 89.86 6.9 9,990 28.6 8,986 30.0 897,719 37.4 5 333 100.0
Jul 12 92.9 1.9 99.25 3.9 92.22 5.9 10,323 28.6 9,592 31.0 952,013 36.2 5 333 100.0
Aug 12 91.7 6.0 101.04 4.4 92.69 10.7 10,323 0.0 9,470 6.0 956,880 10.7 5 333 100.0
Sep 12 83.3 4.0 96.21 5.3 80.11 9.5 9,990 0.0 8,318 4.0 800,250 9.5 5 333 100.0
Smith Travel Research’s Trend Report is a publication of Smith Travel Research and is intended solely for use by paid subscribers. Reproduction or distribution of the Trend Report, in whole or part, without
written permission of Smith Travel Research is prohibited and subject to legal action. Site licenses are available. Ownership, distribution and use of the Trend Report and its contents are subject to the
terms set forth in the contract you have entered into with Smith Travel Research. Source 2012 Smith Travel Research, Inc.
78 07/17/2013
C
ore D
istin
ction
Gro
up L
LC

Tab 8 - Classic
Sterling, CO Selected PropertiesJob Number: 455844_SADIM Staff: SS Created: November 07, 2012
Date Occupancy ADR RevPar Supply Demand Revenue Census & Sample %
This
Year % Chg
This
Year % Chg
This
Year % Chg This Year % Chg This Year % Chg This Year % Chg Census Props Census Rooms
% Rooms STAR
Participants
Jan 06 58.6 68.85 40.31 8,029 4,701 323,682 4 100.0
Feb 06 50.7 67.26 34.08 7,252 3,675 247,183 4 259 100.0
Mar 06 53.2 70.53 37.51 8,029 4,270 301,146 4 259 100.0
Apr 06 57.4 72.21 41.42 7,770 4,457 321,837 4 259 100.0
May 06 68.2 75.35 51.40 8,029 5,477 412,667 4 259 100.0
Jun 06 84.2 79.51 66.95 7,770 6,543 520,236 4 259 100.0
Jul 06 87.5 82.14 71.89 8,029 7,027 577,196 4 259 100.0
Aug 06 82.2 82.04 67.40 8,029 6,596 541,153 4 259 100.0
Sep 06 71.7 77.17 55.30 7,770 5,568 429,703 4 259 100.0
Oct 06 67.3 74.25 49.96 8,029 5,402 401,092 4 259 100.0
Nov 06 59.0 71.94 42.46 7,770 4,586 329,900 4 259 100.0
Dec 06 50.8 72.97 37.05 8,029 4,077 297,497 4 259 100.0
Sep YTD 2006 68.3 76.06 51.97 70,707 48,314 3,674,803
Total 2006 66.0 75.40 49.75 94,535 62,379 4,703,292
Jan 07 60.2 2.8 73.46 6.7 44.22 9.7 8,029 0.0 4,833 2.8 355,035 9.7 4 259 100.0
Feb 07 61.9 22.2 74.70 11.1 46.26 35.7 7,252 0.0 4,491 22.2 335,482 35.7 4 259 100.0
Mar 07 62.2 17.0 75.60 7.2 47.06 25.5 8,029 0.0 4,998 17.0 377,860 25.5 4 259 100.0
Apr 07 65.4 14.0 75.81 5.0 49.57 19.7 7,770 0.0 5,080 14.0 385,124 19.7 4 259 100.0
May 07 72.6 6.5 82.95 10.1 60.25 17.2 8,029 0.0 5,832 6.5 483,775 17.2 4 259 100.0
Jun 07 89.2 6.0 86.26 8.5 76.97 15.0 7,770 0.0 6,933 6.0 598,042 15.0 4 259 100.0
Jul 07 87.9 0.4 88.92 8.3 78.17 8.7 8,029 0.0 7,058 0.4 627,603 8.7 4 259 100.0
Aug 07 88.9 8.2 85.85 4.6 76.28 13.2 8,029 0.0 7,134 8.2 612,482 13.2 4 259 100.0
Sep 07 70.6 -1.4 84.77 9.8 59.88 8.3 7,770 0.0 5,489 -1.4 465,281 8.3 4 259 100.0
Oct 07 71.0 5.6 80.75 8.8 57.35 14.8 8,029 0.0 5,702 5.6 460,456 14.8 4 259 100.0
Nov 07 58.7 -0.6 79.60 10.7 46.70 10.0 7,770 0.0 4,559 -0.6 362,895 10.0 4 259 100.0
Dec 07 51.0 0.5 77.86 6.7 39.72 7.2 8,029 0.0 4,096 0.5 318,907 7.2 4 259 100.0
Sep YTD 2007 73.3 7.3 81.79 7.5 59.98 15.4 70,707 0.0 51,848 7.3 4,240,684 15.4
Total 2007 70.0 6.1 81.31 7.8 56.94 14.5 94,535 0.0 66,205 6.1 5,382,942 14.5
Jan 08 53.4 -11.4 79.70 8.5 42.52 -3.8 8,029 0.0 4,284 -11.4 341,416 -3.8 4 259 100.0
Feb 08 53.1 -14.3 79.65 6.6 42.28 -8.6 7,252 0.0 3,850 -14.3 306,647 -8.6 4 259 100.0
Mar 08 56.5 -9.2 79.98 5.8 45.21 -3.9 8,029 0.0 4,539 -9.2 363,017 -3.9 4 259 100.0
Apr 08 65.0 -0.6 79.53 4.9 51.69 4.3 7,770 0.0 5,050 -0.6 401,605 4.3 4 259 100.0
May 08 70.4 -3.1 83.76 1.0 58.97 -2.1 8,029 0.0 5,652 -3.1 473,436 -2.1 4 259 100.0
Jun 08 81.6 -8.6 90.14 4.5 73.52 -4.5 7,770 0.0 6,337 -8.6 571,231 -4.5 4 259 100.0
Jul 08 82.8 -5.8 90.77 2.1 75.20 -3.8 8,029 0.0 6,652 -5.8 603,818 -3.8 4 259 100.0
Aug 08 79.5 -10.6 89.52 4.3 71.14 -6.7 8,029 0.0 6,381 -10.6 571,200 -6.7 4 259 100.0
Sep 08 73.2 3.6 83.46 -1.5 61.06 2.0 7,770 0.0 5,685 3.6 474,458 2.0 4 259 100.0
Oct 08 72.0 1.4 79.80 -1.2 57.45 0.2 8,029 0.0 5,780 1.4 461,256 0.2 4 259 100.0
Nov 08 57.3 -2.3 78.38 -1.5 44.92 -3.8 7,770 0.0 4,453 -2.3 349,021 -3.8 4 259 100.0
Dec 08 46.8 -8.3 76.62 -1.6 35.86 -9.7 8,029 0.0 3,758 -8.3 287,940 -9.7 4 259 100.0
Sep YTD 2008 68.5 -6.6 84.80 3.7 58.08 -3.2 70,707 0.0 48,430 -6.6 4,106,828 -3.2
Total 2008 66.0 -5.7 83.39 2.6 55.06 -3.3 94,535 0.0 62,421 -5.7 5,205,045 -3.3
Jan 09 47.1 -11.7 79.25 -0.6 37.35 -12.2 8,029 0.0 3,784 -11.7 299,880 -12.2 4 259 100.0
Feb 09 56.3 6.0 79.57 -0.1 44.79 5.9 7,252 0.0 4,082 6.0 324,820 5.9 4 259 100.0
Mar 09 59.0 4.3 80.79 1.0 47.66 5.4 8,029 0.0 4,736 4.3 382,627 5.4 4 259 100.0
Apr 09 68.6 5.5 80.60 1.4 55.26 6.9 7,770 0.0 5,327 5.5 429,366 6.9 4 259 100.0
May 09 77.4 9.9 81.40 -2.8 62.97 6.8 8,029 0.0 6,211 9.9 505,596 6.8 4 259 100.0
Jun 09 91.1 11.7 84.50 -6.3 76.96 4.7 7,770 0.0 7,077 11.7 598,006 4.7 4 259 100.0
Jul 09 89.5 8.0 86.51 -4.7 77.39 2.9 8,029 0.0 7,182 8.0 621,342 2.9 4 259 100.0
Aug 09 80.0 0.7 87.17 -2.6 69.75 -2.0 8,029 0.0 6,425 0.7 560,047 -2.0 4 259 100.0
Sep 09 77.7 6.3 80.78 -3.2 62.81 2.9 7,770 0.0 6,041 6.3 488,008 2.9 4 259 100.0
Oct 09 77.5 7.7 78.18 -2.0 60.61 5.5 8,029 0.0 6,225 7.7 486,646 5.5 4 259 100.0
Nov 09 61.6 7.5 78.66 0.4 48.45 7.9 7,770 0.0 4,786 7.5 376,476 7.9 4 259 100.0
Dec 09 51.7 10.5 75.89 -0.9 39.27 9.5 8,029 0.0 4,154 10.5 315,262 9.5 4 259 100.0
Sep YTD 2009 71.9 5.0 82.76 -2.4 59.54 2.5 70,707 0.0 50,865 5.0 4,209,692 2.5
Total 2009 69.8 5.8 81.60 -2.1 57.00 3.5 94,535 0.0 66,030 5.8 5,388,076 3.5
Jan 10 56.7 20.2 77.02 -2.8 43.64 16.8 8,029 0.0 4,549 20.2 350,371 16.8 4 259 100.0
Feb 10 57.4 2.0 78.28 -1.6 44.94 0.3 7,252 0.0 4,164 2.0 325,938 0.3 4 259 100.0
Mar 10 65.7 11.4 80.65 -0.2 52.99 11.2 8,029 0.0 5,275 11.4 425,430 11.2 4 259 100.0
Apr 10 70.5 2.8 80.43 -0.2 56.66 2.5 7,770 0.0 5,474 2.8 440,262 2.5 4 259 100.0
May 10 72.6 -6.1 83.41 2.5 60.57 -3.8 8,029 0.0 5,830 -6.1 486,295 -3.8 4 259 100.0
Jun 10 87.0 -4.5 87.66 3.7 76.28 -0.9 7,770 0.0 6,761 -4.5 592,659 -0.9 4 259 100.0
Jul 10 88.8 -0.8 90.39 4.5 80.23 3.7 8,029 0.0 7,126 -0.8 644,144 3.7 4 259 100.0
Aug 10 87.2 9.0 88.13 1.1 76.89 10.2 8,029 0.0 7,005 9.0 617,348 10.2 4 259 100.0
Sep 10 78.2 0.6 88.18 9.2 68.94 9.8 7,770 0.0 6,075 0.6 535,696 9.8 4 259 100.0
Oct 10 70.4 -9.1 83.76 7.1 59.00 -2.7 8,029 0.0 5,656 -9.1 473,742 -2.7 4 259 100.0
Nov 10 67.9 10.3 81.26 3.3 55.19 13.9 7,770 0.0 5,277 10.3 428,798 13.9 4 259 100.0
Dec 10 55.7 7.7 79.17 4.3 44.11 12.3 8,029 0.0 4,473 7.7 354,121 12.3 4 259 100.0
Sep YTD 2010 73.9 2.7 84.54 2.2 62.49 5.0 70,707 0.0 52,259 2.7 4,418,143 5.0
Total 2010 71.6 2.5 83.87 2.8 60.03 5.3 94,535 0.0 67,665 2.5 5,674,804 5.3
Jan 11 57.3 1.1 80.86 5.0 46.32 6.2 8,029 0.0 4,600 1.1 371,937 6.2 4 259 100.0
Feb 11 61.7 7.5 80.08 2.3 49.45 10.0 7,252 0.0 4,478 7.5 358,580 10.0 4 259 100.0
Mar 11 68.9 4.8 80.16 -0.6 55.19 4.2 8,029 0.0 5,528 4.8 443,102 4.2 4 259 100.0
Apr 11 65.4 -7.1 82.90 3.1 54.25 -4.2 7,770 0.0 5,085 -7.1 421,553 -4.2 4 259 100.0
May 11 77.0 6.0 86.26 3.4 66.41 9.6 8,029 0.0 6,181 6.0 533,203 9.6 4 259 100.0
Jun 11 88.9 2.2 94.52 7.8 84.07 10.2 7,770 0.0 6,911 2.2 653,200 10.2 4 259 100.0
Jul 11 91.2 2.7 95.51 5.7 87.08 8.5 8,029 0.0 7,321 2.7 699,197 8.5 4 259 100.0
Aug 11 86.5 -0.8 96.76 9.8 83.71 8.9 10,323 28.6 8,931 27.5 864,132 40.0 5 333 77.8
Sep 11 80.0 2.4 91.38 3.6 73.13 6.1 9,990 28.6 7,995 31.6 730,564 36.4 5 333 100.0
Oct 11 73.1 3.8 89.38 6.7 65.35 10.8 10,323 28.6 7,547 33.4 674,587 42.4 5 333 100.0
Nov 11 63.8 -6.1 86.31 6.2 55.07 -0.2 9,990 28.6 6,374 20.8 550,111 28.3 5 333 100.0
Dec 11 51.7 -7.1 84.93 7.3 43.95 -0.4 10,323 28.6 5,342 19.4 453,693 28.1 5 333 100.0
Sep YTD 2011 75.8 2.6 89.00 5.3 67.47 8.0 75,221 6.4 57,030 9.1 5,075,468 14.9
Total 2011 72.1 0.7 88.53 5.6 63.80 6.3 105,857 12.0 76,293 12.8 6,753,859 19.0
Jan 12 55.7 -2.8 85.08 5.2 47.36 2.2 10,323 28.6 5,747 24.9 488,930 31.5 5 333 100.0
Feb 12 61.9 0.2 85.45 6.7 52.89 7.0 9,324 28.6 5,771 28.9 493,156 37.5 5 333 100.0
Mar 12 72.3 4.9 85.59 6.8 61.85 12.1 10,323 28.6 7,459 34.9 638,427 44.1 5 333 100.0
Apr 12 71.0 8.4 89.53 8.0 63.53 17.1 9,990 28.6 7,089 39.4 634,710 50.6 5 333 100.0
May 12 78.5 2.0 93.20 8.0 73.16 10.2 10,323 28.6 8,104 31.1 755,280 41.6 5 333 100.0
Jun 12 89.9 1.1 99.90 5.7 89.86 6.9 9,990 28.6 8,986 30.0 897,719 37.4 5 333 100.0
Jul 12 92.9 1.9 99.25 3.9 92.22 5.9 10,323 28.6 9,592 31.0 952,013 36.2 5 333 100.0
Aug 12 91.7 6.0 101.04 4.4 92.69 10.7 10,323 0.0 9,470 6.0 956,880 10.7 5 333 100.0
Sep 12 83.3 4.0 96.21 5.3 80.11 9.5 9,990 0.0 8,318 4.0 800,250 9.5 5 333 100.0
Sep YTD 2012 77.6 2.3 93.82 5.4 72.79 7.9 90,909 20.9 70,536 23.7 6,617,365 30.4
Smith Travel Research’s Trend Report is a publication of Smith Travel Research and is intended solely for use by paid subscribers. Reproduction or distribution of the Trend Report, in whole or part, without written
permission of Smith Travel Research is prohibited and subject to legal action. Site licenses are available. Ownership, distribution and use of the Trend Report and its contents are subject to the terms set forth in the
contract you have entered into with Smith Travel Research. Source 2012 Smith Travel Research, Inc.
79 07/17/2013
C
ore D
istin
ction
Gro
up L
LC
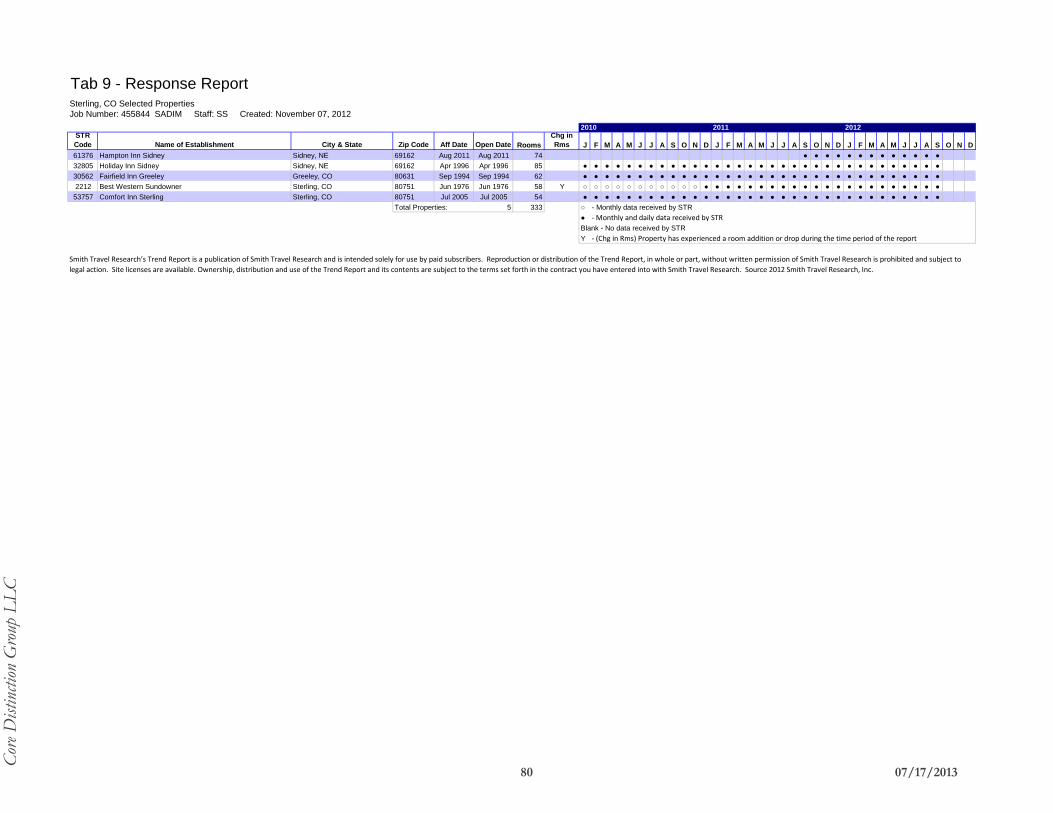
Tab 9 - Response ReportSterling, CO Selected Properties
Job Number: 455844_SADIM Staff: SS Created: November 07, 2012
STR
Code Name of Establishment City & State Zip Code Aff Date Open Date Rooms
Chg in
Rms J F M A M J J A S O N D J F M A M J J A S O N D J F M A M J J A S O N D
61376 Hampton Inn Sidney Sidney, NE 69162 Aug 2011 Aug 2011 74 ● ● ● ● ● ● ● ● ● ● ● ● ●
32805 Holiday Inn Sidney Sidney, NE 69162 Apr 1996 Apr 1996 85 ● ● ● ● ● ● ● ● ● ● ● ● ● ● ● ● ● ● ● ● ● ● ● ● ● ● ● ● ● ● ● ● ●
30562 Fairfield Inn Greeley Greeley, CO 80631 Sep 1994 Sep 1994 62 ● ● ● ● ● ● ● ● ● ● ● ● ● ● ● ● ● ● ● ● ● ● ● ● ● ● ● ● ● ● ● ● ●
2212 Best Western Sundowner Sterling, CO 80751 Jun 1976 Jun 1976 58 Y ○ ○ ○ ○ ○ ○ ○ ○ ○ ○ ○ ● ● ● ● ● ● ● ● ● ● ● ● ● ● ● ● ● ● ● ● ● ●
53757 Comfort Inn Sterling Sterling, CO 80751 Jul 2005 Jul 2005 54 ● ● ● ● ● ● ● ● ● ● ● ● ● ● ● ● ● ● ● ● ● ● ● ● ● ● ● ● ● ● ● ● ●
Total Properties: 5 333 ○ - Monthly data received by STR
● - Monthly and daily data received by STR
Blank - No data received by STR
Y - (Chg in Rms) Property has experienced a room addition or drop during the time period of the report
Smith Travel Research’s Trend Report is a publication of Smith Travel Research and is intended solely for use by paid subscribers. Reproduction or distribution of the Trend Report, in whole or part, without written permission of Smith Travel Research is prohibited and subject to
legal action. Site licenses are available. Ownership, distribution and use of the Trend Report and its contents are subject to the terms set forth in the contract you have entered into with Smith Travel Research. Source 2012 Smith Travel Research, Inc.
2010 2011 2012
80 07/17/2013
C
ore D
istin
ction
Gro
up L
LC

Property RecommendationsProperty Type
Property Size
Rate Strategy
Property Features, Amenities, and Services
Conclusion
* Adequate parking for recreational vehicles should be allotted to accommodate area economic drivers.
The Property Type recommended for the proposed hotel is an upper economy, limited-service hotel. This
would reflect the research performed in the Community Overview Market Study. Also, this type of hotel
would allow the property to be positioned properly at the subject site and would best match the
demographics of the competitive set and future Lodging Demand market in the area. It is anticipated that
a new, upper-economy branded hotel would capture displaced Lodging Demand currently staying in
markets surrounding Sterling, CO. Additionally, the newness of the hotel should be well received in the
marketplace. It's location will be positive to serve Sterling and regional markets as this hotel would be the
only hotel on the west end of town. This type of hotel would also be capable of adjusting rates to best fit
the demand in the market and the seasonality of the area.
The property size of this upper economy hotel was researched to be 40-45 rooms in this preliminary
market study. This is the size of the potential Cobblestone Inn being considered. This would position it to
be slightly smaller than the 60 average room size of the competitive set. The smaller size would assist the
property in achieving the Occupancy projections listed in this report. It is not advisable to over-build in
this market at this time. Expansion of the hotel in future years could be considered as the market's
Lodging Demand grows. Adjusting the room count will motify Occupancy Performance. Demand
currently in this market is average to high/showing growth and the opportunity for more guestrooms is a
viable option for addition in the future.
As previously stated, the subject hotel's preliminary suggested rate positioning would give it a 120% yield
to the Overall/Statistical competitive set. It is estimated that a new hotel product could generate a rate
premium higher than the established rate yield to the market because it will be the newest property in the
area and it will offer a higher level of services and amenities than the economy priced properties in the
immediate area.
The Product Features of the hotel should satisfy the market it is attempting to attract. Standard features
and amenities required by the franchise/brand chosen for the proposed hotel should include. Some special
features may be required to attract identified target markets. At this time, these may include the following
amenities.
* A minimum of 10% of the guestrooms should be able to accommodate full kitchen set ups potential of base or
long term stay business in this market.
* Fitness Center and Guest Laundry Facilities more a great need for long term stay guests and market economic
demand generators.
* Pool/spa should be considered to accommodate leisure market as well as potential group business driven by the
schools, college, as well as the golf course packaging.
81 07/17/2013
C
ore D
istin
ction
Gro
up L
LC

Sleeping Room Configuration
Brand Affiliation
Opening Date
The recommendation Sleeping Room Configuration should be compatible with the overall Market
Segmentation of the area. Since 60% of the properties demand appears to be corporate and medical
combined the property should offer a selection of King bedded rooms at (40%) with a substantial
percentage of double queen-bedded rooms to serve the social/leisure market segment. It is suggested that
some suites with small kitchen facilities be developed for base long term guests. This type of hotel
accommodation should consist of three to five rooms with up to 10% of the available rooms being general
suite style guestroom accommodations.
Brand Affiliation should be considered for this hotel to enhance it's marketability. The brand should
position the hotel well in this market. It should be competitive with the Market Segments identified for the
hotel. An upper economy brand should be pursued. Potential impact issues should be addressed with
pursuing a brand affiliation although these factors do not seem to be relevant in this market. As
mentioned earlier in this report, there are several a smaller, local independent hotels in the immediate
market yet a brand should be successful in Sterling since this will be the only branded hotel and newest in
the market. Still, a brand with experience in the tursherary Colorado Lodging market is highly advised to
ensure adequate marketing of the proposed property.
The Opening Date for the hotel should be in line with the seasonality of the market. Ideally, opening the
hotel in late spring to capture the maximum revenue months prior to the softer season in mid-fall is
recommended. Recommended Open Date: January 2014.
82 07/17/2013
C
ore D
istin
ction
Gro
up L
LC

41
Total Land including Site Improvements $306,000per room $7,463.41
Land $81,000per room $1,976
Site Utility Improvement Allowance (sewer, water, gas, electric) $225,000per room $5,488
Building Construction $2,097,025per room $51,147
Fixtures, Furnishings, and Equipment $590,000per room $14,390
Indirect Costs $443,500per room $10,817
Appraisal $3,500
Architectural / Engineering $60,000
Cobblestone Membership Fee $20,000
Surveys $5,000
Development Services $100,000
Pre-Opening Expenses $30,000
Working Capital $100,000
Legal and Accounting Fees $5,000
Construction Period Interest / Load Fees / Closing $60,000
Insurance & Taxes During Construction $10,000
Project Contingency $50,000
Total Project Costs: $3,436,525per room $83,818
Requested Loan Amount: $2,086,525 60.7%
Expected Cash Injection: $1,350,000 39.3%
Sources of Funding$2,086,525 Debt Interest: 4.50%
$1,350,000 Debt Terms: 20
$3,436,525 Debt Service: $158,405
Cobblestone Hotel & SuitesSterling, CO
Building Specifications: 41 Unit Cobblestone Hotel & Suites with some extended stay suites, expanded
guest beer & wine bar, standard rooms, hot continental breakfast, pool, exercise room, and guest
Laundry.
Total:Expected Cash Injection
Bank Loan
Number of Units:
83 07/17/2013
C
ore D
istin
ction
Gro
up L
LC

Rooms:41
January February March April May June July August September October November December TOTAL
Lodging Rooms Available 1,271 1,148 1,271 1,230 1,271 1,230 1,271 1,271 1,230 1,271 1,230 1,271 14,965
Lodging Occupancy % 45% 55% 60% 65% 75% 90% 95% 90% 80% 75% 60% 55% 70.5%
Total Occ. Rooms 572 631 763 800 953 1,107 1,207 1,144 984 953 738 699 10,551
Average Daily Rate $85.00 $89.00 $89.00 $94.00 $94.00 $101.00 $105.00 $101.00 $94.00 $89.00 $84.00 $79.00 $93.46
REVENUE:
Guest Rooms 48,616 56,195 67,871 75,153 89,606 111,807 126,782 115,534 92,496 84,839 61,992 55,225 986,116
Telephone / Misc. Revenue 143 158 191 200 238 277 302 286 246 238 185 175 2,638
Meeting Room Revenue (NA) 0 0 0 0 0 0 0 0 0 0 0 0 0
Vending / Bar Revenue 858 947 1,144 1,199 1,430 1,661 1,811 1,716 1,476 1,430 1,107 1,049 15,827
TOTAL HOTEL REVENUE 49,617 57,300 69,206 76,552 91,274 113,744 128,895 117,536 94,218 86,507 63,284 56,448 1,004,580
HOTEL PAYROLL EXPENSE
Hotel Manager 2,917 2,917 2,917 2,917 2,917 2,917 2,917 2,917 2,917 2,917 2,917 2,917 35,000
Housekeeping 2,002 2,210 2,669 2,798 3,336 3,875 4,226 4,004 3,444 3,336 2,583 2,447 36,930
Maintenance 143 158 191 200 238 277 302 286 246 238 185 175 2,638
Front Desk 5,000 5,000 5,000 5,000 5,000 5,000 5,000 5,000 5,000 5,000 5,000 5,000 60,000
Employee Benefits 402 411 431 437 460 483 498 488 464 460 427 422 5,383
Workers Comp Insurance 200 221 267 280 334 387 423 400 344 334 258 245 3,693
Payroll Tax 1,333 1,365 1,434 1,454 1,536 1,617 1,671 1,637 1,552 1,536 1,421 1,401 17,955
TOTAL HOTEL PAYROLL 11,997 12,281 12,909 13,085 13,820 14,555 15,036 14,732 13,967 13,820 12,791 12,605 161,599
HOTEL OPERATING EXPENSE
Cleaning Supplies 200 221 267 280 334 387 423 400 344 334 258 245 3,693
Laundry Supplies 372 410 496 520 620 720 785 744 640 620 480 454 6,858
Linens 486 537 648 680 810 941 1,026 972 836 810 627 594 8,969
Guest Supplies 572 631 763 800 953 1,107 1,207 1,144 984 953 738 699 10,551
Repairs & Maintenance 200 221 267 280 334 387 423 400 344 334 258 245 3,693
Membership Fee 2,000 2,000 2,000 2,000 2,000 2,000 2,000 2,000 2,000 2,000 2,000 2,000 24,000
Property Mgmt. System Expense 300 300 300 300 300 300 300 300 300 300 300 300 3,600
Complimentary Breakfast 1,716 1,894 2,288 2,399 2,860 3,321 3,622 3,432 2,952 2,860 2,214 2,097 31,654
Travel Agent Fees 243 281 339 376 448 559 634 578 462 424 310 276 4,931
Vending / Bar Expense 429 474 572 600 715 830 906 858 738 715 554 524 7,914
Office Supplies 372 410 496 520 620 720 785 744 640 620 480 454 6,858
Marketing / Advertising 715 789 953 999 1,192 1,384 1,509 1,430 1,230 1,192 923 874 13,189
Swimming Pool Expense (NA) 625 625 625 625 625 625 625 625 625 625 625 625 7,500
Utilities 2,729 3,151 3,806 4,210 5,020 6,256 7,089 6,464 5,182 4,758 3,481 3,105 55,252
Telephone 286 316 381 400 477 554 604 572 492 477 369 350 5,276
Cable 350 350 350 350 350 350 350 350 350 350 350 350 4,200
Credit Card Expense 1,144 1,263 1,525 1,599 1,907 2,214 2,415 2,288 1,968 1,907 1,476 1,398 21,103
Management Fee 2,481 2,865 3,460 3,828 4,564 5,687 6,445 5,877 4,711 4,325 3,164 2,822 50,229
Other Expense 400 442 534 560 667 775 845 801 689 667 517 489 7,386
Accounting Services 425 425 425 425 425 425 425 425 425 425 425 425 5,100
Professional Fees 100 100 100 100 100 100 100 100 100 100 100 100 1,200
TOTAL OPERATING EXPENSES 16,145 17,706 20,595 21,848 25,318 29,642 32,518 30,503 26,013 24,794 19,648 18,427 283,155
INCOME BEFORE
FIXED EXPENSES 21,475 27,312 35,702 41,619 52,135 69,547 81,342 72,301 54,238 47,893 30,845 25,417 559,827
RESERVES & FIXED EXPENSES
Debt Service 13,200 13,200 13,200 13,200 13,200 13,200 13,200 13,200 13,200 13,200 13,200 13,200 158,405
Real Estate Taxes 417 417 417 417 417 417 417 417 417 417 417 417 5,000
Insurance 620 716 865 957 1,141 1,422 1,611 1,469 1,178 1,081 791 706 12,557
Reserves For Replacement (NA) 0 0 0 0 0 0 0 0 0 0 0 0 0
TOTAL RESERVES & FIXED 14,237 14,333 14,482 14,574 14,758 15,039 15,228 15,086 14,795 14,698 14,408 14,323 175,962
CASH FLOW BEFORE DEBT 20,438 26,179 34,420 40,246 50,577 67,709 79,314 70,415 52,644 46,395 29,637 24,294 542,269
CASH FLOW AFTER DEBT $7,237 $12,979 $21,220 $27,045 $37,377 $54,508 $66,114 $57,215 $39,443 $33,195 $16,437 $11,094 383,864
YEAR 1 YEAR 2 YEAR 3 YEAR 4 YEAR 5AMOUNT AMOUNT AMOUNT AMOUNT AMOUNT
Lodging Rooms Available 14,965 14,965 14,965 14,965 14,965
Lodging Occupancy % 70.5% 75.5% 77.5% 79.5% 80.0%
Total Occ. Rooms 10,551 11,300 11,599 11,898 11,973
Average Daily Rate 93.46 96.26 99.15 102.12 104.68
REVENUE:
Guest Rooms 986,116 98.2% 1,087,727 98.2% 1,150,035 98.3% 1,215,102 98.3% 1,253,312 98.4%
Telephone / Misc. Revenue 2,638 0.3% 2,825 0.3% 2,900 0.2% 2,975 0.2% 2,993 0.2%
Meeting Room Revenue 0 0.0% 0 0.0% 0 0.0% 0 0.0% 0 0.0%
Vending / Bar Revenue 15,827 1.6% 16,949 1.5% 17,398 1.5% 17,847 1.4% 17,960 1.4%
======= ======= ======= ======= =======
TOTAL HOTEL REVENUE 1,004,580 100.0 1,107,502 100.0 1,170,333 100.0 1,235,924 100.0 1,274,265 100.0
Hotel Expenses
Five Year Numbers Projected Summary
Numbers projected and compared to similar markets for a hotel with the following rooms:
NOTE: The above information is a forwards looking projection of anticipated expenses and profits with regard to this project based on the professional experience of Core Distinction Group LLC (CDG) participation in other projects, similar in nature. Occupancy and ADR projections derived
from market data trends reported by Smith Travel Research (STR) in the market's proximity along with to date rate shopping of local and surrounding hotels. This projection could change due to changes in the economy, both locally and overall, the acceptance of the project by the local community
and patrons and the fact that CDG has not been involved in a project in this area and in a municipality with these demographics in the past. Thereby, all investors understand and acknowledge that these forward looking projections are not warranted by CDG and are subject to change and
fluctuation.
84 07/17/2013
C
ore D
istin
ction
Gro
up L
LC

Year 1 % Year 2 % Year 3 % Year 4 % Year 5 %Lodging Rooms Available 14,965 14,965 14,965 14,965 14,965
Lodging Occupancy % 70.5% 70.5% 75.5% 75.5% 77.5% 77.5% 79.5% 79.5% 80.0% 80.0%
Total Occ. Rooms 10,551 11,300 11,599 11,898 11,973
Average Daily Rate $93.46 $96.26 $99.15 $102.12 $104.68
REVENUE: Guest Rooms 986,116 98.16% 1,087,727 98.21% 1,150,035 98.27% 1,215,102 98.32% 1,253,312 98.36%
Telephone / Misc Revenue 2,638 0.26% 2,825 0.26% 2,900 0.25% 2,975 0.24% 2,993 0.23%
Meeting Space 0.00% 0.00% 0.00% 0.00% 0.00%
Vending / Bar Revenue 15,827 1.58% 16,949 1.53% 17,398 1.49% 17,847 1.44% 17,960 1.41%
TOTAL HOTEL REVENUE 1,004,580 100% 1,107,502 100% 1,170,333 100% 1,235,924 100% 1,274,265 100%
HOTEL PAYROLL EXPENSE Hotel Manager 35,000 3.48% 36,750 3.32% 38,588 3.30% 40,517 3.28% 42,543 3.34%
Housekeeping 36,930 3.68% 39,549 3.57% 40,596 3.47% 41,644 3.37% 41,906 3.29%
Maintenance 2,638 0.26% 2,825 0.26% 2,900 0.25% 2,975 0.24% 2,993 0.23%
Front Desk 60,000 5.97% 61,800 5.58% 63,654 5.44% 65,564 5.30% 67,531 5.30%
Employee Benefits 5,383 0.54% 5,637 0.51% 5,829 0.50% 6,028 0.49% 6,199 0.49%
Workers Comp Insurance 3,693 0.37% 3,955 0.36% 4,060 0.35% 4,164 0.34% 4,191 0.33%
Payroll Tax 17,955 1.79% 18,814 1.70% 19,453 1.66% 20,111 1.63% 20,670 1.62%
TOTAL HOTEL PAYROLL 161,599 16.09% 169,330 15.29% 175,080 14.96% 181,002 14.65% 186,032 14.60%HOTEL OPERATING EXPENSE Cleaning Supplies 3,693 0.37% 3,955 0.36% 4,060 0.35% 4,164 0.34% 4,191 0.33%
Laundry Supplies 6,858 0.68% 7,345 0.66% 7,539 0.64% 7,734 0.63% 7,782 0.61%
Linens 8,969 0.89% 9,605 0.87% 9,859 0.84% 10,113 0.82% 10,177 0.80%
Guest Supplies 10,551 1.05% 11,300 1.02% 11,599 0.99% 11,898 0.96% 11,973 0.94%
Repairs & Maintenance 3,693 0.37% 3,955 0.36% 4,640 0.40% 5,354 0.43% 5,987 0.47%
Membership Fee 24,000 2.39% 24,000 2.17% 24,000 2.05% 24,000 1.94% 24,000 1.88%
Property Mgmt. System Expense 3,600 0.36% 3,969 0.36% 4,194 0.36% 4,429 0.36% 4,566 0.36%
Complimentary Breakfast 31,654 3.15% 33,899 3.06% 34,797 2.97% 35,695 2.89% 35,919 2.82%
Travel Agent Fees 4,931 0.49% 5,439 0.49% 5,750 0.49% 6,076 0.49% 6,267 0.49%
Vending / Bar Expense 7,914 0.79% 8,475 0.77% 8,699 0.74% 8,924 0.72% 8,980 0.70%
Office Supplies 6,858 0.68% 7,345 0.66% 7,539 0.64% 7,734 0.63% 7,782 0.61%
Marketing / Advertising 13,189 1.31% 14,125 1.28% 14,499 1.24% 14,873 1.20% 14,966 1.17%
Utilities 55,252 5.50% 60,913 5.50% 64,368 5.50% 67,976 5.50% 70,085 5.50%
Swimming Pool 7,500 0.75% 7,613 0.69% 7,727 0.66% 7,843 0.63% 7,960 0.62%
Telephone 5,276 0.53% 5,650 0.51% 5,799 0.50% 5,949 0.48% 5,987 0.47%
Cable 4,200 0.42% 4,630 0.42% 4,893 0.42% 5,167 0.42% 5,328 0.42%
Credit Card Expense 21,103 2.10% 22,599 2.04% 23,198 1.98% 23,796 1.93% 23,946 1.88%
Management Fee 50,229 5.00% 55,375 5.00% 58,517 5.00% 61,796 5.00% 63,713 5.00%
Other Expense 7,386 0.74% 7,910 0.71% 8,119 0.69% 8,329 0.67% 8,381 0.66%
Accounting Services 5,100 0.51% 5,623 0.51% 5,941 0.51% 6,274 0.51% 6,469 0.51%
Professional Fees 1,200 0.12% 1,323 0.12% 1,398 0.12% 1,476 0.12% 1,522 0.12%
TOTAL OPERATING EXPENSES 283,155 28.19% 305,044 27.54% 317,135 27.10% 329,600 26.67% 335,981 26.37%INCOME BEFOREFIXED EXPENSES
RESERVES & FIXED EXPENSES
Real Estate Taxes 5,000 0.50% 40,000 3.61% 40,800 3.49% 41,616 3.37% 42,448 3.33%
Insurance 12,557 1.25% 13,844 1.25% 14,629 1.25% 15,449 1.25% 15,928 1.25%
Reserves For Replacement (NA) 0 0.00% 22,150 2.00% 35,110 3.00% 43,257 3.50% 50,971 4.00%
TOTAL RESERVES & FIXED 17,557 1.75% 75,994 6.86% 90,539 7.74% 100,322 8.12% 109,347 8.58%
CASH FLOW BEFORE DEBT 542,269 53.98% 557,135 50.31% 587,579 50.21% 624,999 50.57% 642,905 50.45%
Debt Service 158,405 15.77% 158,405 14.30% 158,405 13.54% 158,405 12.82% 158,405 12.43%
NET CASH FLOW $383,864 38.21% $398,730 36.00% $429,174 36.67% $466,594 37.75% $484,500 38.02%
RETURN ON CASH INVESTMENT
NOTE: The above information is a forwards looking projection of anticipated expenses and profits with regard to this project based on the professional experience of Core Distinction Group LLC (CDG) participation in other projects,
similar in nature. Occupancy and ADR projections derived from market data trends reported by Smith Travel Research (STR) in the market's proximity along with to date rate shopping of local and surrounding hotels. This projection
could change due to changes in the economy, both locally and overall, the acceptance of the project by the local community and patrons and the fact that CDG has not been involved in a project in this area and in a municipality with these
demographics in the past. Thereby, all investors understand and acknowledge that these forward looking projections are not warranted by CDG and are subject to change and fluctuation.
5 Year ProjectionThe following statistics are preliminary projection based on assumed costs of prototypical hotel.
Rooms:41
Hotel Expenses
559,827 56% 633,128 57% 678,118 58% 725,321 59% 752,252 59%
28.43% 29.54% 31.79% 34.56% 35.89%
85 07/17/2013
C
ore D
istin
ction
Gro
up L
LC

Year 1 % Year 2 % Year 3 % Year 4 % Year 5 %Lodging Rooms Available 14,965 14,965 14,965 14,965 14,965
Lodging Occupancy % 32.1% 32.1% 35.9% 35.9% 35.8% 35.8% 35.3% 35.3% 35.1% 35.1%
Total Occ. Rooms 4,799 5,379 5,350 5,283 5,250
Average Daily Rate $93.46 $96.26 $99.15 $102.12 $104.68
REVENUE: Guest Rooms 448,508 98.16% 517,796 98.21% 530,454 98.27% 539,526 98.32% 549,559 98.36%
Telephone / Misc Revenue 1,200 0.26% 1,345 0.26% 1,338 0.25% 1,321 0.24% 1,313 0.23%
Meeting Space 0.00% 0.00% 0.00% 0.00% 0.00%
Vending / Bar Revenue 7,199 1.58% 8,069 1.53% 8,025 1.49% 7,925 1.44% 7,875 1.41%
TOTAL HOTEL REVENUE 456,907 100% 527,209 100% 539,817 100% 548,771 100% 558,747 100%
HOTEL PAYROLL EXPENSE Hotel Manager 35,000 7.66% 36,750 6.97% 38,588 7.15% 40,517 7.38% 42,543 7.61%
Housekeeping 16,797 3.68% 18,827 3.57% 18,725 3.47% 18,491 3.37% 18,375 3.29%
Maintenance 1,200 0.26% 1,345 0.26% 1,338 0.25% 1,321 0.24% 1,313 0.23%
Front Desk 60,000 13.13% 61,800 11.72% 63,654 11.79% 65,564 11.95% 67,531 12.09%
Employee Benefits 4,520 0.99% 4,749 0.90% 4,892 0.91% 5,036 0.92% 5,190 0.93%
Workers Comp Insurance 1,680 0.37% 1,883 0.36% 1,873 0.35% 1,849 0.34% 1,838 0.33%
Payroll Tax 14,899 3.26% 15,669 2.97% 16,134 2.99% 16,597 3.02% 17,099 3.06%
TOTAL HOTEL PAYROLL 134,095 29.35% 141,022 26.75% 145,202 26.90% 149,374 27.22% 153,887 27.54%HOTEL OPERATING EXPENSE Cleaning Supplies 1,680 0.37% 1,883 0.36% 1,873 0.35% 1,849 0.34% 1,838 0.33%
Laundry Supplies 3,119 0.68% 3,496 0.66% 3,478 0.64% 3,434 0.63% 3,413 0.61%
Linens 4,079 0.89% 4,572 0.87% 4,548 0.84% 4,491 0.82% 4,463 0.80%
Guest Supplies 4,799 1.05% 5,379 1.02% 5,350 0.99% 5,283 0.96% 5,250 0.94%
Repairs & Maintenance 1,680 0.37% 1,883 0.36% 2,140 0.40% 2,377 0.43% 2,625 0.47%
Membership Fee 24,000 5.25% 24,000 4.55% 24,000 4.45% 24,000 4.37% 24,000 4.30%
Property Mgmt. System Expense 3,600 0.79% 4,154 0.79% 4,253 0.79% 4,324 0.79% 4,402 0.79%
Complimentary Breakfast 14,397 3.15% 16,137 3.06% 16,050 2.97% 15,849 2.89% 15,750 2.82%
Travel Agent Fees 2,243 0.49% 2,589 0.49% 2,652 0.49% 2,698 0.49% 2,748 0.49%
Vending / Bar Expense 3,599 0.79% 4,034 0.77% 4,013 0.74% 3,962 0.72% 3,938 0.70%
Office Supplies 3,119 0.68% 3,496 0.66% 3,478 0.64% 3,434 0.63% 3,413 0.61%
Marketing / Advertising 5,999 1.31% 6,724 1.28% 6,688 1.24% 6,604 1.20% 6,563 1.17%
Utilities 25,130 5.50% 28,997 5.50% 29,690 5.50% 30,182 5.50% 30,731 5.50%
Swimming Pool 7,500 1.64% 7,613 1.44% 7,727 1.43% 7,843 1.43% 7,960 1.42%
Telephone 2,400 0.53% 2,690 0.51% 2,675 0.50% 2,642 0.48% 2,625 0.47%
Cable 4,200 0.92% 4,846 0.92% 4,962 0.92% 5,044 0.92% 5,136 0.92%
Credit Card Expense 9,598 2.10% 10,758 2.04% 10,700 1.98% 10,566 1.93% 10,500 1.88%
Management Fee 22,845 5.00% 26,360 5.00% 26,991 5.00% 27,439 5.00% 27,937 5.00%
Other Expense 3,359 0.74% 3,765 0.71% 3,745 0.69% 3,698 0.67% 3,675 0.66%
Accounting Services 5,100 1.12% 5,885 1.12% 6,025 1.12% 6,125 1.12% 6,237 1.12%
Professional Fees 1,200 0.26% 1,385 0.26% 1,418 0.26% 1,441 0.26% 1,467 0.26%
TOTAL OPERATING EXPENSES 153,646 33.63% 170,645 32.37% 172,453 31.95% 173,285 31.58% 174,669 31.26%INCOME BEFOREFIXED EXPENSES
RESERVES & FIXED EXPENSES
Real Estate Taxes 5,000 1.09% 40,000 7.59% 40,800 7.56% 41,616 7.58% 42,448 7.60%
Insurance 5,711 1.25% 6,590 1.25% 6,748 1.25% 6,860 1.25% 6,984 1.25%
Reserves For Replacement (NA) 0 0.00% 10,544 2.00% 16,195 3.00% 19,207 3.50% 22,350 4.00%
TOTAL RESERVES & FIXED 10,711 2.34% 57,134 10.84% 63,742 11.81% 67,683 12.33% 71,783 12.85%
CASH FLOW BEFORE DEBT 158,454 34.68% 158,408 30.05% 158,419 29.35% 158,430 28.87% 158,408 28.35%
Debt Service 158,405 34.67% 158,405 30.05% 158,405 29.34% 158,405 28.87% 158,405 28.35%
NET CASH FLOW $49 0.01% $3 0.00% $14 0.00% $25 0.00% $3 0.00%
NOTE: The above information is a forwards looking projection of anticipated expenses and profits with regard to this project based on the professional experience of Core Distinction Group LLC (CDG) participation in other projects,
similar in nature. Occupancy and ADR projections derived from market data trends reported by Smith Travel Research (STR) in the market's proximity along with to date rate shopping of local and surrounding hotels. This projection could
change due to changes in the economy, both locally and overall, the acceptance of the project by the local community and patrons and the fact that CDG has not been involved in a project in this area and in a municipality with these
demographics in the past. Thereby, all investors understand and acknowledge that these forward looking projections are not warranted by CDG and are subject to change and fluctuation.
41% 226,113 41% 230,190 41%169,166 37% 215,542 41% 222,161
Hotel Expenses
5 Year Break EvenThe following statistics are preliminary projection based on assumed costs of prototypical hotel.
Rooms:41
86 07/17/2013
C
ore D
istin
ction
Gro
up L
LC

DISCLAIMER
Thank you for the opportunity to complete this market and feasibility study for the proposed hotel
project located in Sterling, CO. We have studied the market area for additional demand for a lodging facility and the results of our fieldwork and analysis are presented in this report. We have
also made recommendations for the scope of the proposed project, including general site location,
size of hotel, and brand.
We hereby certify that we have no undisclosed interest in the property and our employment and
compensation are not contingent upon our findings. This study is subject to the comments made
throughout this report and to all assumptions and limiting conditions set forth herein.
The conclusions presented in this report are based upon the information available and received at the
time the report was filed. Core Distinction Group, LLC (“CDG”) has taken every possible precaution
to evaluate this information for its complete accuracy and reliability. Parts of this report were
prepared or arranged by third-party contributors, as indicated throughout the document. While third-
party contributions have been reviewed by CDG for reasonableness and consistency for including in
this report, third-party information has not been fully audited or sought to be verified by CDG. CDG
does not provide financial advice.
It should be understood that economic and marketplace conditions are in constant change. The results
presented in this report are the professional opinion of CDG and are based on information available
at the time of the report preparation. These opinions infer that market conditions do not change the
information received upon which those opinions have been based. CDG assumes no responsibility
for changes in the marketplace. CDG assumes no responsibility for information that becomes
outdated once this report is written; nor are we responsible for keeping this information current after
the date of the final document presentation.
CDG makes no express or implied representation or warranty that the contents of this report are
verified, accurate, suitably qualified, reasonable or free from errors, omissions or other defects of any
kind or nature. Those who rely on this report do so at their own risk and CDG disclaims all liability,
damages or loss with respect to such reliance.
It is presumed that those reading this report understand the contents and recommendations. If this
reader is unclear of understanding the contents, clarification can be received directly from a
representative of CDG. While the terms of CDG’s engagement do not require that revisions be made
to this report to reflect events or conditions which occur subsequent to the date of completion of
fieldwork, we are available to discuss the necessity for revisions in view of changes in the economic
climate or market factors affecting the proposed hotel project.
Please do not hesitate to call should you have any comments or questions.
Sincerely,
Core Distinction Group, LLC
Lisa L. Boushele
Owner
Lisa L. Boushele
87 07/17/2013
C
ore D
istin
ction
Gro
up L
LC