market frictions and the competitive advantage of internal
TRANSCRIPT
Market Frictions and the Competitive Advantage of Internal LaborMarkets�
Sharon Belenzony Ulya Tsolmonz
April 3, 2015
Abstract
We show that frictions in labor and capital markets can be a source of competitive advantagefor a¢ liates of corporate groups over standalone �rms in environments where bene�ts from internalmarkets��exibility are high. We argue that the advantage of �exibility in changing labor inputs isrelated to how di¢ cult it is to change capital inputs. We predict that if substituting labor withcapital is di¢ cult, the group advantage of �exibly changing labor would be stronger in countries withhigh levels of �nancial development. Consistent with this prediction, we �nd a stronger competitiveadvantage for group a¢ liates in countries with rigid labor markets but �exible capital markets. Inthese environments, group a¢ liates are more prevalent and outperform standalone �rms in terms ofgrowth and pro�tability.
Keywords: corporate groups, competitive advantage, market frictions, internal labor markets, workermobility
JEL Classi�cation: J08, J40, L22, M51
1 Introduction
One of the fundamental domains of study for management scholars is understanding why �rms exist.
Although extant theories vary in their causal logic, the widespread consensus is around the notion that
the raison d�être of �rms is to substitute for market ine¢ ciencies (Mahoney and Qian, 2013). Such
ine¢ ciencies may arise due to the nature of institutions (Coase, 1937), transactions (Williamson, 1975),
or resources (Penrose, 1959; Barney, 1986). Along these lines, researchers have paid particular attention
�Acknowledgements: We would like to thank two anonymous referees and the Editor, Alfonso Gambardella, for veryconstructive comments that substantially improved the paper. The authors express special gratitude to Ashish Arora and An-drea Patacconi for numerous helpful discussions. The authors are also grateful for valuable comments from Bruno Cassiman,Wes Cohen, Ramon Lecuona, Will Mitchell, Joanne Oxley and Jan Rivkin. All remaining errors are the authors�.
yFuqua School of Business, Duke University. Email: [email protected] School of Business, Duke University. Email: [email protected]
1
to the e¤ects of development of �nancial markets on the boundaries and structure of �rms. A well-
established �nding is that �conglomerates�or �business groups�are prone to arise when �nancial markets
are underdeveloped, as these structures can function as internal capital markets (e.g., Gertner, Scharfstein,
and Stein, 1994; Belenzon and Berkovitz, 2010). Yet we still know little about how �rms organize to
overcome rigidities in other factor markets. Although human resources have been considered as key in
determining competitive advantage (Chandler, 1962; Penrose, 1959), extant work has paid scant attention
to how �rms organize to address labor market rigidities. These can represent important challenges for
�rms, as they constrain �rms�capacity to adjust their employment pool.
Scholars have noted that �business groups�create and utilize their internal labor markets by rotating
workers across the multiple businesses that comprise these organizations (Khanna and Palepu, 1997;
Khanna and Rivkin, 2001; Chang and Hong, 2000). This can be costly, as it implies maintaining large,
often cumbersome, structures.1 Such costs, however, may be justi�ed by the �exibility to address frictions
in the external labor market. Focusing on employment protection laws (EPL hereafter) as the source of
labor market frictions, this study takes place in the context of corporate groups� collections of legally
independent �rms that are controlled by the same ultimate owner (Le¤, 1978)� and argues that in speci�c
institutional environments internal labor markets can provide competitive advantage for group-a¢ liated
�rms. For example, if economic conditions require business �A� to downsize, excess workers can be
transferred to business �B� within the same group which faces a more favorable environment. Such
�exibility is not available for �rms without an internal labor market. These �rms must either bear
the costs imposed by EPL when downsizing is necessary or maintain costly slack in human resources.
Similarly, observant of their lack of �exibility, such �rms may keep a lean pool of workers, which can be
problematic when the operational environment requires adding to the workforce (e.g., an unexpected hike
in demand). All in all, the rigidities imposed by the EPL and the lack of internal �exibility translates into
higher costs (costs of downsizing, keeping excess personnel, not having enough employees when needed,
etc.) and, hence, into lower performance for �rms without internal labor markets.
The restructuring e¤orts by the Volkswagen Group in Germany illustrate the binding e¤ects of EPL
(Hartz, 1994; Kothen, McKinley, and Scherer, 1999). In the early 1990s, the European automobile indus-
try was in crisis due to declining demand and competitive pressure from Japanese automakers. By 1993,
Volkswagen Group had more than 30,000 extra employees out of its total 107,000 across its a¢ liates in
1Other costs include ine¢ cient internal reallocation of resources from minority to controlling shareholders, known as�tunneling.�
2
Germany. It pursued a multi-prong solution to avoid dismissing employees. The group implemented pay
cuts, encouraged early retirement, and shortened workdays to reduce employment costs directly. More-
over, it trained and transferred surplus employees to di¤erent job classi�cations and relocated employees
geographically to di¤erent production locations to even out imbalances in labor supply.
Our paper has two goals. The �rst is to show that internal labor markets can be a source of competitive
advantage. A¢ liates bene�t from internal labor markets because, unlike standalone �rms, they can
reallocate workers to other a¢ liates of the group without incurring EPL penalties. A legal provision
in Europe exempts intra-group labor adjustments from EPL, enhancing the competitive advantage of
internal labor markets.2 We expect that in environments where internal labor markets are a source of
competitive advantage (e.g., EPL are strong and labor readjustment is frequent), corporate groups would
be more prevalent and group a¢ liates would outperform standalone �rms.
Our second goal is to show that the competitive advantage of internal labor markets depends on the
development of country �nancial markets. We argue that the advantage of �exibility in internally changing
labor inputs is a¤ected by how di¢ cult it is to change capital inputs and that the strength of this e¤ect
is related to the ease of substitution between labor and capital. Based on our theoretical discussion and
building on evidence from the economic literature of low substitutability between labor and capital,3 we
predict that the bene�t of labor �exibility in groups should be larger when capital is also �exible. This
prediction implies that internal labor markets are a stronger source of competitive advantage in countries
where developed �nancial markets allow for more �exible capital adjustment.
Our empirical analysis is as follows. We begin by examining how the di¤erence in the share of group
a¢ liates between industries with high and low frequency of labor adjustments varies by country EPL.
We expect this di¤erence to increase with EPL. Our di¤erence-in-di¤erence empirical strategy is to use
exogenous country and industry conditions and to test whether EPL have the strongest impact on group
a¢ liation in industries where �rms adjust their labor force more frequently. Using data from the United
States (and other sources), we rank industries according to their level of labor turnover in relatively
regulation-free labor markets to calculate each industry�s average turnover rate. Then we rank the 15
Western European countries in our sample according to EPL. Our �rst econometric test is whether the
di¤erence between high and low industry labor turnover in group a¢ liates is higher in countries with high
EPL than in countries with low EPL. We compare �nancial performance of group a¢ liates to that of
2O¢ cial Journal of the European Union, L 018, 01/21/1997: pages 1�6.3See Chirinko (2008) for a detailed survey of the relevant macroeconomics literature.
3
standalone �rms and study how the di¤erence between the two relates to EPL and �nancial development.
Lastly, we provide direct evidence on the use of internal labor markets in redeploying workers across group
units in strong-EPL countries.
Our �ndings support the view that labor reallocation in groups can be a source of competitive advan-
tage. We �nd that in environments where EPL are strong and labor redeployment is frequent, a greater
share of resources is redeployed inside �rms, leading to an expansion in �rm boundaries and to more
persistent di¤erences in �rm performance. Moving from the lowest to the highest decile of EPL increases
the di¤erence in group a¢ liation between high- and low-turnover industries by 3.5 percentage points, or
16 percent of the sample�s average share of group a¢ liates. Financial development strongly moderates
the EPL e¤ect, supporting our prediction that internal labor markets are a stronger source of competitive
advantage in countries with more developed capital markets.
To further support our analysis, we provide two sets of direct evidence of active internal labor markets
in countries with strong EPL. First, we examine changes in employment in a¢ liated �rms in response to
negative industry shocks� the rise in Chinese import penetration. We �nd that a¢ liates increase their
employment in response to a rise in Chinese imports to other a¢ liates in the group, consistent with active
internal labor markets that reallocate workers from less pro�table to more pro�table units. Second, we
compare the incidence of internal mobility of mid-level managers in groups that are located in low- and
high-EPL countries. We �nd a substantially higher incidence of internal mobility in high-EPL countries.
These �ndings advance our understanding of why �rms coalesce into groups in modern economies and
�esh out the conditions under which internal labor markets can be a source of competitive advantage. We
demonstrate that market frictions are an important force that drives competitive advantage and emphasize
that these frictions are multidimensional and that their joint e¤ect on competitive advantage is complex
and sometimes counterintuitive. In particular, we show that EPL drive the competitive advantage of group
a¢ liates, especially in countries with developed �nancial markets. Understanding that the economic role
of groups can be more pronounced when institutions are developed informs debates on the �dark�and
�bright�sides of groups, and large organizations, more generally.
2 Corporate Groups and EPL in Europe
Central to our analysis is the substantial variation in EPL across European countries. EPL comprise a set
of legal rules, administrative procedures, and compensatory payouts that apply to employee dismissals.
Unlike unemployment bene�ts, which are funded through payroll taxes, EPL impose direct costs on the
4
employer responsible for dismissals. For example, in Spain, individual dismissal procedures require 30-day
written notice with a statement of reasons for dismissal and a written noti�cation to the worker�s repre-
sentatives at the workplace. Upon dismissal, Spanish employees are entitled to severance pay equivalent to
33 days�salary for each year of service. Similarly, Austrian workers with more than 3 years of service are
entitled to 8 weeks�notice and 6 months�salary as severance pay (OECD Employment Outlook, 2004).
EPL vary widely in our sample of Western European countries. Greece, Spain, and France have the
strictest EPL, whereas Great Britain, Ireland, and Switzerland have the fewest restrictions on dismissals.
The European Union (EU) is an ideal environment for examining the e¤ect of varying institutional
environments on �rm structure, performance, and behavior for four main reasons.
First, EU countries vary widely in EPL and level of �nancial market development, but at the same
time, they exist within a narrow range of economic development,4 such that we can focus on developed
economies and substantially reduce unobserved cross-country heterogeneity.
Second, EU countries share a clear and consistent de�nition of groups based on historical, institutional,
and economic traditions. Corporate groups are an integral part of the economic landscape in the EU.
The legal de�nition of a corporate group is based on the concept of control between parent and subsidiary
companies as de�ned in Article 1 of the Seventh EU Directive (O¢ cial Journal L 193, 07/18/1983 p.1), and
the EU Directive 96/71/EC utilizes this de�nition, granting exceptions to labor mobility within corporate
groups (O¢ cial Journal L 018, 01/21/1997 p.1�6). The presence of at least one of the following establishes
control: holding the majority of the voting rights; a contract; or the ability to appoint and remove the
majority of the board of directors (Forum Europaeum Corporate Group Law, 2000). Most of the academic
work also utilizes the EU�s control-based de�nition of corporate groups (Cestone and Fumagalli, 2005),
where control is determined based on the ownership stakes the controlling shareholder has in each of the
group a¢ liates (Windbichler, 2000). In this paper we identify a �rm as a group a¢ liate if it is a subsidiary
(i.e., has a controlling parent company), controls another �rm, or has the same controlling shareholder as
at least one other �rm (Faccio and Lang, 2001; La Porta, Lopez-de-Silanes, and Shleifer, 1999).
Third, employment regulations apply only to labor readjustments that use external markets, not to
4Average GDP per capita in our sample is $53,781 (2010 estimates), with a median of $49,489. Moving from the lowestquartile to the highest quartile of GDP per capita is associated with a relatively low increase of 28 percent. There are two�outliers� in our data in terms of GDP per capita: Norway on the high end with $103,586 and Greece on the low end with$34,832. To ensure that our results are not driven by speci�c countries, Section 6.5 reports robustness checks for excludingsingle and group of countries from the sample. Table A1 (online appendix) presents our main country measures. Examplesof countries with di¤erent �nancial development but very similar economic development include: France and Great Britainhave similar levels of GDP per capita ($37,870 and $38,450, respectively), but Great Britain has a substantially higher levelof �nancial development (3.79 vs. 1.33; column 7 in Table A1). The Netherlands and Germany also have similar levels ofGDP per capita ($46,300 vs. $44,470), but the Netherlands is more �nancially developed than Germany (2.39 vs. 1.02).
5
ones inside corporate groups. EU law does not consider the mobility of workers within a corporate group a
market transaction. Intra-group mobility is not subject to country labor-market regulations, and a¢ liates
can transfer employees to a di¤erent a¢ liate without incurring EPL-based dismissal penalties. The
European Union Directive 96/71/EC sets out to facilitate movement of human capital within and across
the Member States and allows group a¢ liates to �post workers to an establishment or to an undertaking
owned by the group in the territory of a Member State�(O¢ cial Journal L 018, 01/21/1997 p. 1�6). This
provision allows unilateral transfer of employees among a¢ liates without having to dismiss and rehire each
transfer and thereby without being subject to employment-protection regulations. Our discussions and
consultations with European labor law experts and human-resource executives have further validated the
utility of this legal provision, which provides a clear advantage to �rms a¢ liated with corporate groups.
Fourth, European countries exhibit substantial variation in EPL within countries with developed and
underdeveloped �nancial markets. This variation is necessary in order to estimate separately the e¤ects
of EPL and �nancial development and their interaction with each other. Figure 1 plots the country-level
OECD employment-protection regulation index and �nancial development measures for each country
in our sample and shows that the correlation between EPL and �nancial development is low (-0.35,
statistically insigni�cant).
[Insert Figure 1 here]
An identi�cation assumption in our analysis is that the way in which groups are distributed across
industries within countries does not a¤ect EPL. The online appendix provides a historical background
of the origin of EPL for our sample countries. This background is important because it emphasizes that
the prevalence of groups should not have played an important role in shaping policies toward greater
stickiness of labor. Nonetheless, industrial labor relations are shaped in large part by laws that are often
amended by di¤erent political and economic interests (Pagano and Volpin, 2005). Pagano and Volpin show
that countries with electoral systems representing the overall majority tend to have stricter EPL. In our
context, to make the reverse-causality argument plausible (groups lobby for stricter EPL to enhance their
competitive advantage over standalone �rms), groups should represent the majority interests and lobby
intensely in countries where groups disproportionately concentrate in industries with high labor turnover.
To our knowledge, there is no evidence suggesting this scenario is likely.
6
3 The Interaction Between EPL and Financial Development
This section discusses how the advantage of �exibility in changing labor inputs is a¤ected by how di¢ cult
it is to change capital inputs.5 We argue that the advantage of labor �exibility is a¤ected by how di¢ cult
it is to adjust capital, and we relate the strength of this e¤ect to the ease of substitution between labor and
capital. The ease of substitution determines the extent to which standalone �rms can mitigate rigidities
by substituting away from the more rigid input toward the more �exible one.
To simplify our discussion, we assume that group a¢ liates can always rely on their internal markets
for labor and capital (that is, a¢ liates are una¤ected by frictions in external markets).6 Standalone �rms,
on the other hand, are constrained by market frictions in their ability to adjust labor and capital. Figure
2 presents the di¤erent cases we consider with respect to labor and capital �exibility.
[Insert Figure 2 here]
In Figure 2, FCM denotes the case where capital market institutions are well developed (capital is
�exible), and RCM denotes the case where capital market institutions are not well developed (capital is
rigid). FLM and RLM are similarly de�ned for labor markets. �GA(:) and �SF (:) denote pro�ts for group
a¢ liates and standalone �rms, respectively. Because we assume that group a¢ liates are una¤ected by
external markets, our discussion will focus only on standalone �rms.
We wish to establish whether the bene�ts of labor market �exibility for standalone �rms are synergistic
with capital market �exibility or whether the two types of �exibility are substitutes. More speci�cally,
we explore whether moving from cell A to cell B (from �exible to rigid labor with �exible capital) is
associated with a bigger reduction in pro�tability than moving from cell C to cell D (from �exible to rigid
labor with rigid capital). Because group a¢ liates obtain the same level of pro�ts in each institutional
environment, we only need to check whether the following condition holds for standalone �rms:
�SF (FCM ; FLM )� �SF (FCM ; RLM ) � �SF (RCM ; FLM )� �SF (RCM ; RLM ) (1)
The advantage of �exibility. Consider a world with uncertain demand where in�exibility of inputs
means that labor and capital must be deployed before demand is realized. In this setting, the competitive
advantage of group a¢ liates stems from their ability to deploy inputs after demand is realized. Market
frictions may cause standalone �rms to forgo business opportunities that they would have pursued had5A formal and extended version of this discussion is available upon request.6Our logic remains unchanged if we assume instead that group a¢ liates are also a¤ected by external market conditions,
but to a lesser extent than standalone �rms.
7

inputs been �exible. The prospect of pro�ts in the high-demand state may not be su¢ cient to compensate
them for the losses they may incur in the low-demand state, where some resources would be wasted.
Rigidities in this case ine¢ ciently reduce a standalone�s investment and pro�ts relative to a group a¢ liate.
We next explain how the advantage of labor �exibility is a¤ected by capital �exibility and how this
e¤ect is moderated by the ease of substitution between labor and capital.
Low substitution between labor and capital. Imagine that labor and capital must be used in �xed
proportions. For standalones, when labor and capital cannot be easily substituted, �exibility in one input
alone is of little advantage. That is, the cost of labor in�exibility when capital is �exible is large (moving
from cell A to cell B) because both labor and capital are required to produce. By contrast, the cost of
labor in�exibility when capital is also in�exible is relatively small (moving from cell C to cell D), because
production is already constrained by rigid capital. A single friction is enough to severely constrain pro�ts
when inputs are non-substitutable and �exibility in both input markets may be necessary for standalones
to pro�tably operate. This implies that labor market frictions are particularly costly to standalones when
�nancial markets are developed. To the extent that group a¢ liates are una¤ected by imperfections in input
markets, one source of market friction is enough to advantage a¢ liates over standalones. Imperfections
in the other input market add little to the relative advantage of group a¢ liates.7
High substitution between labor and capital. When capital and labor can easily be substituted, how-
ever, labor market imperfections are not very detrimental to standalones when capital is �exible, because
labor adjustment will be borne by capital. Standalone �rms will substitute rigid labor with �exible capi-
tal, eliminating the labor �exibility advantage of group a¢ liates. Similarly, capital market imperfections
are not very detrimental when labor is �exible. Only when labor and capital markets are both underde-
veloped is standalones�performance seriously impaired. It follows that, for standalones, the cost of labor
in�exibility when capital is �exible tends to be small (moving from cell A to cell B), while the cost of labor
in�exibility when capital is in�exible tends to be large (moving from cell C to cell D). Consequently, labor
market imperfections lead to a larger competitive advantage for group a¢ liates, vis-à-vis standalones,
when capital markets are underdeveloped. Therefore, whether we expect labor market imperfections to
provide a larger competitive advantage for group a¢ liates relative to standalone �rms in developed capital
7To further �esh out the relationship between labor and capital �exibility, it is useful to consider the following specialcase. Suppose that a �rm decides whether or not to invest in a risky business opportunity. For inequality (1) to hold, movingfrom zero frictions to a single friction (left-hand side of the inequality) has to be more costly than moving from a singlefriction to two frictions (right-hand side of the inequality). Because standalone �rms choose not to invest when expectedpro�ts are negative, if a single friction pushes pro�ts close to zero, the second friction will not have a large e¤ect on pro�ts,because pro�ts are bound from below by zero.
8
markets depends on the ease with which labor can be substituted by capital.
An important literature in macroeconomics is dedicated to estimating the elasticity of substitution
between labor and capital. This literature strongly suggests that the elasticity of substitution between
labor and capital is low. In a comprehensive survey, Chirinko (2008) surveys over 30 studies that con-
clude that the elasticity of substitution ranges from 0.4 to 0.6.8 To put these estimates in perspective,
when inputs are used in �xed proportions (perfect complements), the implied elasticity is zero, whereas
when inputs can be freely substituted (linear production function), the implied elasticity of substitution
is in�nity. The familiar Cobb-Douglas production function has an elasticity of substitution equals to
one. The consensus in the literature, therefore, is that labor cannot be substituted easily with capital.9
Consistent with this consensus, examining labor intensity patterns in our sample (ratio between number
of employees and �xed assets) reveals that standalones tend not to replace labor with capital when labor
becomes more rigid (arguably, stronger EPL is equivalent to raising the relative cost of labor). In strong
EPL countries, the ratio between labor and capital is 0.152 and in weak EPL countries this ratio is 0.155.
Our theoretical discussion and the empirical stylized facts on the ease of substitution between labor
and capital leads to the prediction that because substituting labor with capital is often di¢ cult, the group
advantage of �exibility in changing labor would be stronger in high-�nancial-development countries.
4 Data
We construct our sample from the Bureau van Dijk�s (BvDEP) Amadeus ownership and �nancial database,
which provides wide and representative coverage of both private and public companies in Europe. BvDEP
standardizes �nancial items across the various countries��ling regulations and captures a wide range of
�rm sizes. Our data include three main sections, which we describe in detail below: ownership, country
measures of labor regulations and �nancial development, and industry employment measures. Table 1
provides information on the main variables used in the analysis.
8Notable works in this literature include Hamermesh, 1993; Mairesse, Hall, and Mulkay, 1999; Ober�eld and Raval, 2014;and Chirinko and Mallick, 2014.
9Our theoretical discussion assumes that the elasticity of substitution is a technical characteristic of the production functionand is una¤ected by the institutional environment. However, a concern is that within Europe, the elasticity of substitution ishigher in countries where external capital can be accessed more easily. Importantly, this is inconsistent with estimates fromthe literature indicating low substitution even for the United States, where external capital is easily accessible. Thus, it isunlikely that within our European sample, �rms that operate in countries with relatively developed �nancial markets facea high elasticity of substitution. More generally, there is no evidence that the elasticity of substitution rises with �nancialdevelopment. In his survey of the literature, Chirinko (2008) presents elasticity estimates for the U.S., Great Britain, andthe Euro area (Table 1). The evidence is inconsistent with higher elasticity of substitution in more �nancially developedcountries: estimates for Great Britain, the U.S., and the Euro area are 0.32�0.42, 0.4�0.6 and 0.7, respectively.
9
4.1 Ownership
Our data include detailed ownership links between European �rms from the 2007 version of Amadeus.
Amadeus provides information on equity links between �rms in Europe. We determine which of these
inter-�rm dyadic ownership links represent a controlling interest. We follow Belenzon et al. (2013) and
de�ne a corporate group as a collection of at least two legally distinct �rms in which one is a controlling
ultimate shareholder, where control is identi�ed according to the equity links described above. A �rm is
classi�ed as a group a¢ liate if (i) the �rm has a controlling parent company (it is a subsidiary), (ii) it
is a parent company of another �rm (it has a subsidiary), or (iii) it has the same controlling shareholder
as at least one other �rm.10 We exclude �rms with missing ownership information.11 Later we explore
the dynamics of corporate group a¢ liation using time-series ownership data. These data are collected by
joining together cross-sectional ownership data for each publication year from 2007 to 2011.
4.2 Country Employment Regulations and Financial Development
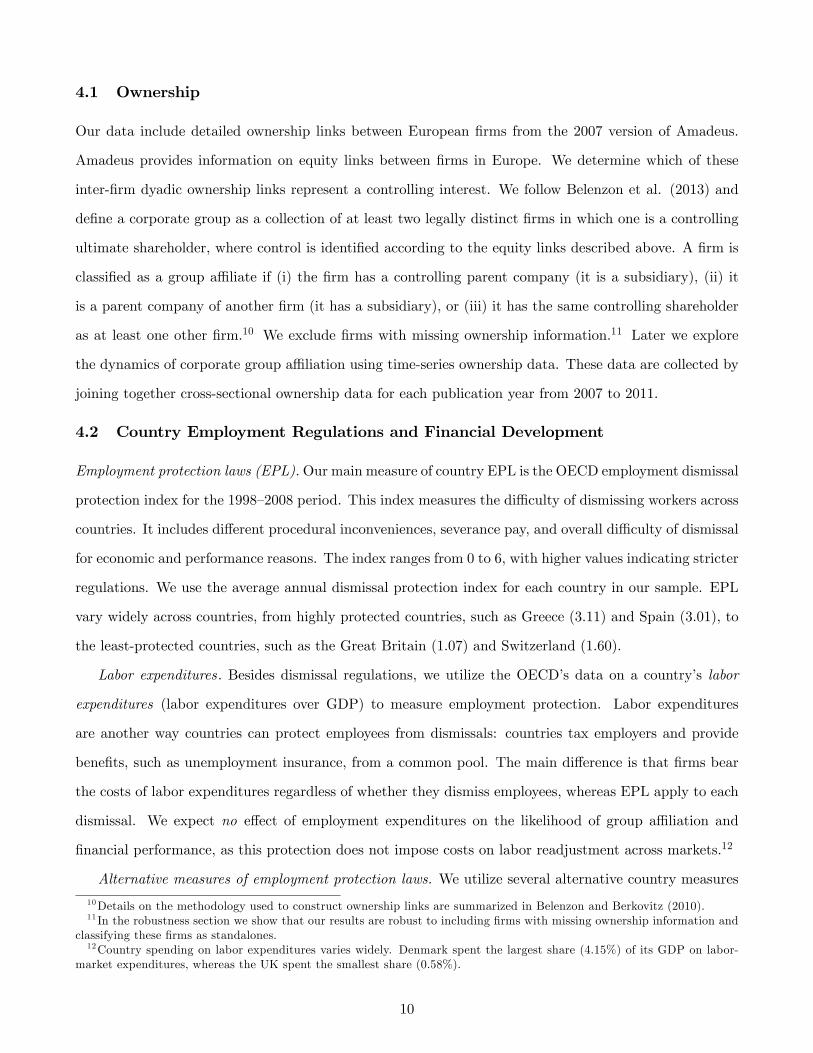
Employment protection laws (EPL).Our main measure of country EPL is the OECD employment dismissal
protection index for the 1998�2008 period. This index measures the di¢ culty of dismissing workers across
countries. It includes di¤erent procedural inconveniences, severance pay, and overall di¢ culty of dismissal
for economic and performance reasons. The index ranges from 0 to 6, with higher values indicating stricter
regulations. We use the average annual dismissal protection index for each country in our sample. EPL
vary widely across countries, from highly protected countries, such as Greece (3.11) and Spain (3.01), to
the least-protected countries, such as the Great Britain (1.07) and Switzerland (1.60).
Labor expenditures: Besides dismissal regulations, we utilize the OECD�s data on a country�s labor
expenditures (labor expenditures over GDP) to measure employment protection. Labor expenditures
are another way countries can protect employees from dismissals: countries tax employers and provide
bene�ts, such as unemployment insurance, from a common pool. The main di¤erence is that �rms bear
the costs of labor expenditures regardless of whether they dismiss employees, whereas EPL apply to each
dismissal. We expect no e¤ect of employment expenditures on the likelihood of group a¢ liation and
�nancial performance, as this protection does not impose costs on labor readjustment across markets.12
Alternative measures of employment protection laws. We utilize several alternative country measures
10Details on the methodology used to construct ownership links are summarized in Belenzon and Berkovitz (2010).11 In the robustness section we show that our results are robust to including �rms with missing ownership information and
classifying these �rms as standalones.12Country spending on labor expenditures varies widely. Denmark spent the largest share (4.15%) of its GDP on labor-
market expenditures, whereas the UK spent the smallest share (0.58%).
10
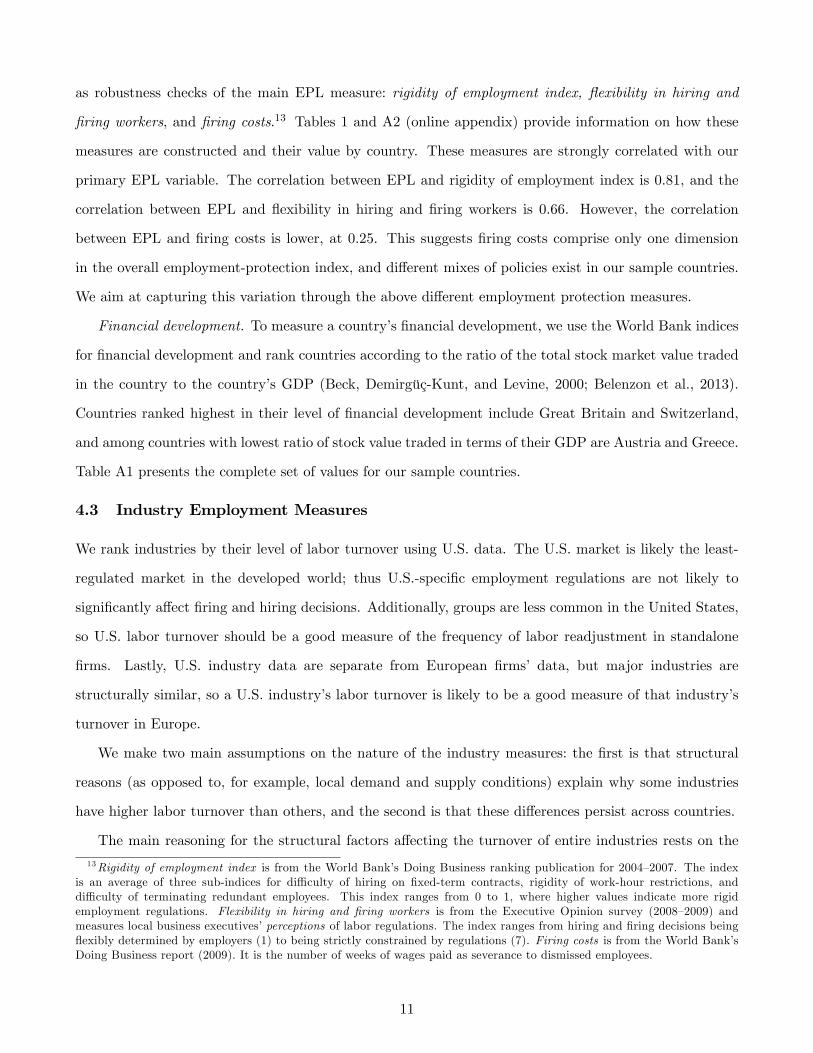
as robustness checks of the main EPL measure: rigidity of employment index, �exibility in hiring and
�ring workers, and �ring costs.13 Tables 1 and A2 (online appendix) provide information on how these
measures are constructed and their value by country. These measures are strongly correlated with our
primary EPL variable. The correlation between EPL and rigidity of employment index is 0.81, and the
correlation between EPL and �exibility in hiring and �ring workers is 0.66. However, the correlation
between EPL and �ring costs is lower, at 0.25. This suggests �ring costs comprise only one dimension
in the overall employment-protection index, and di¤erent mixes of policies exist in our sample countries.
We aim at capturing this variation through the above di¤erent employment protection measures.
Financial development. To measure a country�s �nancial development, we use the World Bank indices
for �nancial development and rank countries according to the ratio of the total stock market value traded
in the country to the country�s GDP (Beck, Demirgüç-Kunt, and Levine, 2000; Belenzon et al., 2013).
Countries ranked highest in their level of �nancial development include Great Britain and Switzerland,
and among countries with lowest ratio of stock value traded in terms of their GDP are Austria and Greece.
Table A1 presents the complete set of values for our sample countries.
4.3 Industry Employment Measures
We rank industries by their level of labor turnover using U.S. data. The U.S. market is likely the least-
regulated market in the developed world; thus U.S.-speci�c employment regulations are not likely to
signi�cantly a¤ect �ring and hiring decisions. Additionally, groups are less common in the United States,
so U.S. labor turnover should be a good measure of the frequency of labor readjustment in standalone
�rms. Lastly, U.S. industry data are separate from European �rms� data, but major industries are
structurally similar, so a U.S. industry�s labor turnover is likely to be a good measure of that industry�s
turnover in Europe.
We make two main assumptions on the nature of the industry measures: the �rst is that structural
reasons (as opposed to, for example, local demand and supply conditions) explain why some industries
have higher labor turnover than others, and the second is that these di¤erences persist across countries.
The main reasoning for the structural factors a¤ecting the turnover of entire industries rests on the
13Rigidity of employment index is from the World Bank�s Doing Business ranking publication for 2004�2007. The indexis an average of three sub-indices for di¢ culty of hiring on �xed-term contracts, rigidity of work-hour restrictions, anddi¢ culty of terminating redundant employees. This index ranges from 0 to 1, where higher values indicate more rigidemployment regulations. Flexibility in hiring and �ring workers is from the Executive Opinion survey (2008�2009) andmeasures local business executives�perceptions of labor regulations. The index ranges from hiring and �ring decisions being�exibly determined by employers (1) to being strictly constrained by regulations (7). Firing costs is from the World Bank�sDoing Business report (2009). It is the number of weeks of wages paid as severance to dismissed employees.
11
composition of occupations in an industry. If the share of an industry�s total employment is dominated
by a certain occupational group of workers, then their turnover would drive the industry�s turnover rates.
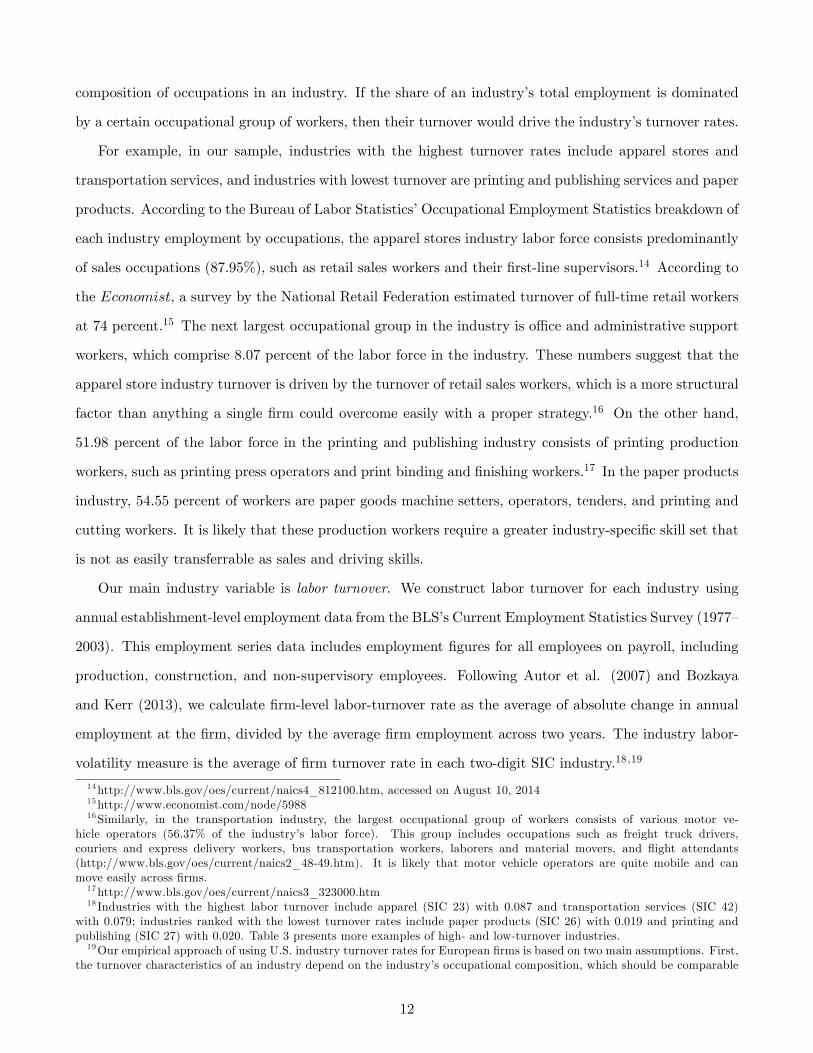
For example, in our sample, industries with the highest turnover rates include apparel stores and
transportation services, and industries with lowest turnover are printing and publishing services and paper
products. According to the Bureau of Labor Statistics�Occupational Employment Statistics breakdown of
each industry employment by occupations, the apparel stores industry labor force consists predominantly
of sales occupations (87.95%), such as retail sales workers and their �rst-line supervisors.14 According to
the Economist, a survey by the National Retail Federation estimated turnover of full-time retail workers
at 74 percent.15 The next largest occupational group in the industry is o¢ ce and administrative support
workers, which comprise 8.07 percent of the labor force in the industry. These numbers suggest that the
apparel store industry turnover is driven by the turnover of retail sales workers, which is a more structural
factor than anything a single �rm could overcome easily with a proper strategy.16 On the other hand,
51.98 percent of the labor force in the printing and publishing industry consists of printing production
workers, such as printing press operators and print binding and �nishing workers.17 In the paper products
industry, 54.55 percent of workers are paper goods machine setters, operators, tenders, and printing and
cutting workers. It is likely that these production workers require a greater industry-speci�c skill set that
is not as easily transferrable as sales and driving skills.
Our main industry variable is labor turnover. We construct labor turnover for each industry using
annual establishment-level employment data from the BLS�s Current Employment Statistics Survey (1977�
2003). This employment series data includes employment �gures for all employees on payroll, including
production, construction, and non-supervisory employees. Following Autor et al. (2007) and Bozkaya
and Kerr (2013), we calculate �rm-level labor-turnover rate as the average of absolute change in annual
employment at the �rm, divided by the average �rm employment across two years. The industry labor-
volatility measure is the average of �rm turnover rate in each two-digit SIC industry.18,19
14http://www.bls.gov/oes/current/naics4_812100.htm, accessed on August 10, 201415http://www.economist.com/node/598816Similarly, in the transportation industry, the largest occupational group of workers consists of various motor ve-
hicle operators (56.37% of the industry�s labor force). This group includes occupations such as freight truck drivers,couriers and express delivery workers, bus transportation workers, laborers and material movers, and �ight attendants(http://www.bls.gov/oes/current/naics2_48-49.htm). It is likely that motor vehicle operators are quite mobile and canmove easily across �rms.17http://www.bls.gov/oes/current/naics3_323000.htm18 Industries with the highest labor turnover include apparel (SIC 23) with 0.087 and transportation services (SIC 42)
with 0.079; industries ranked with the lowest turnover rates include paper products (SIC 26) with 0.019 and printing andpublishing (SIC 27) with 0.020. Table 3 presents more examples of high- and low-turnover industries.19Our empirical approach of using U.S. industry turnover rates for European �rms is based on two main assumptions. First,
the turnover characteristics of an industry depend on the industry�s occupational composition, which should be comparable
12

Prevalence of collective labor agreement contracts may in�uence the U.S.-based turnover rates, as
union contracts may act as a substitute for country employment regulations. We use the Current Popu-
lation Survey data from the Bureau of Labor Statistics between 2003 and 2007 to determine industries
with higher shares of employees covered by labor union contracts. All reported speci�cations exclude
industries with labor union membership of over 25 percent of the labor force in the U.S. Our results are
not sensitive to the speci�c threshold of industry unionization.
To further test our assumption that industries in the U.S. are structurally similar in turnover rates
to industries in Europe, we construct industry-level turnover measure using all the �rm-level data in our
European sample countries between 1997 and 2007. The raw correlation between the U.S.-based turnover
measure and Europe-based measure is about 0.40. In the econometric analysis we present results using
the European labor turnover measure.20
4.4 Descriptive Statistics
Table 2 presents summary statistics for �rms and groups in our sample. The average �rm has 92 employees
(a median of 8) and generates $25.7 million in annual sales ($1.1 million median). 22 percent of the �rms
are a¢ liated with one of the 68,137 corporate groups in our sample. The average group has a total of
four a¢ liates (with a 90th percentile of 6). The average group holds around $1 billion in assets; however,
groups at the highest end of the distribution seem to drive this magnitude, because the median is $10
million, and the 90th percentile is $271 million. A¢ liates tend to be larger in terms of sales, total assets,
and the number of employees, but similar to standalone �rms in terms of age (Table A2). Interestingly,
we �nd that a¢ liates have much higher turnover than standalone �rms, consistent with the basic premise
of this paper of higher labor-adjustment costs for standalone �rms.
[Insert Tables 1 and 2 here]
across countries. Second, the ranking of the industry turnover should hold within a country� even if the overall turnoverrates are higher in U.S. than in the EU, within a country, industry turnover should maintain similar ranking from low tohigh. We compare the structural composition of select industries in the U.S. and Germany and rank industry turnover rateswithin Germany to provide additional evidence for the comparability we argue for. We thank an anonymous reviewer for thesuggestion of using Germany as an example due its unique labor practices. Detailed analyses are available upon request.20The European-based measure is subject to endogeneity concerns, because aggregate economic conditions that a¤ect
labor turnover in Europe are also likely to a¤ect �rm performance in our sample. However, it is important to note that theEuropean labor turnover measure is based on millions of �rms and thus is unlikely to be a¤ected by �rm-speci�c shocks.
13
5 Econometric Speci�cation
We build on the notion that �rms encompass multiple businesses inside their boundaries to create internal
markets and examine the e¤ects of labor markets frictions on the way �rms organize and on how well they
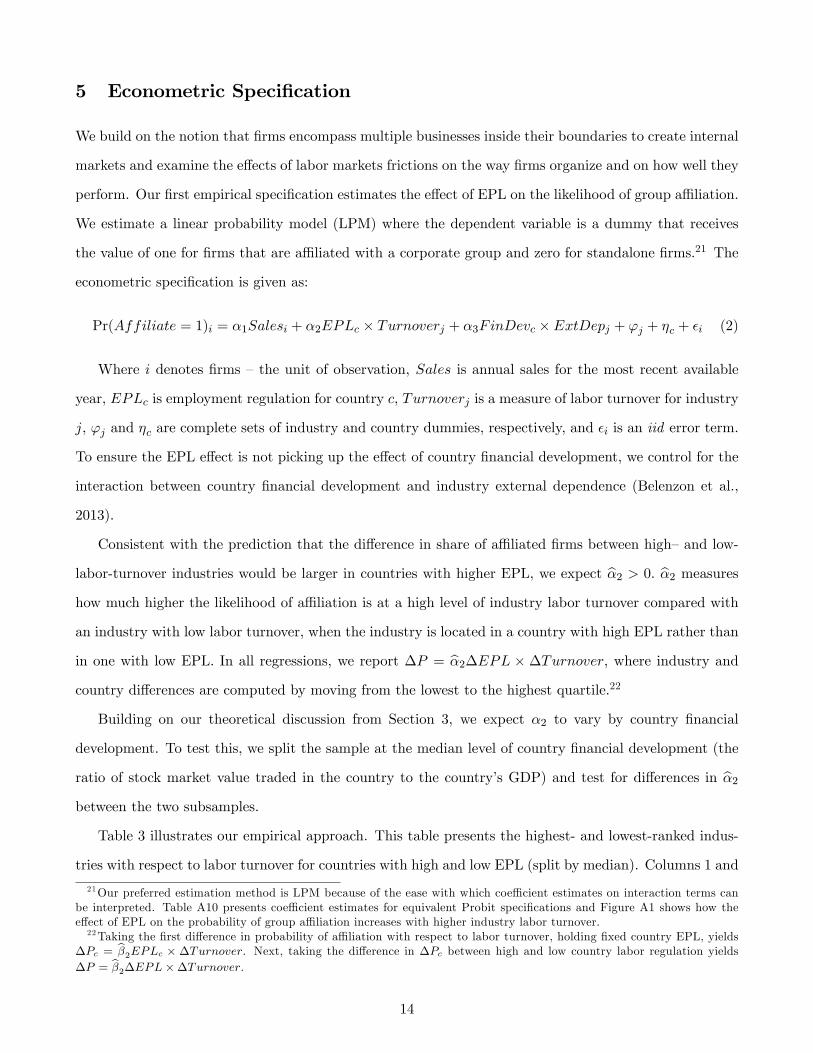
perform. Our �rst empirical speci�cation estimates the e¤ect of EPL on the likelihood of group a¢ liation.
We estimate a linear probability model (LPM) where the dependent variable is a dummy that receives
the value of one for �rms that are a¢ liated with a corporate group and zero for standalone �rms.21 The
econometric speci�cation is given as:
Pr(Affiliate = 1)i = �1Salesi + �2EPLc � Turnoverj + �3FinDevc � ExtDepj + 'j + �c + �i (2)
Where i denotes �rms �the unit of observation, Sales is annual sales for the most recent available
year, EPLc is employment regulation for country c, Turnoverj is a measure of labor turnover for industry
j, 'j and �c are complete sets of industry and country dummies, respectively, and �i is an iid error term.
To ensure the EPL e¤ect is not picking up the e¤ect of country �nancial development, we control for the
interaction between country �nancial development and industry external dependence (Belenzon et al.,
2013).
Consistent with the prediction that the di¤erence in share of a¢ liated �rms between high�and low-
labor-turnover industries would be larger in countries with higher EPL, we expect b�2 > 0: b�2 measureshow much higher the likelihood of a¢ liation is at a high level of industry labor turnover compared with
an industry with low labor turnover, when the industry is located in a country with high EPL rather than
in one with low EPL. In all regressions, we report �P = b�2�EPL � �Turnover, where industry andcountry di¤erences are computed by moving from the lowest to the highest quartile.22
Building on our theoretical discussion from Section 3, we expect �2 to vary by country �nancial
development. To test this, we split the sample at the median level of country �nancial development (the
ratio of stock market value traded in the country to the country�s GDP) and test for di¤erences in b�2between the two subsamples.
Table 3 illustrates our empirical approach. This table presents the highest- and lowest-ranked indus-
tries with respect to labor turnover for countries with high and low EPL (split by median). Columns 1 and
21Our preferred estimation method is LPM because of the ease with which coe¢ cient estimates on interaction terms canbe interpreted. Table A10 presents coe¢ cient estimates for equivalent Probit speci�cations and Figure A1 shows how thee¤ect of EPL on the probability of group a¢ liation increases with higher industry labor turnover.22Taking the �rst di¤erence in probability of a¢ liation with respect to labor turnover, holding �xed country EPL, yields
�Pc = b�2EPLc � �Turnover. Next, taking the di¤erence in �Pc between high and low country labor regulation yields�P = b�2�EPL��Turnover.
14
2 present the share of group a¢ liates in each industry by two levels of EPL: low and high, respectively.
Column 3 presents the di¤erence in group a¢ liation in respective industries between countries with high
and low EPL, after removing country and industry e¤ects. A clear di¤erence in group a¢ liation is present
between industries with the highest and lowest turnover: a larger share of �rms in industries with the
highest turnover are a¢ liates, especially in countries with stricter (above the median) EPL. The di¤erence
in a¢ liation ranges from 22.4 percent to 40.5 percent in industries with the highest turnover; in industries
with the lowest turnover, the di¤erence between high- and low-EPL countries is much smaller, between
6.2 percent and 16.4 percent.
[Insert Table 3 here]
Our second empirical speci�cation investigates how the di¤erence in �nancial performance between
group a¢ liates and standalone �rms relates to EPL and �nancial development, as follows:
yit = �1Affiliatei + �2Affiliatei � EPLc + Z 0� + 'j + �c + �it (3)
Where yit denotes measures of �rm performance (sales and employment growth, return on assets,
pro�t margin) and Affiliatei is a dummy variable that receives the value of one for group a¢ liates
and zero for standalone �rms. Our interest lies at how the bene�t of group a¢ liation varies with EPL,
captured by the estimate b�2: Our theory predicts that �2 varies by country �nancial development. Totest this theory, we split the sample at the median level of country �nancial development (the ratio of
stock market value traded in the country to the country�s GDP) and test for di¤erences in b�2 betweenthe two subsamples for each �rm performance measure. We expect b�2 to be larger in the subsample of�nancially developed countries.
6 Results
6.1 Likelihood of Group A¢ liation
Table 4 presents the estimation results for the e¤ect of EPL on the likelihood of group a¢ liation. As
expected, we �nd that group a¢ liation is more likely in countries with stronger EPL, especially in indus-
tries with high labor turnover (b�2 > 0). Based on the estimates from column 1, the di¤erential e¤ect of
ILMs redeployment, �P; is 3.5 percentage points: the di¤erence between the highest and lowest deciles
of industry labor turnover rises by 3.5 percentage points (or 16% of the sample average share of group
15
a¢ liates) when moving from the lowest- to the highest-EPL country.23 Figure 3 presents the results by
country and shows that the di¤erences in the likelihood of group a¢ liation between the lowest and highest
deciles of industry labor turnover increase with country EPL from 4.4 percent in Great Britain to 12.7
percent in Greece.
Column 2 adds the OECD index of labor expenditures. The measure of country labor expenditures
is not related to �rm-speci�c �ring or hiring decisions and thus should not a¤ect group a¢ liation. As
expected, the coe¢ cient estimate of labor expenditures is zero.
Column 3 further tests our theory by including all possible interactions of country EPL and �nancial
development with industry labor turnover and external �nance dependence. As expected, the interactions
of EPL with external �nance dependence and �nancial development with industry labor turnover are
statistically insigni�cant. The estimated coe¢ cient on the key interaction of interest between EPL and
industry labor turnover remain robust. This pattern of results reassures us that combining our country-
industry measures is indeed consistent with our proposed mechanism.
In columns 1�3, industry labor turnover data are from the U.S. BLS Current Employment Statistics
Survey. To test the concern that U.S. data do not capture well worker mobility patterns in Europe, we
use an alternative European data source on employment turnover. We follow the same procedure using all
�rms in our sample countries in Amadeus (1997�2007). The correlation between our primary U.S.-based
industry labor-turnover measure and Europe-based alternative measure is about 0.40. Column 4 presents
the estimation results for the alternative industry labor turnover measure using employment turnover
rates based on �rms in Europe. The results remain robust.24
Having established a strong positive e¤ect of EPL on the likelihood of group a¢ liation, we turn to
examine how this e¤ect varies by country �nancial development. If labor cannot be easily substituted for
capital, we expect a stronger EPL e¤ect in countries with more developed �nancial markets. Columns
5�6 split the sample by high and low levels of country �nancial development and present results that are
consistent with this conjecture. The estimated coe¢ cient on the country-industry interaction term for high
�nancial development sub-sample is large, positive, and signi�cant (column 5) compared to the smaller
23The unreported results of the level e¤ects for industry labor turnover indicate group a¢ liation is more likely in industrieswith more turnover (estimated coe¢ cient on industry labor turnover is positive and signi�cant).24Our industry ranking by labor turnover may be noisy, because turnover also includes voluntary labor separations, which
are not subject to EPL. To test the robustness of our results, we create a measure for industry involuntary labor turnoverby using the data on employer-initiated separations from the BLS�s Job Openings and Labor Turnover Survey (2003�2007).Using monthly industry-level data on layo¤s and involuntary dismissals due to reorganizations, elimination of positions, and�rings, we calculate industry-level involuntary labor turnover rate as average rate of layo¤s. Because EPL do not applyto voluntary separations, this measure provides a potentially �cleaner� ranking of industries by separating voluntary frominvoluntary turnover. Using this alternative industry ranking yields very similar estimates to those presented in column 1.
16
and statistically insigni�cant estimated coe¢ cient for the low �nancial development sample (column 6).
We reject the null hypothesis that these two coe¢ cients are equal to one another (p-value<0.01).
We further test our prediction that internal labor markets induce a stronger competitive advantage
in environments where external capital is �exible by splitting industries by their dependence on external
�nance. We expect that the ability to externally readjust capital should matter more in industries with
greater dependence on external �nance. Our results are consistent with this view. Table A3 (online
appendix) shows the EPL e¤ect is stronger in industries with above median value of external dependence
(column 1), and that this result is driven by countries with high �nancial development (column 3).
[Insert Table 4 and Figure 3 here]
6.2 Financial Performance
Table 5 examines how the e¤ect of group a¢ liation on �nancial performance varies with EPL and �nancial
development. We expect the competitive advantage of group a¢ liation due to higher labor �exibility to
be stronger in countries with high �nancial development. This prediction in con�rmed using multiple
measures of �nancial performance.
Columns 1�6 estimate growth speci�cations. When pooling all countries together, there is no di¤erence
in growth rates between a¢ liates and standalone �rms, and this does not vary with EPL (column 1).
However, splitting the sample by countries with below- and above-median values of �nancial development
uncovers substantial variation. Group a¢ liates grow faster than standalone �rms, especially in strong-
EPL countries with high �nancial development (column 2); however, there is no di¤erence in growth
rates in low-�nancial-development countries (column 3). The range of the e¤ect is large. Based on the
estimates from column 2, moving from weakest- to strongest-EPL country doubles the di¤erence in growth
rates between a¢ liates and standalone �rms (the coe¢ cient estimate on group a¢ liation dummy rises
from 0.021 to 0.043). Relative to the sample average, these estimates imply that group a¢ liates grow 29
percent faster than standalones in the lowest-EPL country (Great Britain), and at a rate of 48 percent
faster in the strongest-EPL country (Greece).
Similar e¤ects hold for measures of �rm pro�tability (columns 7�12) and labor productivity (columns
13�15). In all cases the e¤ect of group a¢ liation rises with EPL in high-�nancial-development countries,
but not in low-�nancial-development countries.
[Insert Table 5 here]
17
6.3 Evidence on Internal Redeployment
We complement our �ndings that internal labor markets can be a source of competitive advantage with
direct evidence on the prevalence of internal labor markets in strong-EPL countries. First, we investigate
whether group a¢ liates redeploy workers to other a¢ liates when industry shocks prompt readjustment
of labor. Second, we juxtapose the incidence of internal and external managerial mobility in conditions
of higher EPL. The patterns of within-group labor redeployment in response to industry shocks, together
with the direct evidence of internal managerial mobility, provide important con�rmation of intra�rm labor
redeployment� a phenomenon particularly evident in countries with high EPL.
6.3.1 Intra-group labor mobility and Chinese import penetration
As industry conditions change, corporate group structure is advantageous because a¢ liates can shift
resources within groups more e¢ ciently than through external markets. We examine how a¢ liate em-
ployment size changes in response to negative shocks in the industry. We use changes in the industry
level of imports from China as an exogenous trigger of redeployment, and examine changes in a¢ liate
employment size when imports increase for the focal a¢ liate industry and for the rest of the group.
Following Bloom et al. (2011), we calculate the level of Chinese import penetration as the share of the
value of imports originating from China of total imports in an industry and country from 1999 to 2006.25
We observe a signi�cant rise in imports from China over time across industries: import rates more than
double from an average of 2 percent in 1999 to 5 percent in 2006.26
We distinguish between two types of Chinese import penetration for each a¢ liate: the share of imports
from China to the focal a¢ liate�s industry, and the share of imports to industries of other group a¢ liates
that do not operate in the focal a¢ liate�s industry. We also use annual changes in the share of imports from
China to measure changes in import penetration to the focal a¢ liate�s industry, and we use the largest
change in the share of imports from China to industries of other group a¢ liates to measure industry
shocks in the rest of the group for that year. We estimate the relationship between these two types of
import penetration and the a¢ liate�s employment size, controlling for group and year e¤ects.
Table 6 presents the estimation results. Our �ndings are consistent with internal labor redeployment.
25The import data is from the UN Comtrade database that tracks annual bilateral import and export trade volumesbetween pairs of countries. We aggregate the trade value between China and countries in our sample to industry four-digitSIC level from the six-digit product level, and normalize the Chinese imports by domestic production �gures from Eurostat�sProdcom database. See Bloom et al. (2011) for more details.26The industry-level correlation between the import penetration measure and the share of group a¢ liates in the industry
is -0.09 and insigni�cant. The weak relationship provides assurance that the import shock is exogenous to the share of �rmsa¢ liated with groups in the industry.
18
As Chinese imports increase in the focal a¢ liate�s industry, employment size in that a¢ liate drops, but
as Chinese imports increase in industries in which the rest of the group is operating, the focal a¢ liate�s
employment size increases (column 1). These results suggest a¢ liates are shifting labor across the group
as their industry conditions deteriorate, and are absorbing labor when other a¢ liates need to restructure.
Next, in columns 2 and 3, we split the sample by the country-level median of EPL. Consistent with the
main predictions, we �nd ILMs are active primarily in high-EPL countries (column 2).
Columns 4�5 provide more �ne-grained evidence on the group internal labor markets. Groups in
our sample vary by their geographical scope. Presumably, mobilizing workers should be more costly in
dispersed groups. Thus, consistent with worker mobility, we expect Chinese import penetration to be a
stronger trigger of mobility in groups that are more geographically concentrated. We obtain a city location
for each a¢ liate in the group and compute a group-level measure of geographical concentration.27 We
split the sample into collocated and dispersed groups by median group distance. As expected, we �nd a
stronger Chinese penetration e¤ect on worker mobility in geographically concentrated groups (column 4).
Moreover, if the mobility of low-skilled labor is more sensitive to moving costs than that of high-skilled
labor, our evidence also suggests that the Chinese import e¤ect is driven by lower-skilled labor.
We next examine the prevalence of internal markets for high-skilled labor� managers of group a¢ liates.
[Insert Table 6 here]
27The detailed process of constructing the measure is as follows. We �rst obtain the latitude and longitude coordinatesof each city our sample �rms are located in. Then, for each corporate group, we calculate its geographic mean positionby determining the mean X and Y coordinates and then calculating the radius of the great-circle by using the squaredcoordinate deviates. The radius of the great-circle is analogous to one standard deviation. To calculate the distance betweenthe location of each �rm and group�s geographic mean, we use the haversine method (Sinnott, 1984; Fotheringham, Brundson,and Charlton, 2000). If x1 and x2 are the latitudes and y1 and y2 are longitudes of two points on the surface of the earth inradians, then the haversine of the central angle � between the points is given by:
hav(�) = hav(x2 � x) + cos(x1) � cos(x2) � hav(x2 � x)where the haversine of angle � is de�ned as
hav(�) = sin2(�
2)
The value for � is obtained by solving:
� = 2 � a tan 2�p
hav(�);p1� hav(�)
�,
where atan2(x; y) denotes the four-quadrant inverse tangent function of x and y. Once � is known, the distance betweenthe two points, d, is given by d = R � �; where R is the radius of the Earth and equals 6,378.1 km (which is assumed forsimplicity to be a perfect sphere).The �nal measure of group�s geographic dispersion is given by the linear standard distance formula:
Linear Standard Distancej =
nXi=1
di
n
where di is the distance of a¢ liate i from the geographic mean of group j, with n a¢ liates. The more dispersed groups havelarger standard distances, and clustered groups have smaller standard distances.
19
6.3.2 Managerial mobility
We proceed to examine direct mobility patterns of individual workers� managers of group a¢ liates. We
document the prevalence of internal labor markets for managers of group a¢ liates and show that this
internal market is more active in countries with higher EPL. Extending the worker mobility analysis
to a¢ liate managers enriches our study by showing that internal labor markets are important not only
to lower-skilled labor, which is likely to be a¤ected by Chinese import penetration, but also to higher-
ranked mid-level managers in the group. Our data provides information on �rms�upper management,
so we select managers for whom we have complete employment information between 2002 and 2007 to
determine managerial mobility patterns. Within each corporate group, we track whether a particular
manager stayed with the same a¢ liate (non-mover), moved to another a¢ liate within a group (within-
group mover), or moved out of the group between 2002 and 2007 (out-of-group mover).
We identify 259,748 unique managers that work for 53,501 corporate groups in the period 2002�2007,
of which 12.8 percent moved internally. Using a share of internal moves in each corporate group, Table
7 shows a clear pattern of higher internal mobility in large groups of strong EPL countries. We use the
share of within-group moves to test the di¤erence between managerial moves in countries with high and
low EPL (by median). Consistent with the ILMs theory, we expect the share of intra-group mobility to
be higher when a group operates in countries with high EPL. The results con�rm this. The comparison-
of-means test shows a consistently higher share of internal moves for a¢ liate managers in countries with
high versus low EPL. The di¤erence grows with the size of the group: for small groups, the di¤erence in
means is 0.8 percent; for the largest groups, the di¤erence is highly signi�cant at 12.9 percent.
Our analysis underscores the prevalence of internal labor markets, both for general workers and for
a¢ liate managers, especially in countries with strong EPL. Showing that internal labor markets are an
important instrument to mobilize workers within groups supports our view that internal labor markets
can be a source of competitive advantage when labor is rigid.
[Insert Table 7 here]
6.4 The Dynamics of Group A¢ liation
In this section we explore how EPL a¤ect the dynamics of group a¢ liation. We are interested in how
the origin of groups is related to EPL. Speci�cally, we investigate how many of the �rms we classify
as standalones in 2007 change their a¢ liation and become part of a group by 2011. For the sample of
20
standalone �rms in our 2007 sample, we collect updated information from the 2012 ownership version of
Amadeus (which provides ownership information for 2011). We focus on standalone �rms with fewer than
50 employees in 2007 to trace the extent to which their growth pattern is associated with group a¢ liation,
either by joining existing groups or by forming new ones. We �nd considerable changes in ownership:
7.2 percent of standalone �rms become group a¢ liates by 2011, most of which joined existing groups. A
major driver of ownership change is growth. The average employment growth rate between 2007 and 2011
is -1.1 percent. This negative growth rate is driven mostly by standalone �rms that did not become part
of groups, with an average growth rate of -2.4 percent, as compared to positive growth of 5.9 percent for
�rms that joined groups as of 2011. Importantly, the ability and willingness of standalone �rms to grow
may be a central mechanism that explains the long-term distribution of group a¢ liation across countries
and industries. Table A4 summarizes these ownership change patterns.28
Table 8 presents the estimation results for the e¤ect of EPL on the likelihood of transitioning from
standalone to group a¢ liation. Consistent with our previous �ndings, transitioning to a¢ liates is more
likely when EPL are strong and labor turnover is high (column 1). Moreover, this e¤ect is driven by
high-growth standalone �rms, implying that the process by which groups emerge is related not only to
the �exibility of external labor markets, but also to the need to grow sales (columns 2�3).
Lastly, we explore how changes in EPL a¤ect transitioning to group a¢ liation. There have been
substantial changes in EPL during that period, with most countries strengthening EPL. We use the
change in the rigidity of the employment index from the World Bank between 2004 and 2010 to construct
a measure of each country�s increase in EPL. We construct an indicator that equals 1 if the rigidity index
in a country increased between 2004 and 2010 and equals 0 if the index stayed the same or decreased in
strictness. We observe that change toward a¢ liation is higher in countries that have increased their EPL
and in industries with higher turnover (column 4), and the results are comparably strong for �rms that
formed new groups (column 5) and �rms that joined existing groups (column 6). These results provide
new insights on how EPL a¤ect the formation of corporate groups over time.
[Insert Table 8 here]
28We observe 31,823 standalone �rms in 2011 that are classi�ed as parent companies with at least one subsidiary (thisnumber comprises 39.5% of all �rms that changed a¢ liation). Next, we classify �rms that join existing groups, by using the2011 ownership structure and identifying those that were acquired between 2007 and 2011 using BvD�s Zephyr database, orwere listed as subsidiaries in the 2011 ownership database. We determine that 48,683 �rms joined existing groups between2007 and 2011 (this number represents 60.5% of �rms that changed ownership).
21
6.5 Robustness Checks
We performed additional robustness checks, which we summarize in this section. The full estimation
results for these tests are included in the online appendix.
Linearity in industry ranking. We check the sensitivity of our results to non-linear e¤ects of industry
turnover. We divide industry turnover into quartiles and interact each with EPL in order to check for
non-linear industry e¤ects, as well as to have a more stable classi�cation of industries by turnover level.
The results show the country-industry e¤ect is quite monotonic, with the strongest e¤ect for the highest
quartile of industry turnover. Column 1 in Table A5 presents the estimation results.
Alternative employment protection laws. Columns 2�4 in Table A5 present estimation results to
alternative EPL measures: employment rigidity, �exibility in hiring and �ring, and �ring costs. Our
results continue to hold for all of these employment protection measures.
Unit of observation. In our main speci�cation, the unit of observation is the individual �rm. We check
the sensitivity of our results for unit-observation selection by estimating a collapsed model in which the
unit of observation is country-industry.29 As shown in column 5 of Table A5, this estimation yields a
comparable estimated EPL e¤ect.
Acquired a¢ liates. Evidence suggests acquired units are less likely to take part in intra-group mobility
of talent (Belenzon et al. 2014), and managers are less likely to be deployed to acquired units, because
their �rm-speci�c expertise is more valuable in internally developed units (Karim and Williams, 2012).
Using Bureau van Dijk�s Zephyr database, we identify acquired a¢ liates and exclude them from the
sample. The results continue to hold (column 6, Table A5).
Removing outliers. A concern is that our results are sensitive to including very small or very large
�rms in our estimation sample. We limit the estimation sample to �rms with a number of employees
between the 1st and 99th percentile of the employment distribution to drop the smallest �rms, which
usually are not subject to EPL, and the largest �rms, which are likely to have internal labor markets and
thus are less likely to be a¤ected by labor rigidity. The results remain robust (column 7, Table A5).
Missing ownership information. Thus far, we have excluded �rms with no ownership information. We
check the sensitivity of our results to dropping these �rms by including all �rms with missing ownership
information as standalones. We assume �rms are standalones unless we have information indicating group
29For each country and industry, we calculated the average share of a¢ liates and collapsed the data to the country-industrylevel, resulting in 3,457 observations for 288 three-digit SIC industries in 15 countries (some countries have fewer industriesrepresented than others).
22

membership. This procedure more than doubles the number of observations in our estimation sample,
and the results are robust to the inclusion of �rms with no ownership information (column 8, Table A5).
Removing individual countries. Table A6 checks whether individual country drives our results, by
removing individual countries from the sample and re-estimating our model separately for each subsample
of excluded country. Our results continue to hold. The estimate of the coe¢ cient on the interaction
between industry labor turnover and EPL is always positive and signi�cant.30
Firm size.We examine how the e¤ect of EPL on group a¢ liation varies by �rm size. Large standalone
�rms are likely to have their own internal labor markets and therefore should be less sensitive to country
regulations than small standalone �rms with limited employment pools from which to draw. Thus, we
expect the e¤ect of ILMs redeployment to be more pronounced when comparing smaller standalone �rms
with a¢ liated �rms of similar size. Columns 1�2 in Table A7 con�rm this prediction when splitting the
sample by �rms with above and below 50 employees. Results are robust to alternative employment cuto¤s.
Group characteristics. We proceed to examine how our results vary by group characteristics. Columns
3�11 in Table A7 present the estimation results for distinguishing between groups that are small or large,
diversi�ed or specialized, family held or widely held, and domestic or multinational. Larger groups have
more internal resources to maintain steady growth and to o¤er their workforce less risky employment
prospects. Diversi�ed groups can provide an additional insurance from external business �uctuations and
redistribute labor as needed. The results support this view (columns 3�7).
Next, family-owned groups, which account for 5 percent of the groups in our sample, are likely to have
di¤erent considerations of internal promotions than widely held groups. Family-controlled groups may
appoint managers to key positions not by merit but by family relation, which can reduce opportunities
and incentives for high-quality personnel (Bertrand and Schoar, 2006). We �nd larger e¤ects for widely
held �rms than for family-held �rms (columns 8�9).
Involuntary turnover and layo¤s. We create a measure for industry involuntary labor turnover by
utilizing the data on employer-initiated dismissals from the Bureau of Labor Statistics Job Openings
and Labor Turnover Survey (2003�2007).31 Using monthly industry-level data on layo¤s and involuntary
dismissals due to reorganizations, elimination of positions, and �rings, we calculate industry-level invol-
untary labor turnover rate as average rate of layo¤s. Since employment protection regulations do not
30The di¤erential e¤ect varies from a low of 2.9 percent when we exclude France, to a high of 6.2 percent when we excludeGreat Britain (this constitutes about 14.2% of the sample average share of group a¢ liates when we exclude France and amuch stronger e¤ect of 31.2% without Great Britain).31Coverage of involuntary turnover and layo¤ is more limited and covers about half of our sample. Data is available at:
http://www.bls.gov/jlt/data.htm
23
apply to voluntary separations, such as quits and retirements, this measure provides additional ranking
of industries by separating voluntary and involuntary turnover. The interaction between EPL and invol-
untary turnover is positive and signi�cant with a di¤erential e¤ect of 4.4 (as compared to an e¤ect of 3.5
using the aggregate turnover measure from column 1 in Table 4).
7 Conclusion and Discussion
This paper examines the competitive advantage of internal labor markets in environments where external
labor rigidities constrain the ability of standalone �rms to compete by adjusting their human resources
when economic conditions change. We build on the notion that �rms encompass multiple businesses inside
their boundaries to create internal markets and study how frictions in external markets for labor and capi-
tal induce a competitive advantage for corporate group a¢ liates. Our �ndings underscore the importance
of market frictions for strategy scholarship and emphasize that these frictions are multidimensional and
that their joint e¤ect on competitive advantage is complex and sometimes counterintuitive.
We make several contributions. First, by underscoring the environmental conditions that make internal
labor markets more important to competitive advantage, we draw implications to the strategic human
capital literature. Unlike physical assets, workers can freely leave the �rm (Co¤, 1997). For that reason,
employees must be motivated, either directly by sharing �rm pro�ts, or indirectly by allowing them to
perform tasks that are suboptimal to the �rm (Gambardella et al., 2013). Such costly motivations reduce
the strategic value of labor, because the rents workers generate are consumed by their higher wages and
perks. While labor stickiness can lower the �price�of human capital, it also raises the costs of readjusting
labor. We show that access to �external�internal labor markets can be a source of competitive advantage
for group a¢ liates, because those internal markets allow a¢ liates to readjust their workforce cheaply,
while still maintaining the strategic bene�ts of �stickiness� at the group level. Additionally, some of
these �external� internal markets may have lower operational costs to impart competitive advantage to
groups. If some groups face lower costs of mobility, their internal labor markets should lead to a stronger
competitive advantage relative to groups that must compensate workers�mobility more aggressively. There
are several reasons for why some groups can face more favorable internal mobility conditions, including
geographical dispersion (internal mobility should be cheaper in more geographically concentrated groups),
stronger workers�motivation due to more cohesive organizational culture and better interest alignment
(Gottschalg and Zollo, 2007), more favorable internal structure con�guration (Belenzon et. al, 2014),
and less competitive external labor markets. A promising direction for future work is studying how these
24
conditions moderate the competitive advantage of internal labor markets.
Second, we demonstrate that market frictions a¤ect the competitive advantage of �rms. These market
frictions are multidimensional and their joint e¤ect on competitive advantage is complex and sometimes
counterintuitive. In particular, we show that EPL bene�t group a¢ liates, especially in countries with
developed �nancial markets. This means that groups can be an e¢ cient organizational form that mitigates
rigidities born by EPL, even when groups do not provide any �nancing advantages to their a¢ liates.
Third, we extend the perspective that groups are a response to missing country institutions. Unlike
previous papers that focus on emerging markets (e.g., Mahmood and Mitchell, 2004; Chang, Chung, and
Mahmood, 2006), our work shows that groups also exist in economies where institutions are relatively
developed. Our �ndings are consistent with the more general TCE view that groups, rather than markets,
can be a more e¢ cient way to organize production, even in modern economies. When market frictions
are signi�cant, the costs of moving resources internally could be lower than the costs of moving the same
resources across markets. This e¢ ciency argument suggests that the role of groups in the economy may be
quite similar to that of any other large organization in advanced economies. Understanding that groups
are not a phenomenon that is restricted to underdeveloped markets and that their economic role may
be actually more pronounced when (�nancial) institutions are developed can inform debates of whether
groups, or more generally large organizations, are �paragons�or �parasites�(Khanna and Yafeh, 2007).
Fourth, this paper extends our understanding of how �rms can organize to remain �exible and adapt
to changing market conditions. An important stream of research has placed particular attention on the
construction of bu¤ers to manage the ebbs and �ows of inputs critical to the �rm (Cyert and March, 1956).
Recent studies conceptually argue and empirically show that under certain conditions it may be pro�table
to maintain excess workers or �human resource slack�when the nature of the operational environment
makes it di¢ cult for �rms to estimate their internal demand for labor (Lecuona and Reitzig, 2014). Our
�ndings expand this notion by presenting groups as an alternative to maintain �exibility without having
to bear the full costs of maintaining idle or slack workers. Future studies can examine the extent to which
heterogeneity in the composition of the worker pool across business groups facilitates the movement of
labor across units and, hence, reduces the frictions inherent of this internal mechanism.
Lastly, our theoretical discussion from Section 3 generates predictions and insights that can inspire
future work. Our main prediction relates to the elasticity of substitution between labor and capital, which
plays a central role in determining how the strategic value of labor �exibility varies with capital �exibility.
Future work can further test our logic by classifying industries by how easy it is to substitute labor with
25
capital. Using the 2008 �nancial crisis as an exogenous shock to the relative price of capital should be
a promising empirical framework to study how the strategic value of labor �exibility has changed after
capital markets have become more rigid. This line of inquiry can also shed light on how the competitive
advantage of groups changes with economic downturns or upturns.
References[1] Autor, D. H., W. R. Kerr, and A. D. Kugler. 2007. Does employment protection reduce productivity?
Evidence from U.S. states. The Economic Journal, 117(521): F189�F217.
[2] Barney, J. 1986. Strategic factor markets: Expectations, luck, and business strategy. ManagementScience, 32(10): 1231�1241.
[3] Beck, T., A. Demirgüç-Kunt, and R. Levine. 2000. A new database on �nancial development andstructure. World Bank Economic Review, 14(3): 597�605 (updated in 2007).
[4] Belenzon, S., and T. Berkovitz. 2010. Innovation in business groups. Management Science, 56(3):519�535.
[5] Belenzon, S., T. Berkovitz, and L. Rios. 2013. Capital markets and �rm organization: How �nancialdevelopment shapes European corporate groups. Management Science, 59: 1326�1343.
[6] Belenzon, S., A. Patacconi, and U. Tsolmon. 2014. Managerial redeployment, ownership structure,and family ties. Working Paper.
[7] Bertrand, M., and A. Schoar. 2006. The role of family in family �rms. The Journal of EconomicPerspectives, 20(2): 73�96.
[8] Bloom, N., M. Draca, and J. Van Reenen. 2011. Trade induced technical change? The impact ofChinese imports on innovation, di¤usion and productivity. Review of Economic Studies, forthcoming.
[9] Bozkaya, A., and W. R. Kerr. 2013. Labor regulations and European venture capital. Journal ofEconomics & Management Strategy, 23(4): 776-810.
[10] Cestone, G., and C. Fumagalli. 2005. The strategic impact of resource �exibility in business groups.RAND Journal of Economics, 36(1): 193�214.
[11] Chandler, A. D. 1962. Strategy and structure. Cambridge, MA: MIT Press.
[12] Chang, S. J., and J. Hong. 2000. Economic performance of group-a¢ liated companies in Korea:Intragroup resource sharing and internal business transactions. Academy of Management Journal,43(3): 429�448.
[13] Chang, S. J., C. N. Chung, and I. P. Mahmood. 2006. When and how does business group a¢ liationpromote �rm innovation? A tale of two emerging economies. Organization Science, 17(5): 637�656.
[14] Chirinko, R. S. 2008. �: The long and short of it. Journal of Macroeconomics 30: 671�686.
[15] Chirinko, R. S., and D. Mallick. 2014. The substitution elasticity, factor shares, long-run growth, andthe low-frequency panel model. CESifo Working Paper Series No. 4895.
[16] Coase, R. H. 1937. The nature of the �rm. Economica, 4: 386�405.
[17] Co¤, R. W. 1997. Human assets and management dilemmas: Coping with hazards on the road toresource-based theory. Academy of Management Review, 374�402.
[18] Corporate group law for Europe: Forum Europaeum corporate group law. 2000. European BusinessOrganization Law Review, 1(2): 165�264.
26
[19] Cyert R, and J. March. 1956. Organizational factors in the theory of oligopoly. Quarterly Journal ofEconomics, 70(1): 44�64.
[20] Faccio, M., and L. H. Lang. 2001. The ultimate ownership of Western European corporations. Journalof Financial Economics, 65(3): 365�395.
[21] Fotheringham, A. S., C. Brunsdon, and M. Charlton. 2000. Quantitative geography. London: Sage.
[22] Gambardella, A., C. Panico, and G. Valentini. 2013. Strategic incentives to human capital. StrategicManagement Journal (forthcoming).
[23] Gertner, R. H., D. S. Scharfstein, and J. Stein. 1994. Internal versus external capital markets. Quar-terly Journal of Economics, 109(4): 1211�1230.
[24] Gottschalg, O., and M. Zollo. 2007. Interest alignment and competitive advantage. Academy of Man-agement Review, 32(2), 418�437.
[25] Hamermesh, D. 1993. Labor demand. Princeton, N.J.: Princeton University Press.
[26] Hartz, P. 1994. Jeder arbeitsplatz hat ein gesicht: Die Volkswagen-Lösung. Frankfurt: Campus-Verlag.
[27] Karim, S., and C. Williams. 2012. Structural knowledge: How executive experience with structuralcomposition a¤ects intra�rm mobility and unit recon�guration. Strategic Management Journal, 33(6):681�709.
[28] Khanna, T., and J. W. Rivkin. 2001. Estimating the performance e¤ects of business groups in emerg-ing markets. Strategic Management Journal, 22(1): 45�74.
[29] Khanna, T., and K. Palepu. 1997. Why focused strategies may be wrong for emerging markets.Harvard Business Review, 75(4): 41�48.
[30] Khanna, T., and Yafeh, Y. 2007. Business groups in emerging markets: Paragons or parasites?Journal of Economic Literature, 331�372.
[31] Kothen, C., W. McKinley, and A.G. Scherer. 1999. Alternatives to organizational downsizing: AGerman case study. M@n@gement, 2(3): 263�286.
[32] La Porta, R., F. Lopez-de-Silanes, and A. Shleifer. 1999. Corporate ownership around the world.Journal of Finance, 54(2): 471�517.
[33] Lecuona, J. R., and M. Reitzig. 2014. Knowledge worth having in �excess�: The value of tacit and�rm-speci�c human resource slack. Strategic Management Journal, 35(7): 954�973.
[34] Le¤, N. H. 1978. Industrial organization and entrepreneurship in the developing countries: Theeconomic groups. Economic Development and Cultural Change, 26: 661�675.
[35] Mairesse, J., B. H. Hall, and B. Mulkay. 1999. Firm-level investment in France and the United States:An exploration of what we have learned in twenty years. Annales d�Economie et de Statistiques, 55�56: 27�67.
[36] Mahmood, I. P., and W. Mitchell. 2004. Two faces: E¤ects of business groups on innovation inemerging economies. Management Science, 50(10): 1348�1365.
[37] Mahoney, J. T., and L. Qian. 2013. Market frictions as building blocks of an organizational economicsapproach to strategic management. Strategic Management Journal (forthcoming).
[38] Ober�eld, E., and D. Raval. 2014. Micro data and macro technology. NBER Working Paper No.20452.
[39] OECD Employment Outlook. 2004. OECD. http://www.oecd.org/employment/emp/oecdemploymentoutlook2004.htm(last accessed December 2014).
27
[40] Pagano, M., and P. F. Volpin. 2005. The political economy of corporate governance. The AmericanEconomic Review, 95(4): 1005�1030.
[41] Penrose, E. 1959. Theory of the growth of the �rm. New York: J. Wiley and Sons.
[42] Rajan, R., and L. Zingales. 1998. Financial dependence and growth. The American Economic Review,88: 559�586.
[43] Sinnott, R. W. 1984. Virtues of the haversine. Sky and Telescope, 68(2): 159.
[44] Seventh Council Directive 83/349/EEC of 13 June 1983 based on the Article 54 (3) (g) of the Treatyon consolidated accounts. O¢ cial Journal of the European Union. L 193, 07/18/1983, p. 1.
[45] Williamson, O. E. 1975. Markets and hierarchies. New York: Free Press.
[46] Windbichler, C. 2000. Corporate group law for Europe. European Business Organization Law Review,1: 265�286.
28

Figure 1. Distribution of Indices for EPL and Level of Financial Development
Notes: This graph plots country-level financial development and EPL indices for all 15 countries in our sample. The EPL level is the average OECD employment dismissal protection index in 1998-2008. The financial development index is the ratio of stock market total value traded in the country to the country's GDP in 2007. The correlation between the two indices is -0.35, which is insignificant at p-value of 0.05.
AustriaBelgium
Switzerland
GermanyDenmark
SpainFinland
France
Great Britain
GreeceIreland
Italy
Netherlands
Norway
Sweden
0
1
2
3
4Fi
nanc
ial d
evel
opm
ent i
ndex
1 1.5 2 2.5 3Employment regulation index
Correlation between two indices equals -0.35 (insig)
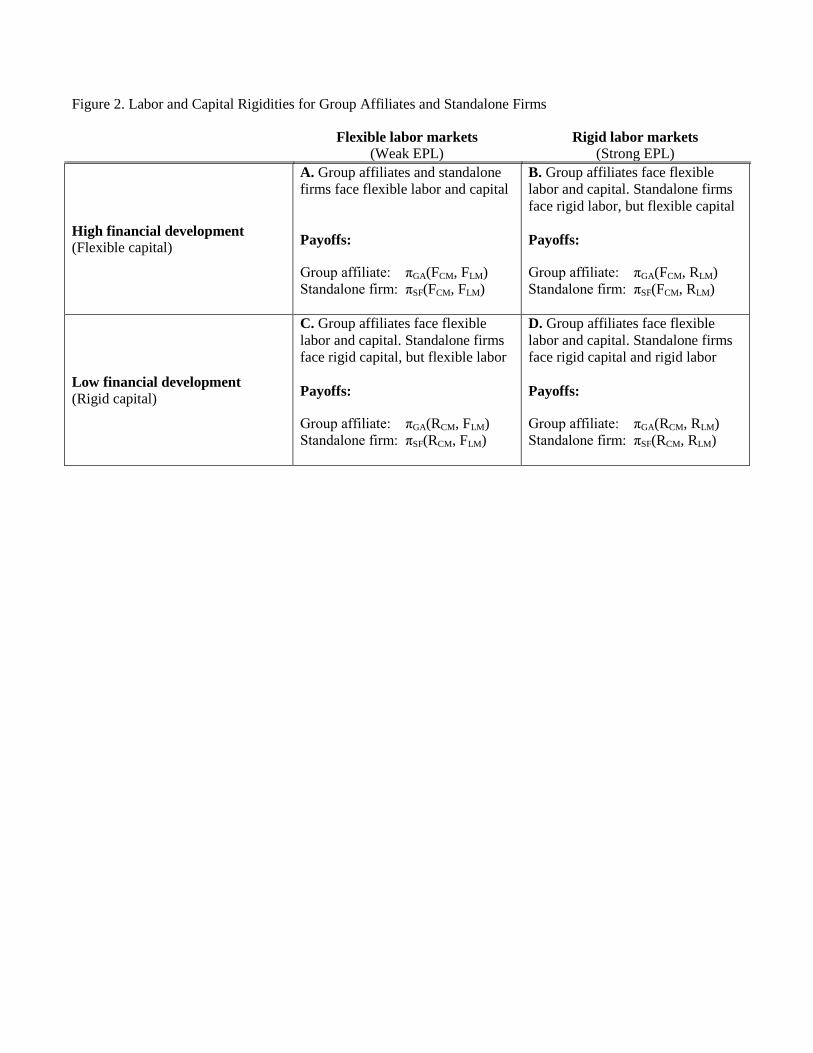
Figure 2. Labor and Capital Rigidities for Group Affiliates and Standalone Firms
Flexible labor markets
(Weak EPL) Rigid labor markets
(Strong EPL)
High financial development
(Flexible capital)
A. Group affiliates and standalone
firms face flexible labor and capital
Payoffs:
Group affiliate: πGA(FCM, FLM)
Standalone firm: πSF(FCM, FLM)
B. Group affiliates face flexible
labor and capital. Standalone firms
face rigid labor, but flexible capital
Payoffs:
Group affiliate: πGA(FCM, RLM)
Standalone firm: πSF(FCM, RLM)
Low financial development
(Rigid capital)
C. Group affiliates face flexible
labor and capital. Standalone firms
face rigid capital, but flexible labor
Payoffs:
Group affiliate: πGA(RCM, FLM)
Standalone firm: πSF(RCM, FLM)
D. Group affiliates face flexible
labor and capital. Standalone firms
face rigid capital and rigid labor
Payoffs:
Group affiliate: πGA(RCM, RLM)
Standalone firm: πSF(RCM, RLM)
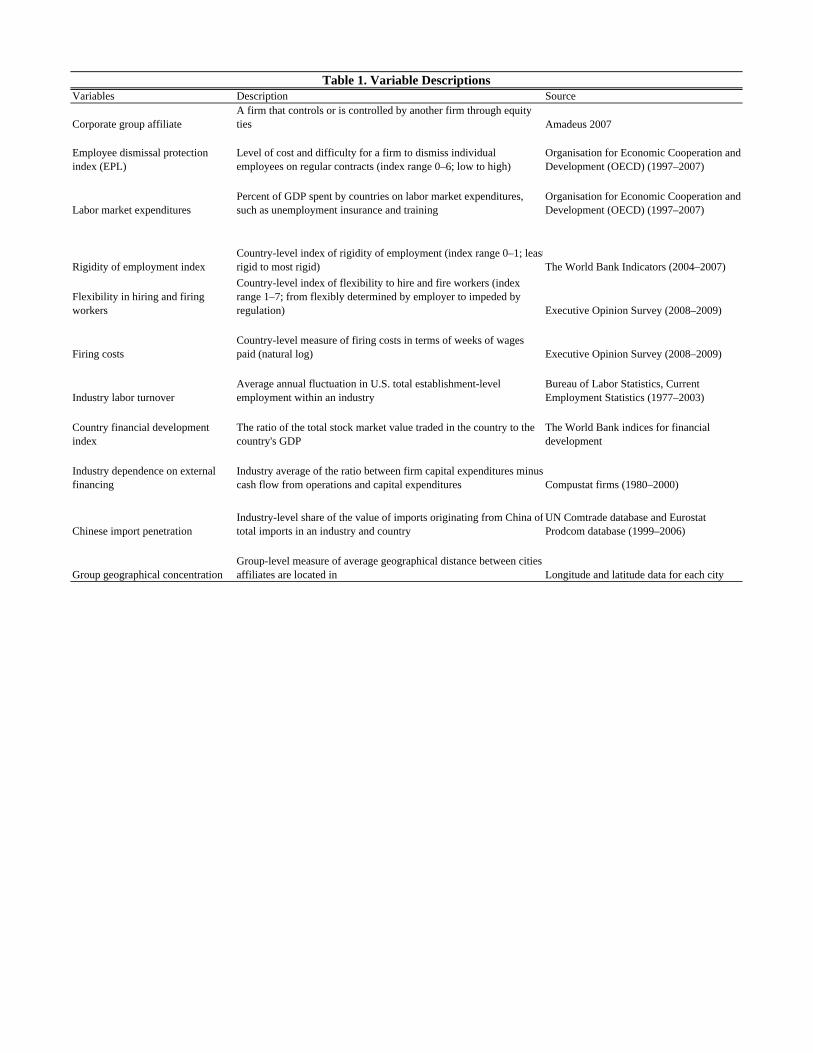
Variables Description Source
Corporate group affiliateA firm that controls or is controlled by another firm through equity ties Amadeus 2007
Employee dismissal protection index (EPL)
Level of cost and difficulty for a firm to dismiss individual employees on regular contracts (index range 0–6; low to high)
Organisation for Economic Cooperation and Development (OECD) (1997–2007)
Labor market expendituresPercent of GDP spent by countries on labor market expenditures, such as unemployment insurance and training
Organisation for Economic Cooperation and Development (OECD) (1997–2007)
Rigidity of employment indexCountry-level index of rigidity of employment (index range 0–1; leastrigid to most rigid) The World Bank Indicators (2004–2007)
Flexibility in hiring and firing workers
Country-level index of flexibility to hire and fire workers (index range 1–7; from flexibly determined by employer to impeded by regulation) Executive Opinion Survey (2008–2009)
Firing costsCountry-level measure of firing costs in terms of weeks of wages paid (natural log) Executive Opinion Survey (2008–2009)
Industry labor turnoverAverage annual fluctuation in U.S. total establishment-level employment within an industry
Bureau of Labor Statistics, Current Employment Statistics (1977–2003)
Country financial development index
The ratio of the total stock market value traded in the country to the country's GDP
The World Bank indices for financial development
Industry dependence on external financing
Industry average of the ratio between firm capital expenditures minuscash flow from operations and capital expenditures Compustat firms (1980–2000)
Chinese import penetrationIndustry-level share of the value of imports originating from China oftotal imports in an industry and country
UN Comtrade database and Eurostat Prodcom database (1999–2006)
Group geographical concentrationGroup-level measure of average geographical distance between cities affiliates are located in Longitude and latitude data for each city
Table 1. Variable Descriptions
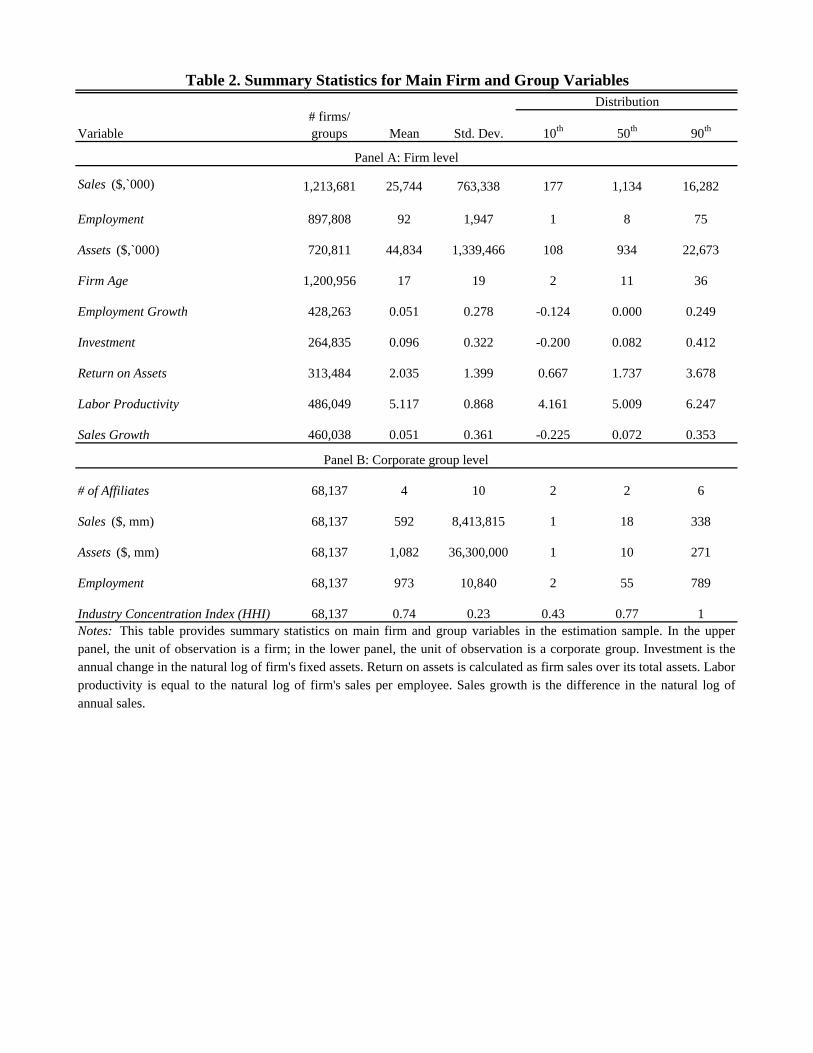
Variable# firms/ groups Mean Std. Dev. 10th 50th 90th
Sales ($,`000) 1,213,681 25,744 763,338 177 1,134 16,282
Employment 897,808 92 1,947 1 8 75
Assets ($,`000) 720,811 44,834 1,339,466 108 934 22,673
Firm Age 1,200,956 17 19 2 11 36
Employment Growth 428,263 0.051 0.278 -0.124 0.000 0.249
Investment 264,835 0.096 0.322 -0.200 0.082 0.412
Return on Assets 313,484 2.035 1.399 0.667 1.737 3.678
Labor Productivity 486,049 5.117 0.868 4.161 5.009 6.247
Sales Growth 460,038 0.051 0.361 -0.225 0.072 0.353
# of Affiliates 68,137 4 10 2 2 6
Sales ($, mm) 68,137 592 8,413,815 1 18 338
Assets ($, mm) 68,137 1,082 36,300,000 1 10 271
Employment 68,137 973 10,840 2 55 789
Industry Concentration Index (HHI) 68,137 0.74 0.23 0.43 0.77 1
Table 2. Summary Statistics for Main Firm and Group VariablesDistribution
Panel A: Firm level
Panel B: Corporate group level
Notes: This table provides summary statistics on main firm and group variables in the estimation sample. In the upperpanel, the unit of observation is a firm; in the lower panel, the unit of observation is a corporate group. Investment is theannual change in the natural log of firm's fixed assets. Return on assets is calculated as firm sales over its total assets. Laborproductivity is equal to the natural log of firm's sales per employee. Sales growth is the difference in the natural log ofannual sales.

(1) (2) (3)
Countries with Low EPL Countries with High EPL High EPL Minus Low EPL
Health and personal care services 18.5 59.0 40.5
Transportation services 20.7 50.5 29.8
Management services 24.2 49.6 25.4
Insurance carriers 23.6 46.8 23.2
Apparel stores 11.4 33.8 22.4
Chemicals 51.1 57.3 6.2
Heavy construction 21.5 30.0 8.5
Wholesale trade 21.9 35.0 13.1
Printing and publishing 32.6 46.7 14.1
Paper products 36.4 52.8 16.4Notes: This table presents patterns of affiliation in selected industries with high and low labor turnover, in countries with high and low EPL.
The EPL measure is the average OECD employment dismissal protection index in 1998–2008. Industry labor turnover is the average of the
firm-level turnover rate in each two-digit SIC industry, calculated as the average of absolute change in annual employment at the firm divided
by the average firm employment across two years. Columns 1 and 2 present the share of affiliates by industry and country. Column 3 reports the
difference between the share of affiliates in countries with low and high EPL after partialling out industry and country effects.
Table 3. Percentage of Group Affiliates in High- and Low-Turnover Industries by EPL
Panel B: Examples of low-turnover industries (% of group affiliates)
Panel A: Examples of high-turnover industries (% of group affiliates)
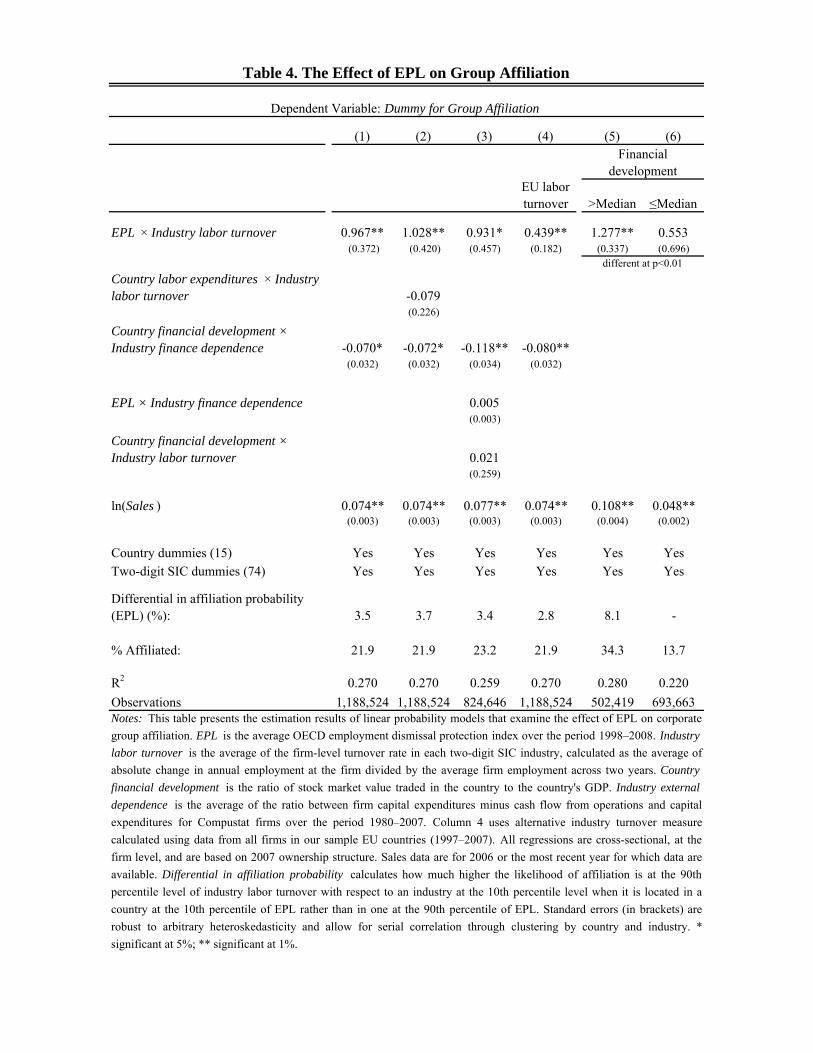
(1) (2) (3) (4) (5) (6)
EU labor turnover >Median ≤Median
EPL × Industry labor turnover 0.967** 1.028** 0.931* 0.439** 1.277** 0.553 (0.372) (0.420) (0.457) (0.182) (0.337) (0.696)
Country labor expenditures × Industry labor turnover -0.079
(0.226)
Country financial development × Industry finance dependence -0.070* -0.072* -0.118** -0.080**
(0.032) (0.032) (0.034) (0.032)
EPL × Industry finance dependence 0.005(0.003)
Country financial development × Industry labor turnover 0.021
(0.259)
ln(Sales ) 0.074** 0.074** 0.077** 0.074** 0.108** 0.048**(0.003) (0.003) (0.003) (0.003) (0.004) (0.002)
Country dummies (15) Yes Yes Yes Yes Yes Yes
Two-digit SIC dummies (74) Yes Yes Yes Yes Yes Yes
Differential in affiliation probability (EPL) (%): 3.5 3.7 3.4 2.8 8.1 -
% Affiliated: 21.9 21.9 23.2 21.9 34.3 13.7
R2 0.270 0.270 0.259 0.270 0.280 0.220
Observations 1,188,524 1,188,524 824,646 1,188,524 502,419 693,663Notes: This table presents the estimation results of linear probability models that examine the effect of EPL on corporate
group affiliation. EPL is the average OECD employment dismissal protection index over the period 1998–2008. Industry
labor turnover is the average of the firm-level turnover rate in each two-digit SIC industry, calculated as the average of
absolute change in annual employment at the firm divided by the average firm employment across two years. Country
financial development is the ratio of stock market value traded in the country to the country's GDP. Industry external
dependence is the average of the ratio between firm capital expenditures minus cash flow from operations and capital
expenditures for Compustat firms over the period 1980–2007. Column 4 uses alternative industry turnover measure
calculated using data from all firms in our sample EU countries (1997–2007). All regressions are cross-sectional, at the
firm level, and are based on 2007 ownership structure. Sales data are for 2006 or the most recent year for which data are
available. Differential in affiliation probability calculates how much higher the likelihood of affiliation is at the 90th
percentile level of industry labor turnover with respect to an industry at the 10th percentile level when it is located in a
country at the 10th percentile of EPL rather than in one at the 90th percentile of EPL. Standard errors (in brackets) are
robust to arbitrary heteroskedasticity and allow for serial correlation through clustering by country and industry. *
significant at 5%; ** significant at 1%.
different at p<0.01
Financial development
Table 4. The Effect of EPL on Group Affiliation
Dependent Variable: Dummy for Group Affiliation
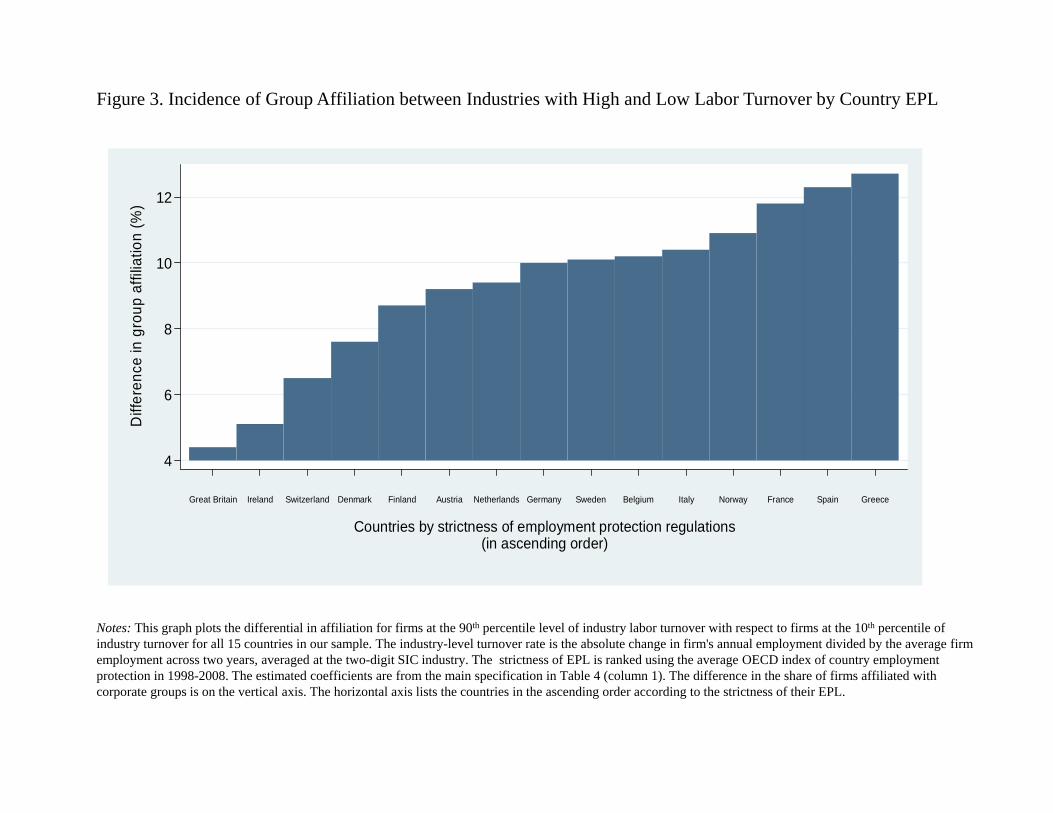
Figure 3. Incidence of Group Affiliation between Industries with High and Low Labor Turnover by Country EPL
Notes: This graph plots the differential in affiliation for firms at the 90th percentile level of industry labor turnover with respect to firms at the 10th percentile of industry turnover for all 15 countries in our sample. The industry-level turnover rate is the absolute change in firm's annual employment divided by the average firm employment across two years, averaged at the two-digit SIC industry. The strictness of EPL is ranked using the average OECD index of country employment protection in 1998-2008. The estimated coefficients are from the main specification in Table 4 (column 1). The difference in the share of firms affiliated with corporate groups is on the vertical axis. The horizontal axis lists the countries in the ascending order according to the strictness of their EPL.
4
6
8
10
12
Diff
eren
ce in
gro
up a
ffilia
tion
(%)
Great Britain Ireland Switzerland Denmark Finland Austria Netherlands Germany Sweden Belgium Italy Norway France Spain Greece
Countries by strictness of employment protection regulations(in ascending order)
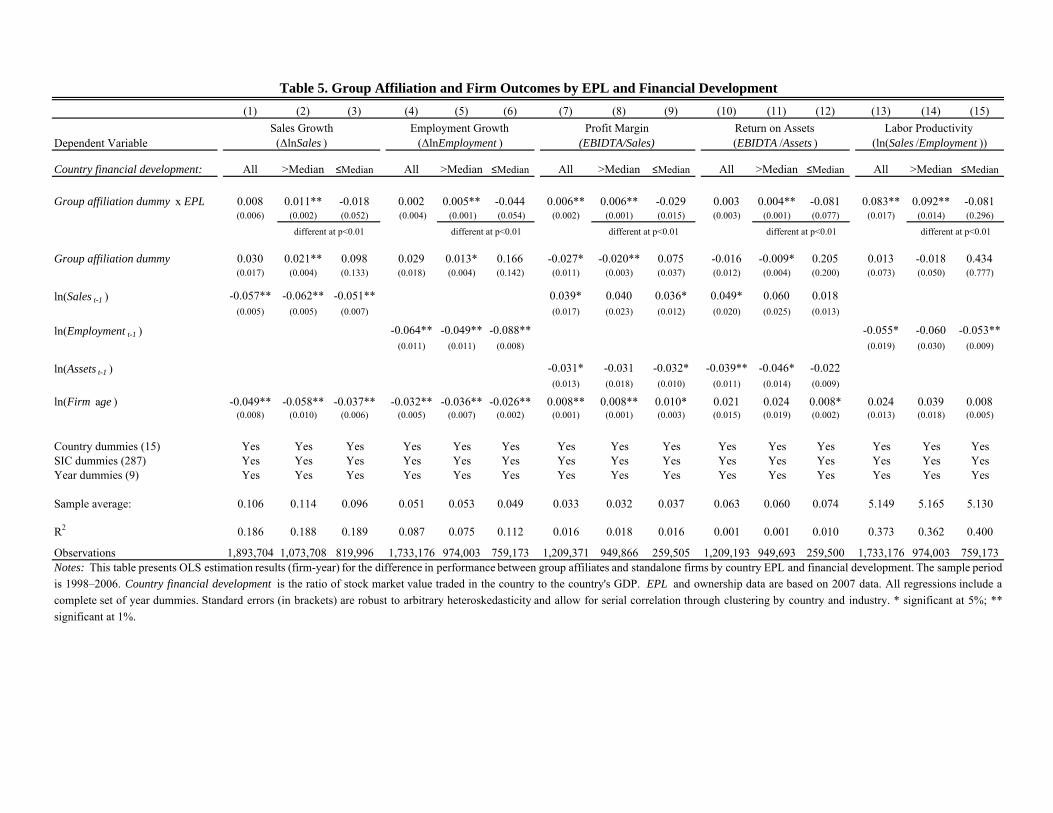
(1) (2) (3) (4) (5) (6) (7) (8) (9) (10) (11) (12) (13) (14) (15)
Dependent Variable
Country financial development: All >Median ≤Median All >Median ≤Median All >Median ≤Median All >Median ≤Median All >Median ≤Median
Group affiliation dummy x EPL 0.008 0.011** -0.018 0.002 0.005** -0.044 0.006** 0.006** -0.029 0.003 0.004** -0.081 0.083** 0.092** -0.081(0.006) (0.002) (0.052) (0.004) (0.001) (0.054) (0.002) (0.001) (0.015) (0.003) (0.001) (0.077) (0.017) (0.014) (0.296)
Group affiliation dummy 0.030 0.021** 0.098 0.029 0.013* 0.166 -0.027* -0.020** 0.075 -0.016 -0.009* 0.205 0.013 -0.018 0.434(0.017) (0.004) (0.133) (0.018) (0.004) (0.142) (0.011) (0.003) (0.037) (0.012) (0.004) (0.200) (0.073) (0.050) (0.777)
ln(Sales t-1 ) -0.057** -0.062** -0.051** 0.039* 0.040 0.036* 0.049* 0.060 0.018(0.005) (0.005) (0.007) (0.017) (0.023) (0.012) (0.020) (0.025) (0.013)
ln(Employment t-1 ) -0.064** -0.049** -0.088** -0.055* -0.060 -0.053**(0.011) (0.011) (0.008) (0.019) (0.030) (0.009)
ln(Assets t-1 ) -0.031* -0.031 -0.032* -0.039** -0.046* -0.022(0.013) (0.018) (0.010) (0.011) (0.014) (0.009)
ln(Firm age ) -0.049** -0.058** -0.037** -0.032** -0.036** -0.026** 0.008** 0.008** 0.010* 0.021 0.024 0.008* 0.024 0.039 0.008(0.008) (0.010) (0.006) (0.005) (0.007) (0.002) (0.001) (0.001) (0.003) (0.015) (0.019) (0.002) (0.013) (0.018) (0.005)
Country dummies (15) Yes Yes Yes Yes Yes Yes Yes Yes Yes Yes Yes Yes Yes Yes YesSIC dummies (287) Yes Yes Yes Yes Yes Yes Yes Yes Yes Yes Yes Yes Yes Yes YesYear dummies (9) Yes Yes Yes Yes Yes Yes Yes Yes Yes Yes Yes Yes Yes Yes Yes
Sample average: 0.106 0.114 0.096 0.051 0.053 0.049 0.033 0.032 0.037 0.063 0.060 0.074 5.149 5.165 5.130
R2 0.186 0.188 0.189 0.087 0.075 0.112 0.016 0.018 0.016 0.001 0.001 0.010 0.373 0.362 0.400
Observations 1,893,704 1,073,708 819,996 1,733,176 974,003 759,173 1,209,371 949,866 259,505 1,209,193 949,693 259,500 1,733,176 974,003 759,173
Table 5. Group Affiliation and Firm Outcomes by EPL and Financial Development
Notes: This table presents OLS estimation results (firm-year) for the difference in performance between group affiliates and standalone firms by country EPL and financial development. The sample period
is 1998–2006. Country financial development is the ratio of stock market value traded in the country to the country's GDP. EPL and ownership data are based on 2007 data. All regressions include a
complete set of year dummies. Standard errors (in brackets) are robust to arbitrary heteroskedasticity and allow for serial correlation through clustering by country and industry. * significant at 5%; **
significant at 1%.
Employment Growth (ΔlnEmployment )
Profit Margin (EBIDTA/Sales)
Return on Assets (EBIDTA /Assets )
Labor Productivity (ln(Sales /Employment ))
Sales Growth (ΔlnSales )
different at p<0.01 different at p<0.01 different at p<0.01 different at p<0.01 different at p<0.01
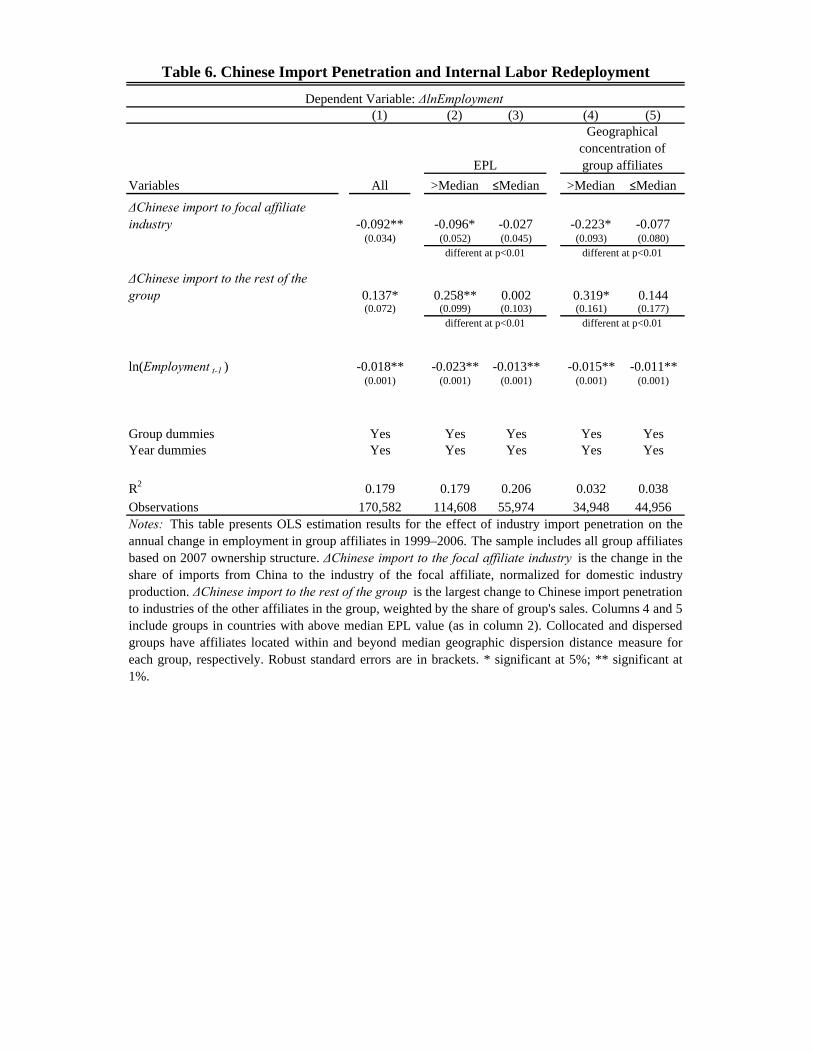
(1) (2) (3) (4) (5)
Variables All >Median ≤Median >Median ≤Median
ΔChinese import to focal affiliate industry -0.092** -0.096* -0.027 -0.223* -0.077
(0.034) (0.052) (0.045) (0.093) (0.080)
ΔChinese import to the rest of the group 0.137* 0.258** 0.002 0.319* 0.144
(0.072) (0.099) (0.103) (0.161) (0.177)
ln(Employment t-1 ) -0.018** -0.023** -0.013** -0.015** -0.011**(0.001) (0.001) (0.001) (0.001) (0.001)
Group dummies Yes Yes Yes Yes YesYear dummies Yes Yes Yes Yes Yes
R2 0.179 0.179 0.206 0.032 0.038
Observations 170,582 114,608 55,974 34,948 44,956
Table 6. Chinese Import Penetration and Internal Labor Redeployment
Dependent Variable: ΔlnEmployment
Notes: This table presents OLS estimation results for the effect of industry import penetration on theannual change in employment in group affiliates in 1999–2006. The sample includes all group affiliatesbased on 2007 ownership structure. ΔChinese import to the focal affiliate industry is the change in theshare of imports from China to the industry of the focal affiliate, normalized for domestic industryproduction. ΔChinese import to the rest of the group is the largest change to Chinese import penetrationto industries of the other affiliates in the group, weighted by the share of group's sales. Columns 4 and 5include groups in countries with above median EPL value (as in column 2). Collocated and dispersedgroups have affiliates located within and beyond median geographic dispersion distance measure foreach group, respectively. Robust standard errors are in brackets. * significant at 5%; ** significant at1%.
EPL
Geographical concentration of group affiliates
different at p<0.01 different at p<0.01
different at p<0.01 different at p<0.01
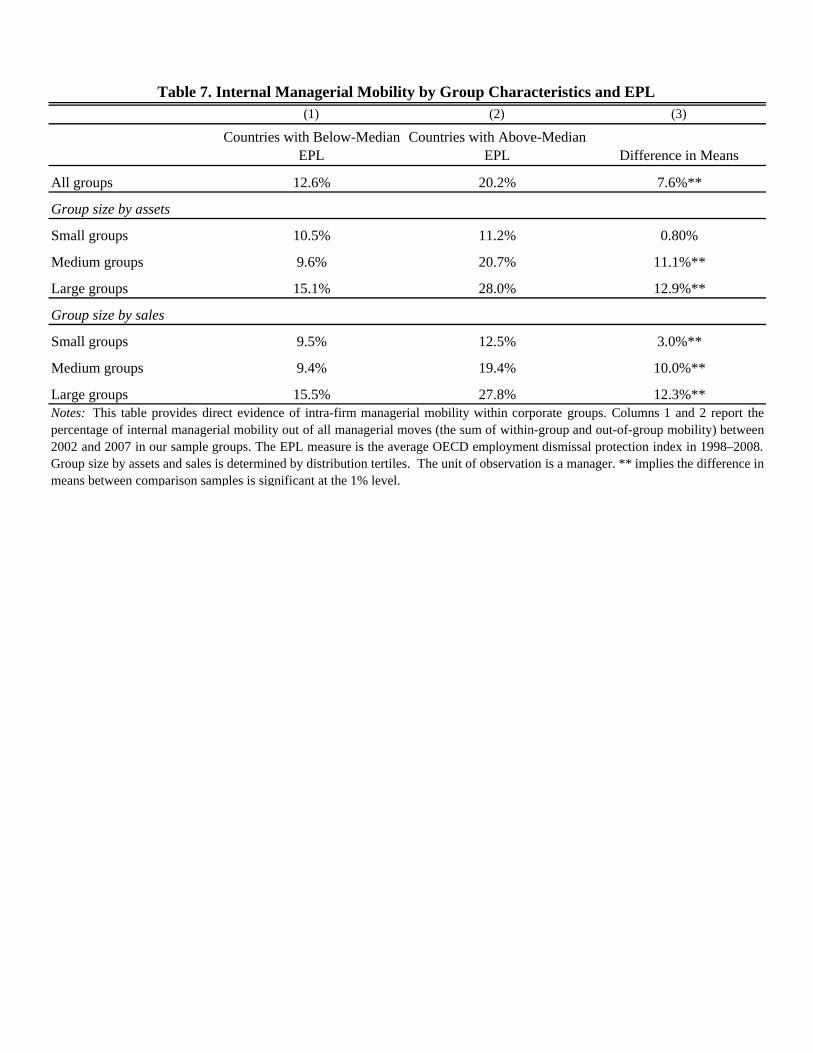
(1) (2) (3)
Countries with Below-Median EPL
Countries with Above-Median EPL Difference in Means
All groups 12.6% 20.2% 7.6%**
Group size by assets
Small groups 10.5% 11.2% 0.80%
Medium groups 9.6% 20.7% 11.1%**
Large groups 15.1% 28.0% 12.9%**
Group size by sales
Small groups 9.5% 12.5% 3.0%**
Medium groups 9.4% 19.4% 10.0%**
Large groups 15.5% 27.8% 12.3%**
Table 7. Internal Managerial Mobility by Group Characteristics and EPL
Notes: This table provides direct evidence of intra-firm managerial mobility within corporate groups. Columns 1 and 2 report thepercentage of internal managerial mobility out of all managerial moves (the sum of within-group and out-of-group mobility) between2002 and 2007 in our sample groups. The EPL measure is the average OECD employment dismissal protection index in 1998–2008.Group size by assets and sales is determined by distribution tertiles. The unit of observation is a manager. ** implies the difference inmeans between comparison samples is significant at the 1% level.

(1) (2) (3) (4) (5) (6)
Variables AllHigh
growthLow
growth AllForm new
groupsJoin existing
groups
EPL × Industry labor turnover 0.523* 0.940** 0.480(0.197) (0.167) (0.294)
Dummy for ΔEPL>0 × Industry labor turnover 0.587** 0.485** 0.485**
(0.168) (0.137) (0.109)
Dummy for ΔEPL>0 -0.012 -0.010 -0.010(0.045) (0.042) (0.031)
Country financial development × Industry external dependence 0.027 0.059 0.054 0.086 0.071 0.052
(0.030) (0.036) (0.027) (0.070) (0.064) (0.047)
ln(Sales ) 0.030** 0.040** 0.026* 0.064** 0.055** 0.033**(0.008) (0.012) (0.010) (0.011) (0.011) (0.007)
Country dummies (15) Yes Yes Yes No No No
Two-digit SIC dummies (74) Yes Yes Yes Yes Yes Yes
Differential in affiliation probability (%): 1.9 3.4 1.7 0.3 0.2 0.2
% Affiliated 7.5 8.9 6.6 9.4 9.2 5.8
R2 0.150 0.158 0.143 0.110 0.097 0.054
Observations 641,091 120,023 123,004 459,831 525,200 506,017
different at p<0.01
Table 8. From Standalone to Corporate Group Affiliate: 2007 to 2011
Dependent Variable: Dummy for ΔGroup affiliation=1
Notes: This table presents the estimation results of linear probability models that examine the effect of EPL onchange in ownership from standalone to affiliate. The sample includes all standalone firms in 2007 for which wehave ownership information in 2011. Dummy for ΔEPL>0 is a dummy variable that equals 1 if the rigidityindex in a country increased between 2004 and 2010. Δ(Group affiliation)=1 when a firm is classified as astandalone in 2007 and as a group affiliate in 2011. Columns 2 and 3 split the sample by high and low growthbased on the first and fourth quartiles of sales growth over the period 2005–2007. Standard errors (in brackets)are robust to arbitrary heteroskedasticity and allow for serial correlation through clustering by country. *significant at 5%; ** significant at 1%.