market intelligence report – madrid 2010 · 2010-09-20 · hvs – madrid office market...
TRANSCRIPT
SEPTEMBER, 2010
Market Intelligence Report Madrid Madrid City Hotels – On the Rocky Road to Recovery?
ESTHER GLADEN, Business & Market Intelligence Analyst GIULIANO GASPARINI, MRICS, Senior Associate
HVS MADRID c/ Velázquez 80, 6º Izq. 28001 Madrid Spain Tel: +34 91‐781 6666 Fax: +34 91‐575 1450

HVS – Madrid Office Market Intelligence Report Madrid 2
Market Intelligence Report Madrid
This article presents a picture of the Madrid hotel market up to the summer of 2010 and our view on current tourism and hospitality trends and tendencies.
• After a period of steady growth up to the end of 2007, overall airport arrivals have decreased in the two years to the end of 2009;
• Airport arrivals have increased in the first half of 2010 compared to the same period last year;
• Guest nights reported from January to July 2010 show an increase compared to 2008 and 2009 (and even 2007) levels for each month except February and July;
• The increase in guest nights has not been converted entirely into increased hotel occupancy with average occupancy to date at 65,4% still below 2007 and 2008 levels but certainly above those of 2009;
• The biggest decrease in occupancy has been registered for luxury and upscale hotels (the four and five star categories). In terms of ADR the largest decline has been registered for four star and three star properties;
• If the upward trend of guest nights continues or improves (as usually happens in the second half of the year), hotel occupancy is forecast to increase to above the level achieved in 2009 and could even overtake 2008;
• All these factors, combined with the consolidation of Madrid as the financial and business heart of Spain and as a leading leisure tourism destination, offer clear signs of recovery but it will take further stable growth and changes to the infrastructure of the hotel market to achieve again performance levels last seen at the peak: the road ahead is looking better but is still not clear of rocks!
After a few weeks of euphoria following Spain’s World Cup victory the country has had to face reality again. Pressure on Spain’s economy is still growing under the burden of the present economic and financial situation, and apart from everything else, the recent increase in the rate of VAT will also prove painful, at least in the short term. According to The Economist Intelligence Unit real GDP growth will gradually recover to ‐0,50% in 2010 and will only reach 0,60% in 2011. Real GDP growth of 1,80% is forecasted for 2014, less than the peak achieved in 2006.
Summary
Spanish Economic Overview

HVS – Madrid Office Market Intelligence Report Madrid 3
Inflation, which averaged ‐0,30% in 2009, is forecast to increase to 1,00% in 2010 and slowly increase finally to reach 1,70% in 2014.
Table 1 Economic Indicators for Spain
2006 2007 2008 2009 2010 2011 2012 2013 2014
Real GDP growth (%) 3,90 3,66 1,20 -3,60 -0,50 0,60 1,10 1,60 1,80Consumer price inflation (%) 3,50 2,79 4,00 -0,30 1,00 0,90 1,30 1,60 1,70Budget balance (% of GDP) 1,80 2,23 -3,30 -11,20 -9,90 -7,70 -6,70 -5,80 -5,10Curr.acc.balance (% of GDP) -8,60 -10,10 -9,40 -5,10 -4,70 -4,31 -4,00 -3,30 -3,20Short-term interest rate (av; %) 3,10 4,30 4,80 1,20 0,70 0,90 1,50 3,60 4,10Exchange rate US$:€ (av) 1,26 1,37 1,46 1,39 1,30 1,22 1,18 1,18 1,21
Source: EIU, July 2010
Forecast
As illustrated in the graphs below in Table 2, total visitation to Madrid increased by 54,3%, with a compound annual growth rate of 7,5%.
Table 2 Domestic and International Arrivals 2003‐09 (millions)
-30.0%
-20.0%
-10.0%
0.0%
10.0%
20.0%
30.0%
0.0
1.0
2.0
3.0
4.0
5.0
6.0
2003 2004 2005 2006 2007 2008 2009
Domestic Arrivals
-30%
-20%
-10%
0%
10%
20%
30%
40%
0.0
1.0
2.0
3.0
4.0
2003 2004 2005 2006 2007 2008 2009
International Arrivals
% Change
Source: INE - Instituto Nacional de Estadísticas
Tourist Arrivals and Demand

HVS – Madrid Office Market Intelligence Report Madrid 4
At the end of 2000 the proportion of domestic and international visitors was fairly evenly balanced (52%/48%). In the years that followed, the proportion of domestic visitors has increased steadily and in 2009 the ratio was 59%/41%. This may be explained by a growth in domestic tourism and by the increasing relevance of Madrid as the capital of Spain, attracting more companies and institutions and therefore representing a major destination for domestic business travellers.
As illustrated in Table 3, in 2009 the USA was the largest international feeder market, followed by Italy, UK, France and Germany. In the “Others” category, the most significant source markets were Portugal and Japan, both with less than 2%.
Table 3 Madrid Visitation Nationality Mix ‐ 2009
Spain59%
USA5%Italy
4%UK 3%
France3%
Germany2%
Others24%
Source: Patronato Municipal de Turismo de Madrid (2009)
Table 4 indicates the spread of the seasonality of guest nights throughout the year for the four years from 2007 to 2010.

HVS – Madrid Office Market Intelligence Report Madrid 5
Table 4 Guest Night Seasonality – Madrid 2007‐2010
0.9
1.0
1.1
1.2
1.3
1.4
1.5
milli
on 2007
2008
2009
2010
Source: INE Encuesta de Ocupación Hotelera
The seasonality trend registered in 2009 is in line with the pattern of earlier years, featuring a peak in May after the difficult months of winter and early spring followed by a second peak in October after the traditional trough experienced in the summer.
Although 2009 guest nights for the first half of the year were below 2008 levels, from October 2009, guest nights exceeded those of the previous year, a sign of recovery in the market.
Figures for the first half of 2010 show an interesting picture of recovery in terms of guest nights for the city, in some cases even exceeding the figures registered in 2008 and 2007. This recovery has been fuelled by increases in both domestic and international guest nights although both segments have registered the usual seasonal decrease during the months of June and July.
The number of arrivals at Madrid´s Barajas International Airport was approximately 48,3 million in 2009, decreasing from approximately 50,5 million in 2008, which had been reached after several years of steady growth. The downward trend started in 2008, partly due to the AVE, the high‐speed train connection between Madrid and Barcelona, which took away some of the market that had previously been using the puente aereo for their daily commute, and partly due to the general reduction in activity of both corporate and leisure travellers. Preliminary figures for July year to date show a total number of passengers of 28,6 million, 3% higher than the same period in 2009.
Airport Arrivals

HVS – Madrid Office Market Intelligence Report Madrid 6
Table 5 Airport Passenger Movements in Madrid 2003‐09
30
35
40
45
50
55
pass
enge
rs (m
illion
s)
Source:ACI Worldwide, except data 2009 (AENA)
Table 6 indicates the average length of stay in Madrid’s hotels in 2009. The overall average length of stay was 1,90 days reflecting the impact of the typical two night stay of many business travellers. However, although no month shows an average of more than two days, length of stay does fluctuate throughout the year as the mix of visitors coming to the city changes. Visitors tend to stay slightly longer during the period from April to May and in October when there are more leisure travellers able to take advantage of national holidays, as well as in the traditional holiday months of August and December. The rest of the year is characterized by an average length of stay of less than 1,90 days and therefore reflect the activities of short stay business travellers rather than leisure tourists.
Preliminary figures for 2010 show an average length of stay of approximately 1,93 days, in line with previous years.
Length of Stay

HVS – Madrid Office Market Intelligence Report Madrid 7
Table 6 Length of Stay in Madrid 2009
1.761.781.801.821.841.861.881.901.921.941.961.98
days
Source: INE-Instituto Nacional de Estadísticas
Table 7 shows the seasonality of hotel occupancy in Madrid from 2007 to July 2010. With the exception of January and May 2008, all 2008 and 2009 figures are below 2007 levels. However it is important to note that, starting from December 2009, average occupancy has increased, with 2010 figures (from January to July) above the level of the same period of the previous year. This trend parallels the guest night increase presented in Table 4 that started in October 2009 and continued to summer 2010.
Table 7 Seasonality of Hotel Occupancy in Madrid 2007‐2010
35%
45%
55%
65%
75%
85%
2007
2008
2009
2010
Source: INE Encuesta de Ocupación Hotelera
Looking at monthly figures in some cases such as May 2010, occupancy reached 74,1%, only 150 percentage points less than the peak levels of 2007. Improvement has also been seen in June 2010 with an increase of
Hotel Occupancy

HVS – Madrid Office Market Intelligence Report Madrid 8
10,9% compared to June 2009 as shown in the table below. All this leads to hope for continuing recovery for the second half of 2010 even though July figures show a slowdown in this trend.
Table 8 Jan ‐ Jul Occupancy Variation 2010/2009
Source: INE Encuesta de la Ocupación Hotelera
0%
2%
4%
6%
8%
10%
12%
Jan Feb Mar Apr May Jun Jul
1.4%
4.6%4.0%
6.4%
9.6%
10.9%
6.3%
In conducting our research and interviews with those involved in the hotel sector in Madrid, we have identified a number of factors which have influenced market performance:
• Slightly improved economic conditions in Spain’s major international source markets;
• Increasing role of Madrid as an international city‐break destination, even during the hot summer months;
• A slow recovery in business travel as companies acknowledge the necessity to trade through the crisis in order to survive.
A decisive month will be this October, traditionally one of the city’s peak months for hotel occupancy in the second half of the year. It will be difficult to avoid the word “recovery” if occupancy reaches close to 2007 levels again.
When comparing overall occupancy figures by hotel category (see Table 9) it is clear that those hit the hardest have been luxury and upscale properties with a decrease of 9,7% in the five‐star segment, 9,5% in the four‐star segment and 5,4% in the three‐star segment.
The second half of the year usually registers lower occupancy than the first. Data for 2010 from January to May show average figures for all categories that are far higher than the annual average for 2009. Although the second half of the year will probably perform in line with previous years and occupancy rates will fall, there may be some further evidence here that overall performance for 2010 will outstrip 2009.

HVS – Madrid Office Market Intelligence Report Madrid 9
Table 9 Trend in Occupancy by Category 2008‐2010
0%
10%
20%
30%
40%
50%
60%
70%
80%
20082009
2010*
5-star
4-star
3-star
Source: Exceltur* Preliminary data Jan - May 2010
It is important to mention here that the decrease in occupancy registered in 2009 should be seen not simply as a change in the consumption patterns of hotel guests but also as a consequence of the pricing strategy adopted for each market segment. As seen in Table 10, five‐star hotels have preferred to suffer reductions in occupancy but keep ADRs at the highest level possible (despite registering a decrease of 11,3% between 2008 and 2009). This strategy has been adopted by the majority of hotels in the city with only a few independent spirits reducing their room rates down to four‐star levels or offering very favourable discounts throughout the year. In most of the cases this tactic has been dictated by a more practical and urgent problem; a lack of liquidity rather than a lack of strategy.
Three and four‐star hotels have seen their ADR levels drop the most between 2008 and 2009 with a decrease of 12,7% and 14,4% respectively. The large number of midscale hotels in the city makes it extremely difficult to monitor the market in the same way as the still under‐represented five‐star segment. Therefore it is very difficult for management to react promptly to competitors’ manoeuvres in terms of pricing. A lack of common strategy has been evident with the majority of hotels choosing the “easy” path of simply reducing rates in order to attract business. A more long‐term vision based on increasing the value for money ratio or through genuine product differentiation would perhaps have been preferable in order not to compromise a long‐term recovery in prices.
In the five months to May 2010 there has been little variation in rate for five‐star and four‐star properties, falling by 2,7% and 0,8% respectively, whilst the three‐star segment has remained unchanged; perhaps a sign that things finally have bottomed out.

HVS – Madrid Office Market Intelligence Report Madrid 10
Table 10 ADR by Category 2008‐2010
0
20
40
60
80
100
120
140
160
180
200
20082009
2010*
5-star
4-star
3-star
Source: Exceltur* Preliminary data Jan - May 2010
In 2010 the Madrid city hotel market included 260 hotel properties. A breakdown of these properties by category is shown in Table 11.
Table 11 Supply Market Share – City of Madrid (2010)
Source: Secretaria de Estado de Turismo y Comercio Pyme, INE (2008)Dirección General de Turismo, Comunidad de Madrid (2009, 2010)
5-star9%
4-star50%
3-star29%
1- & 2-star 12%
Number of Hotels
5-star15%
4-star61%
3-star19%
1- & 2-star 5%
Number of Rooms
As in previous years the four‐star segment represents about 50% of hotel establishments and more than 60% of the room inventory in the city. Supply trends showed an increase in hotels in recent years, growing from 216 in 2008 to 260 properties in 2010, a 20% increase in supply in the number of hotels and a 15% increase in room inventory.
Supply
HVS – Madrid Office Market Intelligence Report Madrid 11
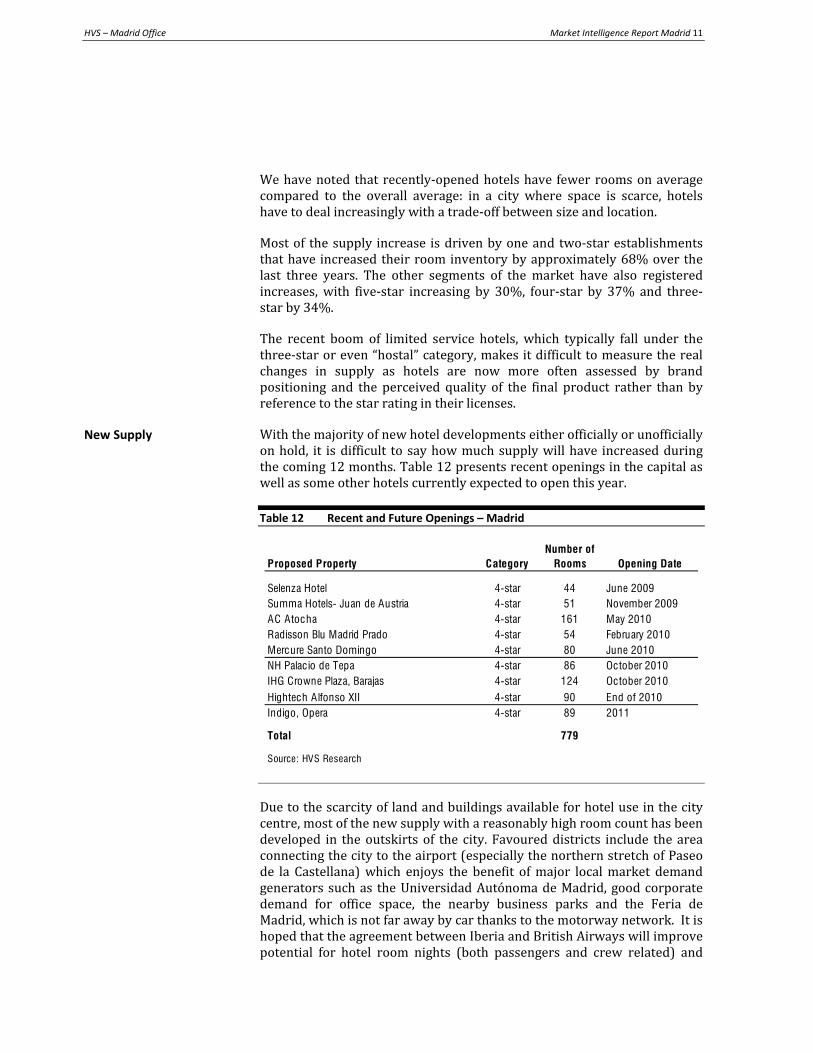
We have noted that recently‐opened hotels have fewer rooms on average compared to the overall average: in a city where space is scarce, hotels have to deal increasingly with a trade‐off between size and location.
Most of the supply increase is driven by one and two‐star establishments that have increased their room inventory by approximately 68% over the last three years. The other segments of the market have also registered increases, with five‐star increasing by 30%, four‐star by 37% and three‐ star by 34%.
The recent boom of limited service hotels, which typically fall under the three‐star or even “hostal” category, makes it difficult to measure the real changes in supply as hotels are now more often assessed by brand positioning and the perceived quality of the final product rather than by reference to the star rating in their licenses.
With the majority of new hotel developments either officially or unofficially on hold, it is difficult to say how much supply will have increased during the coming 12 months. Table 12 presents recent openings in the capital as well as some other hotels currently expected to open this year.
Table 12 Recent and Future Openings – Madrid
Proposed Property CategoryNumber of
Rooms Opening Date
Selenza Hotel 4-star 44 June 2009Summa Hotels- Juan de Austria 4-star 51 November 2009AC Atocha 4-star 161 May 2010Radisson Blu Madrid Prado 4-star 54 February 2010Mercure Santo Domingo 4-star 80 June 2010NH Palacio de Tepa 4-star 86 October 2010IHG Crowne Plaza, Barajas 4-star 124 October 2010Hightech Alfonso XII 4-star 90 End of 2010Indigo, Opera 4-star 89 2011
Total 779
Source: HVS Research
Due to the scarcity of land and buildings available for hotel use in the city centre, most of the new supply with a reasonably high room count has been developed in the outskirts of the city. Favoured districts include the area connecting the city to the airport (especially the northern stretch of Paseo de la Castellana) which enjoys the benefit of major local market demand generators such as the Universidad Autónoma de Madrid, good corporate demand for office space, the nearby business parks and the Feria de Madrid, which is not far away by car thanks to the motorway network. It is hoped that the agreement between Iberia and British Airways will improve potential for hotel room nights (both passengers and crew related) and
New Supply

HVS – Madrid Office Market Intelligence Report Madrid 12
established the Satellite hub at Terminal 4 as a Western European hub for flights to Central and South America.
On the other hand, due to the scarcity of appropriately sized buildings, the city centre has experienced the growth of smaller, boutique hotels (all less than 100 rooms) such as the Radisson Blue, the new Mercure and, soon to open in Opera, the Indigo.
Taking into account the guest night data presented in Table 4, if we take a conservative view and assume that the second half of 2010 will produce the same number of guest nights registered in the second half of 2009, the overall result would be approximately 14.5 million guest nights, 1,0% higher than 2007 levels and 4,1% and 7,4% higher than 2008 and 2009 respectively.
In a more positive mindset, we can argue that historically the first half of the year usually produces 49% ‐ 51% of total guest nights and therefore that activity is well‐balanced throughout the year. Therefore, we could apply the same increase registered to date for the remaining months of the year. The monthly increase in guest nights between January and July 2009 and the same period of 2010 show an average increase of with a minimum of 4.9% in January to a maximum of 17.5% in June. When applying these average figures to the second half of the year, the total number of guest nights would be 15.3 million, 6,5% higher than 2007 levels and 9,9% and 13,3% higher than 2008 and 2009 respectively.
Such a performance would offer a real chance to claim that things have turned a corner, at least in terms of guest nights. As mentioned earlier, the main test will be in October when monthly performance and preliminary figures for the entire year will be able to confirm (or not) this optimistic forecast.
The implication is that the current levels of oversupply caused by lower demand could be considered temporary and that the coming months will be a transition period during which existing and new supply will be able to absorb the anticipated increases in guest nights and thus finally increase occupancy rates to pre‐crisis levels.
But will this projected growth in guest nights be translated into hotel occupancy? When we convert the guest night figures into hotel room occupancy, we need to take into account the Double Occupancy Factor (DOF) registered for Madrid. Table 13 shows the DOF achieved in 2007, 2008 and 2009.
III and IV Quarter 2010 and Future Outlook

HVS – Madrid Office Market Intelligence Report Madrid 13
Table 13 Guest Nights ‐ Room Nights Conversion
2007 2008 2009
Guest nights (actual) 14,361,371 13,926,190 13,500,573
Double Occupancy Factor 1.98 1.99 2.08
Room nights (actual) 7,245,459 6,981,114 6,500,460
Room inventory 28,430 29,309 30,326
Source: HVS Research & Estimates
As can be seen from the table above, the DOF has not varied significantly in the last few years. The first two quarters of every year always show DOF figures inferior to the second half, probably due to the impact of the summer season when families and leisure tourists travel in larger groups.
DOF trends for the period January‐July 2010, however, show a decline when compared to same periods of previous years, falling from 2,02 in 2009 to 1,87 in 2010. Assuming that the rest of 2010 will see a DOF higher than the first half, but still more conservative in respect to 2008 and 2009 levels, the result for the year would be 1,90, as shown in Table 14. It is therefore possible to calculate the impact of the increase in guest nights in terms of hotel occupancy. Table 14 shows this impact in accordance with our assumptions presented above, looking at both scenarios, conservative and optimistic.
Table 14 Hotel Occupancy Projections 2010
2010 YTD July 2010 Year
Guest nightsGuest nights (conservative approach) 8,765,085 14,544,656Guest nights (optimistic approach) 8,765,085 15,315,607
Double Occupancy Factor 1.87 1.90
Room nightsRoom nights (conservative approach) 4,676,628 7,640,362Room nights (optimistic approach) 4,676,628 8,045,345
Hotel OccupancyHotel occupancy (conservative) 65.4% 62.1%Hotel occupancy (optimistic) 65.4% 65.4%
Room inventory 33,720 33,720
Source: HVS Research & Estimates

HVS – Madrid Office Market Intelligence Report Madrid 14
These projections for 2010 show an increase in hotel occupancy even in the conservative scenario and a forecast almost reaching 2008 levels in the optimistic scenario.
Recent market conditions have presented many challenges to hotel operators; some new, some simply variations on old themes. A lack of liquidity has pushed management increasingly towards value‐driven packaging and discounted, non‐refundable rates, paid in advance via dedicated hotel or travel websites. A fall in demand and therefore in occupancy has forced the invention of even more creative techniques to keep staff costs (notoriously inflexible) as variable as possible by reducing, within the binding constraints of the labour laws, the number of full time employees, giving additional responsibilities to those who remain and increasing the number of more flexible labour contracts. This in turn has put a strain on service quality and training and has given birth to even more innovative limited service products that are able to control fixed costs better when times are hard.
For some these hard lessons have been needed simply in order to survive but even more creativity is now required in order to deal with a changed market landscape that arguably might never “recover” completely; markets never “go back” to where they were any more than people do.
General Managers have become full‐time asset managers, analyzing cost centres with microscopic attention to detail and identifying savings and opportunities to increase margins everywhere from the underground car park to the roof top bar. There is no doubt however that the benefit of these lessons in survival will prove valuable for years to come.
The market segment which has suffered most from the last couple of years of economic recession in Spain is corporate business travel. With companies increasingly focused on reducing staff and cutting unnecessary expenses, the number of business travellers has diminished drastically. Against this backdrop of austerity, Madrid has perhaps finally become the true financial and business capital of Spain. Many companies have moved from their Catalan headquarters to open their head offices in Madrid and, according to “Actualidad Económica” (July 2010), Madrid, has overtaken Barcelona, being more involved in services than industry, both in terms of contribution to GDP and general economic strength. This implies that Madrid’s potential capture rate for business travellers has increased significantly and therefore, once this segment starts to recover, the city will be much better placed to take advantage of recovery.
The potential of Madrid as a leisure destination has not been so seriously affected by the crisis as might have been expected and the city may even have strengthened its position. The attractions of Madrid such as its sophisticated cultural life and magnificent buildings, its world class museums, the famous nightlife or movida, the quality of life and the open‐mindedness of its citizens, have not diminished or moved away; they are still present in every tourist´s experience and offer an excellent marketing
Lessons from the Crisis
Conclusion

HVS – Madrid Office Market Intelligence Report Madrid 15
tool in confirming Madrid as a leisure destination in Europe. It is true this trend started a few years ago but it appears recently to have consolidated. The massive media exposure generated by the European Football Championship and Spain’s winning of the World Cup has helped this effort enormously.
A study performed by the online flight search engine Skyscanner ranked Madrid as number four of the most requested destinations during the month of July 2010, directly after the more established European destinations of London, Paris and Barcelona. This bodes well for the rest of the year and helps to increase hotel performance in the city during the traditionally lower occupancy summer period.
There is little doubt that if there is a sector of the Spanish economy that could be considered well‐positioned to be instrumental in Madrid’s (and therefore Spain’s) rocky road to recovery, it is definitely tourism and hospitality.
Note: No investment decision in this market should be based on this article. For further information or advice, please contact the authors.

HVS – Madrid Office Market Intelligence Report Madrid 16
About the Authors
Esther Gladen is a Business & Market Intelligence Analyst at HVS Madrid. Esther is originally from Düsseldorf and speaks English, Spanish and French in addition to her native German. Esther joined HVS Madrid in September 2007 and is responsible for developing and maintaining the research database in support of client assignments, research projects and articles. Following her initial professional training as a banker in Germany, Esther has worked in several corporate and entrepreneurial organizations in both Germany and Spain. Prior to joining HVS, Esther, who has lived and worked in Spain for over 20 years, gained extensive management experience during this period in the marketing and sale of leisure real estate, including both whole ownership and shared ownership holiday homes.
Giuliano Gasparini, MRICS is a Senior Associate at HVS Madrid where he has been working since January 2008. He graduated in Economics at Bocconi University in 2001 and achieved a Master of Science in Urban Economics and Management at Erasmus Universiteit in Rotterdam and a Master of Science in Tourism Economics at Bocconi University. Giuliano has been working in the tourism consulting and advisory world since 2003 and has completed many market and financial feasibility studies for hotels, integrated resorts and urban mixed‐use developments as well as hotel valuations throughout Central and Eastern Europe, Germany, Italy, Spain and the Mediterranean area.
For further information, please contact:
Giuliano Gasparini – Senior Associate
c/ Velázquez 80, 6º Izq. 28001 Madrid Spain Email: [email protected]
Or visit hvs.com
© HVS 2010
September 20, 2010 About HVS 1
About HVS
HVS is the world’s leading consulting and services organization focused on the hotel, restaurant, shared ownership, gaming, and leisure industries. Established in 1980, the company offers a comprehensive scope of services and specialized industry expertise to help you enhance the economic returns and value of your hospitality assets.
Because hotels represent both real property and operating businesses, the founding partners of HVS decided to develop the first comprehensive valuation methodology for appraising these specialized assets. Their initial textbook on this topic entitled, The Valuation of Hotels and Motels, published by the Appraisal Institute, created the industry standard for valuing hotels and is now used by virtually every appraiser around the world. HVS continues to be at the forefront of hotel valuation methodology, having published six textbooks and hundreds of articles on this subject, which are used in appraisal courses and seminars and at leading hotel schools such as Lausanne, IMHI, and Cornell. HVS associates are constantly called upon to teach this methodology to hotel owners, lenders, and operators and to participate at industry conferences. HVS principals literally ‘wrote the book’ on hotel valuation, which significantly enhances the credibility and reliability of our conclusions.
Over the past three decades, HVS has expanded both its range of services and its geographical boundaries. The company’s global reach, through a network of 30 offices staffed by 400 seasoned industry professionals, gives you access to an unparalleled range of complementary services for the hospitality industry:
Consulting & Valuation Investment Banking Asset Management & Advisory Hotel Management Hotel Parking Consulting Executive Search Food & Beverage Services Gaming Services
Property Tax ServicesConvention, Sports & Entertainment Facilities Interior Design Sales & Marketing Services Shared Ownership Services Golf Services Eco Services Risk Management

September 20, 2010 About HVS 2
Our clients include prominent hotel owners, lending institutions, international hotel companies, management entities, governmental agencies, and law and accounting firms from North America, Europe, Asia, Latin America, and the Caribbean. HVS principals are regarded as the leading professionals in their respective regions of the globe. We are client driven, entrepreneurial, and dedicated to providing the best advice and services in a timely and cost‐efficient manner. HVS employees continue to be industry leaders, consistently generating a wide variety of articles, studies, and publications on all aspects of the hospitality industry.
HVS is the industry’s primary source of hotel ownership data. Our 2,000+ assignments each year keep us at the forefront of trends and knowledge regarding information on financial operating results, management contracts, franchise agreements, compensation programs, financing structures, and transactions. With access to our industry intelligence and data, you will have the most timely information and the best tools available to make critical decisions about your hospitality assets.
For further information regarding our expertise and specifics about our services, please visit www.hvs.com.