market interaction and pro-social behavior: an
TRANSCRIPT

Market Interaction and Pro-Social Behavior: An Experimental Study
August 12, 2015
Sean M. Collins*, John R. Hamman†, and John P. Lightle‡
Abstract: When actions may generate negative externalities for third parties, there are incentives to
pass these “morally tough” decisions to others. In controlled laboratory experiments, we investigate
how interaction in a market affects other-regarding allocation decisions when the right to divide a sum
of money between oneself and a passive recipient becomes a tradable commodity. We find that
allocation to passive recipients is reduced by more than half when determined by subjects who
purchased or decided to keep the right to make the division as compared to a control treatment where
subjects are directly assigned that right. We find further that the market selection mechanism allocates
the right to make the division more frequently to buyers who allocate more to the recipient, but that
sellers who allocate less to the recipient tend not to sell. Sellers have relatively accurate beliefs about
how little the recipients receive and do not report feeling less responsible the more often they sell the
allocation right.
Keywords: Markets, Market Behavior, Experiment, Pro-Social Behavior, Involuntary Generosity,
Fairness Evasion
JEL: D63, D47, C92
Acknowledgements: We are grateful to David Cooper, Jens Grosser, Tim Salmon, Roman Sheremeta, and participants at the Economic Science Association’s North American meetings in 2011 and International meetings in 2011 for valuable comments and suggestions. We also thank Florida State University for financial support. IRB approval was obtained from FSU for this study.
* Collins: Department of Economics, Fordham University, 113 W 60th St Rm 924, New York, NY 10023-7414, Phone: (646) 312-8270, Fax: (212) 636-7153, [email protected] † Hamman: Department of Economics, Florida State University, 113 Collegiate Loop, Tallahassee, FL, 32306-2180, Phone: (850) 645-9290, Fax: (850) 644-4535, E-mail: [email protected] ‡ Lightle: Department of Economics, Virginia Commonwealth University, Snead Hall, 301 W Main Street Rm B3153, Richmond, VA, 23284-4000, Phone: (804) 828-1717, Fax: (804) 828-9103, E-mail: [email protected]

2
1. Introduction
Market transactions often impose negative externalities on third parties. Production of goods
and services may coincide with any number of human costs; for instance: poor or risky working
conditions, child labor, “forced” overtime, or localized pollution. Because one or both parties in
such a transaction may express moral reservations concerning the outcome, there exist incentives
for agency to develop in such markets. For example, consider a farmer with labor market power.
Rather than hire poorly paid farmhands, the farmer might subcontract for these services. Does
this then absolve the farmer of responsibility for how the workers are treated? Does market
competition for the contract give the subcontractor a “free pass” to poorly compensate workers?
Does the lowest bidder get allocated the contract, or does the farmer internalize the price as a
signal of how workers may be treated? In this study, we look at the impact of other-regarding
behavior on these kinds of markets.
To operationalize these research questions, we collect and analyze data from a laboratory
experiment in which participants first enter a market as "buyer" or "seller" for a claim on the
right to divide a sum of money between themselves and a passive recipient. This division task is
commonly known in the literature as the "dictator game" (Forsythe et al, 1994). In the canonical
dictator game, the role of dictator is assigned randomly. We study what happens when random
role assignment is replaced by a market allocation mechanism. In this mechanism, the right to
play the dictator game is a traded in a double auction preceding the dictator allocation decision.
We then compare dictator decisions following the market to a control treatment in which a
different sample of subjects "replay" the (second stage) dictator game decisions resulting from
the market (but with no market). This experimental design allows us to study these types of
markets for agency while bridging two institutions that have been extensively studied: the double
auction and dictator game.
What sort of outcomes might one expect to see? In neoclassical theory, a market’s allocative
efficiency may be measured by its ability to allocate goods to those with the highest willingness
to pay for them most from those with the lowest willingness to accept the price. With the
potential for the expression of certain kinds of other-regarding preferences not normally tied to
markets, the selection component of the market is more complex. For instance, a buyer may have
a “high” value for a dictator game because she intends to choose a “selfish” division, but it is

3
also possible for a buyer to possess a “high” value due to a strong preference for a more
equitable or “fair” division with the passive recipient that she believes that other market
participants do not have. A similar train of thought may be applied to sellers.
Our study enables a more detailed look at the market selection mechanism in the presence of
other-regarding preferences over its outcomes. Since a seller can always keep the dictator game
and give however much she likes to the recipient, one might wonder why any transactions would
take place, and what such a transaction says about the buyer and seller. We test whether or not
individuals’ social preferences allow markets to select certain actors over others to play the role
of dictator. Further, we ask: do buyers and sellers feel individually responsible for the allocation
to recipients only when they themselves made the allocation decision? Do buyers or sellers
deceive themselves about the types of divisions that can be expected from the opposing side of
the market?
We find that approximately 40% of dictator games are traded in the market. Among traded
games, prices are typically below but sometimes exceed the endowment to be divided in the
dictator game. Compared to the control treatment, allocations to recipients in the presence of the
market selection mechanism are considerably lower. A dichotomy among market roles appears
to be responsible for much of this result: the most “generous” buyers buy the right to the dictator
game more often and the more “generous” sellers sell the right to the dictator game more often.
Interestingly, we find that a substantial number (approximately 40%) of games are bought and
played at what ends up being a net loss to buyers (ostensibly, to secure a “fairer” division with
recipients).
The paper proceeds as follows: we review the related research in section 2 before providing a
detailed description of our experimental design in section 3. Section 4 follows with development
of a simple model and its theoretical predictions, section 5 presents the results of our experiment,
and section 6 concludes with general remarks and avenues for further study.
2. Related literature
A growing area of research that closely fits with the current study deals with the ways in
which market institutions influence behavior and beliefs. The social and psychological effect of
markets is not a new area of study. Early economic philosophers pondered whether markets

4
brought out the best or worst in human nature (see Hirschman, 1977 and 1982 for a terrific
history of the debate).
Experimental research in both economics and psychology suggests that people often exhibit
other-regarding behavior that might be variously described as “pro-social” (cf. Camerer, 2003).
Economists used this body of evidence to develop several theories incorporating “social”
preferences into the utility function (Fehr and Schmidt, 1999; Bolton and Ockenfels, 2000;
Rabin, 1993; Dufwenberg and Kirchsteiger, 2004; Charness and Rabin, 2002; Engelmann and
Strobel, 2004; Cox and Sadiraj, 2011).
Recently, we see a wave of research that examines the limitations of other-regarding
behavior. In a number of ways, many will choose selfish outcomes if they can evade
responsibility.1
2.1 Studies of market influence
Using both lab and field experiments, economists have revived the question of how market
interaction affects human behavior. Henrich et al (2010) conduct a series of field studies across
a range of cultural groups and find that degree of market activity correlates positively with
measures of fairness, though no causality is established. Chen (2010) shows that laboratory
participants become more deontological with increased exposure to tournament competition, and
that high earners in the competitive treatment donate more of their winnings to charity than high
earners in a piece-rate treatment. A very recent paper by Al-Ubaydli et al (2013) finds that
priming laboratory participants with market-centric language increases trusting behavior. In the
same study, however, market primes did not affect altruistic behavior in a dictator game,
contrary to the field study findings of Henrich et al (2010).
Herz and Taubinsky (2014) experimentally investigate an idea first proposed by Bowles
(1998), who claimed that market interaction will influence an individual’s preferences over
norms and fairness outcomes. They find strong evidence in support of Bowles’ hypothesis:
1 Two other related literatures of note are studies examining the role of earned status in pro-social behavior (e.g. Hoffman et al [1994] and Cherry et al [2002]) and the effect of behavioral spillovers from playing in two different strategic settings (e.g. Bednar et al [2012], Cason et al [2012], and Savikhin and Sheremeta [2013]).

5
market experience shapes what people view as a fair transaction, driven by what the authors call
“personal payoff experience” and simple “market observation.”
Another fascinating paper by Falk and Szech (2013) argues that market forces erode moral
values (or rather, diminish one's tendency to act in concert with his or her moral values). In this
study, participants chose to either receive an amount of money or save the life of a mouse. When
asked individually, a majority chose to save the mouse rather than receive €10. In the market
treatments, where some participants were endowed with a mouse and others with €20, bargaining
over the selling price quickly led to over 70% successful transactions - at a price less than €10 -
that resulted in the mouse's death.
Our study therefore offers an extension of the Falk and Szech, Al-Ubaydli et al. and Henrich
et al. findings. Rather than prime subjects, they participate in a market prior to playing a dictator
game. In this way, we can test the causal effect of market interaction on dictator giving amounts.
There are other significant differences in design, but it is worth noting that our results run
counter to the notion that market experience increases fairness and pro-social behavior.
2.2 Studies of “fairness evasion”
Often, we find ourselves in a situation where other-regarding concerns may cause us to
behave kindly towards somebody else. However, there are many responses to these situations
that do not lead to “fair” outcomes. A common avenue may be to distance one’s decision from
the final outcome, exploiting diffusion of responsibility to achieve a self-interested outcome
without overt selfish behavior.
One way to add social distance is to involve others in the decision. Dana, Weber, and Kuang
(2007) find that adding a second “dictator” to simultaneously make the allocation decision
reduces the frequency of fair outcomes dramatically. Hamman, Loewenstein, and Weber (2010)
find that when allocators in a dictator game are able to delegate their decision to a third party,
they seek out an "agent" who will send the least amount to a recipient to achieve a self-interested
outcome without feeling responsible for the low earnings of recipients.2 Furthermore, Bartling
2 Drugov, Hamman, and Serra (2014) also find that delegation reduces the moral cost of engaging in a corrupt action and, in turn, leads to higher levels of corruption overall.

6
and Fischbacher (2012), Oexl and Grossman (2013), and Coffman (2011) find that such
hierarchies cause recipients to hold delegating dictators less accountable.
A second way in which people may respond to situations involving pro-social pressure is to
avoid the decision entirely. Research that closely relates to the current study demonstrates that
individuals will often do just that. In three closely related papers researchers find that, when
given the opportunity to play the role of allocator in a dictator game, individuals often prefer to
quietly (and anonymously) exit. Lazear, Malmendier, and Weber (2012) find that allowing
subjects to sort into or out of the dictator game - in the role of dictator - results in substantially
lower sharing rates. Dana, Cain, and Dawes (2006) find that participants already assigned the
role of dictator will actually pay to avoid playing the game. In their study, dictators could
allocate $10 between themselves and a recipient, or receive $9 to avoid making the decision and
prevent recipients from knowing the game would have been played. By taking the exit option,
participants suggest that it is worth a dollar (at least) to remove them from the decision.
Broberg, Ellingsen, and Johannesson (2007) devise an experiment to actually estimate the "exit
reservation prices" observed in Dana, Cain, and Dawes and find that, on average, dictators will
forego approximately 18% of the endowment to avoid the allocation decision.3
Taken together, the literature suggests that it may not be a preference for fairness per se that
motivates us, but rather a preference for appearing to be fair - both to ourselves and others. This
had led to several theories incorporating this desire for appearing pro-social and managing one's
image (e.g. Murnighan, Oesch, and Pillutla, 2000; Benabou and Tirole, 2006).
One goal of this paper, then, is to examine how these types of social preferences – whether
outcome-based or action-based – persist in market settings. In our design, it is trivially simple
for decision makers in the dictator game to guarantee an outcome in line with their own
preferences, so we may anticipate results in accordance with the distribution of outcome-based
preferences mentioned at the outset of this section. However, if the market interaction changes
an individual’s psychological connection to the outcome or if market selection allocates decision
3 Still more research argues that giving may be due to feelings of shame (Tadelis, 2008; Dillenberger and Sadowski, 2009), guilt (Battagalli and Dufwenberg, 2007) and social pressure from observers (Andreoni and Bernheim, 2009).

7
rights to those with more or less concern for equity, market interaction may lead to behavior that
influences the level of inequality.
Methodologically, our paper also contributes to literature concerning dictator exit. Prior
papers study exit with no transfer of responsibility; once a subject takes the outside option the
game is voided. In our study, a "seller" who sells her allocation rights has exited the dictator
game, but knows that the game must still be played between the buyer and recipient. We discuss
the theoretical implications of this distinction in section 4.
3. Experimental Design
In the design of the experiment, we wish to address markets for agency in in the presence of
social preferences over the impact to third parties. (As an adjunct, we desire to learn more about
pro-social preferences in a market setting.) This motivation opens up many possibilities for
designing experiments. While one might reasonably choose a design that replicates certain
features of a specific market or markets, the alternative we employ is to approach the research
objective in a manner that can most be easily contrasted to and understood within the context
provided by existing literature. To this end, we attempt to bridge two of the most well studied
institution/environment combinations in the literature: the double auction and the dictator game.
[Table 1 here]
The details of the experiment are summarized in Table 1. We conducted a total of eight
sessions at the xs/fs laboratory at Florida State University, with 24 subjects in each session. In
four of the sessions, labeled as the Market treatment, subjects participated in a real-time
interactive market where they could buy or sell the right to play the role of dictator in a dictator
game, with the role of recipient played by an inactive third party. The four Control sessions
(detailed below) serve as a between-subjects control to the Market sessions by preserving the
post-market endowments from the Market treatment without actual market interaction. Subjects
were recruited with ORSEE (Greiner, 2003) and interacted through a computerized network via
z-Tree (Fischbacher, 2007). All sessions began with instructions read aloud by an experimenter
while the subjects read along and were permitted to ask questions publicly, followed by a brief
quiz about the experimental procedures. The sessions lasted approximately 1.5 hours.

8
In the Market treatment, subjects were divided into one of three roles: buyers, sellers, and
recipients (referred to as Type A, Type B, and Type C), and subjects were told they would
remain in these roles throughout the experiment (See Appendix B for instructions.) Each Market
session consisted of 10 periods, and each period consisted of two stages. In the first stage, all
sellers began with a “virtual ticket” (representing the right to be dictator in the subsequent stage)
and were given the option of placing this ticket for sale in a double auction market. To submit an
asking price, a seller typed in an amount between $0.00 and $18.00 and clicked “Offer”, which
made the offer immediately appear to all market participants. All buyers were given an
endowment of $18 and had the option of submitting a bid for a ticket by entering a price between
$0.00 and $18.00 and clicking “Offer”, making the offer immediately appear. Each market
lasted 75 seconds and had exactly four buyers and four sellers, with only one transaction per
subject permitted. All eight traders and four inactive recipients viewed full information in real
time of the asking prices and bids available while the market was open. (See Appendix C for
screenshots of the market stage.) Traders were permitted to submit, change, or remove their
offers at any time. Furthermore, traders could accept any outstanding offer from the other side of
the market on a first-come first-served basis. Once an offer was accepted it was considered final
and the buyer obtained the ticket from the seller at the agreed upon price. Additionally, traders
were permitted to costlessly “leave” the market, which would make the screen go blank except
for a button that allowed them to costlessly return.
In the second stage, buyers who purchased a ticket as well as the sellers who did not sell their
ticket were asked to allocate $16 between themselves and an anonymous recipient. Despite the
anonymity of the recipient, each ticket was randomly matched to a specific recipient, and it was
common knowledge that recipients observed all the action in the market corresponding to their
ticket (including asking prices) even though they could not actively participate.
After the second stage, subjects saw a results page that gave the current period’s balances for
the buyer, seller, and recipient if the ticket was sold. Sellers who kept their ticket saw their
balance and the recipient’s, while buyers who did not buy saw only their own balance. A
buyer’s balance for a given period was $18 if no ticket was purchased or $18 plus the amount
kept less the price, if a ticket was purchased in that period. Thus the buyer was able to offer, or
the seller to request, more than the $16 endowment. A seller’s balance was the amount kept, if

9
the ticket was not sold, or the price, if the ticket was sold. Recipients’ balances were always
equal to the amount given to them by the dictator in stage two.
Control sessions were designed so that participants would effectively “replay” the dictator
game portion of the Market session, and only this portion. To do this, the outcomes of prior
Market sessions were used to replicate the exact allocations created by the markets, which
Control participants then saw as a series of exogenously imposed initial allocations. A more
detailed explanation of how this was implemented follows.
Each Control session was, to the extent possible, identical to the Market sessions, but with no
market interaction in the first stage. Instead, Control participants were matched to the outcomes
from a participant of the same role (Type A, B, or C) from a prior Market session. In other
words, each Control session was paired to the first-stage data from a previous Market session.
Then, within each Control session, each participant was paired with the stage one data from a
previous Market participant.4 Every aspect of the Market treatment design was preserved in the
Control with new subjects, except that the Control lacked the actual market interaction in the first
stage of each period. The timing and outcomes of any market interaction in the paired Market
treatment (ticket assignment and its effect on endowments) were carried through precisely to the
paired Type A and B participants (“replaying” the roles of buyers and sellers, respectively) in the
second stage of each period of the matching Control session.5 As each participant was mirroring
a participant from a Market session, Type A participants (“sellers”) and recipients were still
randomly matched in each period, as in the Market session. These pairings changed in each
period as determined by the market outcomes from the Market session. Each control participant
then effectively “replayed” all second stage (dictator game) decisions that the paired market
participant made.
Control subjects began the second stage exactly as did their corresponding Market subjects,
with identical endowments and ticket distribution. So, for instance, if a Control subject was
“replaying” the role of a buyer who had bought the rights to a game in Period 1 for $14, the
4 Necessarily, the Control treatments were run after all Market treatments had been completed. Each had the same number of sessions and subjects of the same type. 5 See the appendix B2 for instructions. Importantly, we informed subjects that the ticket assignment and endowments would be made “in a predetermined manner.”

10
control subject would be allocated $4 and would then divide a $16 endowment. If the Market
buyer didn’t buy a ticket in Period 2, then in Period 2 the Control subject would receive $18 and
would not play the dictator game (The Control subject would be passive for that stage, just as the
corresponding Market buyer had been).
Therefore, the only decisions subjects made in each period of the Control treatment sessions
were, for those who held a ticket, how to allocate the $16 between themselves and a passive
recipient. All other timings and allocations stemmed from importing the outcomes of the first
stage of a paired prior Market session. This allows us to examine how dictator giving varies
between two environments were the only differences are the sample of participants (drawn from
the same population) and (crucially) whether or not dictators had participated in a market prior to
making their allocation decision.
Subjects’ payoffs were always denoted in dollars, and their balances reset after each period.
Subjects were told that one randomly selected period would be drawn to count towards their
payment. The round was predetermined and placed in an envelope in the front of the room. At
the conclusion of the experiment, subjects in all sessions were given a questionnaire which
consisted of incentivized recollection questions concerning their own decisions (when
applicable), incentivized elicitations of beliefs about others’ decisions, and a series of
(unincentivized) questions concerning fairness and feelings of responsibility. Subjects were paid
their earnings from the predetermined round, plus their questionnaire earnings, and a $10 show-
up fee.
4. Theoretical Predictions and Hypotheses
If all players in the double auction market and dictator game have standard self-interested
preferences, there is a trivial prediction of $0 given to the recipient, and no transactions (except
perhaps at $16) in the market. However, given the convincing experimental results of
involuntary generosity and fairness evasion detailed above, we will base our predictions in the
market-dictator game on an extension of the model of “reluctant sharers” described in Lazear et

11
al. (2012), (hereafter, LMW) where the utility received of an agent may depend on their sharing
environment.6
Let 𝑋 = (𝑥!,… , 𝑥!) be a vector of the material payoffs for each player in the market-dictator
game. Agents in our model have a utility of 𝑢! 𝐷! , 𝑥! ,𝑋!! where 𝐷! = 1 if agent 𝑖 plays the role
of dictator, and 𝐷! = 0 otherwise. This precisely follows LMW (where 𝑛 = 2), with the lone
departure that 𝐷 = 0 in their model indicated that sharing was not possible and the potential
recipient of money from the dictator game was never informed of their missed opportunity. In
our version, 𝐷! = 0 merely reassigns the role of dictator to another agent rather than making the
game itself disappear. If selling the right to be a dictator allows the seller to not feel responsible
for the recipient’s outcome in the same way that exiting the dictator game does, these two utility
functions should account for the same behavior.
The LMW model formalizes reluctant sharing as agents who would give money in the
dictator game, but prefer to opt out if compensated with the full endowment of the dictator game,
or
𝑢! 1, $16, $0 < max!!∈ !,$"#
𝑢! 1, 𝑥! , $16− 𝑥! < 𝑢! 0, $16, $0
Lazear et al. (2012) reports an average of 37% of subjects classified as reluctant sharers and only
30.5% as willing sharers (pg. 157). The remaining subjects are primarily considered self-
interested non-sharers, with only a few unclassified subjects. We apply this classification to
agents in our market dictator game in the following way. If a seller is a reluctant sharer and
chooses not to sell the dictator game, she will attain an expected utility of
max!!∈[!,!"]
𝐸!!!(!!) 𝑢! 1, 𝑥! ,𝑋!!(𝑥!)
where 𝑋!!(𝑥!) represents other players’ payoffs given that 𝑥! is kept in the dictator game, with
the expectation over all allocations weighted by their likelihood. If, however, this seller chooses
to sell the dictator game at a price, 𝑝, she receives an expected utility of
6 While it is possible to make more precise predictions about market outcomes by making additional assumptions about the form of the agents’ utility functions, we are compelled by the scope of our study to restrict analysis to the more general case presented here.

12
𝐸!!!(!) 𝑢! 0,𝑝,𝑋!!(𝑝)
which we assume is continuous and increasing in 𝑝 for all agents.7
We can therefore establish each seller’s willingness to accept, 𝑧! as the price where the
expected utility of selling equals the expected utility of keeping the game, or
max!!∈[!,!"]
𝐸!!!(!!) 𝑢! 1, 𝑥! ,𝑋!!(𝑥!) = 𝐸!!!(!!) 𝑢! 0, 𝑧! ,𝑋!!(𝑧!)
Note that 𝑧! is not a prediction of the asking price of a seller, rather the minimum price a seller
would accept. With minimal assumptions about agent 𝑖’s other-regarding preferences8, we can
say that a reluctant sharer must have 𝑧! < $16. For self-interested sellers, 𝑧! = $16, while for
willing sharers there is no clear prediction for 𝑧! because it will depend on their beliefs about
buyers’ behavior.
On the buyer’s side, it is straightforward that self-interested subjects will make offers less
than $16, with a maximum willingness to pay of $16. Reluctant sharers would have a maximum
willingness to pay of less than $16, while willing sharers may be above or below depending on
their beliefs. This, however, is enough to generate the theoretical prediction that there would be
an excess supply of dictator games at a price of $16 because at least the self-interested and
reluctant sharers are willing to sell, while at most the self-interested and willing sharers are
willing to buy. Since LMW find more reluctant sharers than willing sharers, we hypothesize that
there will be downward pressure at a price of $16, and a market clearing “equilibrium” price will
be less than $16 in the market dictator game.
Hypothesis 1: The price of dictator games sold in Market will be less than $16.
Because they have the most incentive to sell, we hypothesize that most subjects who sell the
right to play as dictator will be reluctant sharers. Subjects choosing to buy may be self-interested
or willing sharers, but we predict self-interested buyers will be more likely to purchase the right 7 This assumption is equivalent to assuming that any disutility arising from the expectation that increasing the transaction price results in a less favorable distribution among other players is less than the utility of receiving a higher price. 8 Since reluctant sharers prefer (0,$16,$0) to (1,$16,$0) in the 2 player game, to show a reluctant sharer prefers to sell at $16 in the full game we only need to assume 1.) adding additional agents with fixed payoffs does not change this preference (since selling at $16 when the buyer keeps all of it does not change payoffs), and 2.) the agent does not prefer a more unequal split among other agents (so that the agent does not mind if the buyer gives money to the recipient).

13
to be a dictator, in particular because any price below $16 would immediately be attractive to
them. Therefore we predict a market selection effect as follows: more self-interested subjects
will obtain the right to be dictator during the market phase from reluctant sharers, which causes a
decrease in the amount shared with the recipient as compared to the Control treatment where the
right to be dictator is assigned randomly.
Hypothesis 2: Dictators in the Market treatment will give less money to recipients than dictators in the Control treatment. 5. Results
We first address our hypothesis that trade will occur at prices below the endowment. Next
we compare the amount given by dictators in the Market treatment to the amount given in the
Control treatment, paying close attention to the different behavior of buyers and sellers. Lastly,
we use data from survey measures and an incentivized questionnaire to examine the role of
beliefs.
5.1 Transactions and Prices in the Market Treatment
As detailed below, subjects in the Market treatment utilized the market frequently, often with
substantial monetary consequence. In sum, the dictator game in the Market treatment was
exchanged in 40.3% of all possible transactions, with participation fairly consistent across
sessions and periods. 9 At least 29% of the dictator games were traded in each session with no
notable change in the frequency of exchange over time.
[Figure 1 here]
Figure 1 provides a visual illustration of timing of bids, asks, and price formation in the
market for the first two Market sessions. (We include the third and fourth sessions as Figure A1
in the appendix to conserve space). Bids and asks tend to converge from the bottom, moving up
toward $16 (the size of the endowment), with prices rising and offers becoming tighter as each
session progresses. The average price for dictator games sold was $14.76, with a standard
deviation of $2.43.
9 Note that the observed rate of transactions (40.3%) is nearly identical to the “exit” rate seen in Dana et al. (2006).

14
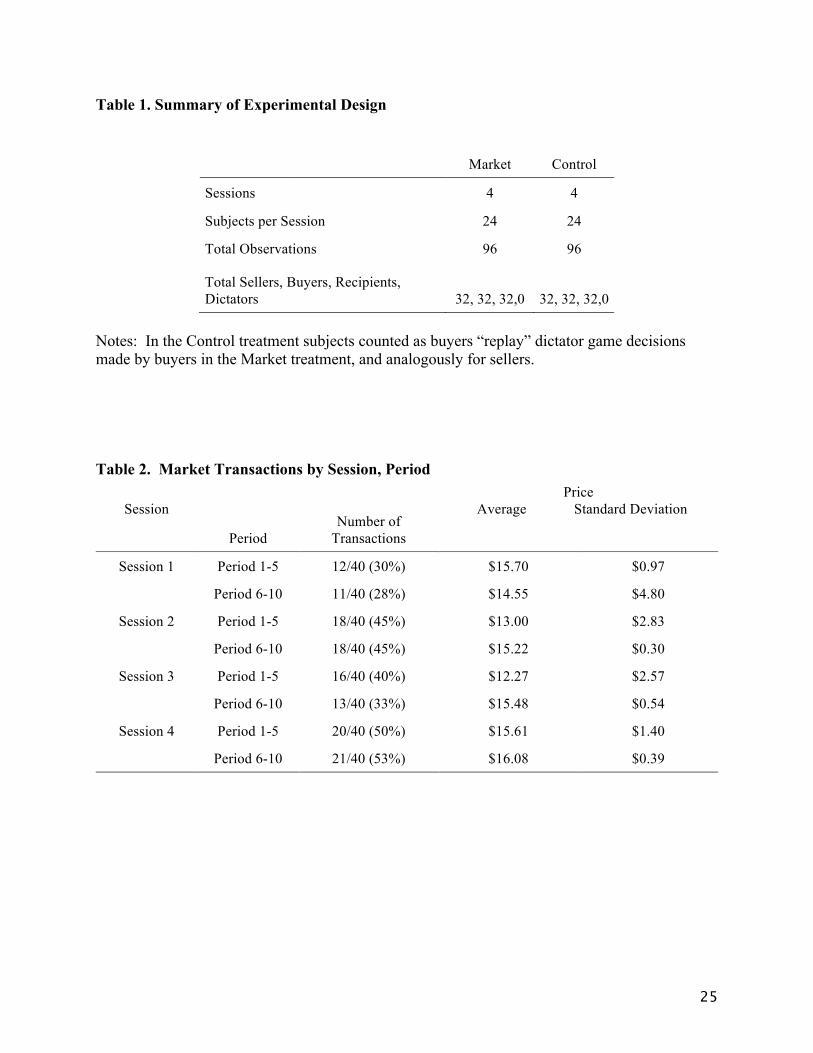
[Table 2 here]
Table 2 summarizes the average prices and standard deviations across sessions grouped into
5-period blocks. Prices were higher in the second 5-period block in three out of four sessions,
and overall average prices rose from $14.10 in the first block to $15.44 in the second.
[Figure 2 here]
Figure 2 shows a histogram of the distribution of prices in $0.50 intervals. Not surprisingly,
there is a noticeable cluster of games sold at or near $16. Fewer than 15% of the transactions
occurred at price of $16, meaning that the vast majority of exchanges cannot be explained merely
by self-interest and indifference. Around 70% of games were sold for a price less than $16 and
almost 16% were actually sold for more than $16. Therefore, while we see that the majority of
games are sold for less than $16, Hypothesis 1 (that games will be traded for less than $16) is not
satisfied by a sizable portion of the data.
The bulk of prices just under $16 support the theory that a large number of sellers are
reluctant sharers (per LMW), as they accept offers of almost the full endowment in order to not
play the role of dictator. Despite earning less than the full endowment, reluctant sharing sellers
are benefit greatly from the market: they manage to earn more money than the average dictator
earned in the Control treatment without having to be directly responsible for the very low
earnings of recipients. In the next section, we examine how markets influence the dictator game
allocation decisions.
5.2. Giving to Recipients by Treatment
5.2.1 Central Tendencies in Giving to Recipients
[Table 3 here]
Hypothesis 2, that dictators in the Market treatment will give less money to recipients than in
the Control treatment, is strongly supported by the data. The left column of Table 3 reports the
breakdown of average giving by treatment and role. In the dictator game following the Market,
the dictators gave an average of 7.3% of the endowment. In contrast, dictators in the control
treatment gave a little over twice as much: around 15.7% of the endowment. As a group, the
buyers who bought a dictator game in the Market gave an average of 10.4% to the recipients.
15
Compare this to the sellers that kept the dictator game in the Market, who only gave 5.1%. In the
Control, this asymmetry was flipped. Dictators “replaying buyer decisions” gave an average of
10.9%, while dictators “replaying seller decisions” gave 18.9%.
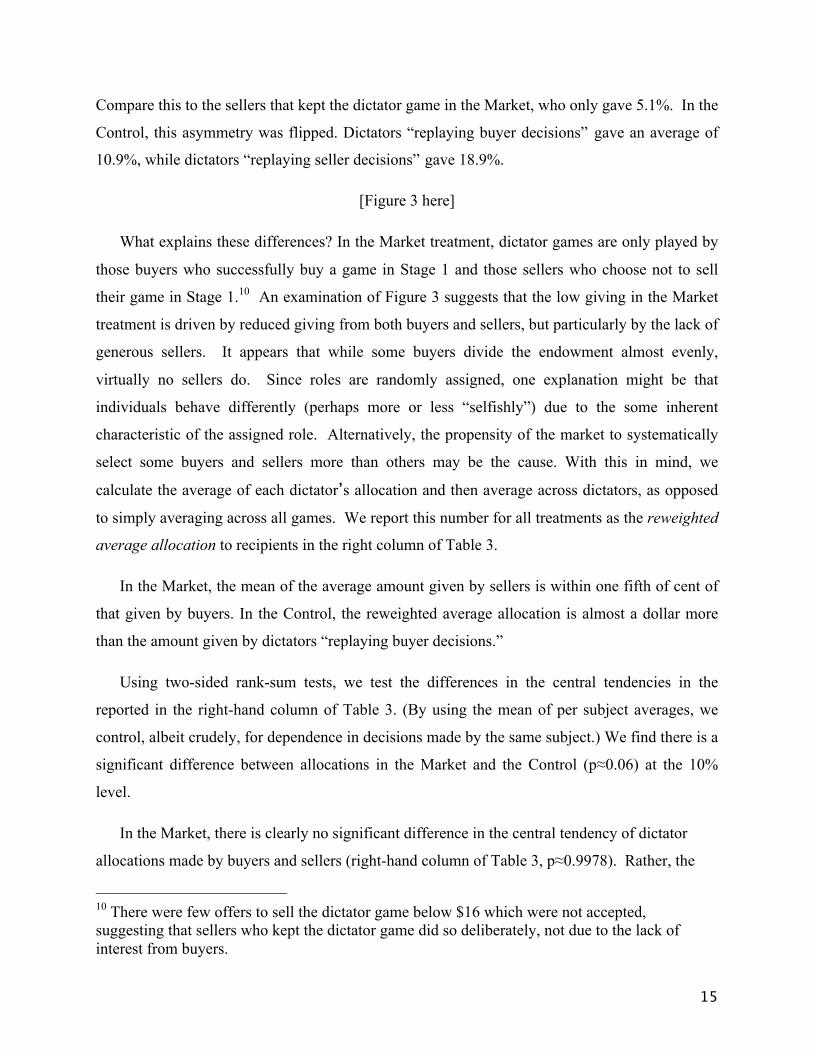
[Figure 3 here]
What explains these differences? In the Market treatment, dictator games are only played by
those buyers who successfully buy a game in Stage 1 and those sellers who choose not to sell
their game in Stage 1.10 An examination of Figure 3 suggests that the low giving in the Market
treatment is driven by reduced giving from both buyers and sellers, but particularly by the lack of
generous sellers. It appears that while some buyers divide the endowment almost evenly,
virtually no sellers do. Since roles are randomly assigned, one explanation might be that
individuals behave differently (perhaps more or less “selfishly”) due to the some inherent
characteristic of the assigned role. Alternatively, the propensity of the market to systematically
select some buyers and sellers more than others may be the cause. With this in mind, we
calculate the average of each dictator’s allocation and then average across dictators, as opposed
to simply averaging across all games. We report this number for all treatments as the reweighted
average allocation to recipients in the right column of Table 3.
In the Market, the mean of the average amount given by sellers is within one fifth of cent of
that given by buyers. In the Control, the reweighted average allocation is almost a dollar more
than the amount given by dictators “replaying buyer decisions.”
Using two-sided rank-sum tests, we test the differences in the central tendencies in the
reported in the right-hand column of Table 3. (By using the mean of per subject averages, we
control, albeit crudely, for dependence in decisions made by the same subject.) We find there is a
significant difference between allocations in the Market and the Control (p≈0.06) at the 10%
level.
In the Market, there is clearly no significant difference in the central tendency of dictator
allocations made by buyers and sellers (right-hand column of Table 3, p≈0.9978). Rather, the
10 There were few offers to sell the dictator game below $16 which were not accepted, suggesting that sellers who kept the dictator game did so deliberately, not due to the lack of interest from buyers.

16
fact that sellers give less than buyers overall would appear to originate in the selection process
inherent to the market, with certain buyers and sellers being more likely to obtain or retain the
dictator game. In the Control treatment, while there is a larger gap for dictators “replaying buyer
and seller decisions,” this difference is not significant at the 10% level (p≈0.16).
5.2.2 Analyzing and Interpreting Giving to Recipients
[Table 4 here]
A better understanding the aggregate differences between giving in the Market and Control
requires accounting for unobserved individual heterogeneity and possible censoring of dictator
sentiment in the observed data.11 With this aim, we report the results of three Random Effects
Tobit Regressions in Table 4, both pooling the Market and Control treatments and for each
separately. We regress giving in the dictator game on the dictator's role (with a dummy for
Buyer) and the Period number. For the regression on the pooled data, we also include a dummy
for the Market and two interaction terms. (We report linear regressions in Table A1 of the
Appendix.)
When pooling the Control and Market data (Model 1), we find that participating in the
Market selection mechanism has a significant and negative impact on the amount allocated to
recipients. Further, we find that in all regressions, giving significantly decreases with period, and
more so for the Market than the Control. While the signs on the Buyer dummy and
Market*Buyer interaction are of the sign one might expect based on the analysis in the previous
section (negative and positive respectively), neither is significant nor are they jointly significant
(p≈0.43 by Likelihood Ratio Test). Similarly, we find that the coefficient estimates on the Buyer
dummy exhibits the expected sign in the Market-only and Control-only regressions (Models 2
and 3), but neither is significant.12
11 This specification presumes that a latent sentiment may exist to “take” a recipient’s wealth in excess of taking the entire endowment (Bardsly, 2008), but that this sentiment is censored by the $0 lower bound on giving (and analogously at $16 for the most “generous” dictators). 12 As a robustness check, the models reported in Tables 4 and 5 were also estimated with period dummies and as linear models with cluster-robust standard errors. There is no change in the sign and little variation in the significance of the estimated coefficients. This additional analysis is available upon request from the authors.
17
In the next section, we turn our attention to explaining why dictator allocations are lower in
the Market than the Control by breaking down buyer and seller behavior.
5.3 Explaining Low Giving in Market Treatment
5.3.1 Buyer Behavior
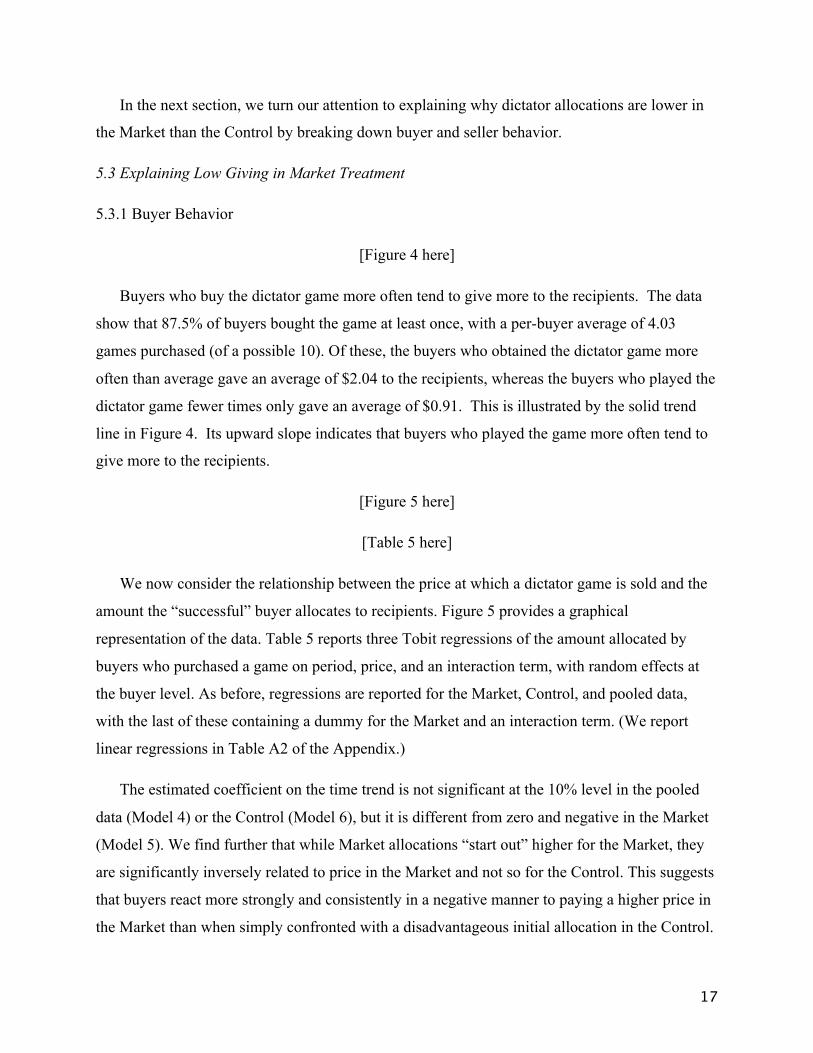
[Figure 4 here]
Buyers who buy the dictator game more often tend to give more to the recipients. The data
show that 87.5% of buyers bought the game at least once, with a per-buyer average of 4.03
games purchased (of a possible 10). Of these, the buyers who obtained the dictator game more
often than average gave an average of $2.04 to the recipients, whereas the buyers who played the
dictator game fewer times only gave an average of $0.91. This is illustrated by the solid trend
line in Figure 4. Its upward slope indicates that buyers who played the game more often tend to
give more to the recipients.
[Figure 5 here]
[Table 5 here]
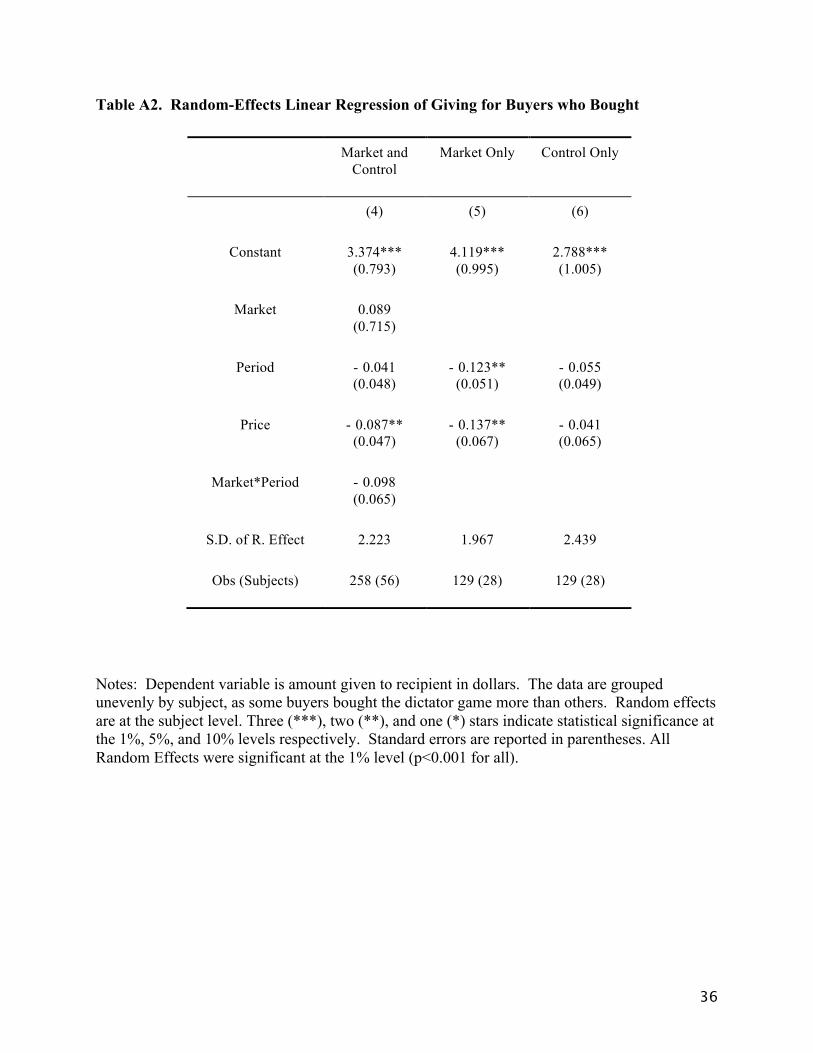
We now consider the relationship between the price at which a dictator game is sold and the
amount the “successful” buyer allocates to recipients. Figure 5 provides a graphical
representation of the data. Table 5 reports three Tobit regressions of the amount allocated by
buyers who purchased a game on period, price, and an interaction term, with random effects at
the buyer level. As before, regressions are reported for the Market, Control, and pooled data,
with the last of these containing a dummy for the Market and an interaction term. (We report
linear regressions in Table A2 of the Appendix.)
The estimated coefficient on the time trend is not significant at the 10% level in the pooled
data (Model 4) or the Control (Model 6), but it is different from zero and negative in the Market
(Model 5). We find further that while Market allocations “start out” higher for the Market, they
are significantly inversely related to price in the Market and not so for the Control. This suggests
that buyers react more strongly and consistently in a negative manner to paying a higher price in
the Market than when simply confronted with a disadvantageous initial allocation in the Control.

18
The model predicts that the same buyer in the Market allocates less to the recipient for every
dollar spent buying the game. One hypothesis that could explain this result is that some buyers
use the market price to justify selfish behavior. Low giving may be necessary after a high price
is paid in order to roughly break even on the transaction, and some buyers may believe that such
behavior is (more) acceptable if the recipient gets nearly as much the seller would have given.
[Table 6 here]
On the other hand, many buyers are clearly not concerned with turning a profit. In fact, in
Table 6 we see that while a plurality of exchanges resulted in a profit for buyers, in 40% of the
exchanges the buyers were actually taking a loss. Furthermore, the magnitude of loss was larger
than that of gains, meaning that on average buyers are actually lose money by participating in the
market. A little over half of the transactions (53%) resulted in a net benefit for the buyer
between -$1 and $1. The relationship of price and amount kept is suggestive. One possible
explanation is that buyers may attempt to absolve themselves of the responsibility of the
generally poor outcomes for the recipient by reasoning that recipients’ fortunes would not be
much different if the seller had kept the dictator game. This raises the question: how did sellers
behave?
5.3.2 Seller Behavior
Sellers who sell the dictator game less often tend to give less to the recipients. The steep
slope of the dashed trend line of Figure 4 illustrates that sellers who play the game more often
tend to be less generous. We note that about 94% sellers sold the game at least once, and all but
one retained the game at least once. The sellers who remained dictator more often than average
gave an average of only $0.26 to the recipient, while sellers who remained dictator less than
average gave a much more respectable $2.47 on average to the recipients.
Why do sellers who sell less often give less to the recipients? Consider the three types of
sellers, defined in section 4 based on the LMW specification: self-interested, willing sharers and
reluctant sharers. When there is an outstanding bid above $16, both self-interested and reluctant
sharers would like to accept it. However, when the only available bids are below $16, only
reluctant sharers would accept. Due to the spread of incoming bids, we would expect that
reluctant sharers find acceptable trading partners more often than self-interested sellers, even

19
though they are relatively generous when they end up keeping the game. The trend for sellers
pictured in Figure 4 echoes this result and suggests that this kind of market selection occurs in
our experiment.
There is another surprising result in our data which suggests that market selection alone
cannot explain our results. Specifically, out of 32 sellers in our experiment there is not one who
consistently refused to sell the dictator game and gave an amount to the recipients at least as
large as the average seller in the Control. Recall that LMW find that 30% of subjects are willing
sharers. Willing sharers should not sell their dictator game unless they believed that the buyer
would be even more generous to the recipient, but when we elicit their beliefs (as detailed in the
next section) we find that sellers do not expect buyers to be generous. It seems as though willing
sharers simply do not exist on the seller side of the market, even though they should exist in
equal proportions among buyers and sellers. Instead, market interaction appears to be affecting
sellers (of each type) by monetizing the dictator game and reducing the amount of money they
feel obligated to give to the recipients.13 The results are consistent with market forces overriding
or eroding the otherwise pro-social attitudes of sellers when the opportunity presents itself, as
argued in Falk and Szech (2013).
5.4 Attitudes and Beliefs
In order to learn more about subjects’ feelings of responsibility, we asked subjects to report
their attitudes toward fairness and responsibility using a 5-point scale from 1 (strongly disagree)
to 5 (strongly agree). Table A3 in the appendix displays averages of these reports by role, as
well as looking at different subgroups of buyers and sellers split at the median point.
Subjects across the board are slightly more likely to consider their own decisions to be fair,
and expect recipients not to agree. Those who give less correctly believe that recipients will
view their actions as less fair. Subjects report lower feelings of responsibility in both Market and
Control for both buyers and sellers. All subgroups except low giving sellers report slightly
agreeing on average that they are responsible for the recipient’s outcome. Frequent sellers report
feeling just as responsible as infrequent ones. This suggests that the act of selling is not a direct
13 We test the hypothesis that the available market price affects the amount sellers who keep the dictator game choose to give, but we find no significant effect.
20
means of reducing one’s feeling of responsibility for an unequal outcome. The reduced feelings
of responsibility may instead come from the interaction of the market, which monetizes the value
of being dictator for buyers and sellers alike.
[Table 7 here]
In Table 7, we report incentivized elicitations of how much subjects believe that buyers and
sellers as a whole would give to recipients on the average. Table 7 suggests that sellers are not
fooling themselves into believing that by allowing someone else to play the role of dictator, they
are not harming recipients. In fact, sellers (paid for accuracy) actually guessed that recipients
were receiving $0.65 less than they actually were! Both buyers and sellers believed that sellers
were giving more than they actually were when they decided not to sell. Although speculative,
we note that pro-social buyers may have been more willing to buy the dictator game if they knew
exactly how little sellers were giving.
6. Discussion
When negative externalities fall upon third parties, there are incentives to sell off these
“morally tough” decisions to others. In this vein, we study a laboratory market where the role of
dictator is put up for auction rather than being assigned at random. We find over 40% of games
are traded in this market. We also find aggregate giving after assignment in the Market is less
than half of what it was in a Control treatment where subjects are directly assigned that right.
Why do participants in the Market treatment give less than in the Control? Our analysis
admits at least two possibilities. Market interaction may fundamentally alter an individual’s
propensity to exhibit pro-social behavior, thereby changing the distributional outcomes.
Additionally, the market may systematically transfer decision rights to individuals whose other-
regarding preferences toward the third party (i.e. the recipient) are less pro-social.
Caution is warranted in trying to distinguish exposure to the market from the effects of
selection. Participating in a market is participating in a selection mechanism, and it may not be
possible to fully disentangle the impact of selection from the exposure to participating in the
market. However, our results are consistent with the view that the negative impact of the market
on the pro-social preferences of both buyers and sellers cannot be explained by selection alone.
21
Setting this point aside, selection also appears to contribute directly to decreased giving. We
find that both “more generous” buyers buy more often and that, in aggregate, the trade in dictator
games represents a net loss to buyers. But at the same time, we see that prospectively “more
generous” sellers sell more often. This dichotomy is not easily explained. Buyer and sellers are
drawn from the same population, and yet buyers that appear more pro-social (at least in how they
play the dictator game) use the market to buy largely from sellers who are also more pro-social
than their counterparts who did not sell.
What does this tell us about markets for agency for “morally tough” decisions? In our
experiment, while more “generous” buyers of agency rights are more likely to buy, they appear
to buy from sellers who might otherwise be more generous themselves. The net effect (in the
experiment) is that the presence of the market materially harms passive recipients. While this
experiment is a simplified and very specific case, it is consistent with the broader literature
(discussed earlier) suggesting that markets, directly and/or through selection, dilute the potential
for pro-social preferences to be realized in outcomes for those external groups that are indirectly
impacted by market activity.
In attempting to explain this result, one might ask whether sellers are deluding themselves
into believing that buyers give more than they do, or similarly for buyers. Using incentivized
belief elicitation tasks, we show that our results are not driven by ignorance, willful or otherwise,
about the eventual outcomes of recipients. Therefore the deleterious effect of market interaction
cannot simply be corrected by ensuring that market participants have better knowledge of the
indirect effects of their actions. If there is an undesirable side-effect of certain interactions in a
market, the broader literature (consistent with the results of this study) suggest that one way to
reduce such externalities may be to make participants feel more responsible for their actions. As
we learn more about the way our preferences for fairness interact with our market experiences,
we may discover if, where, and how endogenous institutional innovations in markets or market
intervention may impact the type of distributional outcomes seen in the field.

22
References
Al-Ubaydi, O., Houser, D., Nye, J., Paganelli, M. P., and Pan, X. S. (2013) "The Causal Effect of Market Priming on Trust: An Experimental Investigation Using Randomized Control. PLoS One 8(3): e55968.
Andreoni, J. and Bernheim, B. D. (2009) Social Image and the 50-50 Norm: A Theoretical and Experimental Analysis of Audience Effects. Econometrica, 77, 1607-1636
Bardsley, N. (2008) Dictator game giving: altruism or artefact? Experimental Economics, 11, 122-133
Bartling, B., and Fischbacher, U. (2012) Shifting the Blame: On Delegation and Responsibility. Review of Economic Studies, 79, 67-87.
Battigalli, P., and Dufwenberg, M. (2007) Guilt in games. American Economic Review, 97, 170-176.
Bednar, J., Chen, Y., Liu, T. X., and Page, S. (2012) Behavioral spillovers and cognitive load in multiple games: An experimental study. Games and Economic Behavior, 74, 12-31.
Benabou, R. J. M., and Tirole, J. M. (2006) Incentives and Prosocial Behavior, American Economic Review, 95 (5), 1652-1678..
Bolton, G. E., and Ockenfels, A. (2000) ERC: A Theory of Equity, Reciprocity and Competition, American Economic Review, 90(1), 166-193.
Bowles, S. (1998) Endogenous Preferences: The Cultural Consequences of Markets and other Economic Institutions. Journal of Economic Literature, 36, 75-111.
Broberg, T., Ellingsen, T., and Johannesson, M. (2007) Is generosity involuntary?. Economics Letters, 94, 32-37.
Camerer, C. F. (2003) Behavioral Game Theory: Experiments on Strategic Interaction, Princeton: Princeton University Press.
Cason, T., Savikhin, A. C., and Sheremeta, R. M. (2012) Behavioral spillovers in coordination games. European Economic Review, 56, 233-245.
Charness, G. and Rabin, M. J. (2002) Understanding Social Preferences with Simple Tests, Quarterly Journal of Economics, 117(3), 817-869.
Chen, D. (2010) Markets and Morality: How does Competition Affect Moral Judgment? Duke Law School working paper.

23
Cherry, T.L, Frykblom, P., Shogren, J.F. (2002) Hardnose the Dictator. American Economic Review, 92(4), 1218-1221.
Coffman, L. (2009) Intermediation Reduces Punishment (and Reward). American Economic Journal: Microeconomics, 3, 77-106.
Cox, J., and Sadiraj, V. (2010) Direct Tests of Individual Preferences for Efficiency and Equity. Economic Inquiry, 50, 920-931.
Dana, J., Cain, D. M., Dawes, R. (2005) What you don't Know Won't Hurt me: Costly (but quiet) Exit in a Dictator Game, Organizational Behavior and Human Decision Processes, 100(2), 193-201.
Dana, J., Weber, R. A., and Kuang, J. X. (2007) “Exploiting ‘moral wriggle room’: Experiments demonstrating an illusory preference for fairness.” Economic Theory 33(1): 67-80.
Dillenberger, D., and Sadowski, P. (2012) Ashamed to be Selfish. Theoretical Economics, 7, 99-124.
Drugov, M., Hamman, J. R., and Serra, D. (2014) Intermediaries in corruption: An experiment. Experimental Economics, 17, 78-99.
Dufwenberg, M., and Kirchsteiger, G. (2004) A theory of sequential reciprocity. Games and Economic Behavior, 47, 268-298.
Engelmann, D. and Strobel, M. (2004) Inequality Aversion, Efficiency, and Maximin Preferences in Simple Distribution Experiments, American Economic Review, 94, 857-869.
Falk, A. and Szech, N. (2013) Morals and Markets. Science, 340, 707-711.
Fehr, E., and Schmidt, K. M. (1999) A Theory of Fairness, Competition, and Cooperation, Quarterly Journal of Economics, 114, 817-868.
Fischbacher, U. (2007) z-Tree - Zurich Toolbox for Readymade Economic Experiments. Experimental Economics, 10, 171-178.
Forsythe, R. E., Horowitz, J. L., Savin, N.E., and Sefton, M. (1994) Fairness in Simple Bargaining Experiments, Games and Economic Behavior, 6, 347 - 369.
Greiner, B. (2004) An online recruitment system for experimental economics. In K. Kremer and V. Macho (Eds.), Forschung und wissenschaftliches Rechnen 2003, Volume 63, pp. 79-93. Göttingen: Ges. für Wiss. Datenverarbeitung.
Oexl, R., and Grossman, Z. J. (2013) Shifting the blame to a powerless intermediary. Experimental Economics,16, 306-312.

24
Hamman, J. R., Loewenstein, G., and Weber, R. A. (2010) Self-interest through delegation: An additional rationale for the principal-agent relationship. American Economic Review, 100, 1826-1846.
Henrich, J., Ensminger, J., McElreath, R., et al. (2010) Markets, Religion, Community Size, and the Evolution of Fairness and Punishment. Science, 327, 1480-1484
Herz, H. and Taubinsky, D. (2014) What Makes a Price Fair? An Experimental Study of Market Experience and Endogenous Fairness Norms. Harvard University working paper.
Hirschman, A. O. (1977) The passions and the interests: Political arguments for capitalism before its triumph. Princeton: Princeton University Press.
Hirschman, A. O. (1982) Rival Interpretations of Market Society: Civilizing, Destructive, or Feeble? Journal of Economic Literature, 20, 1463-1484.
Hoffman, E., McCabe, K., Shachat, K., Smith V., (1994) Preferences, Property Rights, and Anonymity in Bargaining Games. Games and Economic Behavior, 7(3), 346-380.
Lazear, E. P., Malmendier, U. M., Weber, R. A. (2012) Sorting in Experiments with Application to Social Preferences. American Economic Journal: Applied Economics, 4, 136-163.
Lemieux, T., MacLeod, W. B., & Parent, D.. (2009) Performance pay and wage inequality. The Quarterly Journal of Economics, 124, 1-49.
Murnighan, J. K., Oesch, J. M., and Pillutla, M. M. (2001) Player Types and Self Impression Management in Dictator Games: Two Experiments, Games and Economic Behavior, 37(2), 388-414.
Rabin, M. J. (1993) Incorporating Fairness into Game Theory and Economics. American Economic Review, 83, 1281-1302.
Savikhin, A. C., and Sheremeta, R. M. (2013) Simultaneous decision-making in competitive and cooperative environments. Economic Inquiry, 51, 1311-1323.
Stiglitz, J. E. (2012) The Price of Inequality: How Today's Divided Society Endangers Our Future. WW Norton.
Tadelis, S. (2008) The power of shame and the rationality of trust. Available at SSRN 1006169.
Verhoogen, E. A. (2008) Trade, quality upgrading, and wage inequality in the Mexican manufacturing sector. Quarterly Journal of Economics, 123, 489-530.
25
Table 1. Summary of Experimental Design
Market Control
Sessions 4 4
Subjects per Session 24 24
Total Observations 96 96
Total Sellers, Buyers, Recipients, Dictators 32, 32, 32,0 32, 32, 32,0
Notes: In the Control treatment subjects counted as buyers “replay” dictator game decisions made by buyers in the Market treatment, and analogously for sellers. Table 2. Market Transactions by Session, Period
Session
Period Number of
Transactions
Price Average Standard Deviation
Session 1 Period 1-5 12/40 (30%) $15.70 $0.97
Period 6-10 11/40 (28%) $14.55 $4.80
Session 2 Period 1-5 18/40 (45%) $13.00 $2.83
Period 6-10 18/40 (45%) $15.22 $0.30
Session 3 Period 1-5 16/40 (40%) $12.27 $2.57
Period 6-10 13/40 (33%) $15.48 $0.54
Session 4 Period 1-5 20/40 (50%) $15.61 $1.40
Period 6-10 21/40 (53%) $16.08 $0.39

26
Table 3. Summary of Dictator Game Allocations by Treatment and Role
Treatment and Role Average Allocation to
Recipients Reweighted Average
Allocation to Recipients
Market Treatment $1.17
($2.33)
$1.48
($2.36)
All Buyers $1.68
($2.59)
$1.48
($2.20)
All Sellers $0.82
($2.09)
$1.48
($2.53)
Control Treatment $2.51
($3.39)
$2.48
($2.83) All “Buyers” $1.75
($2.74)
$1.94
($2.57)
All “Sellers” $3.03
($3.68)
$2.97
($3.01)
Notes: “Average Allocation to Recipients” is an average calculated by weighing each dictator game equally. “Reweighted Average Allocation to Recipients” is calculated by finding the average amount allocated by each dictator, and then calculating the mean of these averages. Standard deviations are in parentheses.

27
Table 4. Random-Effects Tobit Regression of Giving
Market and Control
Market Only Control Only
(1) (2) (3)
Constant 2.601*** (0.801)
0.700 (0.759)
2.538*** (0.859)
Market -2.066* (1.154)
Buyer -1.403 (1.106)
0.731 (1.024)
-1.423 (1.188)
Period
-0.162*** (0.055)
-0.299*** (0.059)
-0.167*** (0.058)
Market*Buyer 2.185 (1.579)
Market*Period -0.146* (0.084)
S.D. of R. Effect 3.937 3.578 4.231
Obs (Subjects) 640 (118) 320 (59) 320 (59)
Notes: Dependent variable is amount given to recipient in dollars. The data are grouped unevenly by subject, as some subjects played the dictator game more than others. Random effects are at the subject level. Three (***), two (**), and one (*) stars indicate statistical significance at the 1%, 5%, and 10% levels respectively. Standard errors are reported in parentheses. An upper limit of $16 and a lower limit of $0 were used in the Tobit. All Random Effects were significant at the 1% level (p<0.001 for all). Linear regressions with the same data are reported in Table A1.

28
Table 5. Random-Effects Tobit Regression of Giving for Buyers who Bought
Market and Control
Market Only Control Only
(4) (5) (6)
Constant 3.527*** (1.304)
4.693*** (1.597)
2.420 (1.788)
Market 0.3047 (1.172)
Period -0.100 (0.084)
-0.265*** (0.090)
-0.1272 (0.087)
Price -0.170** (0.079)
-0.238** (0.107)
-0.0819 (0.122)
Market*Period -0.186 (0.115)
S.D. of R. Effect 3.550 3.317 3.715
Obs (Subjects) 258 (56) 129 (28) 129 (28)
Notes: Dependent variable is amount given to recipient in dollars. The data are grouped unevenly by subject, as some buyers bought the dictator game more than others. Random effects are at the subject level. Three (***), two (**), and one (*) stars indicate statistical significance at the 1%, 5%, and 10% levels respectively. Standard errors are reported in parentheses. An upper limit of $16 and a lower limit of $0 were used in the Tobit. All Random Effects were significant at the 1% level (p<0.001 for all). Linear regressions with the same data are reported in Table A2.

29
Table 6. Net Benefit of Dictator Game to Successful Buyers in the Market
Net Benefit to Buyers Number of
Transactions Average Net
Benefit
Profit (Price < Amount Kept) 62 (48%) $1.94
Zero (Price = Amount Kept) 16 (12%) $0.00
Loss (Price > Amount Kept) 51 (40%) -$3.48
Total 129 -$0.43
Table 7. Average Beliefs of Buyers and Sellers in Market
Group [Observations] Belief of Average Giving of Buyers
Belief of Average Giving of Sellers
All Buyers [32] $1.73 $1.37
All Sellers [32] $1.02 $1.67
Sellers (frequent seller) [18] $1.21 $1.61
Sellers (infrequent seller) [14] $0.95 $1.70
True Values $1.67 $0.82
Notes: Average beliefs of subjects elicited from a post-experimental questionnaire are reported.
Subjects were paid $1.00 for a perfectly correct answer and lost one cent for every cent
difference between their answer and the correct answer.

30
Figure 1: Bids, Asks, and Prices in Two Market Sessions

31
Figure 2: Prices of Dictator Games Sold in Market
Notes: The number of dictator games sold at a price within each $0.50 interval is shown.
Intervals begin at prices of even dollars and 50 cents above even dollars.
0
8
15
23
30
38
<8$ $8 $9 $10 $11 $12 $13 $14 $15 $16 $17 $18
Freq
uenc
y of
Exc
hang
es

32
Figure 3: Amounts Given to Recipient in Market
Notes: The frequency of dictators giving an amount to the recipients within a $1.00 interval is
reported. The instance of exactly $0 given is reported. Every other interval begins at one cent
above an even dollar, up to an even dollar.
0.0000
0.2000
0.4000
0.6000
0.8000
$0 $2 $4 $6 $8
Freq
uenc
y
Amount Given to Recipient
SellerBuyer

33
Figure 4: Giving as a Function of Dictator Games Played in Market
Notes: Linear trend lines for buyer and seller giving are graphed. Point observations are slightly
“jittered” for clarity.

34
Figure 5: Amount Kept in Dictator Game versus Price Paid in Market
Notes: 129 observations of transactions in Market are reported. Point observations are
slightly “jittered” for clarity.

35
Appendix: Supplementary Data
Table A.1. Random-Effects Tobit Regression of Giving
Market and Control
Market Only Control Only
(1) (2) (3)
Constant 3.385*** (0.482)
1.996*** (0.417)
3.385*** (0.540)
Market - 1.396** (0.6810)
Buyer - 1.078 (0.659)
0.097 (0.574)
- 1.080 (0.737)
Period
- 0.079** (0.032)
- 0.118*** (0.027)
- 0.079** (0.036)
Market*Buyer 1.185 (0.933)
Market*Period - 0.039 (0.045)
S.D. of R. Effect 2.400 2.095 2.678
Obs (Subjects) 640 (118) 320 (59) 320 (59)
Notes: Dependent variable is amount given to recipient in dollars. The data are grouped unevenly by subject, as some subjects played the dictator game more than others. Random effects are at the subject level. Three (***), two (**), and one (*) stars indicate statistical significance at the 1%, 5%, and 10% levels respectively. Standard errors are reported in parentheses. All Random Effects were significant at the 1% level (p<0.001 for all).
36
Table A2. Random-Effects Linear Regression of Giving for Buyers who Bought
Market and Control
Market Only Control Only
(4) (5) (6)
Constant 3.374*** (0.793)
4.119*** (0.995)
2.788*** (1.005)
Market 0.089 (0.715)
Period - 0.041 (0.048)
- 0.123** (0.051)
- 0.055 (0.049)
Price - 0.087** (0.047)
- 0.137** (0.067)
- 0.041 (0.065)
Market*Period - 0.098 (0.065)
S.D. of R. Effect 2.223 1.967 2.439
Obs (Subjects) 258 (56) 129 (28) 129 (28)
Notes: Dependent variable is amount given to recipient in dollars. The data are grouped unevenly by subject, as some buyers bought the dictator game more than others. Random effects are at the subject level. Three (***), two (**), and one (*) stars indicate statistical significance at the 1%, 5%, and 10% levels respectively. Standard errors are reported in parentheses. All Random Effects were significant at the 1% level (p<0.001 for all).

37
Table A3. Average Attitudes of Dictators
Group [Observations]
Response to
“I made fair
decisions”
Response to “My
decisions will be
viewed as fair by
recipients”
Response to “I
feel responsible
for recipient’s
outcome”
Control Treatment
All “Buyers” [32] 3.34 2.41 3.84
All “Sellers” [32] 2.90 2.09 3.25
Market Treatment
All Buyers [32] 3.31 2.25 3.38
Buyers (high giving) [14] 3.28 2.43 3.64
Buyers (low giving) [14] 3.14 1.71 3.29
All Sellers [32] 3.59 2.34 3.50
Sellers (high giving) [16] 3.44 2.94 4.19
Sellers (low giving) [15] 3.73 1.60 2.80
Sellers (frequent seller) [18] 3.56 2.94 3.78
Sellers (infrequent seller) [14] 3.64 1.57 3.14
Notes: Average self-reported attitudes of subjects from a post-experimental questionnaire are
reported on a 5 point scale from 1 (strongly disagree) to 5 (strongly agree).

38
Figure A1: Bids, Asks, and Prices in second two Market Sessions

39
Appendix B: Supplementary Materials (For Online Publication)
B1: Instructions (Market treatment)
Overview
Thank you for your participation in this experiment in decision-making. In addition to a $10 participation fee, you will be paid any money you accumulate from a game that will be described to you in a moment. You will be paid privately, by check, at the conclusion of the experiment. If you have any questions during the experiment, please raise your hand and wait for an experimenter to come to you. Please do not talk, exclaim, or try to communicate with other participants during the experiment. At this time, please turn off and put away any portable electronic devices. Participants intentionally violating the rules may be asked to leave the experiment and may not be paid.
Please follow along with the instructions closely to ensure all participants fully understand the experiment.
Groups, Types, and Roles
In this experiment you will be assigned to a group with 11 other participants. You will only interact with other participants in your group. Within your group, you will be assigned to play as one of three possible types, Type A, Type B, or Type C. Your role and available actions, which will be explained shortly, will depend on your type. Your type assignment will be randomly determined by the computer before the experiment begins. You will remain in the same group, and you will play as the same type throughout the experiment.
Periods, Stages, and Payoffs
There will be 10 identical periods in this experiment. Each period consists of two stages, Stage 1 and Stage 2. You will receive detailed information about these stages later in the instructions.
One of the 10 periods has been randomly selected to count towards your payment, and you will only be paid based on your earnings for this period. Nothing that you do during the experiment can affect the period for which you will be paid. We have placed the number of the selected period in an envelope in the front of the room and we will open this envelope at the end of the experiment to show you which period was randomly selected. Since you do not know which period was selected, you should treat each period as if it were the only period that counts.
We will explain Stage 1 in detail before the instructions for Stage 2 are given. Once we have described both Stages, you will begin Period 1.
Stage 1
Participation

40
Only Type A and Type B participants will participate in Stage 1. Type C participants will not participate but will be able to observe the actions of the other two types in their group.
Beginning
Type A participants will begin with a virtual ticket. The purpose of the virtual ticket is to allow anyone who holds it at the end of Stage 1 to participate in Stage 2.
In Stage 1, each Type A participant will have the option of selling his or her ticket to any Type B participant in the same group. Similarly, each Type B participant will have the option to buy a ticket from any Type A participant in the same group. Type C Participants may not participate in Stage 1, however, each Type C participant will be directly associated with a particular ticket, and he or she will observe what happens to this ticket in Stage 1.
We will next give an overview of the decisions faced by Type A and Type B participants, and then walk through Stage 1 using the actual visual interface you will see during the experiment.
Stage 1 - Offering to Sell the Ticket: Type A participants
Stage 1 will last for 75 seconds. At any time during Stage 1, a Type A participant may offer to sell his or her ticket to any Type B participant. Type A participants may not sell their tickets to other Type A participants. Each Type A participant starts each period with one ticket and therefore may sell at most one ticket in a period to any Type B participant in his or her group.
Stage 1 - Offering to Buy the Ticket: Type B participants
Type B participants will begin each period with a starting balance of $18. This balance will be reset to $18 in each period, and will not carry over between periods. At any time during Stage 1, a Type B participant may offer to buy a ticket from a Type A participant. Each Type B participant may buy at most one ticket in a period from any Type A participant in his or her group.
Leaving the Stage
Each Type A and Type B participant may choose not to participate in Stage 1. If a Type A participant prefers not to participate, and has not already made an offer to sell his or her ticket, he or she may leave Stage 1 and wait for Stage 2 to begin. Likewise, a Type B participant who has not made an offer to buy a ticket may choose to leave Stage 1 and retain his or her initial $18 balance. Any participant who leaves Stage 1 may re-enter the stage before 75 seconds have elapsed.
Once a participant has made an offer to buy or sell a ticket, that participant may no longer leave Stage 1.
Stage 1 – Decision Interface

41
We will now walk through Stage 1 using the actual interface you will use in the experiment. We will display the interface on the projector screen at the front of the lab. Please click the “Example” button on your screen to see the projected interface on your computer terminal (Figure B1).
{ Not on subjects’ screens: Type A participants will see a screen like the one shown here. The button to leave the stage is in the lower left, here. Your balance for the Period is in the lower right hand corner of your screen, here. Recall that you will be able to re-enter the stage at any time before the 75 seconds have elapsed. Each Type A participant may offer to sell his or her ticket to Type B participants by entering the amount of money he or she would like to receive in exchange for the ticket into the designated box here in the lower right. To finalize an offer, click the “Offer” button (point). Remember that once you click this button, you will not be able to leave Stage 1. All offers entered by Type A participants will be listed here in the right hand column (point). Once entered, all Type B participants in the same group will be able to see the stated offer, and each Type B participant will have the ability to accept the offer – we will show Type B participants screen next. Type A participants will be able to change their offer at any time before their offer is accepted by entering a new offer and pressing the “Offer” button again. Doing so will automatically withdraw the old offer and replace it with the new one. Please try this now on your screen. Your entry will not be visible to other participants during this walkthrough; this is just for practice. Once the experiment begins, though, remember that your offer will be visible to all Type B participants as soon as you click the “Offer” button. Clicking “Offer” without entering an offer will withdraw the old offer and not replace it. Again, please try this now. Only one offer per participant may be active at any given time. The “Buy” button you see at the bottom of the middle column will allow you to accept any offer made by a Type B participant in your group, which we will discuss next.
Next, we will look at the screen seen by Type B participants. }
Again, please click the “Example” button in the upper right hand corner of your screen to view the display for Type B participants (Figure B2).
{Not on subjects’ screens: Type B participants will see a screen like the one shown here (point). The button to leave the stage is in the same location in the lower left, and you may re-enter at any time before the 75 seconds have elapsed. You can also find your balance in each Period in the lower right hand corner of your screen, here. Recall that Type B participants will see all offers made by Type A participants in the right hand column. Each Type B participant may accept one of these offers by clicking on the offer and pressing the “Buy” button, located at the bottom of the right hand column, here. Each Type B participant may offer to buy a ticket from Type A participants by entering the amount of money he or she would like to pay in exchange for a ticket into the box at the bottom of the middle column here (point). To finalize an offer, click the “Offer” button. All offers entered by Type B participants will be listed in the middle column on the screen. Once entered, all Type A participants will be able to see the stated offer,
42
and Type A participants will have the ability to accept the offer instantly by clicking on it and pressing the “Sell” button on their screen. Remember that for Type A participants, the “Sell” button is at the bottom of the middle column.
To briefly summarize, all participants will be able to see all outstanding offers to buy the ticket (i.e. those that have not yet been accepted), and all outstanding offers to sell the ticket. Type A or B participants will see asterisks around their own outstanding offers, if they have made one. If a transaction occurs, all participants will see the outstanding offer change to an accepted offer as it will be placed in brackets and moved to the left-hand column on the screen, here. If the participant who accepted the offer had a second unaccepted offer posted at the time, the unaccepted offer will be automatically withdrawn when the first offer is accepted. The current period balance will be calculated at the bottom of the screen.
Type C participants will see a screen similar to this, but with no buttons or entry boxes at the bottom. Type C participants will be able to track the ticket with which they are matched during this stage on a screen like the one shown on the overhead. Each Type C participant will see asterisks around his or her matched ticket. Therefore, an offer to sell denoted by asterisks represents the offer made by the Type A participant who began the round with that Type C participant’s matched ticket. If the offer is accepted (i.e. the ticket is bought by a Type B participant), the sales price will appear in the left-hand column of the screen and will be marked by asterisks.
Summary of Stage 1
In Stage 1 of every period, a Type A participant will have the opportunity to sell his or her ticket to any Type B participant who has not already purchased one from another Type A participant. Each Type A participant may post an offer to sell the ticket, or may accept an offer posted by any Type B participant. Each Type B participant may likewise post an offer to buy a ticket, or may accept an offer posted by any Type A participant. If a posted offer is accepted (either by a Type A or Type B participant), a ticket is exchanged and that offer is unavailable to any other participants.
We will next review the instructions for Stage 2. Before we do, are there any questions about the layout and information available during Stage I?
Stage 2
Participation
Only those participants who hold a ticket at the end of Stage 1 will participate in Stage 2. In other words, all Type A participants who did not sell their ticket and all Type B participants who bought a ticket, will participate in Stage 2.
Allocation of Money

43
If a Type A or B participant holds a ticket at the end of Stage 1, that participant will be assigned the role of allocator in Stage 2. This participant will allocate a total of $16 between themselves and one Type C participant. In other words, the allocator can retain all $16 for himself or herself, the allocator can send all $16 to the Type C participant, or the allocator can specify any other division of the $16 between himself or herself and the Type C participant in any increment of 1¢. To summarize, holding the ticket at the end of Stage 1 gives the holder the rights to allocate $16 as he or she chooses between himself or herself and the matched C participant.
Results and Feedback
After Stage 2 is completed, all participants will be told their final balance for that period, and also the outcome of any Stage 2 allocation in which they were involved. Specifically, Type C participants will see how much money was sent to them in Stage 2. Type B participants who bought the ticket and Type A participants who kept the ticket will see how much they retained for themselves, and how much they chose to send to their matched Type C participant. Type A participants who sold their ticket to a Type B participant will see how much money was retained by the Type B participant who bought their ticket and how much was sent to the matched Type C participant. Type B participants who did not buy a ticket are not involved in any allocation decisions. A participant’s final balance for the period includes any balance at the end of Stage 1 plus any money allocated to that participant in Stage 2.
Matching
Each Type C participant will be matched with a virtual ticket. At the beginning of every round, one of these tickets will be given at random to each Type A participant. Therefore, at the beginning of every round, each Type A participant will be given a random ticket with a matched Type C participant. In Stage 1, the Type A participant may choose to sell this ticket or keep it. In Stage 2, the participant who holds the ticket will make the allocation decision, determining the amount of the $16 to retain and the amount sent to the matched Type C participant. That is, a Type A participant who sells his or her ticket foregoes the ability to allocate $16 between himself or herself and the matched Type C participant.
In every period, the tickets are randomly given to Type A participants so that a Type A participant never receives a ticket matched with the same Type B participant two periods in a row.
Anonymity
All of your decisions during today’s experiment will be anonymous. No participant will know the identity of the other participants with whom they are interacting.
Concluding the Experiment

44
After all 10 periods of the experiment have concluded, you will be asked to fill out a post-experiment questionnaire. Once all participants have completed the questionnaire, the experimenters will open the envelope in the front of the room to reveal the period drawn to count for payment. After the round has been revealed, you will be paid privately, by check, and will be free to leave the lab.
Quiz
We would like to have you complete a brief quiz to ensure that everyone understands the rules for today’s experiment. Please click Continue once you have answered every question. If you answer a question incorrectly, the computer will let you know, and you will be able to change your answer. We will begin once all participants have completed the quiz.
Question 1: In Stage 1, all participants will observe offers posted by Type A and B participants. True/False (answer: true)
Question 2: A Group A participant may accept an offer posted by any Type B participant, even if the Type A participant has already posted an offer of his or her own. True/False (answer: true)
Question 3: If a Type A participant agrees to sell his or her ticket, that participant will not participate in Stage 2. True/False (answer: true)
Question 4: If a Type B participant purchases a ticket, his or her balance at the end of the round will equal the initial $18 balance, minus the cost of the ticket, plus any amount of the $18 that he or she chose to retain. True/False (answer: true)
Question 5: All participants will receive their total earnings collected over all rounds of the experiment. True/False (answer: false)
Instructions Conclusion
Are there any final questions before we begin?
If you have a question at any time during the experiment, please raise your hand and wait for an experimenter to come answer your question privately. If there are no questions we will begin Period 1.
B2: Instructions (Control Treatment)
Overview
Thank you for your participation in this experiment in decision-making. In addition to a $10 participation fee, you will be paid any money you accumulate from a game that will be described to you in a moment. You will be paid privately, by check, at the conclusion of the experiment. If you have any questions during the experiment, please raise your hand and wait for an

45
experimenter to come to you. Please do not talk, exclaim, or try to communicate with other participants during the experiment. At this time, please turn off and put away any portable electronic devices. Participants intentionally violating the rules may be asked to leave the experiment and may not be paid.
Please follow along with the instructions closely to ensure all participants fully understand the experiment.
Groups, Types, and Roles
In this experiment you will be assigned to a group with 11 other participants. You will only interact with other participants in your group. Within your group, you will be assigned to play as one of three possible types, Type A, Type B, or Type C. Your role and available actions, which will be explained shortly, will depend on your type. Your type assignment will be randomly determined by the computer before the experiment begins. You will remain in the same group, and you will play as the same type throughout the experiment.
Periods, Stages, and Payoffs
There will be 10 identical periods in this experiment. Each period consists of two stages, Stage 1 and Stage 2. You will receive detailed information about these stages later in the instructions.
One of the 10 periods has been randomly selected to count towards your payment, and you will only be paid based on your earnings for this period. Nothing that you do during the experiment can affect the period for which you will be paid. We have placed the number of the selected period in an envelope in the front of the room and we will open this envelope at the end of the experiment to show you which period was randomly selected. Since you do not know which period was selected, you should treat each period as if it were the only period that counts.
We will explain Stage 1 in detail before the instructions for Stage 2 are given. Once we have described both Stages, you will begin Period 1.
Stage 1
Participation
In Stage 1, either Type A or Type B participants will receive a virtual ticket. The virtual ticket will allow the participant who holds it at the end of Stage 1 to participate in Stage 2.
How Tickets are Allocated
Each Type A participant will begin with a ticket and each Type B participant will begin with $18. In Stage 1, there is some probability that a Type A participant will be matched with a Type B participant. If a Type A and B participant are matched, the Type B participant will be allocated

46
the ticket instead of the Type A participant and some portion of the $18 (between $0 and $18) will be allocated to the matched Type A participant instead of the Type B participant.
If a Type A player is not matched in Stage 1, he or she will be allocated the ticket with which he or she began the stage. Likewise, if a Type B player is not matched, he or she will be allocated the $18 with which he or she began the stage.
Matching and allocations for matched participants may change from period to period. Whether or not two Type A or B participants are matched, and how the $18 is allocated if they are matched, has been predetermined by the experimenters for all rounds of today's experiment. No decision you make during the course of the experiment will affect matching or how the $18 is allocated.
Type C Participants may not participate in Stage 1, however, each Type C participant will be directly associated with a particular ticket, and he or she will observe what happens to this ticket in Stage 1.
Stage 2
Participation
Only those Type A and Type B participants who are allocated a ticket at the end of Stage 1 will participate in Stage 2.
Allocation of Money
If a Type A or B participant has been allocated a ticket at the end of Stage 1, that participant will be assigned the role of allocator in Stage 2. This participant will allocate a total of $16 between themselves and one Type C participant. In other words, the allocator can retain all $16 for himself or herself, the allocator can send all $16 to the Type C participant, or the allocator can specify any other division of the $16 between himself or herself and the Type C participant in any increment of 1¢.
To summarize, holding the ticket at the end of Stage 1 gives the holder the rights to allocate $16 as he or she chooses between himself or herself and the matched Type C participant.
Results and Feedback
After Stage 2 is completed, all participants will be told their final balance for that period, and also the outcome of Stage 2 allocations as described below.
Type C participants will see how much money was sent to them in Stage 2. Type A and Type B participants who were allocated a ticket will see how much they retained for themselves, and how much they chose to send to the Type C participant matched to that ticket. Type A participants who were matched with a Type B participant (and therefore not allocated a Ticket) will see how much money was retained by the Type B participant with whom they were matched

47
and how much was sent to the matched Type C participant. Type B participants who were not matched with a Type A participant (and therefore not allocated a ticket) are not involved in any allocation decisions and will not see the results these decisions. Each participant’s final balance for the period includes any balance at the end of Stage 1 plus any money allocated to that participant in Stage 2.
Matching
Each Type C participant will be matched with a virtual ticket. In Stage 1 of every round, one of these tickets will be allocated to either a Type A or Type B participant through a predetermined process. In Stage 2, the participant who holds the ticket will make the allocation decision, determining the amount of the $16 to retain and the amount sent to the matched Type C participant.
Anonymity
All of your decisions during today’s experiment will be anonymous. No participant will know the identity of the other participants with whom they are interacting.
Concluding the Experiment
After all 10 periods of the experiment have concluded, you will be asked to fill out a post-experiment questionnaire. Once all participants have completed the questionnaire, the experimenters will open the envelope in the front of the room to reveal the period drawn to count for payment. After the round has been revealed, you will be paid privately, by check, and will be free to leave the lab.
Quiz
We would like to have you complete a brief quiz to ensure that everyone understands the rules for today’s experiment. Please click Continue once you have answered every question. If you answer a question incorrectly, the computer will let you know, and you will be able to change your answer. We will begin once all participants have completed the quiz.
Question 1: In Stage 1, if a Type A and B participant are matched, the Type B participant will be allocated the ticket and some portion of $18 will be allocated to the Type A participant. True/False (answer: true)
Question 2: The process by which Type A and B participants are matched, and by which the $18 is allocated if they are, is predetermined and is not affected by the decisions made over the course of the experiment. True/False (answer: true)
Question 3: If a Type A or Type B participant is allocated a ticket in Stage 1, that participant will participate in Stage 2. True/False (answer: true)
48
Question 4: If a Type B participant is allocated a ticket in Stage 1, his or her balance at the end of the round will equal the portion of the $18 he or she was allocated plus any amount of the $18 that he or she chose to retain. True/False (answer: true)
Question 5: All participants will receive their total earnings collected over all rounds of the experiment. True/False (answer: false)
Instructions Conclusion
Are there any final questions before we begin?
If you have a question at any time during the experiment, please raise your hand and wait for an experimenter to come answer your question privately. If there are no questions we will begin Period 1.

49
Appendix C: Screenshots of Experimental Software
Figure C1: A participant screen during the market stage.

50
Figure C2: B participant screen during the market stage