market outlook 2015: how to spot bubbles, avoid market crashes and earn big returns by mebane...
TRANSCRIPT
Click to edit Master title style
Click to edit Master subtitle style Investment Management for High Net Worth
Individuals and Institutions
• Market Outlook &
• Global Stock Valuations
March, 2015

Click to edit Master title style
Click to edit Master subtitle style
Disclaimer
This presentation is for informational purposes and is not an offer to sell. Any investment involves significant risks, and past market conditions may not resemble future market conditions. HYPOTHETICAL PERFORMANCE RESULTS HAVE MANY INHERENT LIMITATIONS, SOME OF WHICH ARE DESCRIBED BELOW. THEY ARE GENERALLY PREPARED WITH THE BENEFIT OF HINDSIGHT, DO NOT INVOLVE FINANCIAL RISK OR REFLECT ACTUAL TRADING BY ANY ACCOUNT UNDER ACTUAL MARKET CONDITIONS AND THEREFORE DO NOT REFLECT THE IMPACT THAT ECONOMIC AND MARKET FACTORS MAY HAVE HAD ON THE ADVISOR’S INVESTMENT DECISIONS FOR THAT ACCOUNT. NO REPRESENTATION IS MADE THAT CIMI'S PERFORMANCE WOULD HAVE BEEN THE SAME AS SUCH SIMULATED HAD CIMI BEEN IN EXISTENCE DURING SUCH TIME. ANOTHER LIMITATION IS THAT INVESTMENT DECISIONS REFLECTED IN THE SIMULATED RESULTS CANNOT COMPLETELY ACCOUNT FOR THE IMPACT OF FINANCIAL RISK ON THE MANNER IN WHICH AN ACCOUNT WOULD HAVE BEEN MANAGED. FOR EXAMPLE, THE ABILITY TO WITHSTAND LOSSES OR TO ADHERE TO A PARTICULAR TRADING PROGRAM IN SPITE OF TRADING LOSSES ARE MATERIAL POINTS WHICH CAN ALSO AFFECT ACTUAL TRADING RESULTS. IN FACT, THERE ARE FREQUENTLY SHARP DIFFERENCES BETWEEN HYPOTHETICAL RESULTS AND THE ACTUAL RECORD SUBSEQUENTLY ACHIEVED. THE SIMULATED RESULTS DO NOT TAKE INTO ACCOUNT ENHANCEMENTS THAT MAY BE MADE TO THE PROPRIETARY COMPUTER MODELS OVER TIME. THERE ARE NUMEROUS OTHER FACTORS RELATED TO THE MARKET IN GENERAL, OR TO THE IMPLEMENTATION OF ANY SPECIFIC TRADING PROGRAM WHICH CANNOT BE FULLY BE ACCOUNTED FOR IN THE PREPARATION OF HYPOTHETICAL SIMULATED PERFORMANCE RESULTS AND ALL OF WHICH CAN ADVERSELY AFFECT ACTUAL TRADING RESULTS. ALL RESULTS ARE GROSS OF ALL TRADING AND MANAGEMENT FEES
Click to edit Master title style
Click to edit Master subtitle style
About Cambria
3
• SEC RIA founded 2006
• $450+ million across • Individual accounts • Active and Passive ETFs
• SYLD, FYLD, GVAL, GMOM, GAA
• Disrupt traditional high fee investing
Click to edit Master title style
Click to edit Master subtitle style
Market Research
4
Blog: MebFaber Work: CambriaFunds Ideas: TheIdeaFarm
Click to edit Master title style
Click to edit Master subtitle style
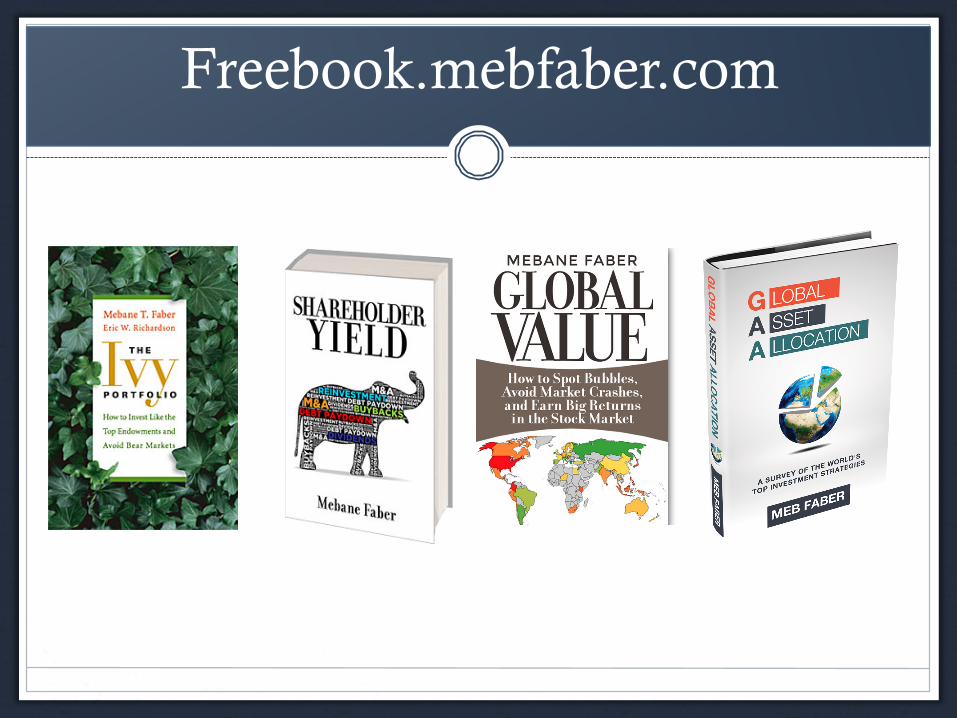
Freebook.mebfaber.com
Click to edit Master title style
Click to edit Master subtitle style
Before we start…
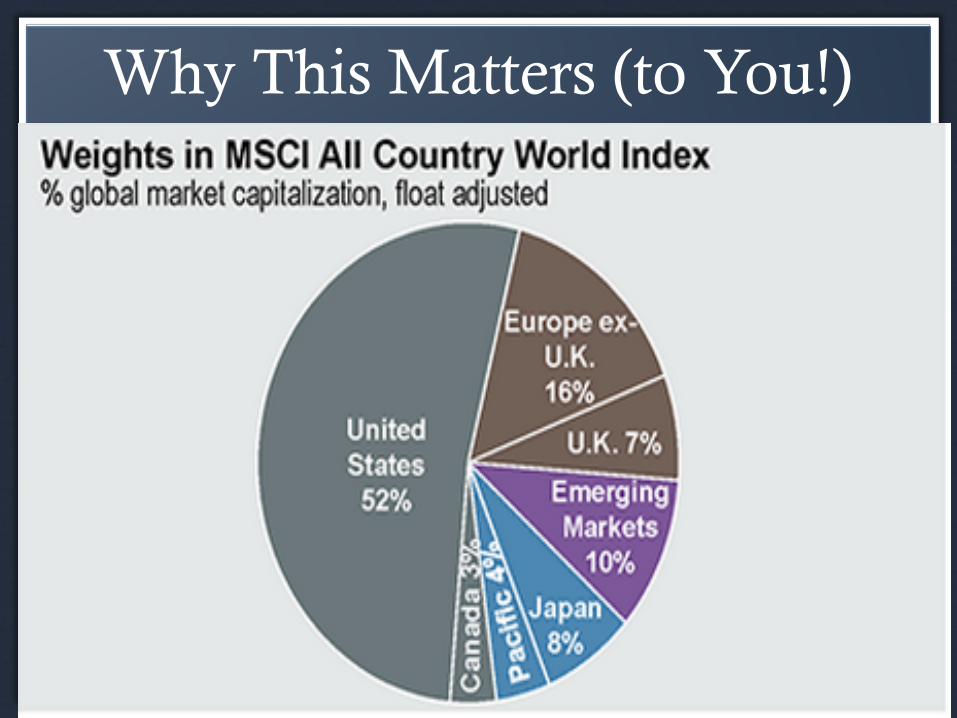
What percentage of your personal stock allocation is in the United States?
Example: 80% U.S., 20% in Japan, write down 80%
Click to edit Master title style
Click to edit Master subtitle style
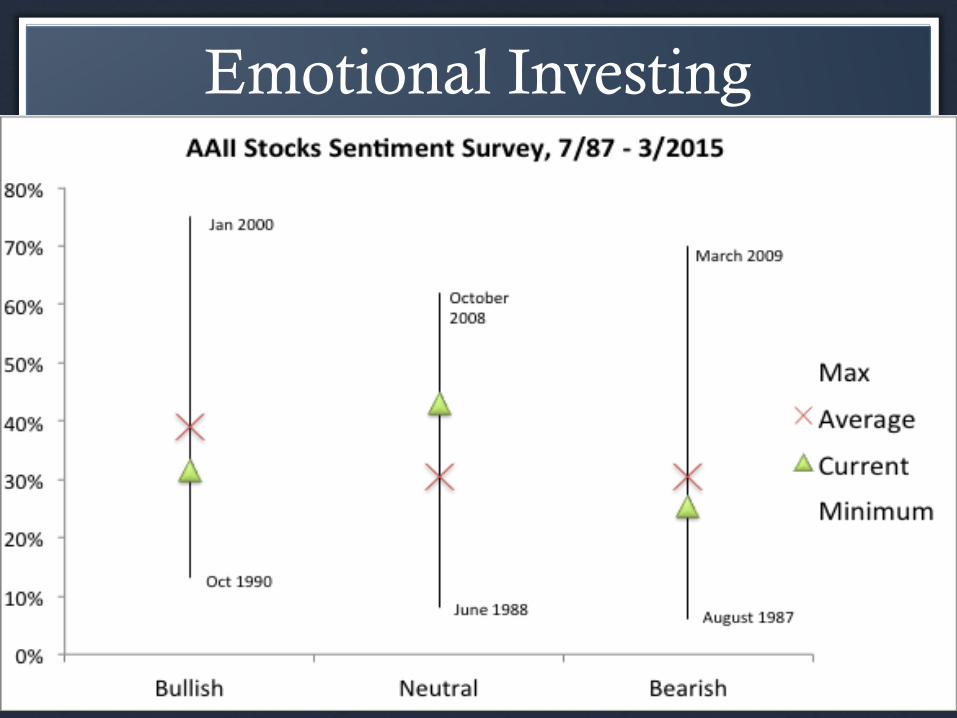
Emotional Investing

Click to edit Master title style
Click to edit Master subtitle style
Emotional Investing

Click to edit Master title style
Click to edit Master subtitle style
Emotional Investing

Click to edit Master title style
Click to edit Master subtitle style
Can we do anything to remove emotional decision making?

Click to edit Master title style
Click to edit Master subtitle style

Click to edit Master title style
Click to edit Master subtitle style
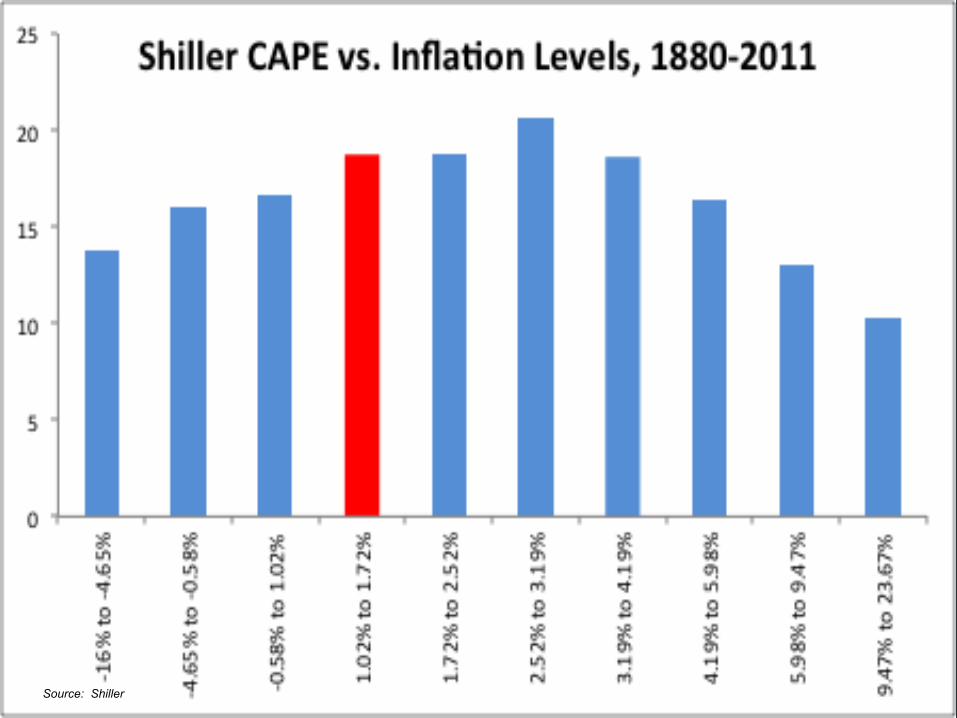
Cyclically Adjusted Price Earnings Ratio
Source: Shiller

Click to edit Master title style
Click to edit Master subtitle style
Source: Shiller

Click to edit Master title style
Click to edit Master subtitle style
Source: Shiller

Click to edit Master title style
Click to edit Master subtitle style
REAL RETURN CAPE 10 BEST 16.1% 11
10 WORST -3.3% 23
Click to edit Master title style
Click to edit Master subtitle style
Source: Shiller

Click to edit Master title style
Click to edit Master subtitle style
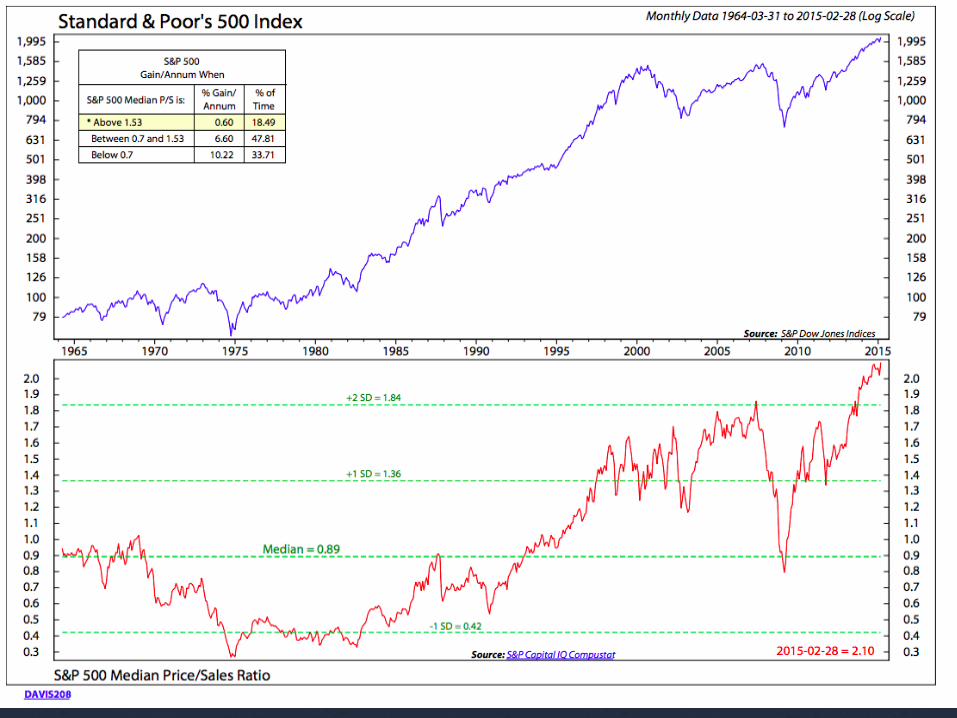
Median Stock P/E and P/B
Click to edit Master title style
Click to edit Master subtitle style

Click to edit Master title style
Click to edit Master subtitle style
…But you would be out of stocks since the 1990s!

Click to edit Master title style
Click to edit Master subtitle style
Click to edit Master title style
Click to edit Master subtitle style
So, stocks are expensive, what about bonds?

Click to edit Master title style
Click to edit Master subtitle style

Click to edit Master title style
Click to edit Master subtitle style
So, the US is expensive and bonds yield very little, where to look?

Click to edit Master title style
Click to edit Master subtitle style
…But you would be out of stocks since the 1990s!

Click to edit Master title style
Click to edit Master subtitle style

Click to edit Master title style
Click to edit Master subtitle style
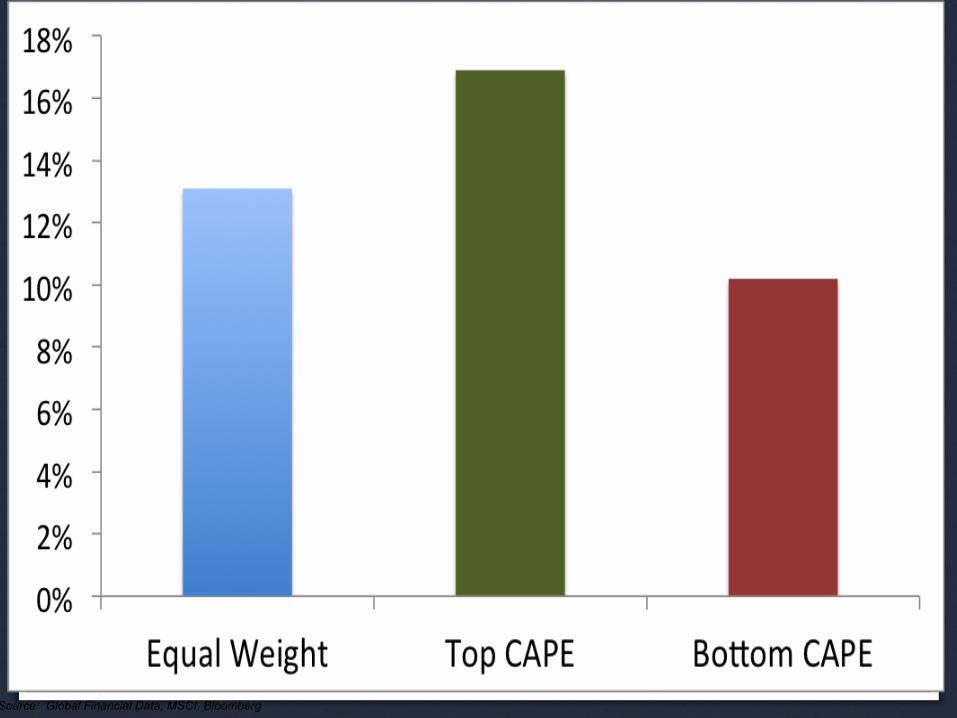
Does it work in all markets?
Source: Global Financial Data, MSCI, Bloomberg
Click to edit Master title style
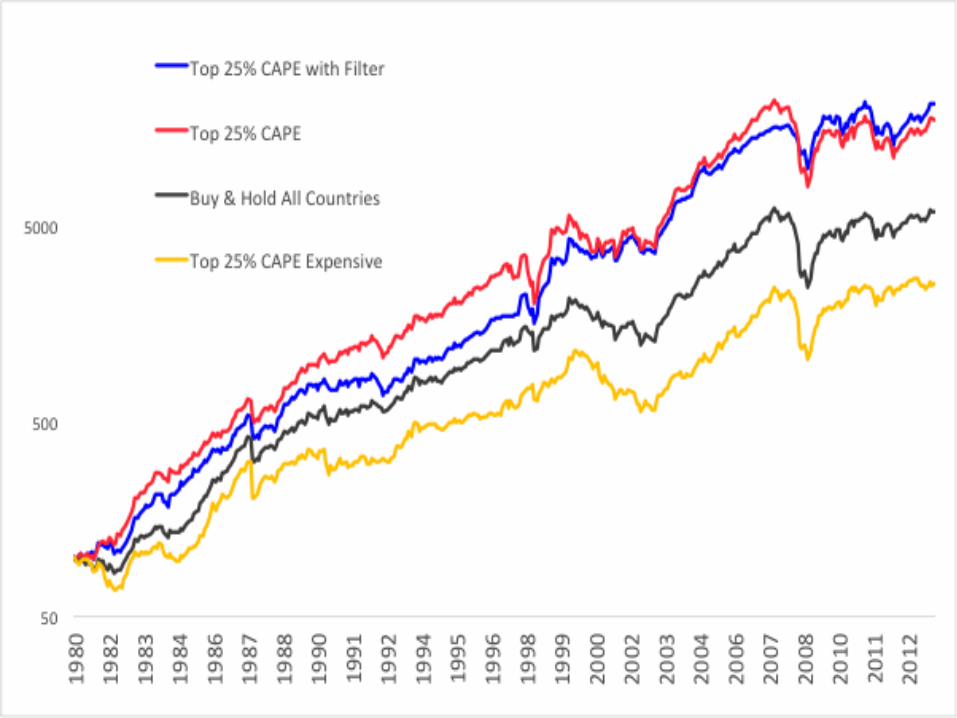
Click to edit Master subtitle style
Source: Global Financial Data, MSCI, Bloomberg
Click to edit Master title style
Click to edit Master subtitle style

Click to edit Master title style
Click to edit Master subtitle style
Blood…and Bubble.
1 Year 3 Year 5 Year Blood <7 31% 18% 21% Bubble >45 -9% -4% -1%
Source: Global Financial Data, MSCI, Bloomberg
Click to edit Master title style
Click to edit Master subtitle style
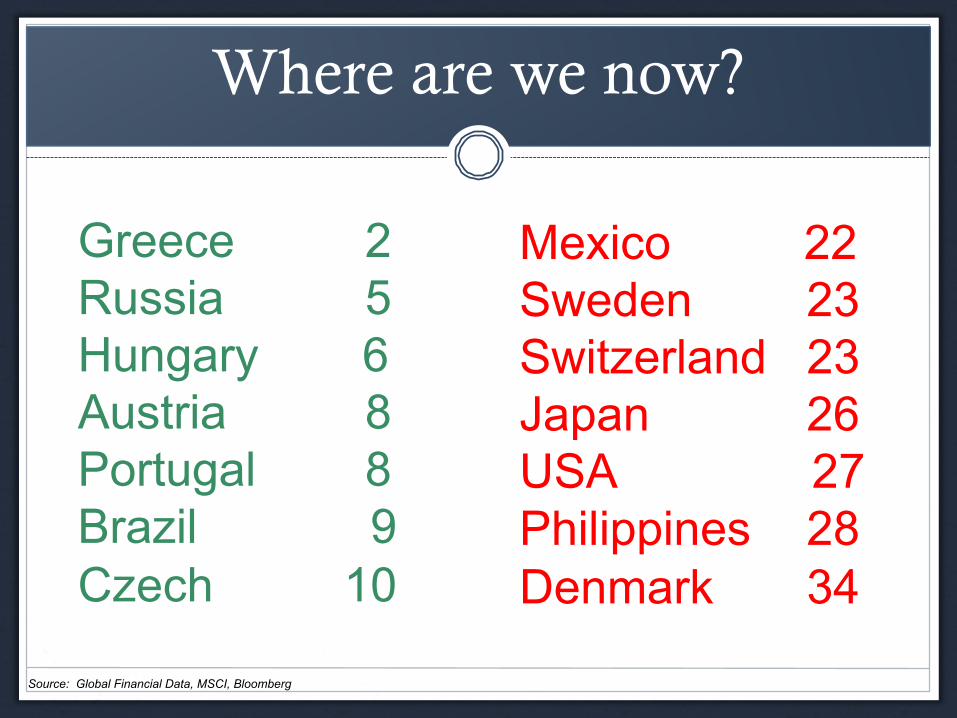
Where are we now?
Greece 2 Russia 5 Hungary 6 Austria 8 Portugal 8 Brazil 9 Czech 10
Mexico 22 Sweden 23 Switzerland 23 Japan 26 USA 27 Philippines 28 Denmark 34
Source: Global Financial Data, MSCI, Bloomberg

Click to edit Master title style
Click to edit Master subtitle style

Click to edit Master title style
Click to edit Master subtitle style
Click to edit Master title style
Click to edit Master subtitle style
Why This Matters (to You!)

Click to edit Master title style
Click to edit Master subtitle style
Click to edit Master title style
Click to edit Master subtitle style

Click to edit Master title style
Click to edit Master subtitle style
Click to edit Master title style
Click to edit Master subtitle style
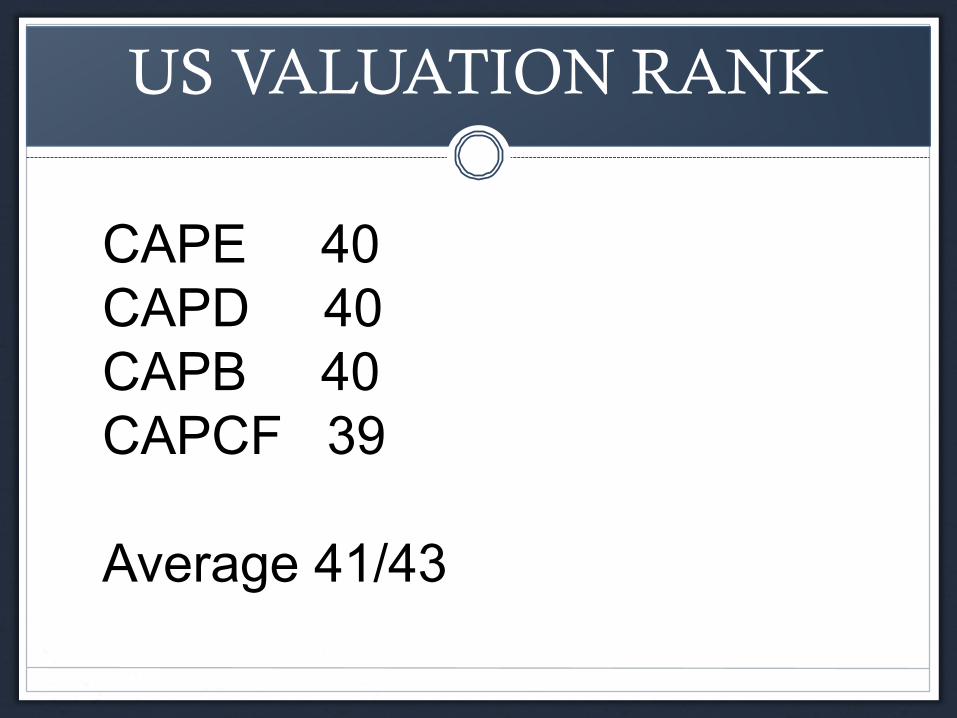
US VALUATION RANK
CAPE 40 CAPD 40 CAPB 40 CAPCF 39 Average 41/43

Click to edit Master title style
Click to edit Master subtitle style
CONTACT
WEBSITE www.cambriafunds.com
PHONE (310) 606-5555
BLOG www.mebfaber.com
EMAIL [email protected]
Click to edit Master title style
Click to edit Master subtitle style
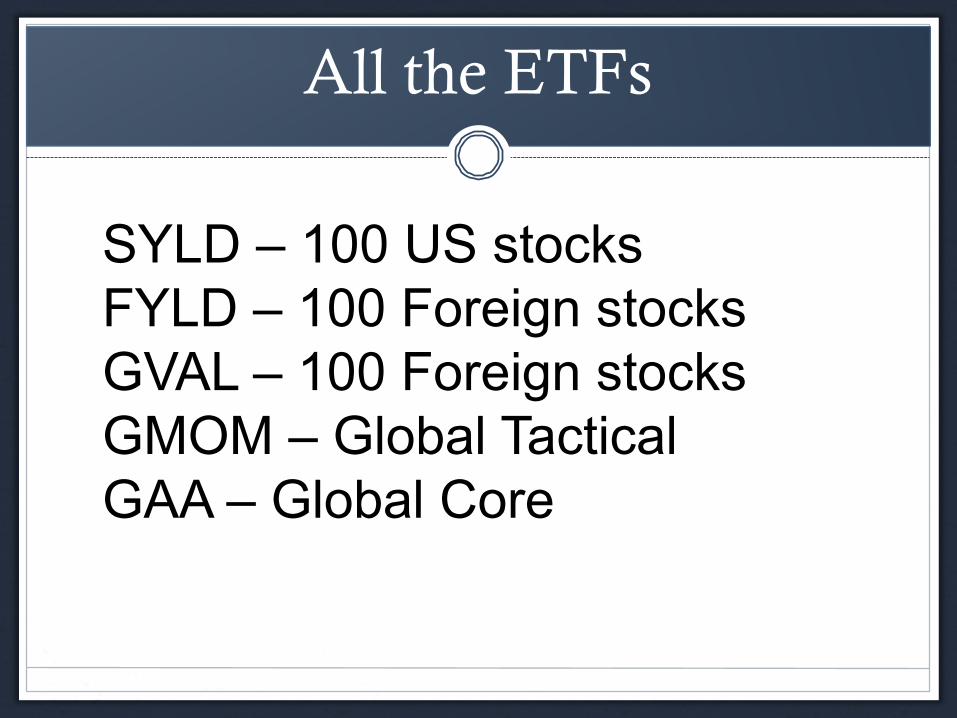
All the ETFs
SYLD – 100 US stocks FYLD – 100 Foreign stocks GVAL – 100 Foreign stocks GMOM – Global Tactical GAA – Global Core

Click to edit Master title style
Click to edit Master subtitle style
…But you would be out of stocks since the 1990s!