market outlook - sbi funds pms outlook_sep 2017.pdf · new project announcement averages at rs. 8.8...
TRANSCRIPT

Market Outlook
September 2017

EQUITY MARKET
Global equity market snapshot: August 2017
Source: Bloomberg, SBIMF Research
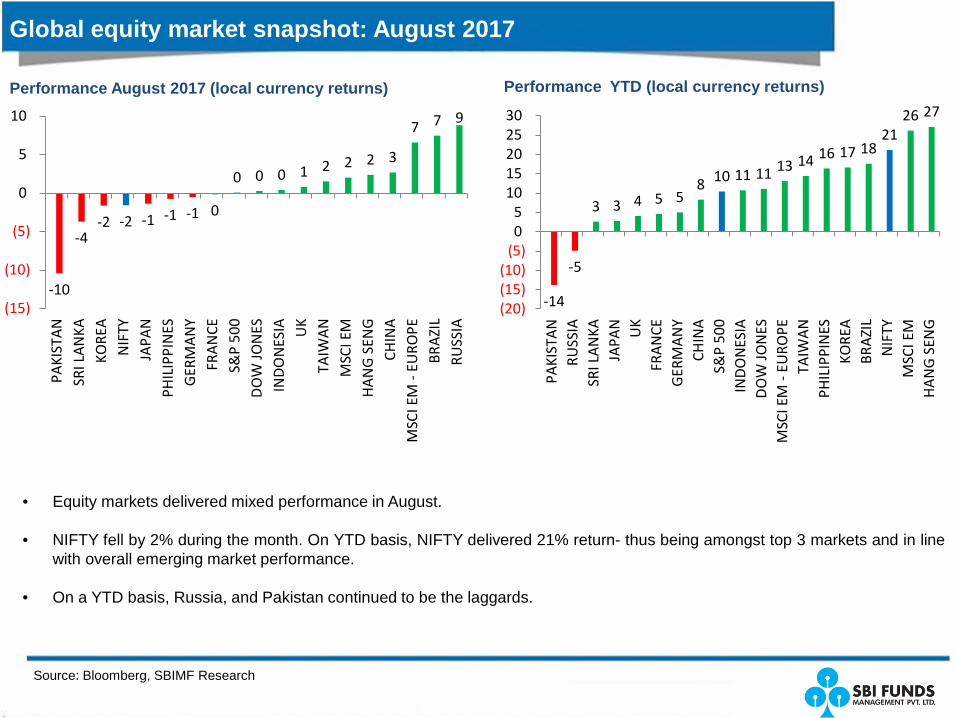
• Equity markets delivered mixed performance in August.
• NIFTY fell by 2% during the month. On YTD basis, NIFTY delivered 21% return- thus being amongst top 3 markets and in linewith overall emerging market performance.
• On a YTD basis, Russia, and Pakistan continued to be the laggards.
Performance August 2017 (local currency returns) Performance YTD (local currency returns)
-10
-4-2 -2 -1 -1 -1 0
0 0 0 1 2 2 2 3
7 7 9
(15)
(10)
(5)
0
5
10
PAKI
STA
NSR
I LA
NKA
KORE
AN
IFTY
JAPA
NPH
ILIP
PIN
ESG
ERM
AN
YFR
AN
CES&
P 50
0D
OW
JON
ESIN
DO
NES
IA UK
TAIW
AN
MSC
I EM
HA
NG
SEN
GCH
INA
MSC
I EM
- EU
ROPE
BRA
ZIL
RUSS
IA
-14
-5
3 3 4 5 58 10 11 11 13 14 16 17 18
2126 27
(20)(15)(10)
(5)05
1015202530
PAKI
STA
NRU
SSIA
SRI L
AN
KAJA
PAN UK
FRA
NCE
GER
MA
NY
CHIN
AS&
P 50
0IN
DO
NES
IAD
OW
JON
ESM
SCI E
M -
EURO
PETA
IWA
NPH
ILIP
PIN
ESKO
REA
BRA
ZIL
NIF
TYM
SCI E
MH
AN
G S
ENG

Indian stock market snapshot: August 2017
Performance in August 2017
Source: Bloomberg, SBIMF Research
• Nifty and Sensex are down by 2% each in August. While the small cap was down by 1%, mid cap delivered positive 1% returnsduring the month.
• Sector-wise: While majority sectors under-performed (Pharma being the lowest), Oil & Gas, Metals and FMCG outshinedduring the month.
• YTD, Nifty and Sensex are up by 21% and 19% respectively. Sector-wise performance has been positive across all sectors ona YTD basis (barring Pharma and IT). Real estate continued to out-perform significantly (up 69%).
Performance YTD
-7
-4 -4 -3 -3-2 -2 -2 -1 -1 -1 0
1 1
7 7
(10)
(8)
(6)
(4)
(2)
0
2
4
6
8
PHA
RMA IT
CAP
GO
OD
S
BAN
KEX
AU
TO
SEN
SEX
REA
L ES
TATE
NIF
TY
BSE
100
BSE
500
SMA
LL C
AP
PSU
FMCG
MID
CA
P
MET
ALS
OIL
& G
AS
-11
-1
1217 19 21 23 25 25 25 27 29 31 32 33
69
(20)
(10)
0
10
20
30
40
50
60
70
80
PHA
RMA IT
PSU
AU
TO
SEN
SEX
NIF
TY
BSE
100
BSE
500
OIL
& G
AS
FMCG
CAP
GO
OD
S
MID
CA
P
MET
ALS
BAN
KEX
SMA
LL C
AP
REA
L ES
TATE

Source: CMIE, SBIMF Research,
Growth has been weakening; private investment is matter of concern
Growth has been moderating since June 2016
8.7
5.6
9.1
6.1
4.0
5.0
6.0
7.0
8.0
9.0
10.0
Jun-
12
Oct
-12
Feb-
13
Jun-
13
Oct
-13
Feb-
14
Jun-
14
Oct
-14
Feb-
15
Jun-
15
Oct
-15
Feb-
16
Jun-
16
Oct
-16
Feb-
17
Jun-
17
Real GVA at basic prices Real GDP
% y-o-y• 1Q FY18 GDP depicted the continued weakness in growth trends
(5.7% y-o-y vs. 6.1% in 4Q FY18). Growth prints have beenheading south for 5 consecutive quarters now.
• Private consumption demand that has been the mainstay of GDPgrowth slowed to 6.7%YoY in 1Q (vs. 8.7% growth in FY17) asconsumer confidence took a knock post demonetization.Investment came at a muted 1.6% which is still better than adecline of -2.1% posted in the previous quarter. That said, theinvestment scenario is far from encouraging. Net exports was adrag in 1Q subtracting 2.6% from GDP growth. The nominal GDPgrowth slowed to 9.3%YoY from 12.5%.
• From the supply side, GVA growth stayed flat at 5.6%. While thegrowth in agriculture (2.3% y-o-y vs. 5.2% in Q4 FY17) and industry(1.6% vs. 3.1%) slipped, services growth accelerated to 8.7% (vs.7.2%) helped by improved prospects of business services andtrade , hotels and transport services. Social services, which reflectsgovernment expenditure, on the other hand, slipped significantly.
• We expect FY18 growth to average around 6.9% y-o-y, 40bps lowerthan RBI’s estimate of 7.3% for the year. Consumption mayimprove through the year helped by implementation of farm loanwaiver, pay commission implementation by states, third consecutiveseason of healthy agriculture output, rising recourse to leveragedconsumption. On the other hand, floundering investment climateshows no sign of recovery in near-term and can be a drag on thepotential of the economy.
6.1 7.3
31.9
-2.1
10.3 11.9
5.7 6.7
17.2
1.6 1.2
13.4
GD
Pmp
Pvt C
onsu
mpt
ion
Gov
t Spe
ndin
g
Inve
stm
ent
Expo
rts
Impo
rts
Q4-2016-17 Q1 2017-18
% y-o-y
Government spending is a major growth driver
Source: CMIE, CWC, IMDB, pib.nic.in, SBIMF Research,
We remain incrementally positive on agriculture income
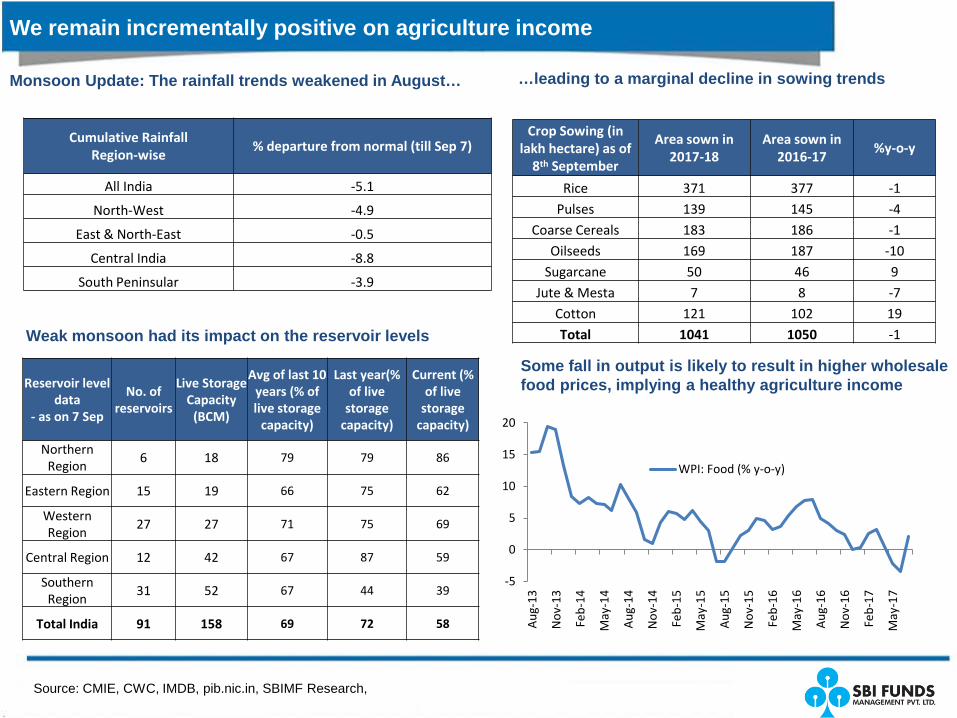
…leading to a marginal decline in sowing trends
Crop Sowing (in lakh hectare) as of
8th September
Area sown in 2017-18
Area sown in 2016-17 %y-o-y
Rice 371 377 -1Pulses 139 145 -4
Coarse Cereals 183 186 -1Oilseeds 169 187 -10
Sugarcane 50 46 9Jute & Mesta 7 8 -7
Cotton 121 102 19Total 1041 1050 -1
Some fall in output is likely to result in higher wholesale food prices, implying a healthy agriculture income
Cumulative RainfallRegion-wise % departure from normal (till Sep 7)
All India -5.1
North-West -4.9
East & North-East -0.5
Central India -8.8
South Peninsular -3.9
Monsoon Update: The rainfall trends weakened in August…
Reservoir level data
- as on 7 Sep
No. of reservoirs
Live Storage Capacity
(BCM)
Avg of last 10 years (% of live storage
capacity)
Last year(% of live
storage capacity)
Current (% of live
storage capacity)
Northern Region
6 18 79 79 86
Eastern Region 15 19 66 75 62
Western Region
27 27 71 75 69
Central Region 12 42 67 87 59
Southern Region
31 52 67 44 39
Total India 91 158 69 72 58
Weak monsoon had its impact on the reservoir levels
-5
0
5
10
15
20
Aug
-13
Nov
-13
Feb-
14
May
-14
Aug
-14
Nov
-14
Feb-
15
May
-15
Aug
-15
Nov
-15
Feb-
16
May
-16
Aug
-16
Nov
-16
Feb-
17
May
-17
WPI: Food (% y-o-y)
Source: CMIE, SBIMF Research,
Rural Demand to pick-up
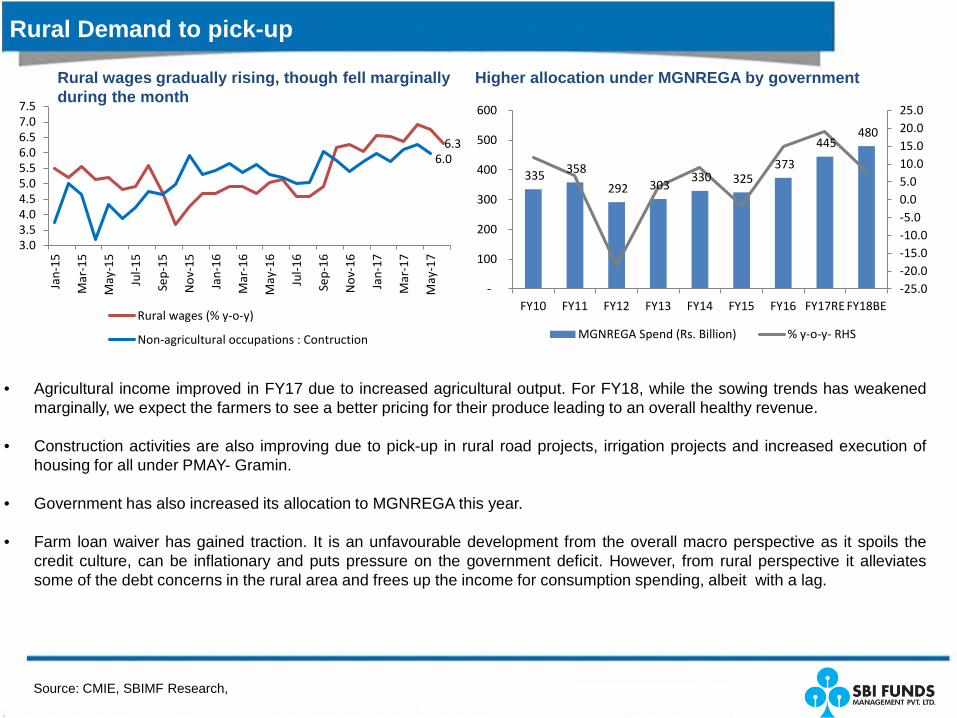
Rural wages gradually rising, though fell marginally during the month
• Agricultural income improved in FY17 due to increased agricultural output. For FY18, while the sowing trends has weakenedmarginally, we expect the farmers to see a better pricing for their produce leading to an overall healthy revenue.
• Construction activities are also improving due to pick-up in rural road projects, irrigation projects and increased execution ofhousing for all under PMAY- Gramin.
• Government has also increased its allocation to MGNREGA this year.
• Farm loan waiver has gained traction. It is an unfavourable development from the overall macro perspective as it spoils thecredit culture, can be inflationary and puts pressure on the government deficit. However, from rural perspective it alleviatessome of the debt concerns in the rural area and frees up the income for consumption spending, albeit with a lag.
Higher allocation under MGNREGA by government
335 358
292 303 330 325
373
445 480
-25.0-20.0-15.0-10.0-5.00.05.010.015.020.025.0
-
100
200
300
400
500
600
FY10 FY11 FY12 FY13 FY14 FY15 FY16 FY17RE FY18BE
MGNREGA Spend (Rs. Billion) % y-o-y- RHS
6.36.0
3.03.54.04.55.05.56.06.57.07.5
Jan-
15
Mar
-15
May
-15
Jul-1
5
Sep-
15
Nov
-15
Jan-
16
Mar
-16
May
-16
Jul-1
6
Sep-
16
Nov
-16
Jan-
17
Mar
-17
May
-17
Rural wages (% y-o-y)
Non-agricultural occupations : Contruction
Source: CMIE, SBIMF Research,
Investment: New investment decision yet to pick-up
0
5,000
10,000
15,000
20,000
25,000
Sep-
01M
ar-0
2Se
p-02
Mar
-03
Sep-
03M
ar-0
4Se
p-04
Mar
-05
Sep-
05M
ar-0
6Se
p-06
Mar
-07
Sep-
07M
ar-0
8Se
p-08
Mar
-09
Sep-
09M
ar-1
0Se
p-10
Mar
-11
Sep-
11M
ar-1
2Se
p-12
Mar
-13
Sep-
13M
ar-1
4Se
p-14
Mar
-15
Sep-
15M
ar-1
6Se
p-16
Mar
-17
Private Sector: New Investment Projects
Government: New Investment Projects
4Q rolling sum; Rs. Billion
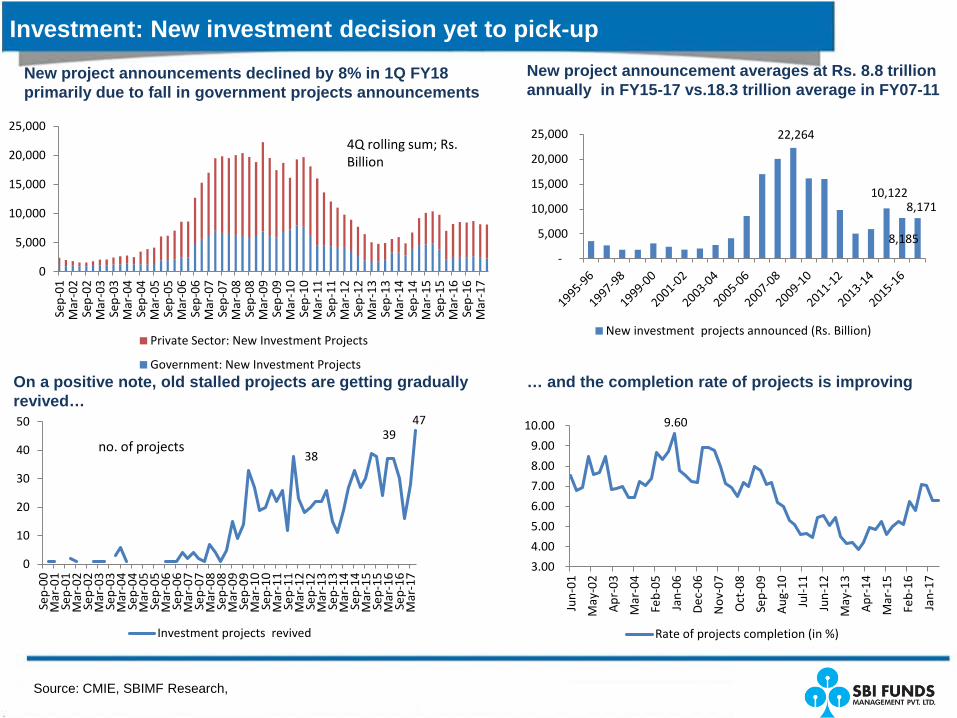
New project announcements declined by 8% in 1Q FY18 primarily due to fall in government projects announcements
22,264
10,122
8,185
8,171
-
5,000
10,000
15,000
20,000
25,000
New investment projects announced (Rs. Billion)
New project announcement averages at Rs. 8.8 trillion annually in FY15-17 vs.18.3 trillion average in FY07-11
On a positive note, old stalled projects are getting gradually revived…
… and the completion rate of projects is improving
9.60
3.00
4.00
5.00
6.00
7.00
8.00
9.00
10.00
Jun-
01
May
-02
Apr
-03
Mar
-04
Feb-
05
Jan-
06
Dec
-06
Nov
-07
Oct
-08
Sep-
09
Aug
-10
Jul-1
1
Jun-
12
May
-13
Apr
-14
Mar
-15
Feb-
16
Jan-
17
Rate of projects completion (in %)
38
3947
0
10
20
30
40
50
Sep-
00M
ar-0
1Se
p-01
Mar
-02
Sep-
02M
ar-0
3Se
p-03
Mar
-04
Sep-
04M
ar-0
5Se
p-05
Mar
-06
Sep-
06M
ar-0
7Se
p-07
Mar
-08
Sep-
08M
ar-0
9Se
p-09
Mar
-10
Sep-
10M
ar-1
1Se
p-11
Mar
-12
Sep-
12M
ar-1
3Se
p-13
Mar
-14
Sep-
14M
ar-1
5Se
p-15
Mar
-16
Sep-
16M
ar-1
7
Investment projects revived
no. of projects

Government Infrastructure push positive for growth
Source: Spark, Government documents, SBIFM Research
299384 386
932
13071432
0
200
400
600
800
1000
1200
1400
1600
FY13 FY14 FY15 FY16 FY17RE FY18BE
Road infra (Rs. Billion)
Spending on Road construction has jumped 3.7xtimes in last 3 years
Execution has picked up pace in Road construction
492 520643
935
12101310
0
200
400
600
800
1000
1200
1400
FY13 FY14 FY15 FY16 FY17RE FY18BE
Railways infra (Rs. Billion)
Spending on Railways has jumped 2 times in last 3 years
Railways- another key area of spend
55
90 84
121
196 199
0
50
100
150
200
250
FY13 FY14 FY15 FY16 FY17RE FY18BE
Metro and MRTS Projects
Metro spending projected to grow at 12%
Metro construction happening in partnership with states and JICA
980 9601059 1145
14411565
0
500
1000
1500
2000
FY13 FY14 FY15 FY16 FY17RE FY18BE
Rural and Agri Spending
Irrigation and Rural Development
Services paints a mixed picture
Source: Philip Capital, RBI, CMIE, SBIFM Research
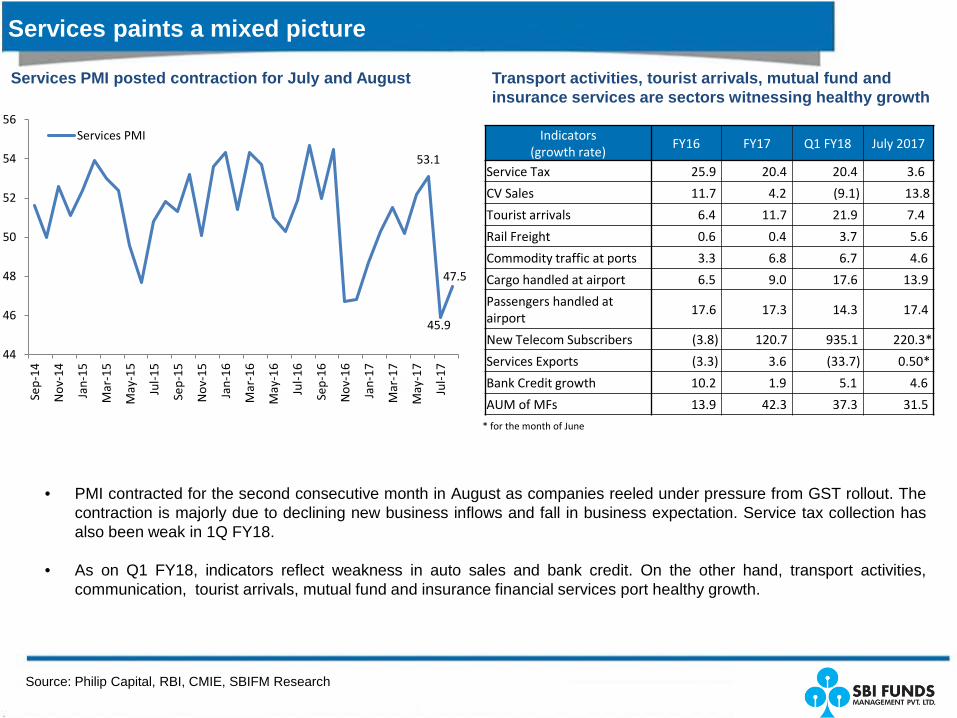
• PMI contracted for the second consecutive month in August as companies reeled under pressure from GST rollout. Thecontraction is majorly due to declining new business inflows and fall in business expectation. Service tax collection hasalso been weak in 1Q FY18.
• As on Q1 FY18, indicators reflect weakness in auto sales and bank credit. On the other hand, transport activities,communication, tourist arrivals, mutual fund and insurance financial services port healthy growth.
Services PMI posted contraction for July and August Transport activities, tourist arrivals, mutual fund and insurance services are sectors witnessing healthy growth
Indicators (growth rate)
FY16 FY17 Q1 FY18 July 2017
Service Tax 25.9 20.4 20.4 3.6
CV Sales 11.7 4.2 (9.1) 13.8
Tourist arrivals 6.4 11.7 21.9 7.4
Rail Freight 0.6 0.4 3.7 5.6
Commodity traffic at ports 3.3 6.8 6.7 4.6
Cargo handled at airport 6.5 9.0 17.6 13.9
Passengers handled at airport
17.6 17.3 14.3 17.4
New Telecom Subscribers (3.8) 120.7 935.1 220.3*
Services Exports (3.3) 3.6 (33.7) 0.50*
Bank Credit growth 10.2 1.9 5.1 4.6
AUM of MFs 13.9 42.3 37.3 31.5
53.1
45.9
47.5
44
46
48
50
52
54
56
Sep-
14
Nov
-14
Jan-
15
Mar
-15
May
-15
Jul-1
5
Sep-
15
Nov
-15
Jan-
16
Mar
-16
May
-16
Jul-1
6
Sep-
16
Nov
-16
Jan-
17
Mar
-17
May
-17
Jul-1
7
Services PMI
* for the month of June
Source: SBIMF Research
Reforms by government makes market positive about future growth
Key Reforms in recent months
• Affordable Housing picks-up pace: The government has targeted construction of 51 lakh houses in 2017-18that would meet its target of one crore houses by 2019 under the revised Pradhan Mantri Awaas YojanaGramin (PMAY-G) and hopes to bring down the building time to 6-12 months from 18 months to 3 yearsearlier. Over 32 lakh houses have been reported complete in FY17 and 18 lakh in FY16.
• Real Estate Regulation Act: Implemented on a nation-wide basis on 1st May. RERA ensures that there isenough long term visibility for players with strong corporate governance, brand and capital allocationstandards
• Banking Regulation (Amendment) 2017 Act: The Ordinance empowering the RBI has been passed in theparliament. The measure allows the RBI to initiate insolvency resolution process on specific stressedassets.This is a positive move for clearing stressed loans which are 13% of total loans.
• GST: Smooth roll-out of GST is a significant positive for long-run growth of Indian economy
• Thrust on Rural economy: Measures such as rural electrification, construction of rural roads, crop insurancescheme and rural housing are structurally positive for Indian rural economy
• Disinvestment: The government will soon float a request for proposal (RFP) for selection of transactionadviser, legal adviser as well as asset valuer for the proposed Air India disinvestment.
• Revision of LPG and kerosene prices: Government has asked state-run oil companies to raise subsidisedcooking gas (LPG) prices by Rs 4 per cylinder every month and prices of subsidised kerosene by 25 paiseevery fortnight until the subsidy is eliminated. The hike in the price comes in the backdrop of the government’sdecision to eliminate all the subsidies on fuel by the fiscal end.

Earnings: Choppy for Q1 FY18
Source: Antique, SBIFM Research
Earnings for FY18 downgraded while markets continue to expect 20% EPS growth for FY19
• 1QFY18 PAT for the Nifty universe, earnings havecontracted by ~10.0% which was also below streetexpectations of a 5-6% decline. The majority of thedrop has been led by OMCs (on account of inventorylosses) and Tata Motors (earnings down 94% led byEBITDA decline in JLR), ex of which there is actually agrowth, albeit a tepid 1.2% y-o-y.
• Higher NPA issues and sector specific challenges in ITand Pharmaceuticals have also dragged the earningsdown. These issues can take longer to mend.
• Other factors explaining the tepid Earnings for thequarter were the adverse impact of GST as theprocess of inventory clearing was visible across thesectors. To simplify, the businesses were in theprocess of clearing out the inventory which were builtin the old taxation regime, had slowed the fresh orderswhich in turn had impacted the manufacturing. To thatextent, earnings should improve as the process ofrestocking start from the current quarter.
• Sharper than anticipated profit decline has led themarket to significantly downgrade FY18 earnings toearly teens (11-12%) while the expectations for FY19earnings continues to hold strong at +20%.
• Corporate profits as percentage of GDP has hit anextremely low point and logically should mean revert.Earnings revival is absolutely critical for such richvaluations to sustain.
95128
175207
239283
247284
330 351385
427391 402
427475
580
-20%
-10%
0%
10%
20%
30%
40%
0
100
200
300
400
500
600
FY03
FY04
FY05
FY06
FY07
FY08
FY09
FY10
FY11
FY12
FY13
FY14
FY15
FY16
FY17
FY18
e
FY19
e
Nifty EPS YoY, RHS
3.0
4.75.4
6.27.3 7.8
5.56.5 6.2
4.9 4.6 4.33.8
3.1 2.9
FY03
FY04
FY05
FY06
FY07
FY08
FY09
FY10
FY11
FY12
FY13
FY14
FY15
FY16
FY17
Average of 5.4%
Corporate profit as percentage of GDP
Valuations
13141516171819202122
Apr
/15
Jun/
15A
ug/1
5O
ct/1
5D
ec/1
5Fe
b/16
Apr
/16
Jun/
16A
ug/1
6O
ct/1
6D
ec/1
6Fe
b/17
Apr
/17
Jun/
17A
ug/1
7
S&P Small Cap 1Y fwd PE
10
12
14
16
18
20
22
24
Jun/
13A
ug/1
3O
ct/1
3D
ec/1
3Fe
b/14
Apr
/14
Jun/
14A
ug/1
4O
ct/1
4D
ec/1
4Fe
b/15
Apr
/15
Jun/
15A
ug/1
5O
ct/1
5D
ec/1
5Fe
b/16
Apr
/16
Jun/
16A
ug/1
6O
ct/1
6D
ec/1
6Fe
b/17
Apr
/17
Jun/
17A
ug/1
7
S&P Mid Cap 1Y fwd PE
7
9
11
13
15
17
19
21
23
25
Mar
/06
Sep/
06M
ar/0
7Se
p/07
Mar
/08
Sep/
08M
ar/0
9Se
p/09
Mar
/10
Sep/
10M
ar/1
1Se
p/11
Mar
/12
Sep/
12M
ar/1
3Se
p/13
Mar
/14
Sep/
14M
ar/1
5Se
p/15
Mar
/16
Sep/
16M
ar/1
7
Sensex 1Y fwd PE
Mean: 16
+1 SD
-1 SD
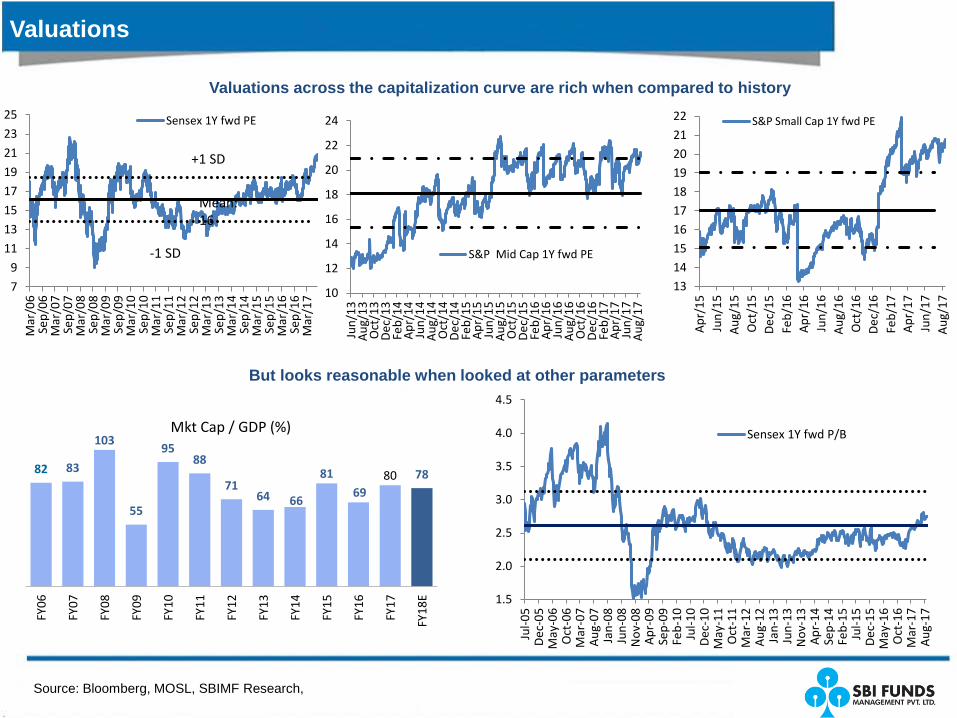
Valuations across the capitalization curve are rich when compared to history
But looks reasonable when looked at other parameters
82 83
103
55
9588
7164 66
8169
80 78
FY06
FY07
FY08
FY09
FY10
FY11
FY12
FY13
FY14
FY15
FY16
FY17
FY18
EMkt Cap / GDP (%)
1.5
2.0
2.5
3.0
3.5
4.0
4.5
Jul-0
5D
ec-0
5M
ay-0
6O
ct-0
6M
ar-0
7A
ug-0
7Ja
n-08
Jun-
08N
ov-0
8A
pr-0
9Se
p-09
Feb-
10Ju
l-10
Dec
-10
May
-11
Oct
-11
Mar
-12
Aug
-12
Jan-
13Ju
n-13
Nov
-13
Apr
-14
Sep-
14Fe
b-15
Jul-1
5D
ec-1
5M
ay-1
6O
ct-1
6M
ar-1
7A
ug-1
7
Sensex 1Y fwd P/B
Source: Bloomberg, MOSL, SBIMF Research,
Source: Morgan Stanley, SBIMF Research,
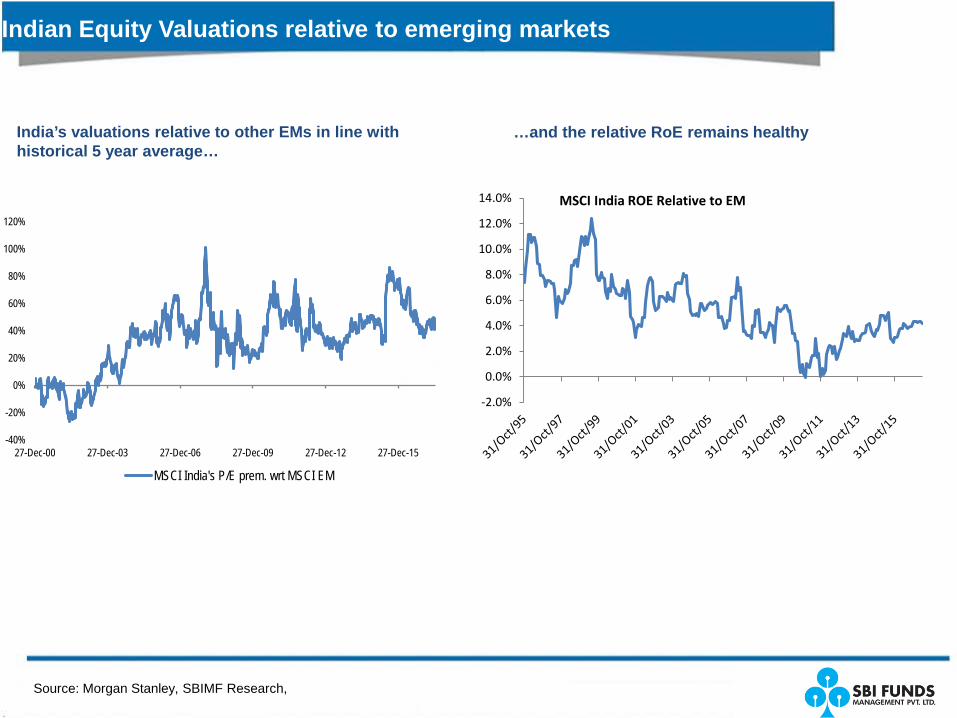
Indian Equity Valuations relative to emerging markets
India’s valuations relative to other EMs in line with historical 5 year average…
…and the relative RoE remains healthy
-2.0%
0.0%
2.0%
4.0%
6.0%
8.0%
10.0%
12.0%
14.0% MSCI India ROE Relative to EM
-40%
-20%
0%
20%
40%
60%
80%
100%
120%
27-Dec-00 27-Dec-03 27-Dec-06 27-Dec-09 27-Dec-12 27-Dec-15
MSCI India's P/E prem. wrt MSCI EM
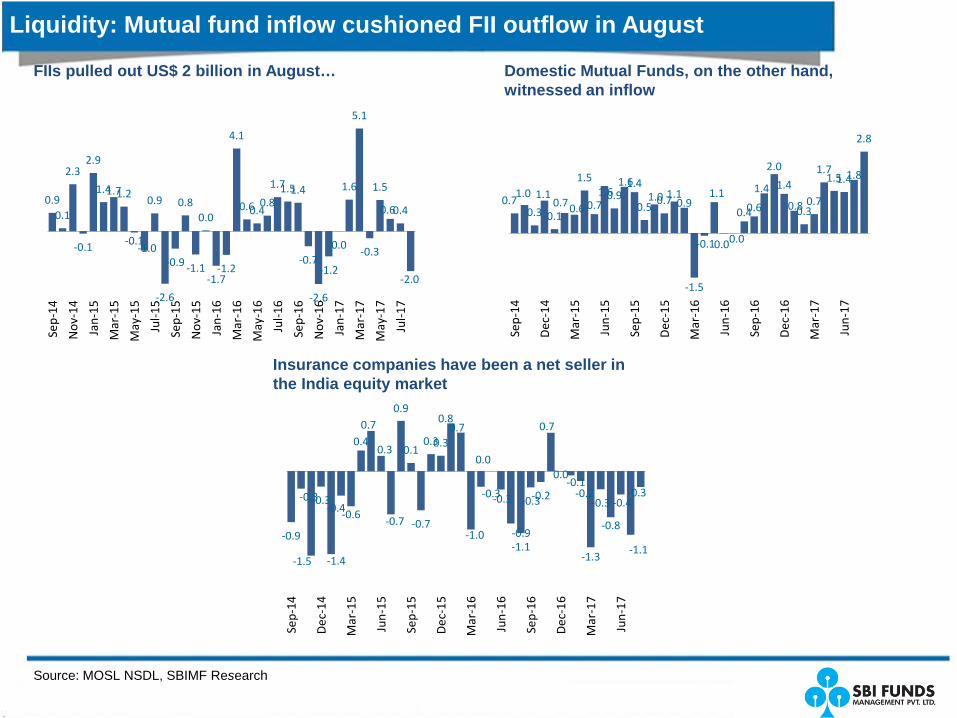
Liquidity: Mutual fund inflow cushioned FII outflow in August
Source: MOSL NSDL, SBIMF Research
FIIs pulled out US$ 2 billion in August… Domestic Mutual Funds, on the other hand, witnessed an inflow
Insurance companies have been a net seller in the India equity market
0.90.1
2.3
-0.1
2.9
1.41.71.2
-0.1-1.0
0.9
-2.6
-0.9
0.8
-1.1
0.0
-1.7-1.2
4.1
0.60.40.8
1.71.51.4
-0.7
-2.6
-1.2
0.0
1.6
5.1
-0.3
1.5
0.60.4
-2.0
Sep-
14
Nov
-14
Jan-
15
Mar
-15
May
-15
Jul-1
5
Sep-
15
Nov
-15
Jan-
16
Mar
-16
May
-16
Jul-1
6
Sep-
16
Nov
-16
Jan-
17
Mar
-17
May
-17
Jul-1
7
0.71.0
0.3
1.1
0.10.70.6
1.5
0.71.60.9
1.61.4
0.51.00.71.1
0.9
-1.5
-0.1
1.1
0.00.0
0.40.6
1.4
2.0
1.4
0.80.30.7
1.71.51.41.8
2.8
Sep-
14
Dec
-14
Mar
-15
Jun-
15
Sep-
15
Dec
-15
Mar
-16
Jun-
16
Sep-
16
Dec
-16
Mar
-17
Jun-
17
-0.9
-0.3
-1.5
-0.3
-1.4
-0.4-0.6
0.40.7
0.3
-0.7
0.9
0.1
-0.7
0.30.3
0.80.7
-1.0
-0.3
0.0
-0.3
-0.9-1.1
-0.3-0.2
0.7
0.0-0.1
-0.2
-1.3
-0.3
-0.8
-0.4
-1.1
-0.3
Sep-
14
Dec
-14
Mar
-15
Jun-
15
Sep-
15
Dec
-15
Mar
-16
Jun-
16
Sep-
16
Dec
-16
Mar
-17
Jun-
17
Equity Market outlook
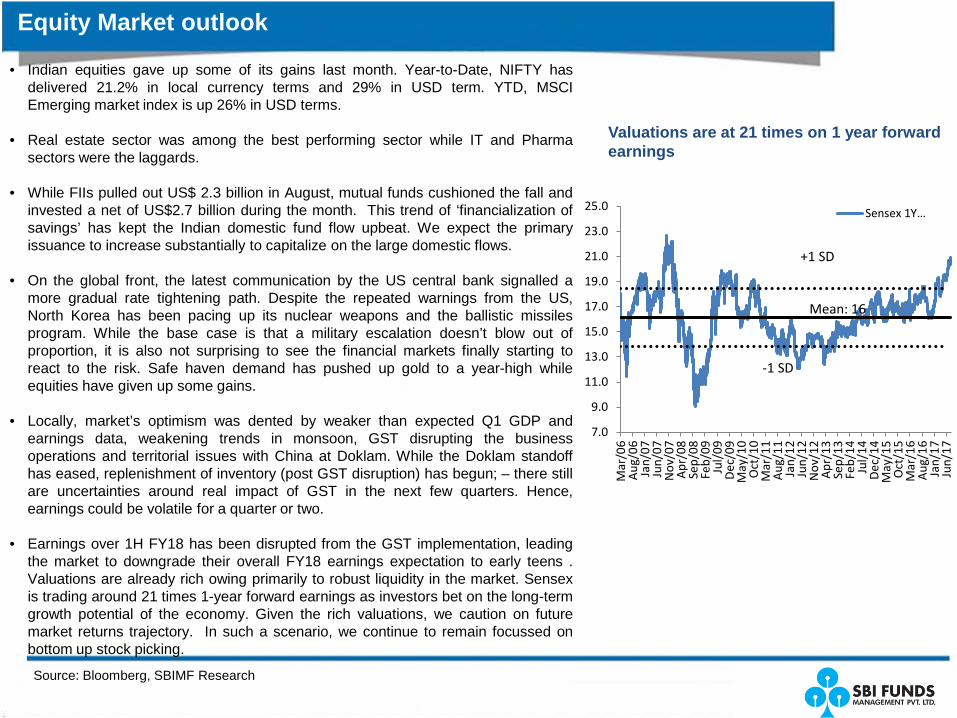
• Indian equities gave up some of its gains last month. Year-to-Date, NIFTY hasdelivered 21.2% in local currency terms and 29% in USD term. YTD, MSCIEmerging market index is up 26% in USD terms.
• Real estate sector was among the best performing sector while IT and Pharmasectors were the laggards.
• While FIIs pulled out US$ 2.3 billion in August, mutual funds cushioned the fall andinvested a net of US$2.7 billion during the month. This trend of ‘financialization ofsavings’ has kept the Indian domestic fund flow upbeat. We expect the primaryissuance to increase substantially to capitalize on the large domestic flows.
• On the global front, the latest communication by the US central bank signalled amore gradual rate tightening path. Despite the repeated warnings from the US,North Korea has been pacing up its nuclear weapons and the ballistic missilesprogram. While the base case is that a military escalation doesn’t blow out ofproportion, it is also not surprising to see the financial markets finally starting toreact to the risk. Safe haven demand has pushed up gold to a year-high whileequities have given up some gains.
• Locally, market’s optimism was dented by weaker than expected Q1 GDP andearnings data, weakening trends in monsoon, GST disrupting the businessoperations and territorial issues with China at Doklam. While the Doklam standoffhas eased, replenishment of inventory (post GST disruption) has begun; – there stillare uncertainties around real impact of GST in the next few quarters. Hence,earnings could be volatile for a quarter or two.
• Earnings over 1H FY18 has been disrupted from the GST implementation, leadingthe market to downgrade their overall FY18 earnings expectation to early teens .Valuations are already rich owing primarily to robust liquidity in the market. Sensexis trading around 21 times 1-year forward earnings as investors bet on the long-termgrowth potential of the economy. Given the rich valuations, we caution on futuremarket returns trajectory. In such a scenario, we continue to remain focussed onbottom up stock picking.
Valuations are at 21 times on 1 year forward earnings
Source: Bloomberg, SBIMF Research
7.0
9.0
11.0
13.0
15.0
17.0
19.0
21.0
23.0
25.0
Mar
/06
Aug
/06
Jan/
07Ju
n/07
Nov
/07
Apr
/08
Sep/
08Fe
b/09
Jul/
09D
ec/0
9M
ay/1
0O
ct/1
0M
ar/1
1A
ug/1
1Ja
n/12
Jun/
12N
ov/1
2A
pr/1
3Se
p/13
Feb/
14Ju
l/14
Dec
/14
May
/15
Oct
/15
Mar
/16
Aug
/16
Jan/
17Ju
n/17
Sensex 1Y…
Mean: 16
+1 SD
-1 SD
FIXED INCOME MARKET
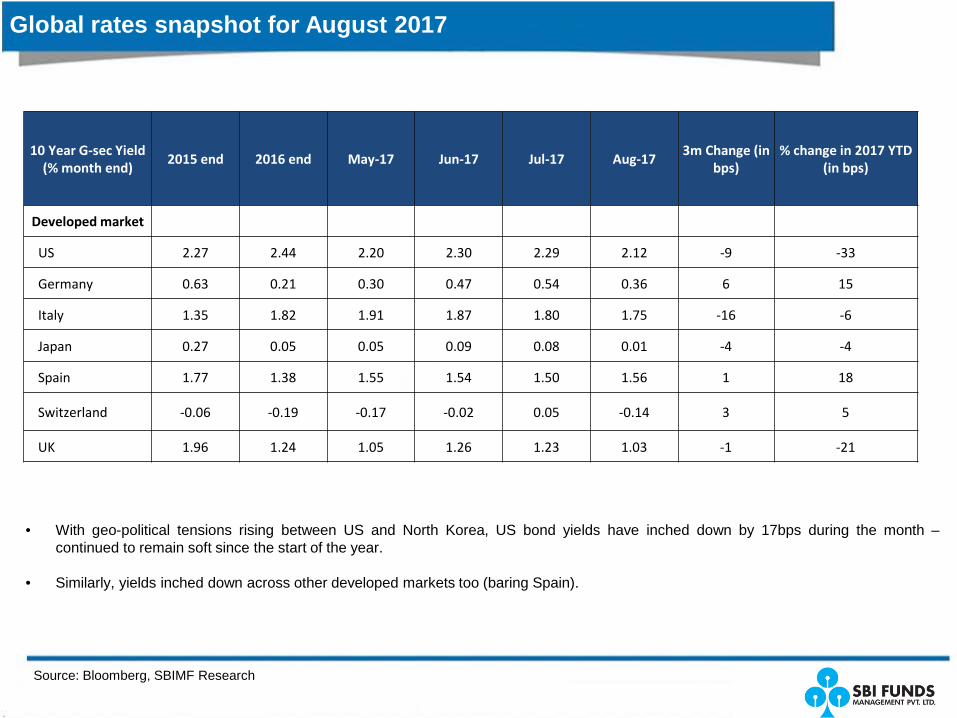
Global rates snapshot for August 2017
• With geo-political tensions rising between US and North Korea, US bond yields have inched down by 17bps during the month –continued to remain soft since the start of the year.
• Similarly, yields inched down across other developed markets too (baring Spain).
Source: Bloomberg, SBIMF Research
10 Year G-sec Yield (% month end) 2015 end 2016 end May-17 Jun-17 Jul-17 Aug-17 3m Change (in
bps)% change in 2017 YTD
(in bps)
Developed market
US 2.27 2.44 2.20 2.30 2.29 2.12 -9 -33
Germany 0.63 0.21 0.30 0.47 0.54 0.36 6 15
Italy 1.35 1.82 1.91 1.87 1.80 1.75 -16 -6
Japan 0.27 0.05 0.05 0.09 0.08 0.01 -4 -4
Spain 1.77 1.38 1.55 1.54 1.50 1.56 1 18
Switzerland -0.06 -0.19 -0.17 -0.02 0.05 -0.14 3 5
UK 1.96 1.24 1.05 1.26 1.23 1.03 -1 -21

Emerging Market Bond yields- August 2017
Source: Bloomberg, SBIMF Research
Bond yields majorly fell in the Emerging markets. China and Korea depicted the rise in bond yields while bond yields fell or remained same for other key EMs YTD
10 Year Gsec Yield (% mth end) 2015 end 2016 end May-17 Jun-17 Jul-17 Aug-17 3m Change
(in bps)% change in 2017 YTD
(in bps)
Emerging Market
Brazil 16.5 11.4 10.7 10.5 10.0 10.0 -72 -143
China 2.8 3.0 3.6 3.6 3.62 3.66 2 62
India 7.8 6.5 6.7 6.5 6.47 6.53 -14 1
Indonesia 8.7 7.9 6.9 6.8 6.92 6.67 -27 -125
Korea 2.1 2.1 2.2 2.2 2.23 2.27 3 19
Malaysia 4.2 4.2 3.9 3.9 3.99 3.89 1 -30
Philippines 3.9 4.6 4.7 4.7 4.65 4.65 -2 2
Russia 9.6 8.4 7.6 7.7 7.81 7.75 14 -61
South Africa 9.8 8.9 8.6 8.8 8.62 8.56 -2 -35
Taiwan 1.0 1.2 1.0 1.1 1.08 1.04 2 -17
Thailand 2.5 2.6 2.6 2.5 2.43 2.32 -31 -33
India Rates Snapshot for August 2017
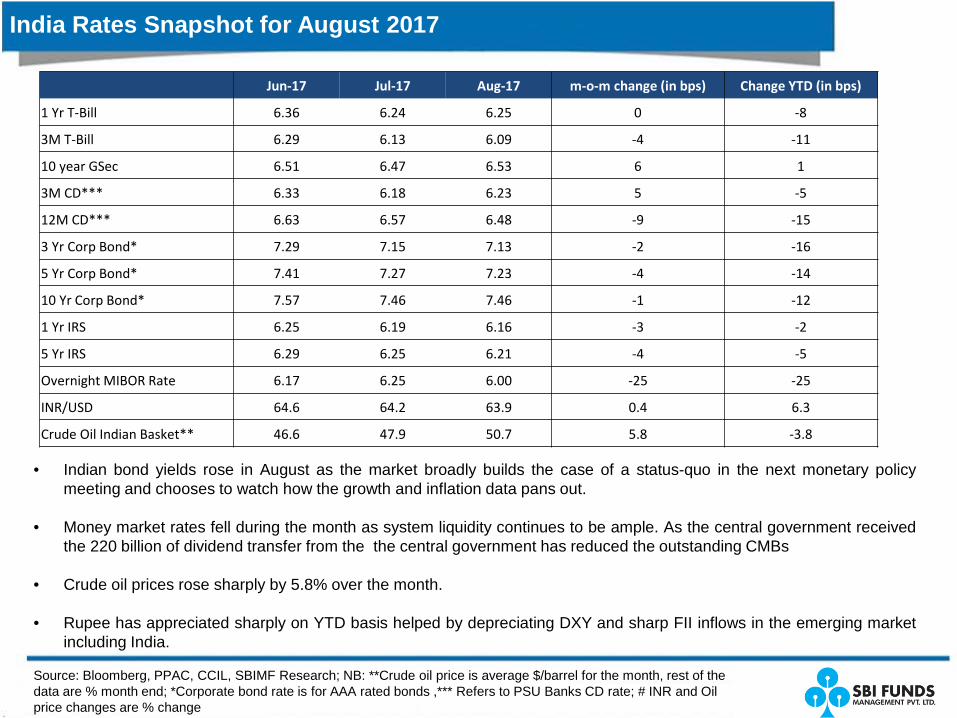
• Indian bond yields rose in August as the market broadly builds the case of a status-quo in the next monetary policymeeting and chooses to watch how the growth and inflation data pans out.
• Money market rates fell during the month as system liquidity continues to be ample. As the central government receivedthe 220 billion of dividend transfer from the the central government has reduced the outstanding CMBs
• Crude oil prices rose sharply by 5.8% over the month.
• Rupee has appreciated sharply on YTD basis helped by depreciating DXY and sharp FII inflows in the emerging marketincluding India.
Source: Bloomberg, PPAC, CCIL, SBIMF Research; NB: **Crude oil price is average $/barrel for the month, rest of the data are % month end; *Corporate bond rate is for AAA rated bonds ,*** Refers to PSU Banks CD rate; # INR and Oil price changes are % change
Jun-17 Jul-17 Aug-17 m-o-m change (in bps) Change YTD (in bps)
1 Yr T-Bill 6.36 6.24 6.25 0 -8
3M T-Bill 6.29 6.13 6.09 -4 -11
10 year GSec 6.51 6.47 6.53 6 1
3M CD*** 6.33 6.18 6.23 5 -5
12M CD*** 6.63 6.57 6.48 -9 -15
3 Yr Corp Bond* 7.29 7.15 7.13 -2 -16
5 Yr Corp Bond* 7.41 7.27 7.23 -4 -14
10 Yr Corp Bond* 7.57 7.46 7.46 -1 -12
1 Yr IRS 6.25 6.19 6.16 -3 -2
5 Yr IRS 6.29 6.25 6.21 -4 -5
Overnight MIBOR Rate 6.17 6.25 6.00 -25 -25
INR/USD 64.6 64.2 63.9 0.4 6.3
Crude Oil Indian Basket** 46.6 47.9 50.7 5.8 -3.8
CPI inflation has bottomed out; but to stay contained below 4%
Source: CSO, SBIMF Research
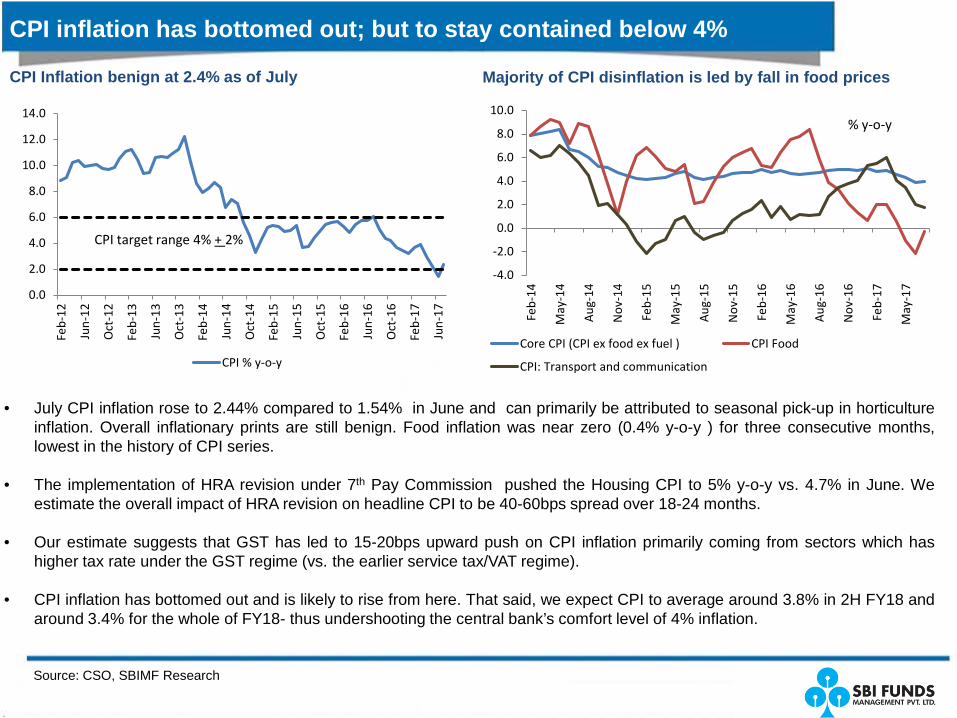
• July CPI inflation rose to 2.44% compared to 1.54% in June and can primarily be attributed to seasonal pick-up in horticultureinflation. Overall inflationary prints are still benign. Food inflation was near zero (0.4% y-o-y ) for three consecutive months,lowest in the history of CPI series.
• The implementation of HRA revision under 7th Pay Commission pushed the Housing CPI to 5% y-o-y vs. 4.7% in June. Weestimate the overall impact of HRA revision on headline CPI to be 40-60bps spread over 18-24 months.
• Our estimate suggests that GST has led to 15-20bps upward push on CPI inflation primarily coming from sectors which hashigher tax rate under the GST regime (vs. the earlier service tax/VAT regime).
• CPI inflation has bottomed out and is likely to rise from here. That said, we expect CPI to average around 3.8% in 2H FY18 andaround 3.4% for the whole of FY18- thus undershooting the central bank’s comfort level of 4% inflation.
CPI Inflation benign at 2.4% as of July Majority of CPI disinflation is led by fall in food prices
-4.0
-2.0
0.0
2.0
4.0
6.0
8.0
10.0
Feb-
14
May
-14
Aug
-14
Nov
-14
Feb-
15
May
-15
Aug
-15
Nov
-15
Feb-
16
May
-16
Aug
-16
Nov
-16
Feb-
17
May
-17
Core CPI (CPI ex food ex fuel ) CPI Food
CPI: Transport and communication
% y-o-y
0.0
2.0
4.0
6.0
8.0
10.0
12.0
14.0
Feb-
12
Jun-
12
Oct
-12
Feb-
13
Jun-
13
Oct
-13
Feb-
14
Jun-
14
Oct
-14
Feb-
15
Jun-
15
Oct
-15
Feb-
16
Jun-
16
Oct
-16
Feb-
17
Jun-
17
CPI % y-o-y
CPI target range 4% + 2%
Banking system Liquidity to stay in surplus through the year
Source: RBI, SBIMF Research
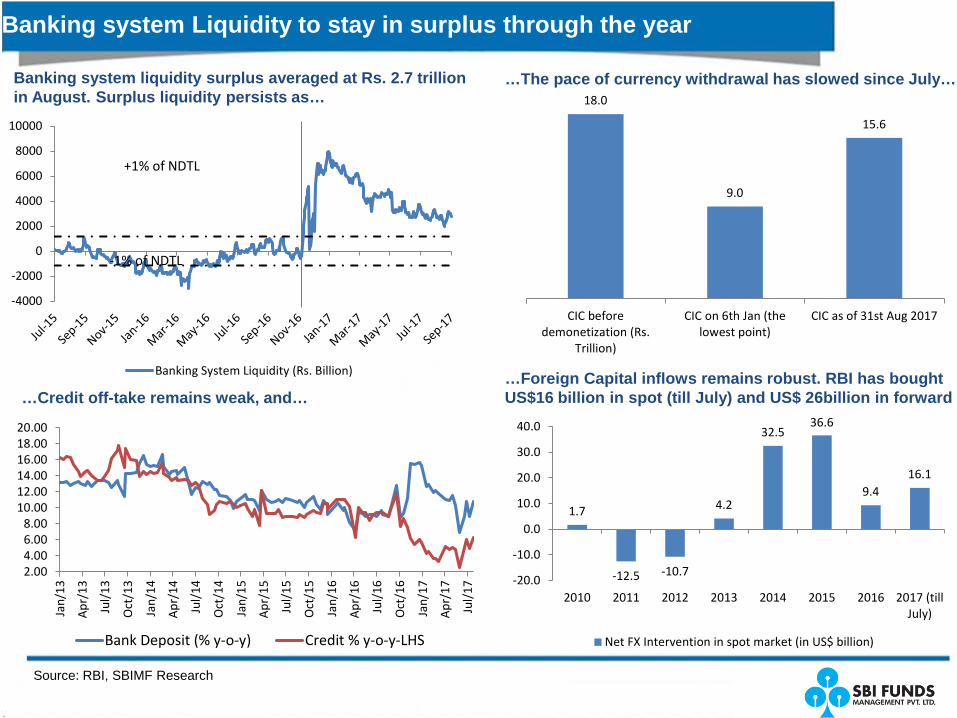
Banking system liquidity surplus averaged at Rs. 2.7 trillion in August. Surplus liquidity persists as…
…The pace of currency withdrawal has slowed since July…
-4000
-2000
0
2000
4000
6000
8000
10000
Banking System Liquidity (Rs. Billion)
+1% of NDTL
-1% of NDTL
18.0
9.0
15.6
CIC beforedemonetization (Rs.
Trillion)
CIC on 6th Jan (thelowest point)
CIC as of 31st Aug 2017
2.004.006.008.00
10.0012.0014.0016.0018.0020.00
Jan/
13
Apr
/13
Jul/
13
Oct
/13
Jan/
14
Apr
/14
Jul/
14
Oct
/14
Jan/
15
Apr
/15
Jul/
15
Oct
/15
Jan/
16
Apr
/16
Jul/
16
Oct
/16
Jan/
17
Apr
/17
Jul/
17
Bank Deposit (% y-o-y) Credit % y-o-y-LHS
…Credit off-take remains weak, and…
1.7
-12.5 -10.7
4.2
32.536.6
9.416.1
-20.0
-10.0
0.0
10.0
20.0
30.0
40.0
2010 2011 2012 2013 2014 2015 2016 2017 (tillJuly)
Net FX Intervention in spot market (in US$ billion)
…Foreign Capital inflows remains robust. RBI has bought US$16 billion in spot (till July) and US$ 26billion in forward
Source: Bloomberg, SBIMF Research,
Commodity: Energy prices pressures are soft while metals price rising
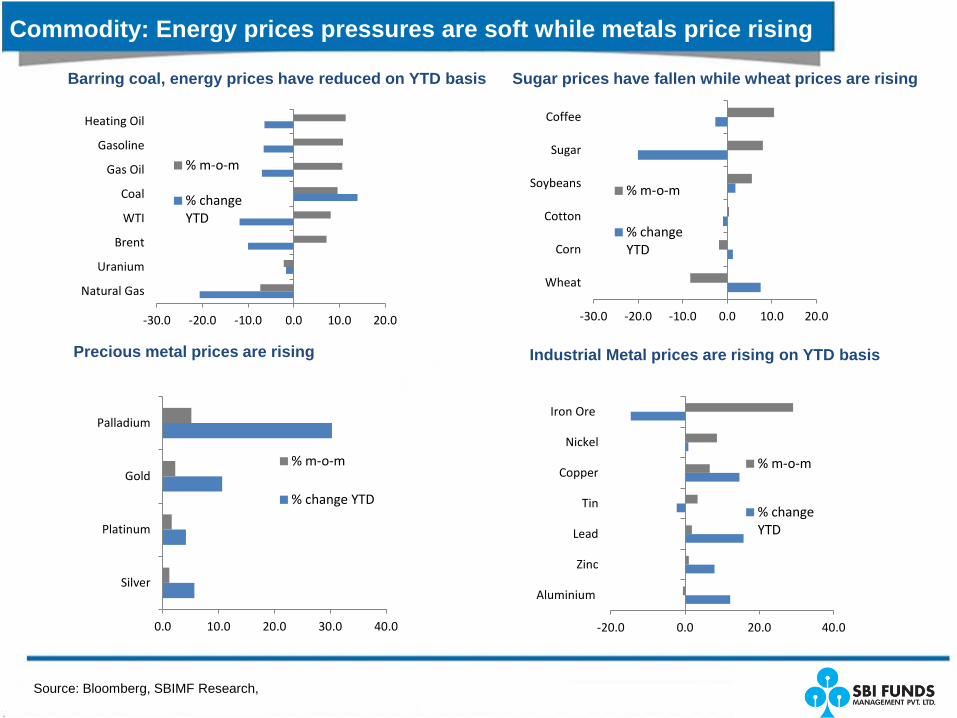
Barring coal, energy prices have reduced on YTD basis
Precious metal prices are rising Industrial Metal prices are rising on YTD basis
-30.0 -20.0 -10.0 0.0 10.0 20.0
Natural Gas
Uranium
Brent
WTI
Coal
Gas Oil
Gasoline
Heating Oil
% m-o-m
% changeYTD
-30.0 -20.0 -10.0 0.0 10.0 20.0
Wheat
Corn
Cotton
Soybeans
Sugar
Coffee
% m-o-m
% changeYTD
0.0 10.0 20.0 30.0 40.0
Silver
Platinum
Gold
Palladium
% m-o-m
% change YTD
-20.0 0.0 20.0 40.0
Aluminium
Zinc
Lead
Tin
Copper
Nickel
Iron Ore
% m-o-m
% changeYTD
Sugar prices have fallen while wheat prices are rising
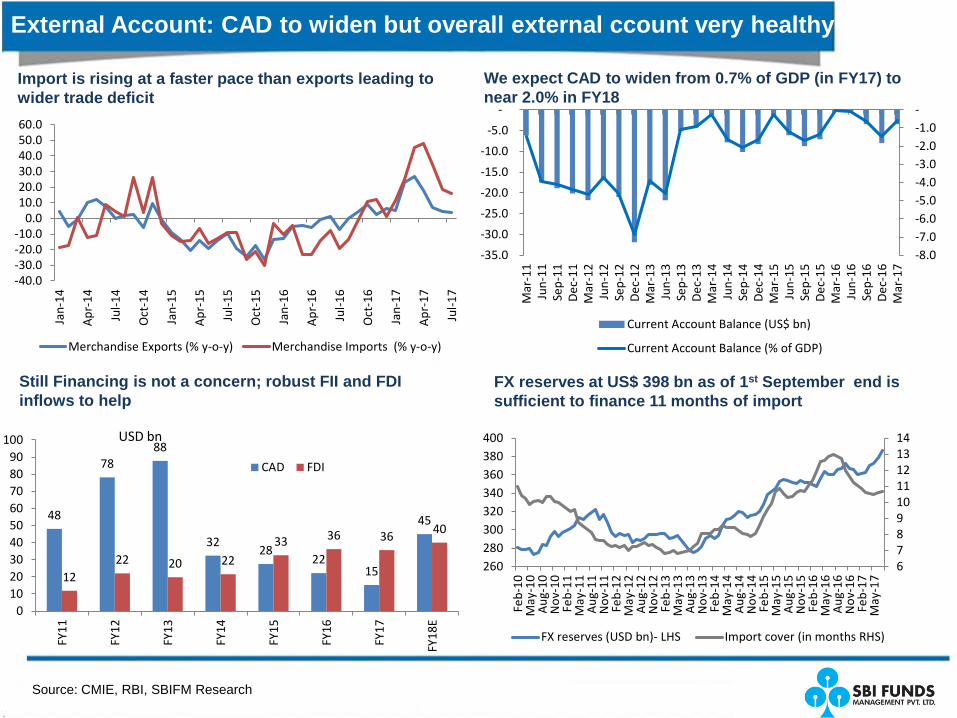
External Account: CAD to widen but overall external ccount very healthy
Import is rising at a faster pace than exports leading to wider trade deficit
Source: CMIE, RBI, SBIFM Research
We expect CAD to widen from 0.7% of GDP (in FY17) to near 2.0% in FY18
Still Financing is not a concern; robust FII and FDI inflows to help
FX reserves at US$ 398 bn as of 1st September end is sufficient to finance 11 months of import
67891011121314
260280300320340360380400
Feb-
10M
ay-1
0A
ug-1
0N
ov-1
0Fe
b-11
May
-11
Aug
-11
Nov
-11
Feb-
12M
ay-1
2A
ug-1
2N
ov-1
2Fe
b-13
May
-13
Aug
-13
Nov
-13
Feb-
14M
ay-1
4A
ug-1
4N
ov-1
4Fe
b-15
May
-15
Aug
-15
Nov
-15
Feb-
16M
ay-1
6A
ug-1
6N
ov-1
6Fe
b-17
May
-17
FX reserves (USD bn)- LHS Import cover (in months RHS)
-40.0-30.0-20.0-10.0
0.010.020.030.040.050.060.0
Jan-
14
Apr
-14
Jul-1
4
Oct
-14
Jan-
15
Apr
-15
Jul-1
5
Oct
-15
Jan-
16
Apr
-16
Jul-1
6
Oct
-16
Jan-
17
Apr
-17
Jul-1
7
Merchandise Exports (% y-o-y) Merchandise Imports (% y-o-y)
-8.0 -7.0 -6.0 -5.0 -4.0 -3.0 -2.0 -1.0 -
-35.0
-30.0
-25.0
-20.0
-15.0
-10.0
-5.0
-
Mar
-11
Jun-
11Se
p-11
Dec
-11
Mar
-12
Jun-
12Se
p-12
Dec
-12
Mar
-13
Jun-
13Se
p-13
Dec
-13
Mar
-14
Jun-
14Se
p-14
Dec
-14
Mar
-15
Jun-
15Se
p-15
Dec
-15
Mar
-16
Jun-
16Se
p-16
Dec
-16
Mar
-17
Current Account Balance (US$ bn)
Current Account Balance (% of GDP)
48
7888
3228
2215
45
1222 20 22
33 36 36 40
0102030405060708090
100
FY11
FY12
FY13
FY14
FY15
FY16
FY17
FY18
E
CAD FDI
USD bn
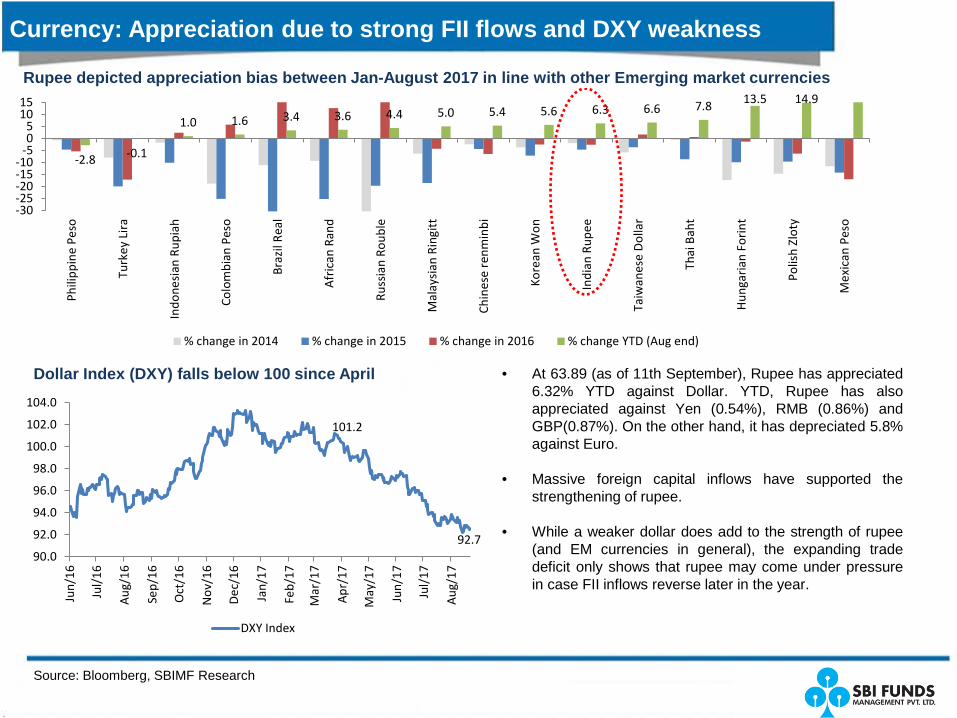
Rupee depicted appreciation bias between Jan-August 2017 in line with other Emerging market currencies
Currency: Appreciation due to strong FII flows and DXY weakness
Source: Bloomberg, SBIMF Research
Dollar Index (DXY) falls below 100 since April • At 63.89 (as of 11th September), Rupee has appreciated6.32% YTD against Dollar. YTD, Rupee has alsoappreciated against Yen (0.54%), RMB (0.86%) andGBP(0.87%). On the other hand, it has depreciated 5.8%against Euro.
• Massive foreign capital inflows have supported thestrengthening of rupee.
• While a weaker dollar does add to the strength of rupee(and EM currencies in general), the expanding tradedeficit only shows that rupee may come under pressurein case FII inflows reverse later in the year.
101.2
92.790.0
92.0
94.0
96.0
98.0
100.0
102.0
104.0
Jun/
16
Jul/
16
Aug
/16
Sep/
16
Oct
/16
Nov
/16
Dec
/16
Jan/
17
Feb/
17
Mar
/17
Apr
/17
May
/17
Jun/
17
Jul/
17
Aug
/17
DXY Index
-2.8 -0.1
1.0 1.6 3.4 3.6 4.4 5.0 5.4 5.6 6.3 6.6 7.8 13.5 14.9
-30-25-20-15-10
-505
1015
Phili
ppin
e Pe
so
Turk
ey L
ira
Indo
nesi
an R
upia
h
Colo
mbi
an P
eso
Braz
il Re
al
Afr
ican
Ran
d
Russ
ian
Roub
le
Mal
aysi
an R
ingi
tt
Chin
ese
renm
inbi
Kore
an W
on
Indi
an R
upee
Taiw
anes
e D
olla
r
Thai
Bah
t
Hun
gari
an F
orin
t
Polis
h Zl
oty
Mex
ican
Pes
o
% change in 2014 % change in 2015 % change in 2016 % change YTD (Aug end)
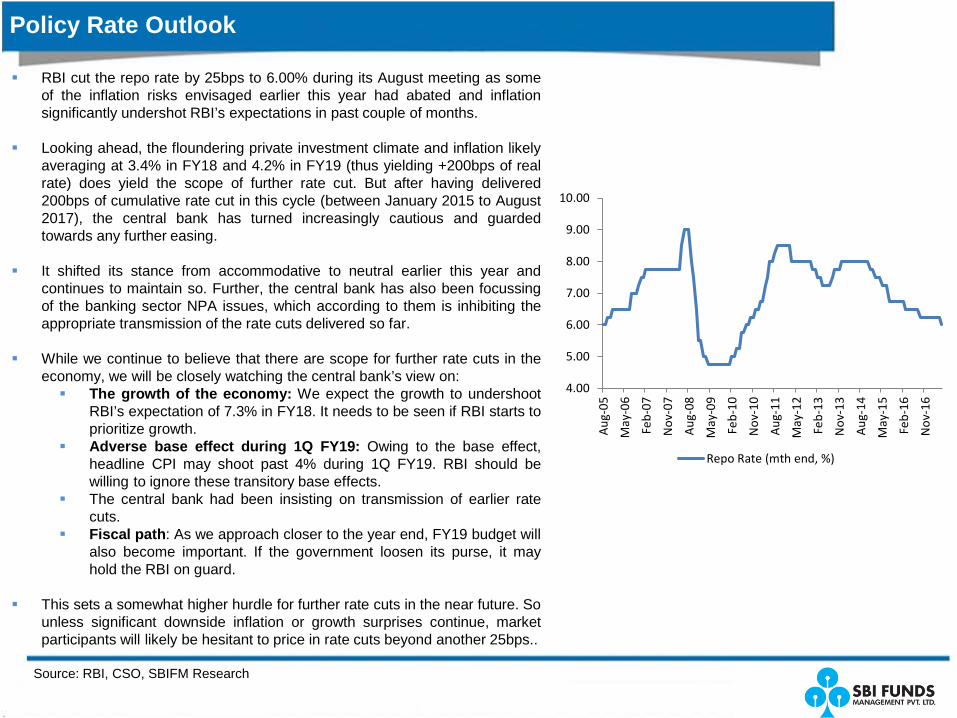
RBI cut the repo rate by 25bps to 6.00% during its August meeting as someof the inflation risks envisaged earlier this year had abated and inflationsignificantly undershot RBI’s expectations in past couple of months.
Looking ahead, the floundering private investment climate and inflation likelyaveraging at 3.4% in FY18 and 4.2% in FY19 (thus yielding +200bps of realrate) does yield the scope of further rate cut. But after having delivered200bps of cumulative rate cut in this cycle (between January 2015 to August2017), the central bank has turned increasingly cautious and guardedtowards any further easing.
It shifted its stance from accommodative to neutral earlier this year andcontinues to maintain so. Further, the central bank has also been focussingof the banking sector NPA issues, which according to them is inhibiting theappropriate transmission of the rate cuts delivered so far.
While we continue to believe that there are scope for further rate cuts in theeconomy, we will be closely watching the central bank’s view on: The growth of the economy: We expect the growth to undershoot
RBI’s expectation of 7.3% in FY18. It needs to be seen if RBI starts toprioritize growth.
Adverse base effect during 1Q FY19: Owing to the base effect,headline CPI may shoot past 4% during 1Q FY19. RBI should bewilling to ignore these transitory base effects.
The central bank had been insisting on transmission of earlier ratecuts.
Fiscal path: As we approach closer to the year end, FY19 budget willalso become important. If the government loosen its purse, it mayhold the RBI on guard.
This sets a somewhat higher hurdle for further rate cuts in the near future. Sounless significant downside inflation or growth surprises continue, marketparticipants will likely be hesitant to price in rate cuts beyond another 25bps..
Policy Rate Outlook
Source: RBI, CSO, SBIFM Research
4.00
5.00
6.00
7.00
8.00
9.00
10.00
Aug
-05
May
-06
Feb-
07
Nov
-07
Aug
-08
May
-09
Feb-
10
Nov
-10
Aug
-11
May
-12
Feb-
13
Nov
-13
Aug
-14
May
-15
Feb-
16
Nov
-16
Repo Rate (mth end, %)
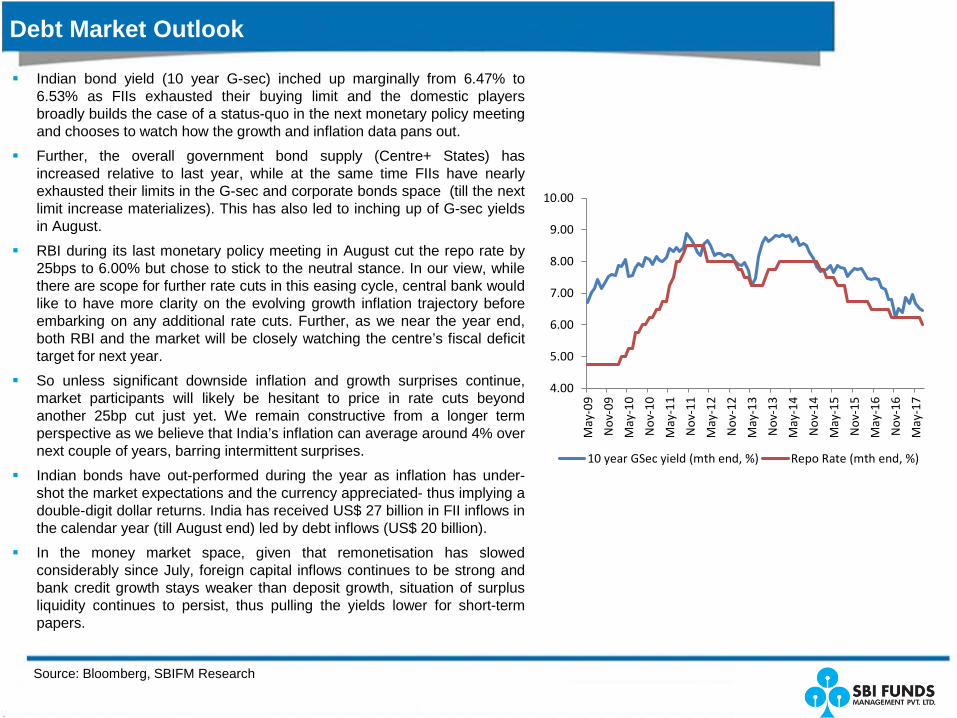
Indian bond yield (10 year G-sec) inched up marginally from 6.47% to6.53% as FIIs exhausted their buying limit and the domestic playersbroadly builds the case of a status-quo in the next monetary policy meetingand chooses to watch how the growth and inflation data pans out.
Further, the overall government bond supply (Centre+ States) hasincreased relative to last year, while at the same time FIIs have nearlyexhausted their limits in the G-sec and corporate bonds space (till the nextlimit increase materializes). This has also led to inching up of G-sec yieldsin August.
RBI during its last monetary policy meeting in August cut the repo rate by25bps to 6.00% but chose to stick to the neutral stance. In our view, whilethere are scope for further rate cuts in this easing cycle, central bank wouldlike to have more clarity on the evolving growth inflation trajectory beforeembarking on any additional rate cuts. Further, as we near the year end,both RBI and the market will be closely watching the centre’s fiscal deficittarget for next year.
So unless significant downside inflation and growth surprises continue,market participants will likely be hesitant to price in rate cuts beyondanother 25bp cut just yet. We remain constructive from a longer termperspective as we believe that India’s inflation can average around 4% overnext couple of years, barring intermittent surprises.
Indian bonds have out-performed during the year as inflation has under-shot the market expectations and the currency appreciated- thus implying adouble-digit dollar returns. India has received US$ 27 billion in FII inflows inthe calendar year (till August end) led by debt inflows (US$ 20 billion).
In the money market space, given that remonetisation has slowedconsiderably since July, foreign capital inflows continues to be strong andbank credit growth stays weaker than deposit growth, situation of surplusliquidity continues to persist, thus pulling the yields lower for short-termpapers.
Debt Market Outlook
Source: Bloomberg, SBIFM Research
4.00
5.00
6.00
7.00
8.00
9.00
10.00
May
-09
Nov
-09
May
-10
Nov
-10
May
-11
Nov
-11
May
-12
Nov
-12
May
-13
Nov
-13
May
-14
Nov
-14
May
-15
Nov
-15
May
-16
Nov
-16
May
-17
10 year GSec yield (mth end, %) Repo Rate (mth end, %)
Thank you

Disclaimer
This presentation is for information purposes only and is not an offer to sell or a solicitation to buy anymutual fund units/securities. These views alone are not sufficient and should not be used for thedevelopment or implementation of an investment strategy. It should not be construed as investmentadvice to any party. All opinions and estimates included here constitute our view as of this date and aresubject to change without notice. Neither SBI Funds Management Private Limited, nor any personconnected with it, accepts any liability arising from the use of this information. The recipient of thismaterial should rely on their investigations and take their own professional advice.
Mutual Funds investments are subject to market risks, read all scheme related documentscarefully.
Asset Management Company: SBI Funds Management Private Limited (A joint venture with SBI andAMUNDI). Trustee Company: SBI Mutual Fund Trustee Company Private Limited.
Contact Details
SBI Funds Management Private Limited
(A joint venture between SBI and AMUNDI)
Corporate Office:9th Floor, Crescenzo, C-38 & 39, G Block,Bandra Kurla Complex,Bandra (East), Mumbai - 400 051Tel: +91 22 6179 3000Fax: +91 22 6742 5687/88/89/90/91Website: www.sbimf.com
Call: 1800 425 5425
Visit us @ www.youtube.com/user/sbimutualfund
SMS: “SBIMF” to 56161
Email: [email protected]
Visit us @ www.facebook.com/SBIMF