market profile belgium - tmi.org.uk · pdf filemarket and trade profile belgium • chapter...
TRANSCRIPT
Market and Trade Profile Belgium
Market and
Trade Profile: Belgium
Belgium
Market and Trade Profile Belgium
• Chapter 1: Inbound market statistics provides insights on key statistics about
Belgian travellers and who they are. It takes a look at Britain and its competitive
set as well as activities of Belgian visitors in the UK.
• Chapter 2: Understanding the market takes a close look at Belgian consumer
trends, booking, planning and further travel behaviour of this source market.
• Chapter 3: Access and travel trade shows how Belgians travel to the UK, how
to best cater for their needs and wants during their stay and gives insights into
the Belgian travel trade. Further ways of working with VisitBritain and other
useful research resources are pointed out.
2
Overview
Market and Trade Profile Belgium
Contents
Chapter 1:
Inbound market statistics
1.1 Key statistics 6
1.2 Visitor demographics 17
1.3 Britain & competitors 21
1.4 Inbound activities 23
Chapter 2:
Understanding the market
2.1 Structural drivers 31
2.2 Consumer trends 35
2.3 Booking and planning 38
2.4 Reaching the consumer 40
Chapter 3:
Access and travel trade
3.1 Access 46
3.2 Travel Trade 50
3.3 Caring for the consumer 55
3.4 Working with VisitBritain 58
3.5 Useful research resources 59
3

Market and Trade Profile Belgium
Inbound market
statistics
Chapter 1:
4
Market and Trade Profile Belgium
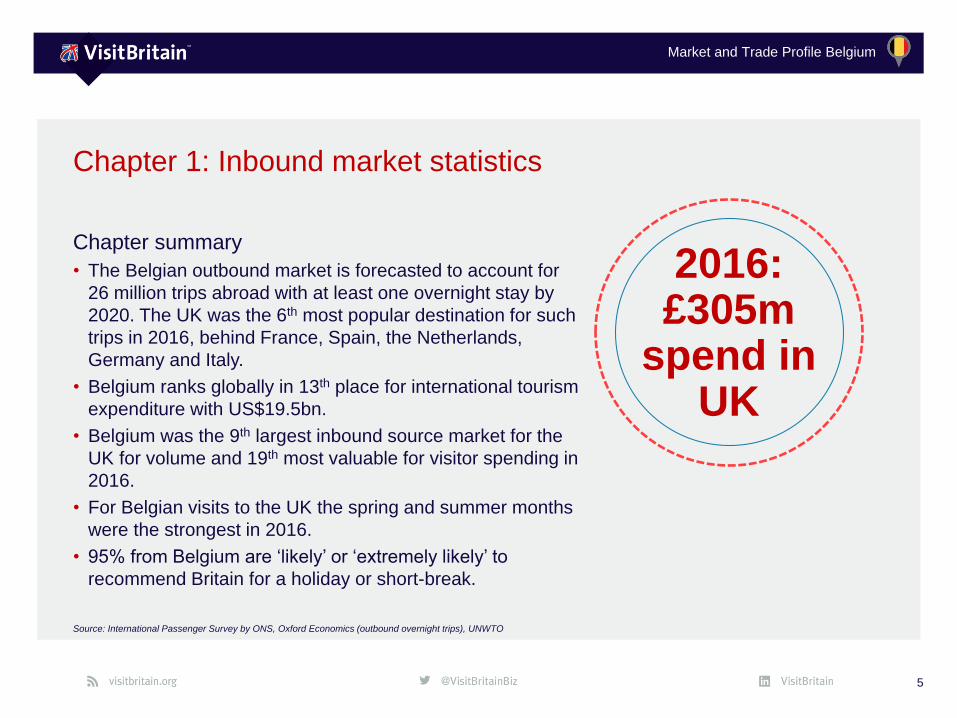
Chapter summary
• The Belgian outbound market is forecasted to account for
26 million trips abroad with at least one overnight stay by
2020. The UK was the 6th most popular destination for such
trips in 2016, behind France, Spain, the Netherlands,
Germany and Italy.
• Belgium ranks globally in 13th place for international tourism
expenditure with US$19.5bn.
• Belgium was the 9th largest inbound source market for the
UK for volume and 19th most valuable for visitor spending in
2016.
• For Belgian visits to the UK the spring and summer months
were the strongest in 2016.
• 95% from Belgium are ‘likely’ or ‘extremely likely’ to
recommend Britain for a holiday or short-break.
5
Chapter 1: Inbound market statistics
Source: International Passenger Survey by ONS, Oxford Economics (outbound overnight trips), UNWTO
2016:£305m
spend in UK
Market and Trade Profile Belgium
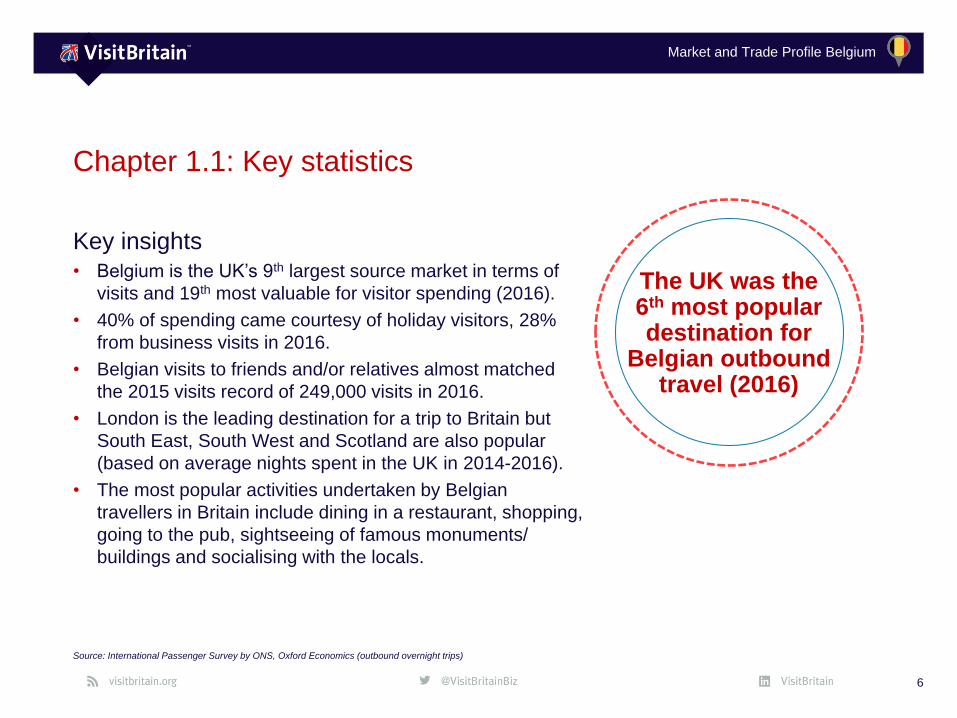
Key insights• Belgium is the UK’s 9th largest source market in terms of
visits and 19th most valuable for visitor spending (2016).
• 40% of spending came courtesy of holiday visitors, 28%
from business visits in 2016.
• Belgian visits to friends and/or relatives almost matched
the 2015 visits record of 249,000 visits in 2016.
• London is the leading destination for a trip to Britain but
South East, South West and Scotland are also popular
(based on average nights spent in the UK in 2014-2016).
• The most popular activities undertaken by Belgian
travellers in Britain include dining in a restaurant, shopping,
going to the pub, sightseeing of famous monuments/
buildings and socialising with the locals.
6
Chapter 1.1: Key statistics
Source: International Passenger Survey by ONS, Oxford Economics (outbound overnight trips)
The UK was the6th most popular destination for
Belgian outbound travel (2016)

Market and Trade Profile Belgium
1.1 Key statistics: global context and 10 year trend
7
Source: International Passenger Survey by ONS, UNWTO, Oxford Economics (outbound overnight trips)
Measure 2016
International tourism
expenditure (US$bn)19.5
Global rank for international
tourism expenditure13
Number of outbound
overnight visits (m)23.3
Most visited destination France
Global context Inbound travel to the UK overview
Measure Visits
(000s)
Nights
(000s)
Spend
(£m)
10 year trend
2007 995 2,834 246
2008 970 2,929 247
2009 903 2,925 255
2010 1,136 4,002 401
2011 984 3,101 282
2012 1,113 3,551 311
2013 1,174 3,660 383
2014 1,122 3,467 342
2015 1,175 3,940 371
2016 1,048 3,452 305
Share of UK total
in 20162.8% 1.2% 1.4%
Market and Trade Profile Belgium
1.1 Key statistics – volume and value
8
Source: International Passenger Survey by ONS, *January – September 2017 based on provisional data
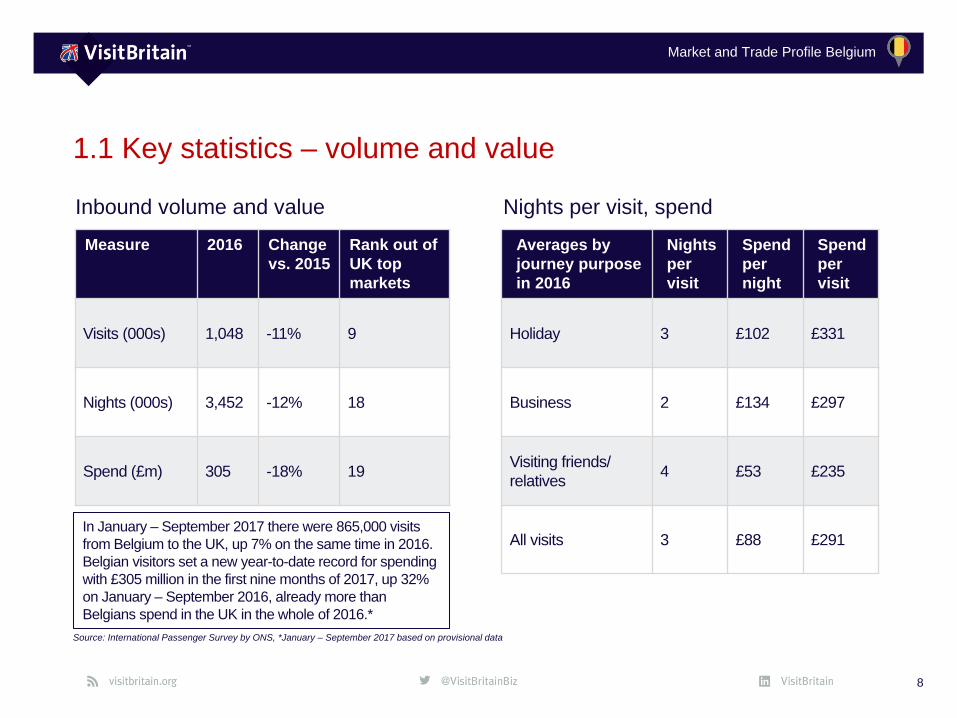
Measure 2016 Change
vs. 2015
Rank out of
UK top
markets
Visits (000s) 1,048 -11% 9
Nights (000s) 3,452 -12% 18
Spend (£m) 305 -18% 19
Inbound volume and value Nights per visit, spend
Averages by
journey purpose
in 2016
Nights
per
visit
Spend
per
night
Spend
per
visit
Holiday 3 £102 £331
Business 2 £134 £297
Visiting friends/
relatives4 £53 £235
All visits 3 £88 £291In January – September 2017 there were 865,000 visits
from Belgium to the UK, up 7% on the same time in 2016.
Belgian visitors set a new year-to-date record for spending
with £305 million in the first nine months of 2017, up 32%
on January – September 2016, already more than
Belgians spend in the UK in the whole of 2016.*
Market and Trade Profile Belgium
1.1 Key statistics: journey purpose
9
Journey purpose 2016
Source: International Passenger Survey by ONS; repeat / first time visitors question asked in 2015
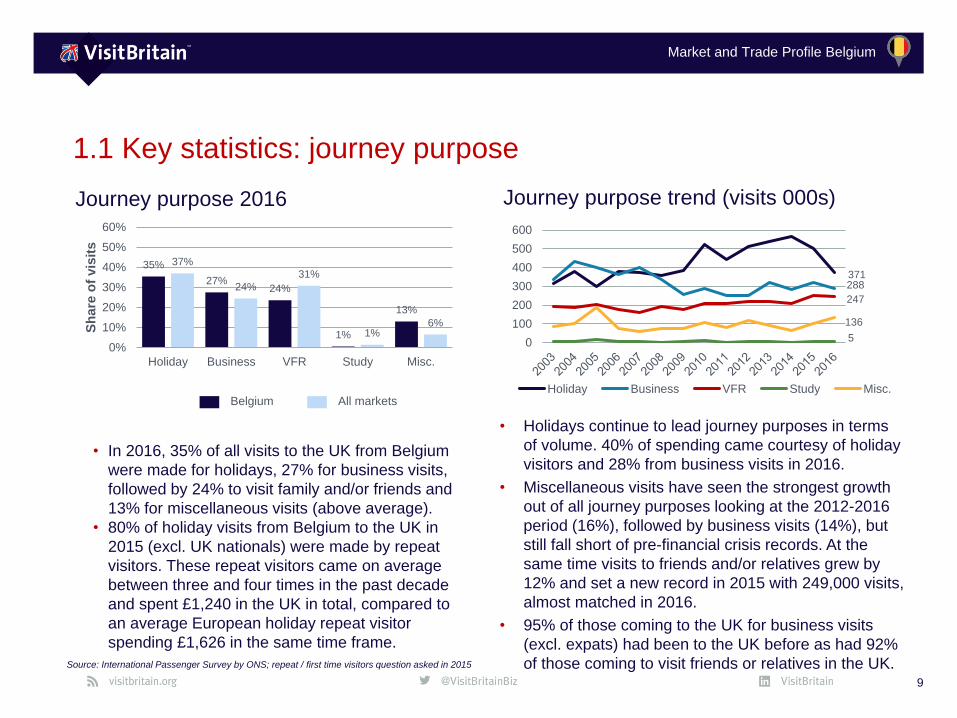
• Holidays continue to lead journey purposes in terms
of volume. 40% of spending came courtesy of holiday
visitors and 28% from business visits in 2016.
• Miscellaneous visits have seen the strongest growth
out of all journey purposes looking at the 2012-2016
period (16%), followed by business visits (14%), but
still fall short of pre-financial crisis records. At the
same time visits to friends and/or relatives grew by
12% and set a new record in 2015 with 249,000 visits,
almost matched in 2016.
• 95% of those coming to the UK for business visits
(excl. expats) had been to the UK before as had 92%
of those coming to visit friends or relatives in the UK.
35%
27%24%
1%
13%
37%
24%
31%
1%6%
0%
10%
20%
30%
40%
50%
60%
Holiday Business VFR Study Misc.
Sh
are
of
vis
its
Journey purpose trend (visits 000s)
• In 2016, 35% of all visits to the UK from Belgium
were made for holidays, 27% for business visits,
followed by 24% to visit family and/or friends and
13% for miscellaneous visits (above average).
• 80% of holiday visits from Belgium to the UK in
2015 (excl. UK nationals) were made by repeat
visitors. These repeat visitors came on average
between three and four times in the past decade
and spent £1,240 in the UK in total, compared to
an average European holiday repeat visitor
spending £1,626 in the same time frame.
371 288
247
5
136
0
100
200
300
400
500
600
Holiday Business VFR Study Misc.Belgium All markets
Market and Trade Profile Belgium
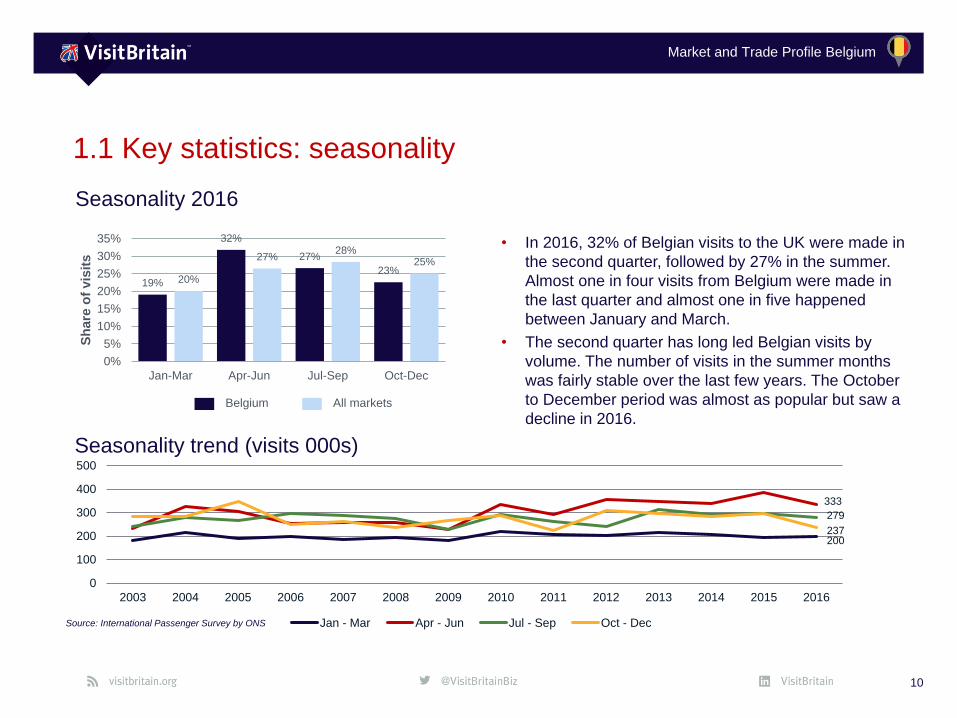
19%
32%
27%
23%20%
27%28%
25%
0%
5%
10%
15%
20%
25%
30%
35%
Jan-Mar Apr-Jun Jul-Sep Oct-Dec
Sh
are
of
vis
its
1.1 Key statistics: seasonality
10
Seasonality 2016
Belgium All markets
Source: International Passenger Survey by ONS
• In 2016, 32% of Belgian visits to the UK were made in
the second quarter, followed by 27% in the summer.
Almost one in four visits from Belgium were made in
the last quarter and almost one in five happened
between January and March.
• The second quarter has long led Belgian visits by
volume. The number of visits in the summer months
was fairly stable over the last few years. The October
to December period was almost as popular but saw a
decline in 2016.
Seasonality trend (visits 000s)
200
333
279
237
0
100
200
300
400
500
2003 2004 2005 2006 2007 2008 2009 2010 2011 2012 2013 2014 2015 2016
Jan - Mar Apr - Jun Jul - Sep Oct - Dec
Market and Trade Profile Belgium
1.1 Key statistics: length of stay and accommodation
11
Source: International Passenger Survey by ONS
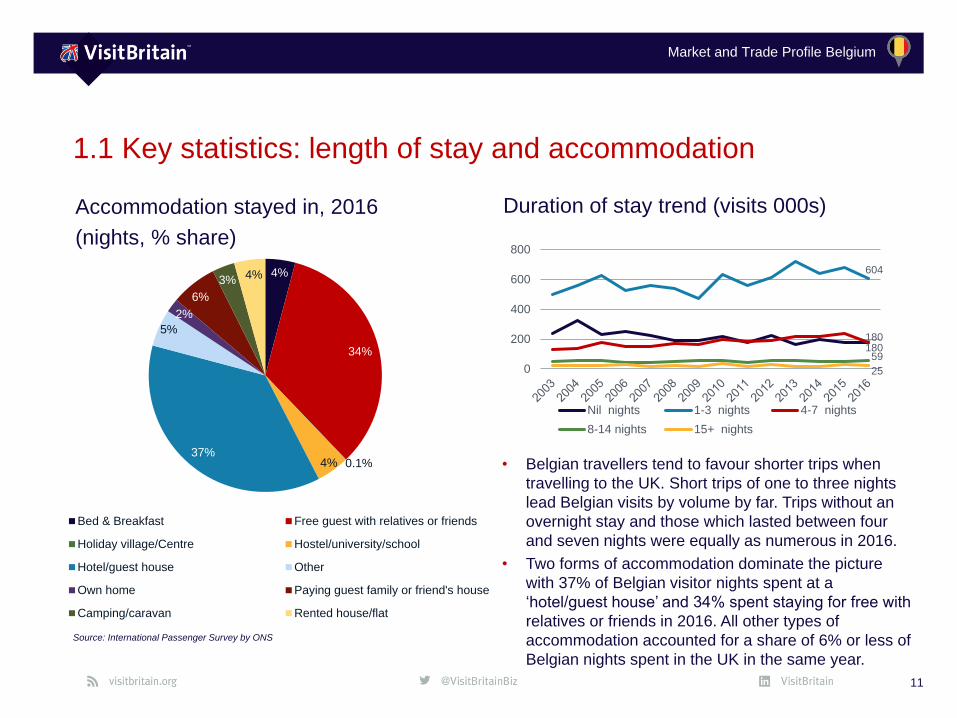
Accommodation stayed in, 2016
(nights, % share)
• Belgian travellers tend to favour shorter trips when
travelling to the UK. Short trips of one to three nights
lead Belgian visits by volume by far. Trips without an
overnight stay and those which lasted between four
and seven nights were equally as numerous in 2016.
• Two forms of accommodation dominate the picture
with 37% of Belgian visitor nights spent at a
‘hotel/guest house’ and 34% spent staying for free with
relatives or friends in 2016. All other types of
accommodation accounted for a share of 6% or less of
Belgian nights spent in the UK in the same year.
Duration of stay trend (visits 000s)
4%
34%
0.1%4%37%
5%
2%
6%
3% 4%
Bed & Breakfast Free guest with relatives or friends
Holiday village/Centre Hostel/university/school
Hotel/guest house Other
Own home Paying guest family or friend's house
Camping/caravan Rented house/flat
180
604
180
59
25 0
200
400
600
800
Nil nights 1-3 nights 4-7 nights
8-14 nights 15+ nights
Market and Trade Profile Belgium
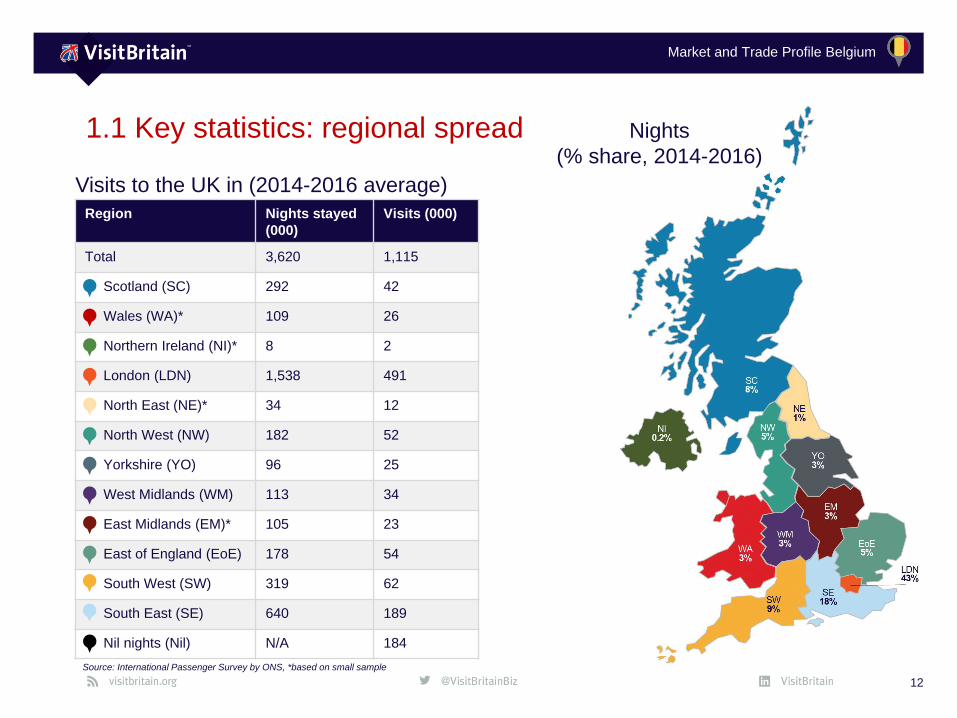
1.1 Key statistics: regional spread
Region Nights stayed
(000)
Visits (000)
Total 3,620 1,115
Scotland (SC) 292 42
Wales (WA)* 109 26
Northern Ireland (NI)* 8 2
London (LDN) 1,538 491
North East (NE)* 34 12
North West (NW) 182 52
Yorkshire (YO) 96 25
West Midlands (WM) 113 34
East Midlands (EM)* 105 23
East of England (EoE) 178 54
South West (SW) 319 62
South East (SE) 640 189
Nil nights (Nil) N/A 184
12
Nights
(% share, 2014-2016)
Source: International Passenger Survey by ONS, *based on small sample
Visits to the UK in (2014-2016 average)
Market and Trade Profile Belgium
1.1 Key statistics: regional spread and top towns and cities
13
Source: International Passenger Survey by ONS, VisitBritain/IPSOS 2016, base: visitors
*indicative due to small base
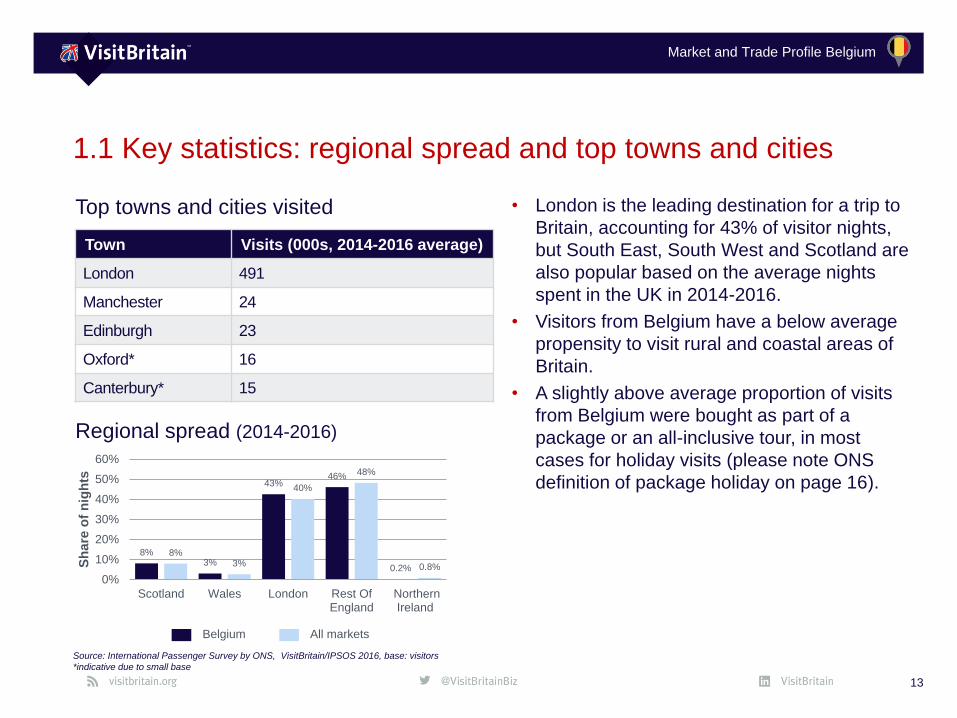
Town Visits (000s, 2014-2016 average)
London 491
Manchester 24
Edinburgh 23
Oxford* 16
Canterbury* 15
Top towns and cities visited • London is the leading destination for a trip to
Britain, accounting for 43% of visitor nights,
but South East, South West and Scotland are
also popular based on the average nights
spent in the UK in 2014-2016.
• Visitors from Belgium have a below average
propensity to visit rural and coastal areas of
Britain.
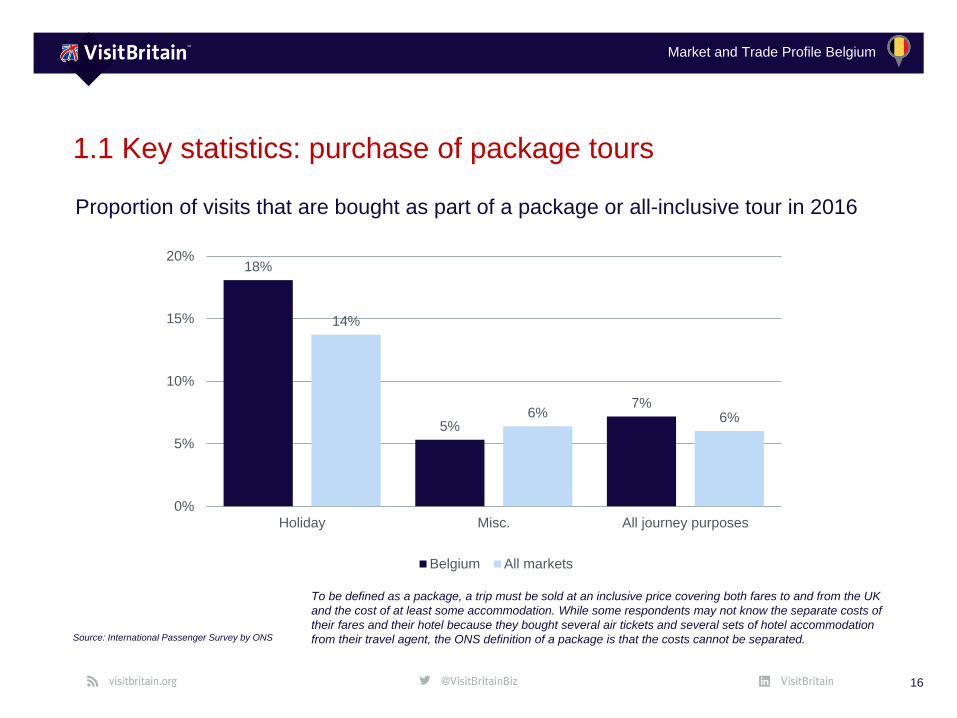
• A slightly above average proportion of visits
from Belgium were bought as part of a
package or an all-inclusive tour, in most
cases for holiday visits (please note ONS
definition of package holiday on page 16).
Regional spread (2014-2016)
8%3%
43%46%
0.2%
8%3%
40%
48%
0.8%
0%
10%
20%
30%
40%
50%
60%
Scotland Wales London Rest OfEngland
NorthernIreland
Sh
are
of
nig
hts
Belgium All markets
Market and Trade Profile Belgium
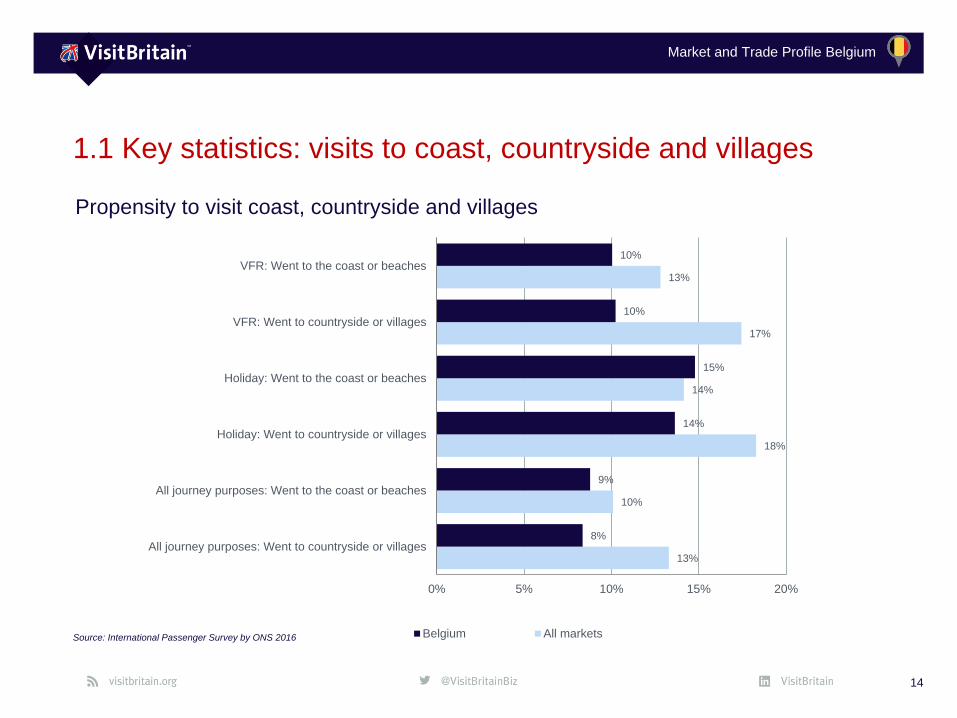
1.1 Key statistics: visits to coast, countryside and villages
14
Source: International Passenger Survey by ONS 2016
13%
10%
18%
14%
17%
13%
8%
9%
14%
15%
10%
10%
0% 5% 10% 15% 20%
All journey purposes: Went to countryside or villages
All journey purposes: Went to the coast or beaches
Holiday: Went to countryside or villages
Holiday: Went to the coast or beaches
VFR: Went to countryside or villages
VFR: Went to the coast or beaches
Belgium All markets
Propensity to visit coast, countryside and villages

Market and Trade Profile Belgium
1.1 Key statistics: use of internal modes of transport
15
Source: International Passenger Survey by ONS, 2013
Propensity to use internal modes of transport
2%
53%
28%
32%
8%
4%
8%
15%
2%
1%
44%
12%
20%
2%
6%
3%
38%
2%
0% 10% 20% 30% 40% 50% 60%
Domestic flight
Bus, Tube, Tram or Metro Train(within town/city)
Train (outside town/city)
Taxi
Public bus/coach (outsidetown/city)
Private coach/minibus (forgroup only)
Hired self-drive car/vehicle
Car/vehicle you/group broughtto the UK
Ferry/boat
Belgium All markets
Market and Trade Profile Belgium
1.1 Key statistics: purchase of package tours
16
Source: International Passenger Survey by ONS
Proportion of visits that are bought as part of a package or all-inclusive tour in 2016
18%
5%
7%
14%
6% 6%
0%
5%
10%
15%
20%
Holiday Misc. All journey purposes
Belgium All markets
To be defined as a package, a trip must be sold at an inclusive price covering both fares to and from the UK
and the cost of at least some accommodation. While some respondents may not know the separate costs of
their fares and their hotel because they bought several air tickets and several sets of hotel accommodation
from their travel agent, the ONS definition of a package is that the costs cannot be separated.
Market and Trade Profile Belgium
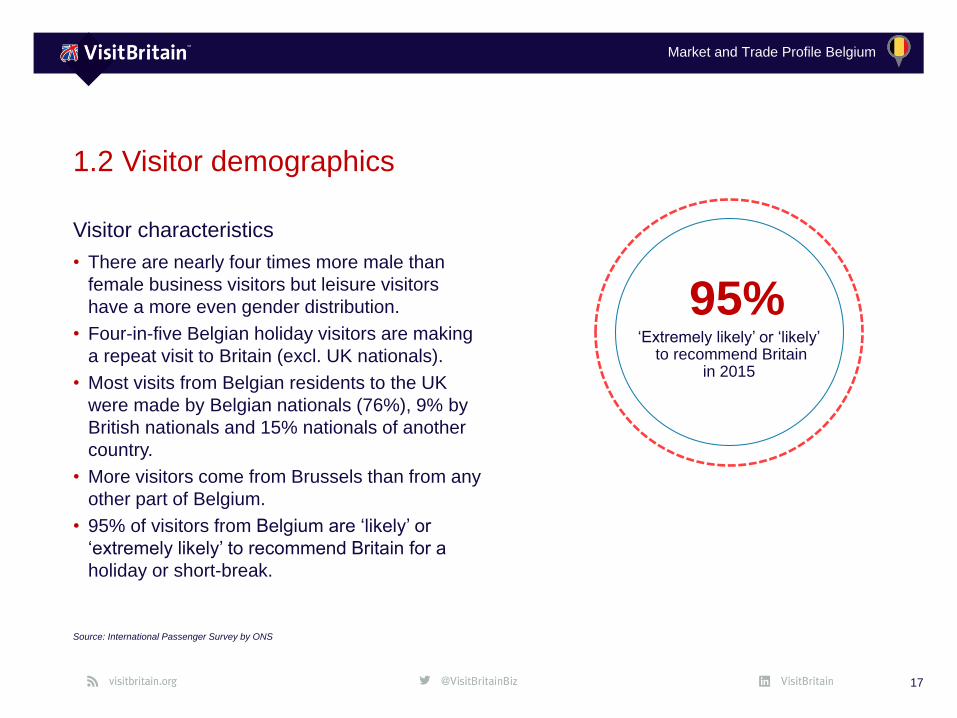
Visitor characteristics
• There are nearly four times more male than
female business visitors but leisure visitors
have a more even gender distribution.
• Four-in-five Belgian holiday visitors are making
a repeat visit to Britain (excl. UK nationals).
• Most visits from Belgian residents to the UK
were made by Belgian nationals (76%), 9% by
British nationals and 15% nationals of another
country.
• More visitors come from Brussels than from any
other part of Belgium.
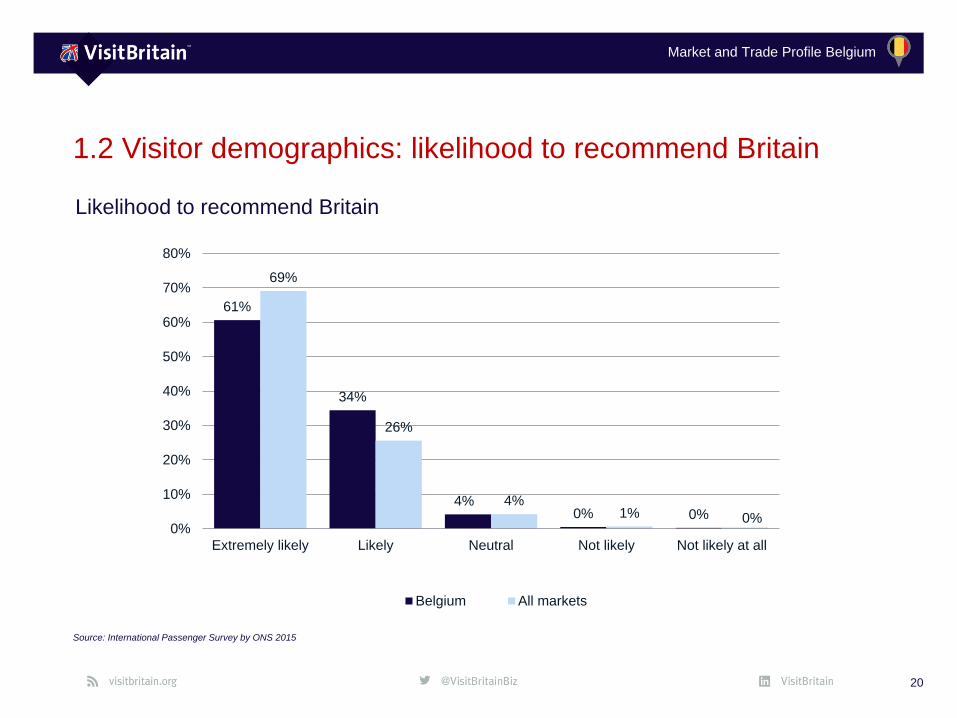
• 95% of visitors from Belgium are ‘likely’ or
‘extremely likely’ to recommend Britain for a
holiday or short-break.
17
1.2 Visitor demographics
Source: International Passenger Survey by ONS
95%‘Extremely likely’ or ‘likely’
to recommend Britainin 2015
Market and Trade Profile Belgium
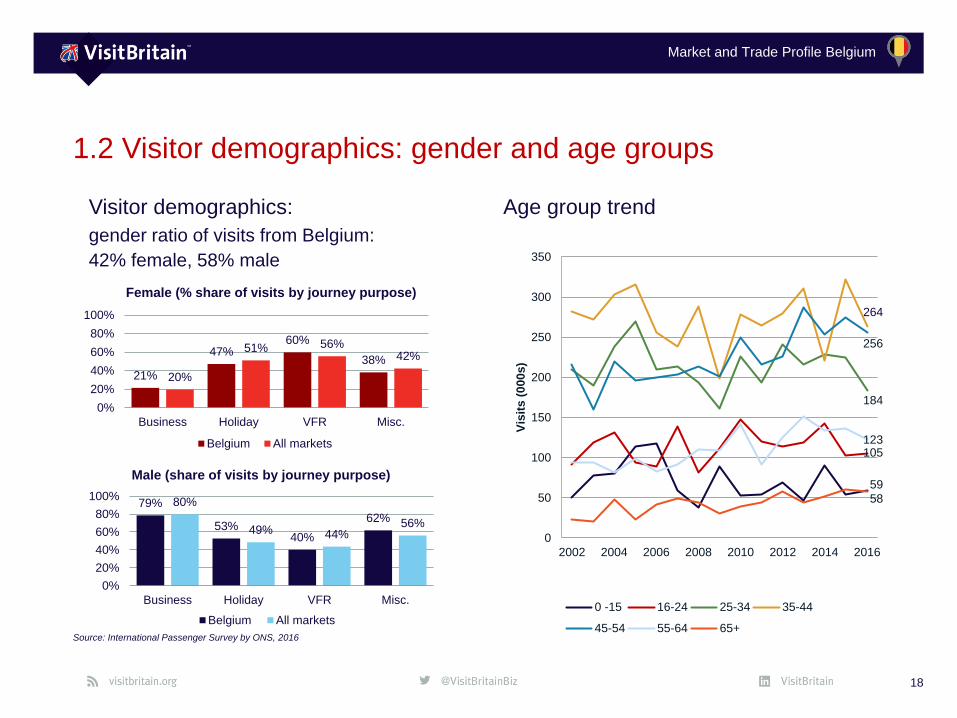
1.2 Visitor demographics: gender and age groups
18
Source: International Passenger Survey by ONS, 2016
Visitor demographics:
gender ratio of visits from Belgium:
42% female, 58% male
Age group trend
21%
47%60%
38%
20%
51% 56%42%
0%
20%
40%
60%
80%
100%
Business Holiday VFR Misc.
Female (% share of visits by journey purpose)
Belgium All markets
79%
53%40%
62%
80%
49% 44%56%
0%
20%
40%
60%
80%
100%
Business Holiday VFR Misc.
Male (share of visits by journey purpose)
Belgium All markets
59
105
184
264
256
123
58
0
50
100
150
200
250
300
350
2002 2004 2006 2008 2010 2012 2014 2016
Vis
its (
000s)
0 -15 16-24 25-34 35-44
45-54 55-64 65+
Market and Trade Profile Belgium
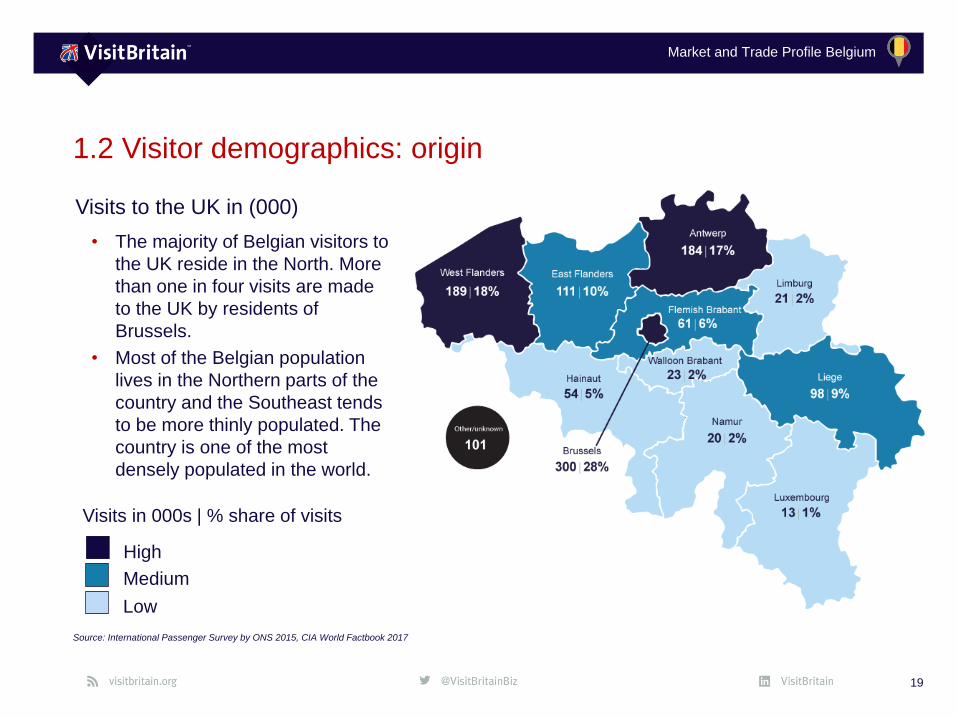
High
Medium
Low
Visits in 000s | % share of visits
19
1.2 Visitor demographics: origin
Source: International Passenger Survey by ONS 2015, CIA World Factbook 2017
Visits to the UK in (000)
• The majority of Belgian visitors to
the UK reside in the North. More
than one in four visits are made
to the UK by residents of
Brussels.
• Most of the Belgian population
lives in the Northern parts of the
country and the Southeast tends
to be more thinly populated. The
country is one of the most
densely populated in the world.
Market and Trade Profile Belgium
1.2 Visitor demographics: likelihood to recommend Britain
20
Source: International Passenger Survey by ONS 2015
Likelihood to recommend Britain
61%
34%
4%0% 0%
69%
26%
4%1% 0%
0%
10%
20%
30%
40%
50%
60%
70%
80%
Extremely likely Likely Neutral Not likely Not likely at all
Belgium All markets
Market and Trade Profile Belgium
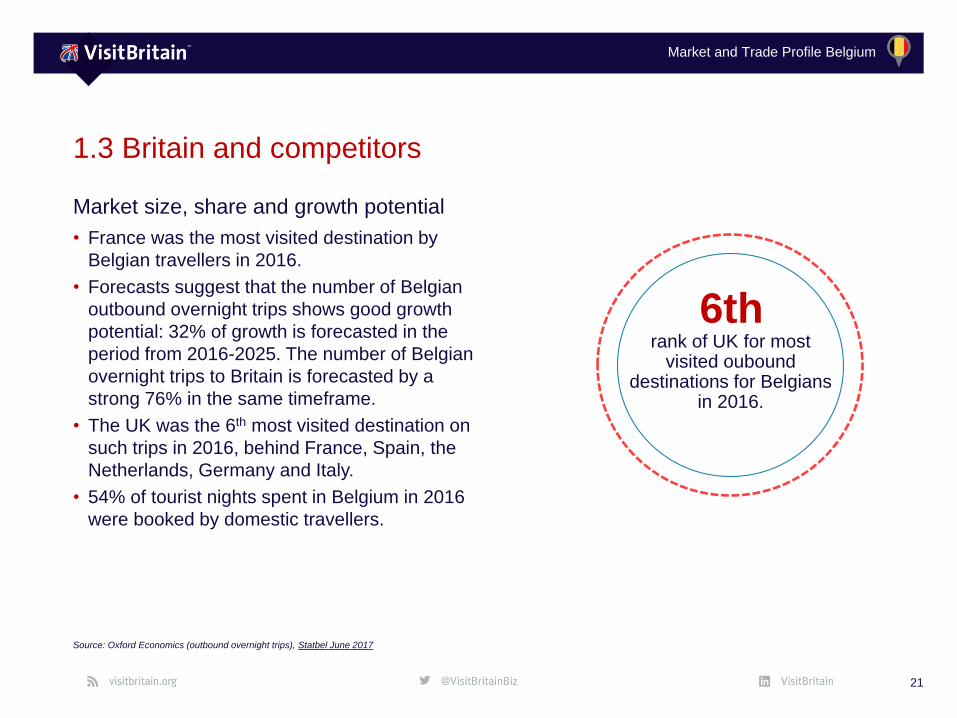
Market size, share and growth potential
• France was the most visited destination by
Belgian travellers in 2016.
• Forecasts suggest that the number of Belgian
outbound overnight trips shows good growth
potential: 32% of growth is forecasted in the
period from 2016-2025. The number of Belgian
overnight trips to Britain is forecasted by a
strong 76% in the same timeframe.
• The UK was the 6th most visited destination on
such trips in 2016, behind France, Spain, the
Netherlands, Germany and Italy.
• 54% of tourist nights spent in Belgium in 2016
were booked by domestic travellers.
21
1.3 Britain and competitors
Source: Oxford Economics (outbound overnight trips), Statbel June 2017
6thrank of UK for most
visited oubound destinations for Belgians
in 2016.
Market and Trade Profile Belgium
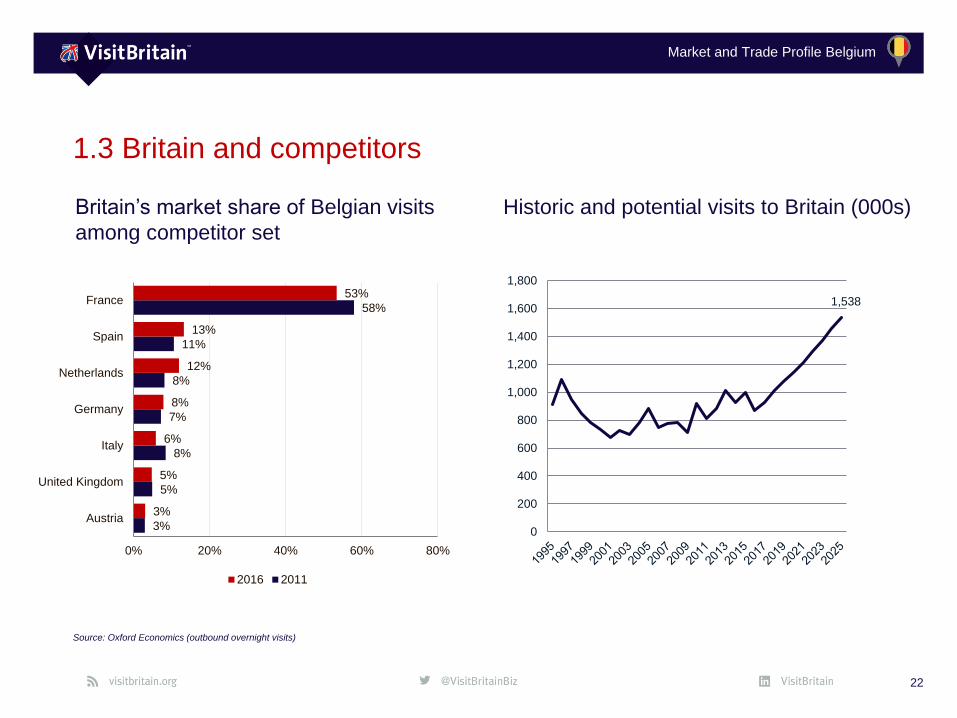
1.3 Britain and competitors
22
Source: Oxford Economics (outbound overnight visits)
Britain’s market share of Belgian visits
among competitor set
Historic and potential visits to Britain (000s)
1,538
0
200
400
600
800
1,000
1,200
1,400
1,600
1,800
3%
5%
8%
7%
8%
11%
58%
3%
5%
6%
8%
12%
13%
53%
0% 20% 40% 60% 80%
Austria
United Kingdom
Italy
Germany
Netherlands
Spain
France
2016 2011
Market and Trade Profile Belgium
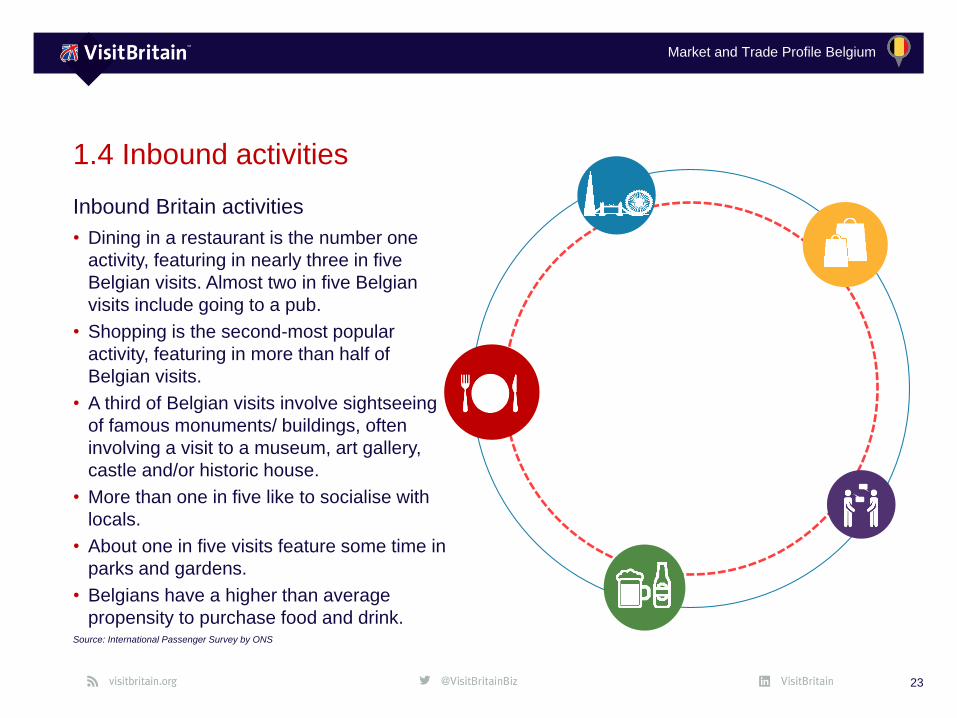
Inbound Britain activities
• Dining in a restaurant is the number one
activity, featuring in nearly three in five
Belgian visits. Almost two in five Belgian
visits include going to a pub.
• Shopping is the second-most popular
activity, featuring in more than half of
Belgian visits.
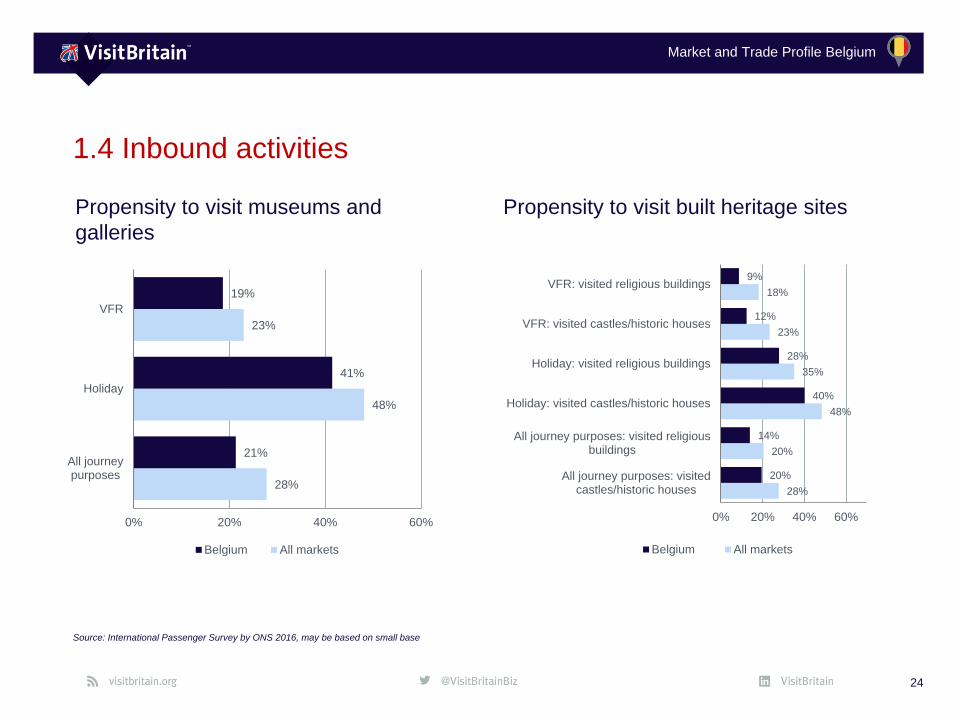
• A third of Belgian visits involve sightseeing
of famous monuments/ buildings, often
involving a visit to a museum, art gallery,
castle and/or historic house.
• More than one in five like to socialise with
locals.
• About one in five visits feature some time in
parks and gardens.
• Belgians have a higher than average
propensity to purchase food and drink.
23
1.4 Inbound activities
Source: International Passenger Survey by ONS
Market and Trade Profile Belgium
1.4 Inbound activities
24
Source: International Passenger Survey by ONS 2016, may be based on small base
Propensity to visit museums and
galleries
Propensity to visit built heritage sites
28%
48%
23%
21%
41%
19%
0% 20% 40% 60%
All journeypurposes
Holiday
VFR
Belgium All markets
28%
20%
48%
35%
23%
18%
20%
14%
40%
28%
12%
9%
0% 20% 40% 60%
All journey purposes: visitedcastles/historic houses
All journey purposes: visited religiousbuildings
Holiday: visited castles/historic houses
Holiday: visited religious buildings
VFR: visited castles/historic houses
VFR: visited religious buildings
Belgium All markets

Market and Trade Profile Belgium
1.4 Inbound activities
25
Source: International Passenger Survey by ONS 2007, 2008, 2011 and 2016
Propensity to attend the performing arts Propensity to go to restaurants, pubs,
night clubs and socialise with locals
14%
2%
8%
9%
12%
3%
6%
6%
0% 10% 20%
Holiday: Went to thetheatre/musical/opera/ballet
Business: Went to thetheatre/musical/opera/ballet
VFR: Went to the theatre/musical/opera/ballet
All journey purposes: Went to thetheatre/musical/opera/ballet
Belgium All markets
45%
34%61%
12%
31%
15%
49%
7%
50%
36%
70%
14%
53%
50%
62%
14%
37%
23%
57%
8%
21%
10%
39%
5%
46%
24%
73%
10%
40%55%
62%
7%
0% 10% 20% 30% 40% 50% 60% 70% 80%
All journey purposes: went to pub
All journey purposes: socialising with the…
All journey purposes: dining in restaurants
All journey purposes: went to bars or night…
Business: went to pub
Business: socialising with the locals
Business: dining in restaurants
Business: went to bars or night clubs
Holiday: went to pub
Holiday: socialising with the locals
Holiday: dining in restaurants
Holiday: went to bars or night clubs
VFR: went to pub
VFR: socialising with the locals
VFR: dining in restaurants
VFR: went to bars or night clubs
Belgium All markets
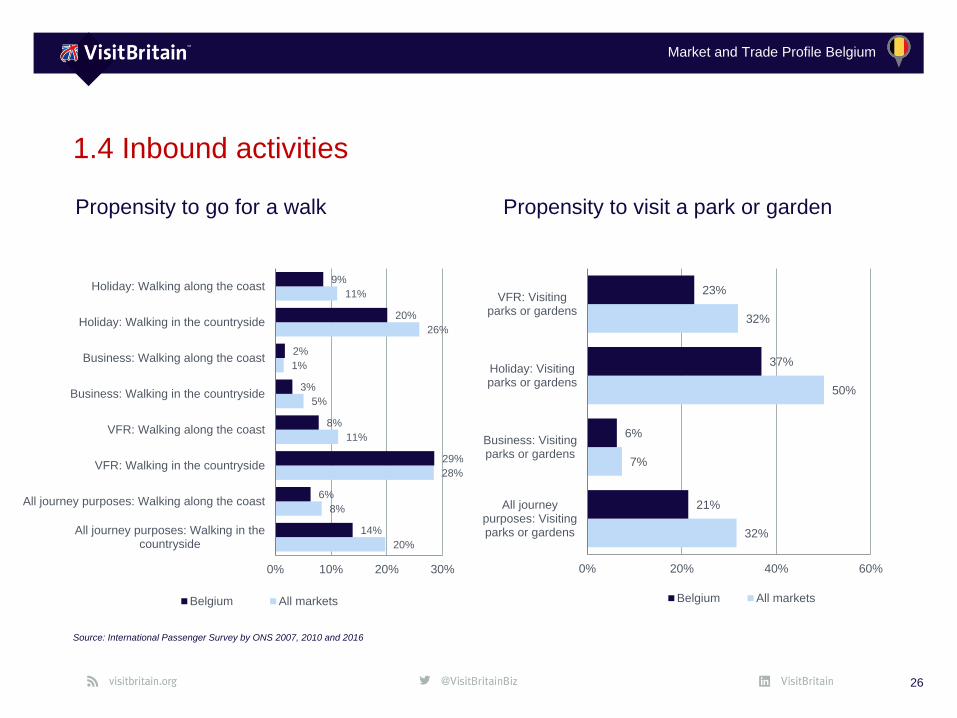
Market and Trade Profile Belgium
1.4 Inbound activities
26
Source: International Passenger Survey by ONS 2007, 2010 and 2016
Propensity to go for a walk Propensity to visit a park or garden
20%
8%
28%
11%
5%
1%
26%
11%
14%
6%
29%
8%
3%
2%
20%
9%
0% 10% 20% 30%
All journey purposes: Walking in thecountryside
All journey purposes: Walking along the coast
VFR: Walking in the countryside
VFR: Walking along the coast
Business: Walking in the countryside
Business: Walking along the coast
Holiday: Walking in the countryside
Holiday: Walking along the coast
Belgium All markets
32%
7%
50%
32%
21%
6%
37%
23%
0% 20% 40% 60%
All journeypurposes: Visitingparks or gardens
Business: Visitingparks or gardens
Holiday: Visitingparks or gardens
VFR: Visitingparks or gardens
Belgium All markets
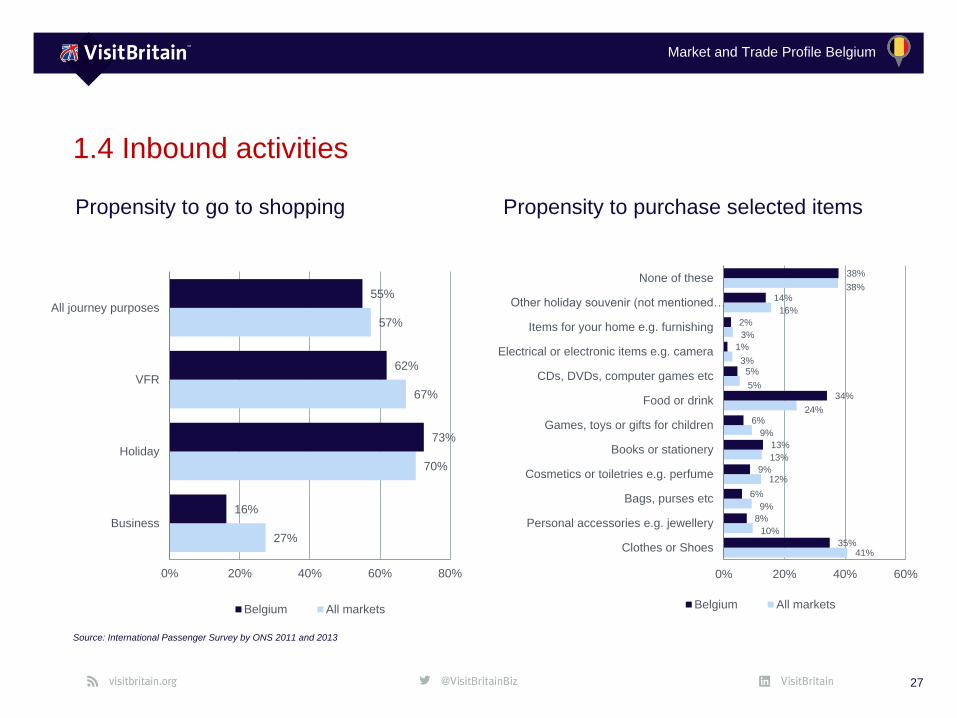
Market and Trade Profile Belgium
1.4 Inbound activities
27
Source: International Passenger Survey by ONS 2011 and 2013
Propensity to go to shopping Propensity to purchase selected items
41%
10%
9%
12%
13%
9%
24%
5%
3%
3%
16%
38%
35%
8%
6%
9%
13%
6%
34%
5%
1%
2%
14%
38%
0% 20% 40% 60%
Clothes or Shoes
Personal accessories e.g. jewellery
Bags, purses etc
Cosmetics or toiletries e.g. perfume
Books or stationery
Games, toys or gifts for children
Food or drink
CDs, DVDs, computer games etc
Electrical or electronic items e.g. camera
Items for your home e.g. furnishing
Other holiday souvenir (not mentioned…
None of these
Belgium All markets
27%
70%
67%
57%
16%
73%
62%
55%
0% 20% 40% 60% 80%
Business
Holiday
VFR
All journey purposes
Belgium All markets
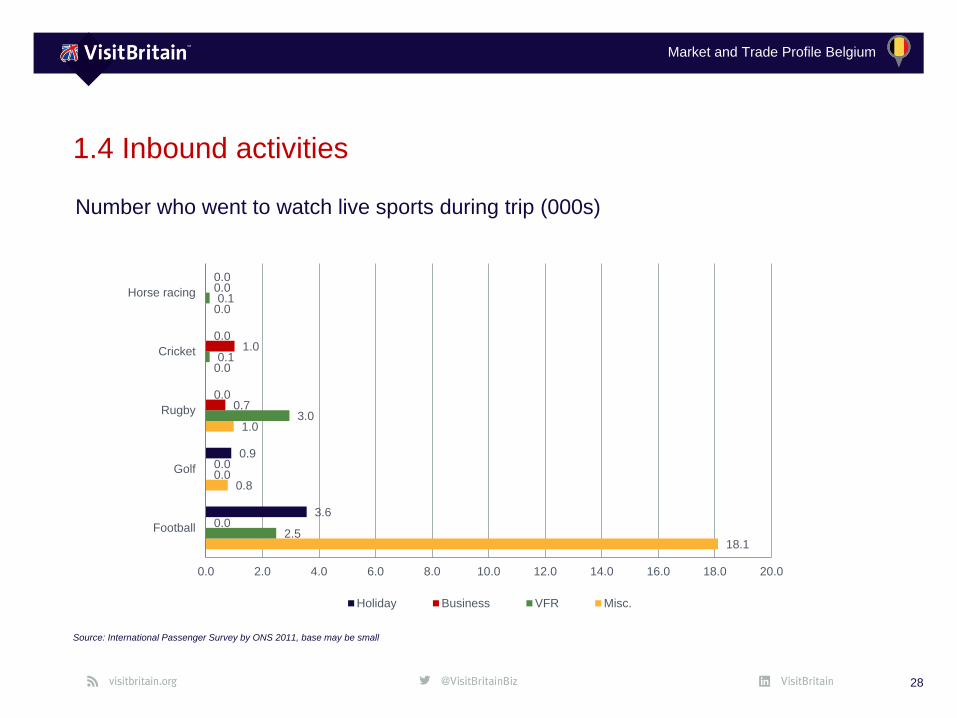
Market and Trade Profile Belgium
1.4 Inbound activities
28
Source: International Passenger Survey by ONS 2011, base may be small
Number who went to watch live sports during trip (000s)
18.1
0.8
1.0
0.0
0.0
2.5
0.0
3.0
0.1
0.1
0.0
0.0
0.7
1.0
0.0
3.6
0.9
0.0
0.0
0.0
0.0 2.0 4.0 6.0 8.0 10.0 12.0 14.0 16.0 18.0 20.0
Football
Golf
Rugby
Cricket
Horse racing
Holiday Business VFR Misc.
Market and Trade Profile Belgium
Understanding
the market
Chapter 2:
29
Market and Trade Profile Belgium
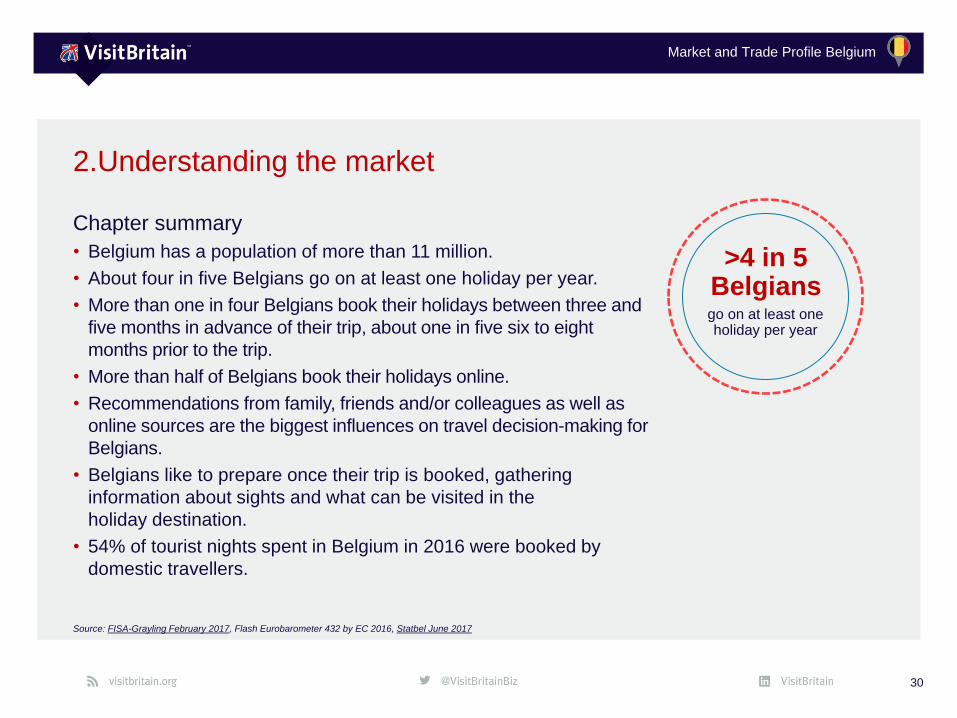
Chapter summary
• Belgium has a population of more than 11 million.
• About four in five Belgians go on at least one holiday per year.
• More than one in four Belgians book their holidays between three and
five months in advance of their trip, about one in five six to eight
months prior to the trip.
• More than half of Belgians book their holidays online.
• Recommendations from family, friends and/or colleagues as well as
online sources are the biggest influences on travel decision-making for
Belgians.
• Belgians like to prepare once their trip is booked, gathering
information about sights and what can be visited in the
holiday destination.
• 54% of tourist nights spent in Belgium in 2016 were booked by
domestic travellers.
30
2.Understanding the market
Source: FISA-Grayling February 2017, Flash Eurobarometer 432 by EC 2016, Statbel June 2017
>4 in 5 Belgiansgo on at least one holiday per year
Market and Trade Profile Belgium
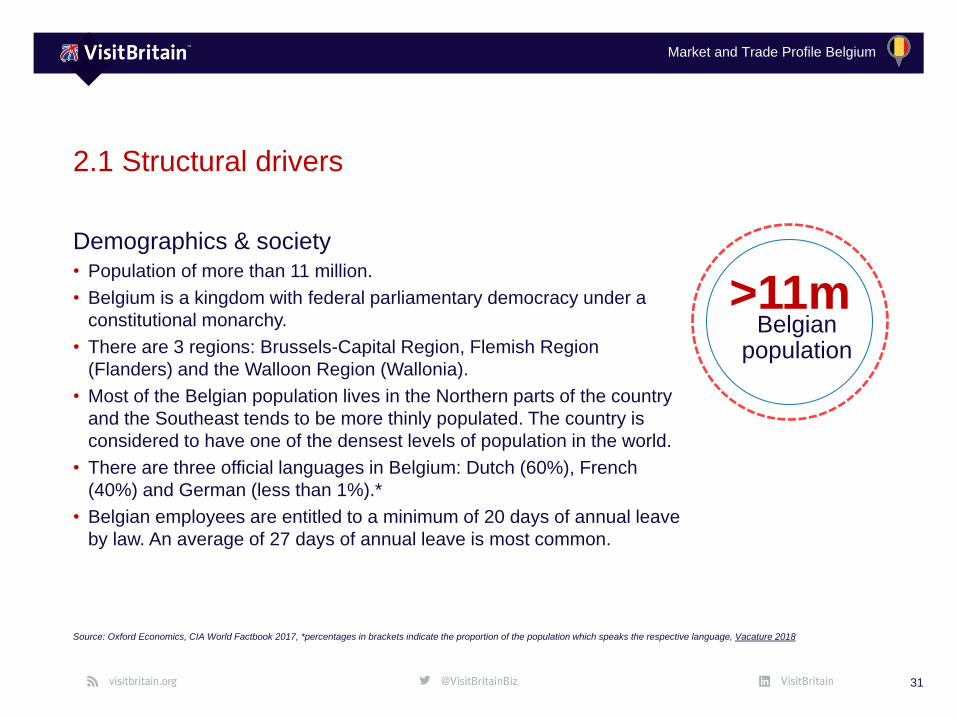
Demographics & society• Population of more than 11 million.
• Belgium is a kingdom with federal parliamentary democracy under a
constitutional monarchy.
• There are 3 regions: Brussels-Capital Region, Flemish Region
(Flanders) and the Walloon Region (Wallonia).
• Most of the Belgian population lives in the Northern parts of the country
and the Southeast tends to be more thinly populated. The country is
considered to have one of the densest levels of population in the world.
• There are three official languages in Belgium: Dutch (60%), French
(40%) and German (less than 1%).*
• Belgian employees are entitled to a minimum of 20 days of annual leave
by law. An average of 27 days of annual leave is most common.
31
2.1 Structural drivers
Source: Oxford Economics, CIA World Factbook 2017, *percentages in brackets indicate the proportion of the population which speaks the respective language, Vacature 2018
>11mBelgian
population
Market and Trade Profile Belgium
2.1 Structural drivers: population and economic indicators
32
Source: Oxford Economics, CIA World Factbook 2017
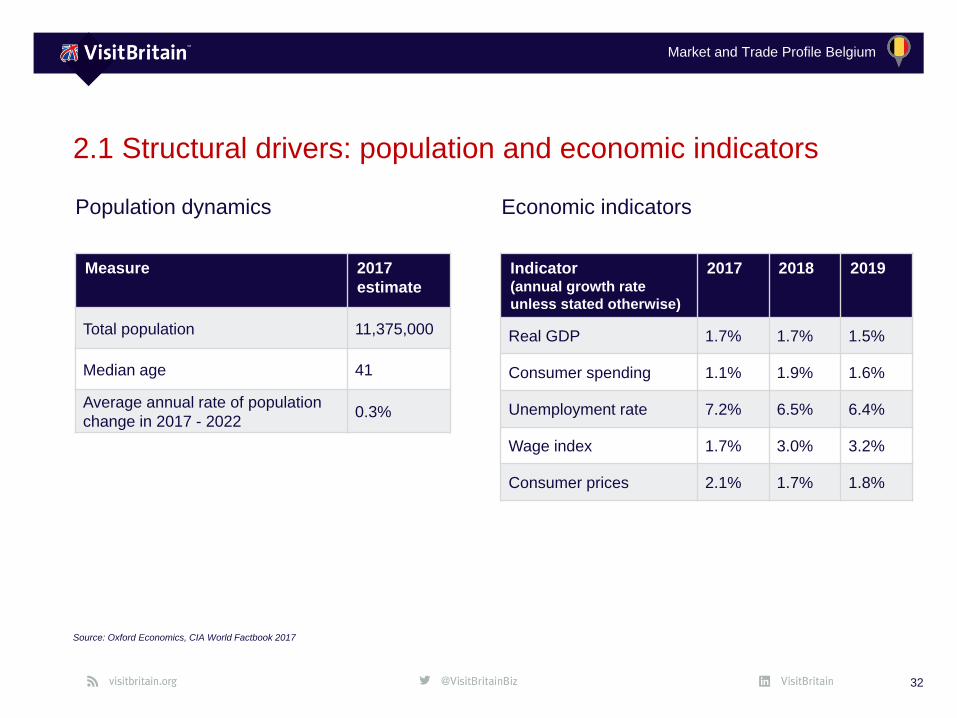
Measure 2017
estimate
Total population 11,375,000
Median age 41
Average annual rate of population
change in 2017 - 20220.3%
Population dynamics
Indicator(annual growth rate
unless stated otherwise)
2017 2018 2019
Real GDP 1.7% 1.7% 1.5%
Consumer spending 1.1% 1.9% 1.6%
Unemployment rate 7.2% 6.5% 6.4%
Wage index 1.7% 3.0% 3.2%
Consumer prices 2.1% 1.7% 1.8%
Economic indicators

Market and Trade Profile Belgium
2.1 Structural drivers: general market overview
33
Source: Oxford Economics, CIA World Factbook 2018
Key demographic and economic data
Measure (2017 data) Belgium Eurozone
Population (m) 11.4 337.7
GDP per capita PPP (US$) 41,455 38,994
Annual average GDP growth
over past decade (%)0.9 0.6
Annual average GDP growth
in 2017 (%)1.7 2.5
General market conditions
• Belgium was Britain’s 9th largest source market in
terms of visits and 19th most valuable for visitor
spending in 2016.
• The Belgian economy is growing with real GDP rising
by 1.7% in 2017, the highest since 2011, and
forecasted to grow by 1.9% in 2018. The labour
market has been improving and consumer and
business confidence bodes well as of late 2017.
(Oxford Economics)
• The country has a population of more than 11 million
which is forecasted to grow. The Belgian median age
is 41.
• Most people in Belgium have a high standard of
education and living. Real GDP per capita in
purchasing power parity terms of just under
US$41,500 which is higher than the Eurozone
average.
Market and Trade Profile Belgium
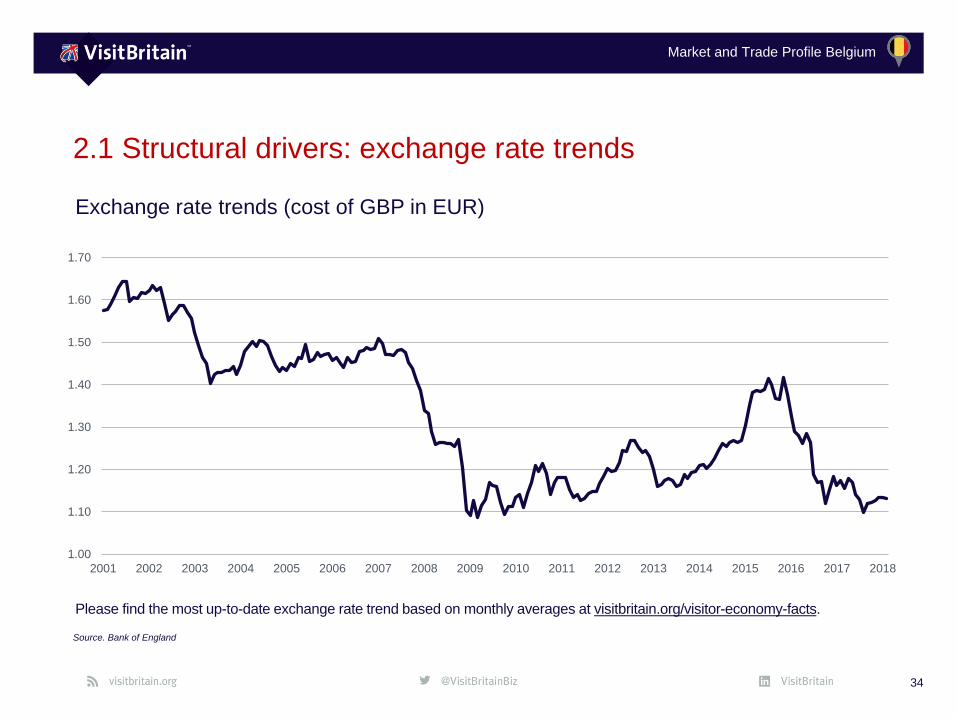
2.1 Structural drivers: exchange rate trends
34
Source. Bank of England
Exchange rate trends (cost of GBP in EUR)
1.00
1.10
1.20
1.30
1.40
1.50
1.60
1.70
2001 2002 2003 2004 2005 2006 2007 2008 2009 2010 2011 2012 2013 2014 2015 2016 2017 2018
Please find the most up-to-date exchange rate trend based on monthly averages at visitbritain.org/visitor-economy-facts.
Market and Trade Profile Belgium
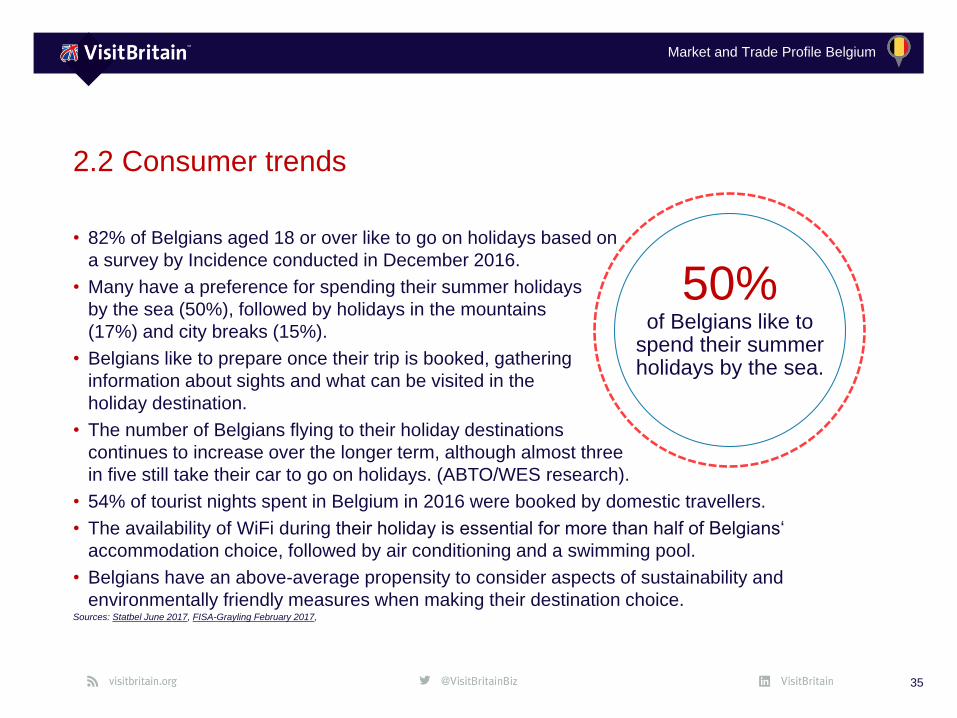
• 82% of Belgians aged 18 or over like to go on holidays based on
a survey by Incidence conducted in December 2016.
• Many have a preference for spending their summer holidays
by the sea (50%), followed by holidays in the mountains
(17%) and city breaks (15%).
• Belgians like to prepare once their trip is booked, gathering
information about sights and what can be visited in the
holiday destination.
• The number of Belgians flying to their holiday destinations
continues to increase over the longer term, although almost three
in five still take their car to go on holidays. (ABTO/WES research).
• 54% of tourist nights spent in Belgium in 2016 were booked by domestic travellers.
• The availability of WiFi during their holiday is essential for more than half of Belgians‘
accommodation choice, followed by air conditioning and a swimming pool.
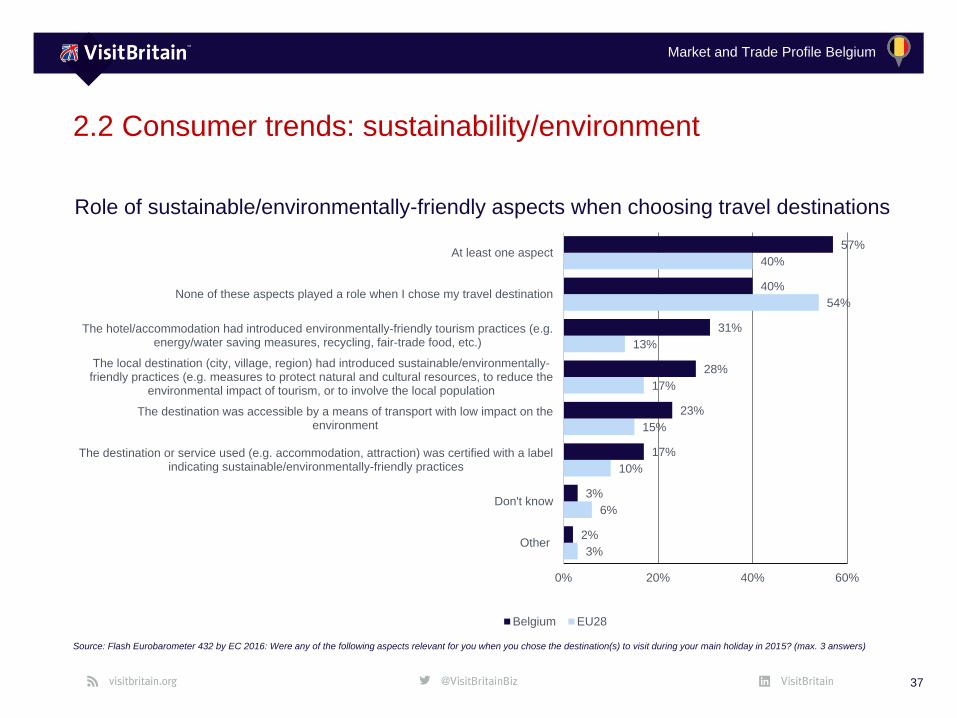
• Belgians have an above-average propensity to consider aspects of sustainability and
environmentally friendly measures when making their destination choice.
35
2.2 Consumer trends
Sources: Statbel June 2017, FISA-Grayling February 2017,
50% of Belgians like to
spend their summer holidays by the sea.
Market and Trade Profile Belgium
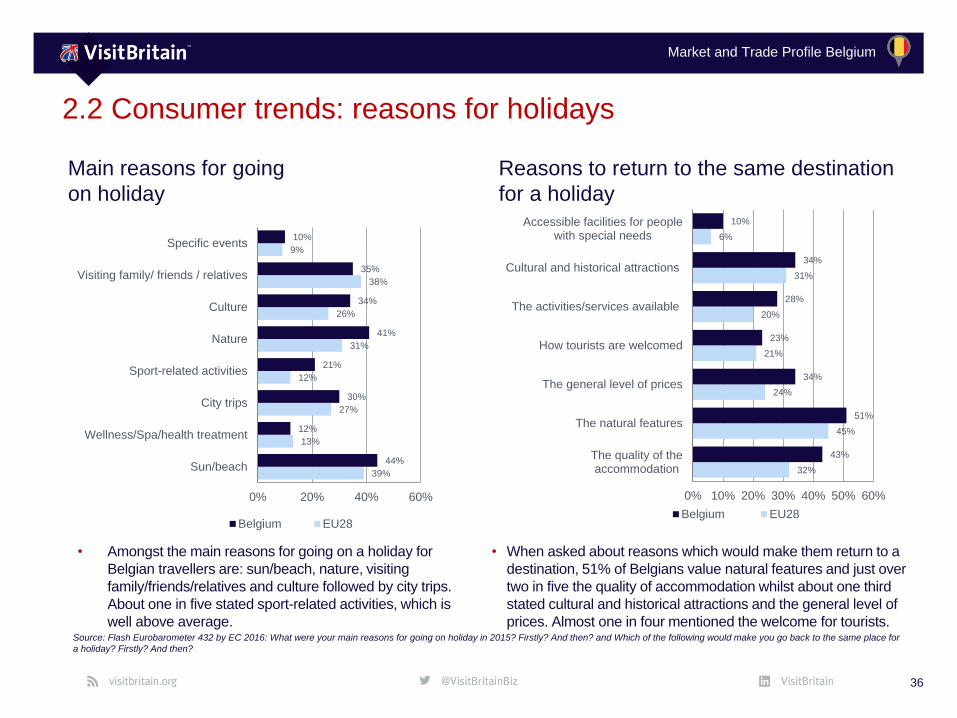
2.2 Consumer trends: reasons for holidays
36
Source: Flash Eurobarometer 432 by EC 2016: What were your main reasons for going on holiday in 2015? Firstly? And then? and Which of the following would make you go back to the same place for
a holiday? Firstly? And then?
Main reasons for going
on holiday
Reasons to return to the same destination
for a holiday
• Amongst the main reasons for going on a holiday for
Belgian travellers are: sun/beach, nature, visiting
family/friends/relatives and culture followed by city trips.
About one in five stated sport-related activities, which is
well above average.
• When asked about reasons which would make them return to a
destination, 51% of Belgians value natural features and just over
two in five the quality of accommodation whilst about one third
stated cultural and historical attractions and the general level of
prices. Almost one in four mentioned the welcome for tourists.
39%
13%
27%
12%
31%
26%
38%
9%
44%
12%
30%
21%
41%
34%
35%
10%
0% 20% 40% 60%
Sun/beach
Wellness/Spa/health treatment
City trips
Sport-related activities
Nature
Culture
Visiting family/ friends / relatives
Specific events
Belgium EU28
32%
45%
24%
21%
20%
31%
6%
43%
51%
34%
23%
28%
34%
10%
0% 10% 20% 30% 40% 50% 60%
The quality of theaccommodation
The natural features
The general level of prices
How tourists are welcomed
The activities/services available
Cultural and historical attractions
Accessible facilities for peoplewith special needs
Belgium EU28
Market and Trade Profile Belgium
3%
6%
10%
15%
17%
13%
54%
40%
2%
3%
17%
23%
28%
31%
40%
57%
0% 20% 40% 60%
Other
Don't know
The destination or service used (e.g. accommodation, attraction) was certified with a labelindicating sustainable/environmentally-friendly practices
The destination was accessible by a means of transport with low impact on theenvironment
The local destination (city, village, region) had introduced sustainable/environmentally-friendly practices (e.g. measures to protect natural and cultural resources, to reduce the
environmental impact of tourism, or to involve the local population
The hotel/accommodation had introduced environmentally-friendly tourism practices (e.g.energy/water saving measures, recycling, fair-trade food, etc.)
None of these aspects played a role when I chose my travel destination
At least one aspect
Belgium EU28
2.2 Consumer trends: sustainability/environment
37
Source: Flash Eurobarometer 432 by EC 2016: Were any of the following aspects relevant for you when you chose the destination(s) to visit during your main holiday in 2015? (max. 3 answers)
Role of sustainable/environmentally-friendly aspects when choosing travel destinations
Market and Trade Profile Belgium
• More than half of Belgians book their holidays
online. Despite the large porportion of online
bookings, two in five Belgians worry about potential
risks when they make their booking on the Internet.
• Whilst the majority of Belgians do not use the
services of a travel agency, those who do were
most likely to do so for the following reasons: if their
destination of choice is less common and/or exotic
and if they were booking a package tour. Almost
half of those Belgians who consult travel agents
value professional advice, more than two in five go
there for the quality of the service and a similar
proportion look for information about destinations for
holiday ideas (often an online booking follows).
• More than one in four Belgians book their holidays
between three and five months in advance and
about one in five six to eight months prior to the trip.
38
2.3 Booking and planning
Source: Flash Eurobarometer 432 by EC 2016: Did you book your holiday in 2015 by any of the following methods? (multiple answers possible), FISA-Grayling February 2017,
More than half of Belgians book their
holidays online
Market and Trade Profile Belgium
2.3 Booking and planning: booking channels
39
Source: Flash Eurobarometer 432 by EC 2016: Did you book your holiday in 2015 by any of the following methods? (multiple answers possible), FISA-Grayling February 2017,
2%
11%
6%
6%
9%
15%
16%
24%
16%
32%
50%
3%
6%
7%
10%
12%
16%
17%
28%
28%
38%
56%
0% 20% 40% 60%
Don't know
I did not need to book anything
Other
Over the counter of a transportation company(airline company, railway company, etc.)
On-site (place of holidays)
Over the phone
Over the counter at a travel agency
Online commercial services listing privatehousing offers from individuals
Through someone you know
Other online commercial services such as touroperators, airline companies, etc.
Total 'Online commercial services'
Belgium EU28
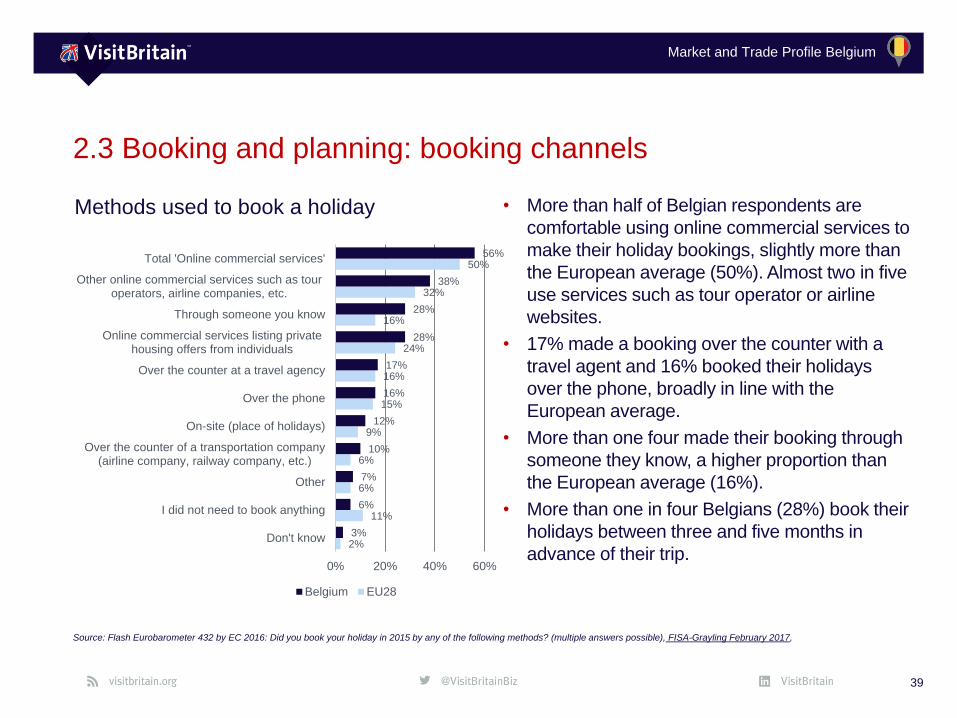
Methods used to book a holiday • More than half of Belgian respondents are
comfortable using online commercial services to
make their holiday bookings, slightly more than
the European average (50%). Almost two in five
use services such as tour operator or airline
websites.
• 17% made a booking over the counter with a
travel agent and 16% booked their holidays
over the phone, broadly in line with the
European average.
• More than one four made their booking through
someone they know, a higher proportion than
the European average (16%).
• More than one in four Belgians (28%) book their
holidays between three and five months in
advance of their trip.
Market and Trade Profile Belgium
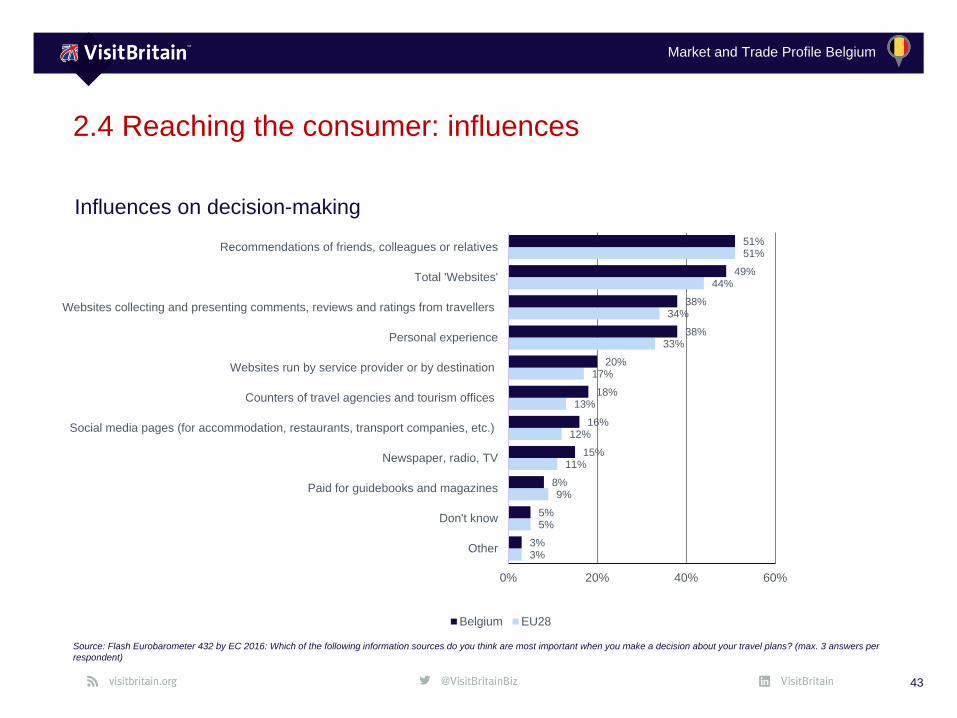
• Recommendations from friends, colleagues or relatives are the
most influential source for travel decision-making, with more
than half of Belgians saying these are important when making
their travel plans, closely followed by websites in general.
Almost two in five state that personal experience is important.
• Less than one in ten use paid guidebooks or magazines,
broadly in line with the European average.
• The use of smartphones to research information and look for
holiday inspiration is becoming increasingly important.
• The importance of social media as a source of information
remains rather limited for the Belgians. For holidays longer than
4 nights, only 6% of Belgians use social media as the most
important source of information. For tour operator holidays this
is 7% and for long trips 14%.
• Belgians devote more time to the so-called traditional media
activities than to those online. On average, Belgians spend
almost 6 hours daily on the combined use of TV, radio, written
press and video games vs. a little over 2 hours spent online.
40
2.4 Reaching the consumer
Source: Flash Eurobarometer 432 by EC 2016 , FISA-Grayling February 2017, Wes & ABTO Feb 2017, Digimedia 2016
Friends, family & colleagues
#1 Influence for the destination choice
of Belgians
Market and Trade Profile Belgium
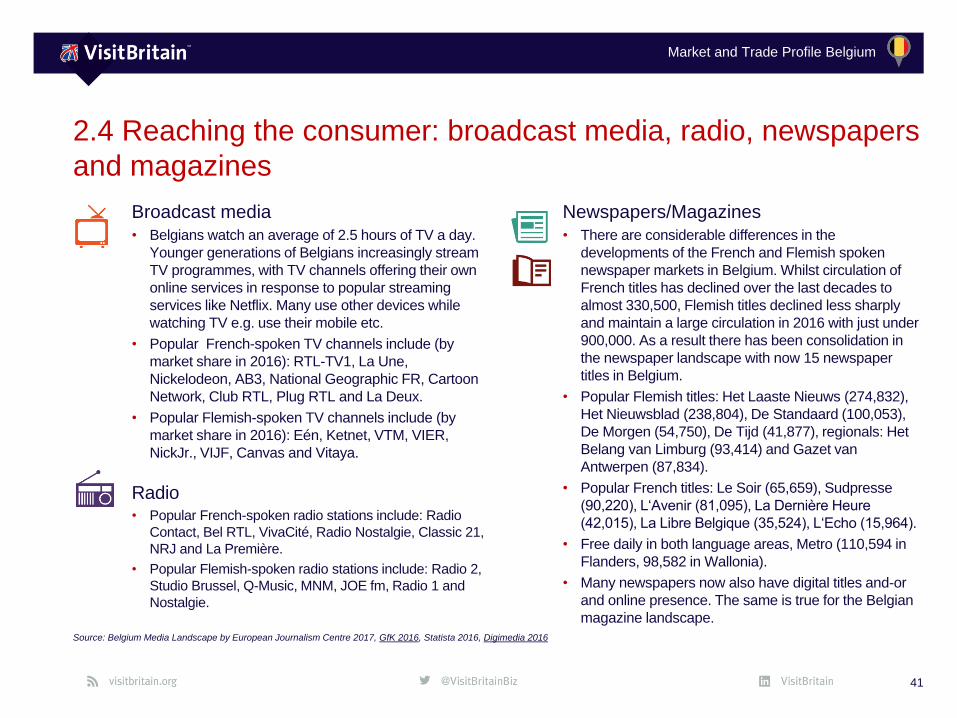
Broadcast media
• Belgians watch an average of 2.5 hours of TV a day.
Younger generations of Belgians increasingly stream
TV programmes, with TV channels offering their own
online services in response to popular streaming
services like Netflix. Many use other devices while
watching TV e.g. use their mobile etc.
• Popular French-spoken TV channels include (by
market share in 2016): RTL-TV1, La Une,
Nickelodeon, AB3, National Geographic FR, Cartoon
Network, Club RTL, Plug RTL and La Deux.
• Popular Flemish-spoken TV channels include (by
market share in 2016): Eén, Ketnet, VTM, VIER,
NickJr., VIJF, Canvas and Vitaya.
Radio• Popular French-spoken radio stations include: Radio
Contact, Bel RTL, VivaCité, Radio Nostalgie, Classic 21,
NRJ and La Première.
• Popular Flemish-spoken radio stations include: Radio 2,
Studio Brussel, Q-Music, MNM, JOE fm, Radio 1 and
Nostalgie.
2.4 Reaching the consumer: broadcast media, radio, newspapers
and magazines
Source: Belgium Media Landscape by European Journalism Centre 2017, GfK 2016, Statista 2016, Digimedia 2016
Newspapers/Magazines
• There are considerable differences in the
developments of the French and Flemish spoken
newspaper markets in Belgium. Whilst circulation of
French titles has declined over the last decades to
almost 330,500, Flemish titles declined less sharply
and maintain a large circulation in 2016 with just under
900,000. As a result there has been consolidation in
the newspaper landscape with now 15 newspaper
titles in Belgium.
• Popular Flemish titles: Het Laaste Nieuws (274,832),
Het Nieuwsblad (238,804), De Standaard (100,053),
De Morgen (54,750), De Tijd (41,877), regionals: Het
Belang van Limburg (93,414) and Gazet van
Antwerpen (87,834).
• Popular French titles: Le Soir (65,659), Sudpresse
(90,220), L‘Avenir (81,095), La Dernière Heure
(42,015), La Libre Belgique (35,524), L‘Echo (15,964).
• Free daily in both language areas, Metro (110,594 in
Flanders, 98,582 in Wallonia).
• Many newspapers now also have digital titles and-or
and online presence. The same is true for the Belgian
magazine landscape.
41
Market and Trade Profile Belgium
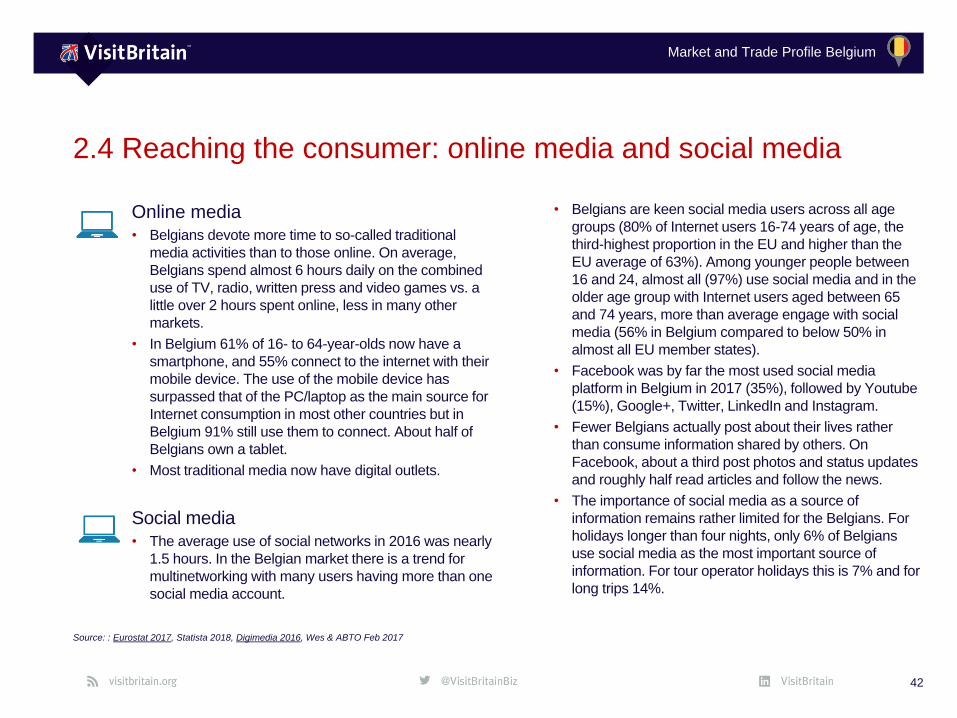
Online media
• Belgians devote more time to so-called traditional
media activities than to those online. On average,
Belgians spend almost 6 hours daily on the combined
use of TV, radio, written press and video games vs. a
little over 2 hours spent online, less in many other
markets.
• In Belgium 61% of 16- to 64-year-olds now have a
smartphone, and 55% connect to the internet with their
mobile device. The use of the mobile device has
surpassed that of the PC/laptop as the main source for
Internet consumption in most other countries but in
Belgium 91% still use them to connect. About half of
Belgians own a tablet.
• Most traditional media now have digital outlets.
Social media
• The average use of social networks in 2016 was nearly
1.5 hours. In the Belgian market there is a trend for
multinetworking with many users having more than one
social media account.
• Belgians are keen social media users across all age
groups (80% of Internet users 16-74 years of age, the
third-highest proportion in the EU and higher than the
EU average of 63%). Among younger people between
16 and 24, almost all (97%) use social media and in the
older age group with Internet users aged between 65
and 74 years, more than average engage with social
media (56% in Belgium compared to below 50% in
almost all EU member states).
• Facebook was by far the most used social media
platform in Belgium in 2017 (35%), followed by Youtube
(15%), Google+, Twitter, LinkedIn and Instagram.
• Fewer Belgians actually post about their lives rather
than consume information shared by others. On
Facebook, about a third post photos and status updates
and roughly half read articles and follow the news.
• The importance of social media as a source of
information remains rather limited for the Belgians. For
holidays longer than four nights, only 6% of Belgians
use social media as the most important source of
information. For tour operator holidays this is 7% and for
long trips 14%.
2.4 Reaching the consumer: online media and social media
Source: : Eurostat 2017, Statista 2018, Digimedia 2016, Wes & ABTO Feb 2017
42
Market and Trade Profile Belgium
3%
5%
9%
11%
12%
13%
17%
33%
34%
44%
51%
3%
5%
8%
15%
16%
18%
20%
38%
38%
49%
51%
0% 20% 40% 60%
Other
Don't know
Paid for guidebooks and magazines
Newspaper, radio, TV
Social media pages (for accommodation, restaurants, transport companies, etc.)
Counters of travel agencies and tourism offices
Websites run by service provider or by destination
Personal experience
Websites collecting and presenting comments, reviews and ratings from travellers
Total 'Websites'
Recommendations of friends, colleagues or relatives
Belgium EU28
2.4 Reaching the consumer: influences
43
Source: Flash Eurobarometer 432 by EC 2016: Which of the following information sources do you think are most important when you make a decision about your travel plans? (max. 3 answers per
respondent)
Influences on decision-making
Market and Trade Profile Belgium
Access and travel
trade
Chapter 3:
44
Market and Trade Profile Belgium
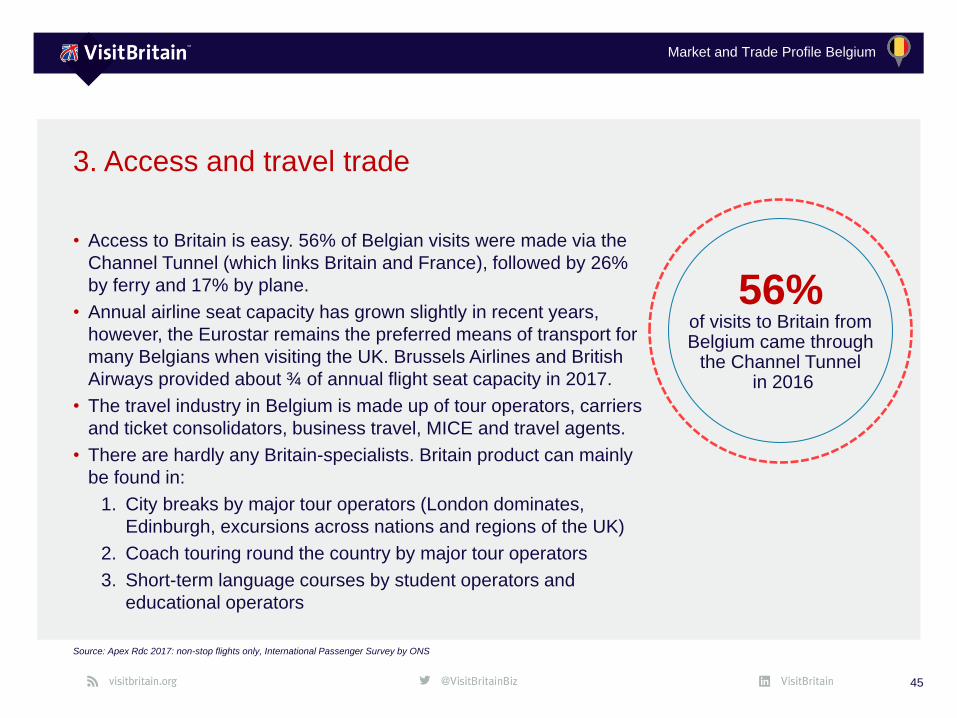
• Access to Britain is easy. 56% of Belgian visits were made via the
Channel Tunnel (which links Britain and France), followed by 26%
by ferry and 17% by plane.
• Annual airline seat capacity has grown slightly in recent years,
however, the Eurostar remains the preferred means of transport for
many Belgians when visiting the UK. Brussels Airlines and British
Airways provided about ¾ of annual flight seat capacity in 2017.
• The travel industry in Belgium is made up of tour operators, carriers
and ticket consolidators, business travel, MICE and travel agents.
• There are hardly any Britain-specialists. Britain product can mainly
be found in:
1. City breaks by major tour operators (London dominates,
Edinburgh, excursions across nations and regions of the UK)
2. Coach touring round the country by major tour operators
3. Short-term language courses by student operators and
educational operators
45
3. Access and travel trade
Source: Apex Rdc 2017: non-stop flights only, International Passenger Survey by ONS
56%of visits to Britain from Belgium came through
the Channel Tunnelin 2016

Market and Trade Profile Belgium
3.1 Access: key facts
• 56% of Belgian visits were made via the
Channel Tunnel (which links Britain and France),
followed by 26% by ferry and 17% by plane.
• A journey on the Eurostar which links Brussels
to London non-stop takes roughly 2 hours and
data from the IPS shows that it is the most
frequently-chosen option for visiting the UK. The
trains run frequently with roughly 10 trains per
day.
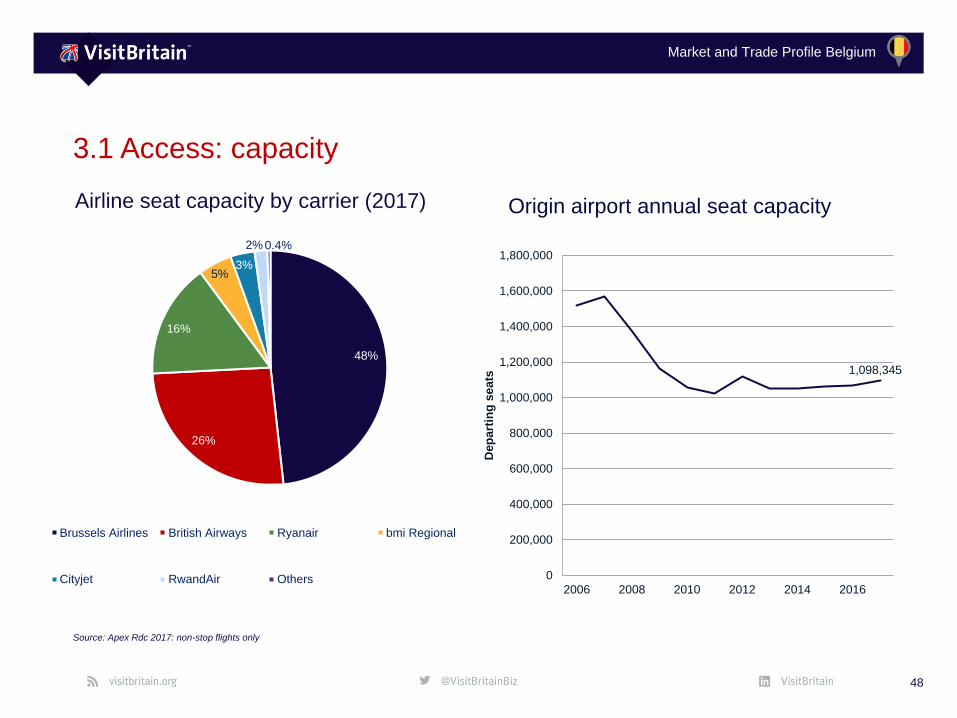
• Flight seat capacity started growing slightly
again in recent years after a sharp decline had
taken place since its peak a decade ago. In
addition to the financial crisis which is likely to
have caused softening demand at that time,
journey times on the Eurostar had been reduced
which could also have contributed to
passengers frequently choosing the Tunnel.
• Belgian visitors departing Britain by air currently
pay £13 in Air Passenger Duty.
46
More than half of
Belgian visits are
made through the
Channel Tunnel.
Source: International Passenger Survey by ONS, Apex RdC 2017: non-stop flights only, Eurostar
“Our history“
Measure 2017
Weekly aircraft departures 185
Weekly aircraft seat capacity 21,122
Airports with direct routes in Belgium 3
Airports with direct routes in Britain 11
Eurostar trains per day from Brussels 10
Weekly ferry crossings 7
Access to Britain

Market and Trade Profile Belgium
3.1 Access: mode of transport
47
Source: International Passenger Survey by ONS
Visits by mode of transport
182
275
591
0100200300400500600700800
Vis
its (
000)
Air Sea Tunnel
17%26%
56%
74%
14% 12%
0%
20%
40%
60%
80%
Air Sea Tunnel
Belgium All markets
Annual share by mode (2016)
162
92
7
13
137
43
387
23
0 100 200 300 400 500
PrivateVehicle
Coach
Foot
Lorry
Vis
its (
000)
Tunnel Sea
Sea and tunnel travel (000s) in 2016
Market and Trade Profile Belgium
3.1 Access: capacity
48
Source: Apex Rdc 2017: non-stop flights only
Airline seat capacity by carrier (2017)
48%
26%
16%
5%3%
2% 0.4%
Brussels Airlines British Airways Ryanair bmi Regional
Cityjet RwandAir Others
Origin airport annual seat capacity
1,098,345
0
200,000
400,000
600,000
800,000
1,000,000
1,200,000
1,400,000
1,600,000
1,800,000
2006 2008 2010 2012 2014 2016
Dep
art
ing
seats
Market and Trade Profile Belgium
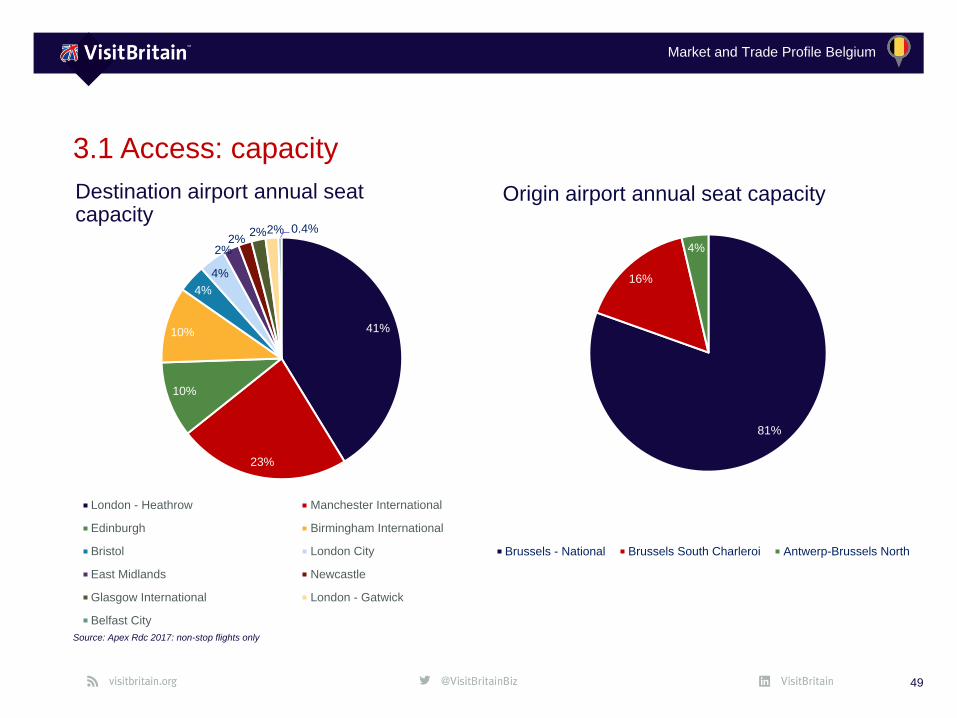
41%
23%
10%
10%
4%
4%
2%2%
2%2% 0.4%
London - Heathrow Manchester International
Edinburgh Birmingham International
Bristol London City
East Midlands Newcastle
Glasgow International London - Gatwick
Belfast City
3.1 Access: capacity
49
Source: Apex Rdc 2017: non-stop flights only
Destination airport annual seat capacity
Origin airport annual seat capacity
81%
16%
4%
Brussels - National Brussels South Charleroi Antwerp-Brussels North
Market and Trade Profile Belgium
• The travel trade in Belgium has mainly consolidated around two
key players: TUI and Thomas Cook. There are some smaller niche
operators and associations such as walking groups, cultural clubs,
schools, universities and evening colleges will organise holidays
for their members. The key centres for the travel trade are
Brussels and Flanders although trade is spread across the country.
• Tour operators (TOs) mostly sell their products through travel
agencies, which continue to be key in Belgian distribution.
Increasingly, tour operators also sell directly to the consumer
through the Internet (although for holidays to Britain the number of
direct sales tends not to be significant). Coach operators usually sell
their coach tours through their own or independent travel agencies.
• The number of group operators is limited in Belgium but they are –
especially the school group operators - very important to Britain and represent a high volume of
visits. These operators tend to split into the youth, seniors and special interest segments.
Belgium has a lot of mid-size travel agents who book directly with UK suppliers for bespoke
luxury travel packages.
• Planning cycle: less relevant to online tour operators, traditional operators with print brochures
often need programmes/rates for winter programmes by March/April and those for the summer
by August/September.
50
3.2 Travel trade: general overview
Belgians value building business
relationships. Personal contact
is crucial.
Market and Trade Profile Belgium
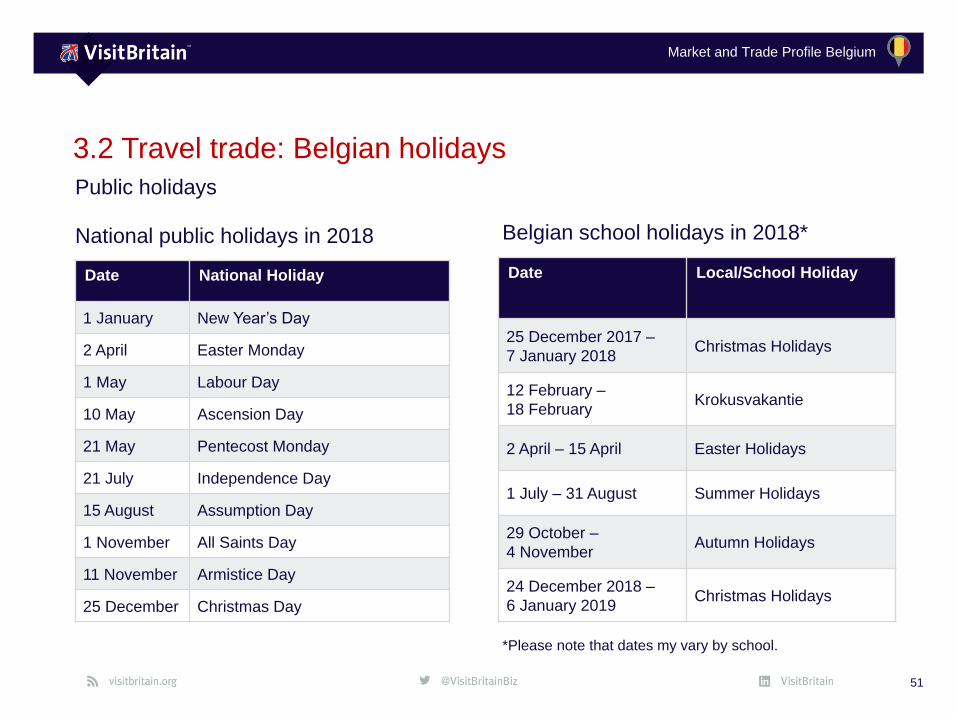
Date Local/School Holiday
25 December 2017 –
7 January 2018Christmas Holidays
12 February –
18 February Krokusvakantie
2 April – 15 April Easter Holidays
1 July – 31 August Summer Holidays
29 October –
4 NovemberAutumn Holidays
24 December 2018 –
6 January 2019Christmas Holidays
3.2 Travel trade: Belgian holidays
51
National public holidays in 2018
Public holidays
Date National Holiday
1 January New Year’s Day
2 April Easter Monday
1 May Labour Day
10 May Ascension Day
21 May Pentecost Monday
21 July Independence Day
15 August Assumption Day
1 November All Saints Day
11 November Armistice Day
25 December Christmas Day
*Please note that dates my vary by school.
Belgian school holidays in 2018*
Market and Trade Profile Belgium
3.2 Travel trade: practical information
General practical information:
• Business hours are usually 09:00 – 17:00 as standard.
• Dress code: Business dress tends to vary by business
from formal to smart casual. Belgians like to dress up in
formal wear for business events and galas.
• Business Meeting Etiquette: Appointments are mandatory
and should be made well in advance. Reconfirm your
appointment about a few days before your visit. Be
punctual as it is important to Belgians. Please call your
contact if you get delayed and offer an explanation.
• Shake hands with everyone present when you arrive and
again on departure. Be careful of using first names as they
are usually reserved for family and close friends. Please
address your contacts using the last name unless invited
to greet them by their first name. If your meeting is in
French, please make sure you address people as “vous”
not “tu” on the first appointment. You should wait until
invited before using someone’s first name and “tu”.
• Follow up quickly on any action points.
• Communication tends to be formal and you should expect
written communication, both to back up decisions and to
maintain a record of decisions and discussions. Following
the established protocol is critical to building and
maintaining business relationships. Once a firm business
relationship has been established it is appropriate to relax
rules and to become more informal.
• Business often is hierarchical and decision-making is held
at the top of the company. Final decisions are translated
into comprehensive action steps.
52
Market and Trade Profile Belgium
3.2 Travel trade: sales calls
Sales calls
Belgian tour operators tend to be spread across Belgium
but due to the relatively small size of the country it is
possible to do more than one visit in a day. VisitBritain
recommends that you take the following steps:
• Most Belgian trade professionals have good command
of English.
• It is still appreciated if you can provide information in
your contact’s language, wherever possible. Make sure
to provide French speakers with French information and
Flemish agents with information in their language.
Please avoid producing literature or documents in
French when talking to a Flemish agent or vice versa
unless explicitely invited to do so. Belgians tend to like
printed material so please provide maps and printed
brochures where possible.
• Online tour operators are not bound to a planning cycle.
Those tour operators who produce print brochures are
best contacted before the summer holidays (March/
April) for winter programmes and programmes/ rates
should be available by August/September for summer
programmes.
• It is best to avoid scheduling in meetings in July and
August, the week before Easter or during the week
between Christmas and New Year.
• Keep in touch with VisitBritain; let us know about your
progress. Regular market intelligence is essential for
our future plans and activities.
• It is also important to note that a significant number of
the key Belgian trade attend the VisitBritain’s ExploreGB
workshop & VisitScotland Expo. Please contact
VisitBritain London for details of those attending. Some
operators also visit World Travel Market and ITB.
53
Source: Gov.uk
Market and Trade Profile Belgium
3.2 Travel trade: practical information
Hospitality etiquette
If there is the opportunity it is definitely a good idea to take
your Belgian business partner out for a meal – either to
build up a relationship or to thank for business given in the
past. Food and drink tend to be very important for
Belgians. They appreciate a good lunch or dinner. Here
are some practical tips to help you plan this:
• Credit cards are usually accepted in all restaurants (only
double check with the small ones) VISA and Mastercard
are most accepted but in some restaurants American
Express cards are not accepted.
• Arrive on time and if possible, before the invite, as
punctuality indicates reliability.
• If you order water you will be asked if you want mineral
still or sparkling; the ‘carafe d’eau’ (tap water in the
French-spoken part) is another common option, but
maybe not for a business invitation.
• Bread is always served and you can order refills any time.
• Some Belgians drink wine with their meals, although not
always at lunch time.
• Service charge and VAT are included in the price,
therefore tipping is limited. Tips are only given if you are
happy with the service provided and rarely more than
€5.
54

Market and Trade Profile Belgium
3.3 Caring for the consumer: French and Dutch language tips
55
Language basics
English French Dutch/Flemish
Please S’il vous plaît Alstublieft
Thank you Merci Dank u wel
Yes Oui Ja
No Non Nee
Sorry! (apology) Désolé(e) ! / Veuillez m’excuser ! Sorry!
Excuse me! Excusez-moi ! / Pardon ! Neem me niet kwalijk
Sorry, I do not speak French/Dutch.Excusez-moi mais je ne parle pas
français.Sorry, ik spreek geen Nederlands.
Market and Trade Profile Belgium
3.3 Caring for the Consumer
56
Caring for the Consumer:
• Belgians tend to highly appreciate good value for
money, often choosing accommodation in the three to
four star range. Many Belgians are keen to hear
about luxury upgrades (e.g. to 5* accommodation) if
available on booking.
• Food is one of the great passions of many Belgians.
Their cooking tends to be highly refined and involves
careful preparation, attention to detail, and the use of
fresh ingredients. It varies by region and is heavily
influenced by locally grown produce.
• Many Belgians tend to have lower than average
perceptions of British food and drink but are often
interested in trying local food and drink whilst visiting.
Enjoying a full English breakfast often is on the list of
things to do in the destination.
• The Belgian people have a tendency to socialise in
their homes and restaurants – their home is usually
reserved to family and friends. An invitation to join
them for a meal is a sincere compliment. Meals are
sociable occasions and they take their time to enjoy
them.
• Breakfast in Belgium often is a light meal of bread,
cereal, yogurt, and coffee or hot chocolate. Lunch
consists of a salad or a sandwich usually followed by
a piece of fruit or yogurt.
• Dinner is generally the main meal of the day: three
courses are common with the first course, a main
dish followed by dessert (often fruit). Bread is
expected to be served throughout the meal. “Bon
appétit” for French speakers or “Smakelijk” for the
Flemish is wished to everyone around the table at the
start of the meal.
• Many Belgians are comfortable with making
payments by credit card.
Source: International Passenger Survey by ONS, Belgian trade feedback
Market and Trade Profile Belgium
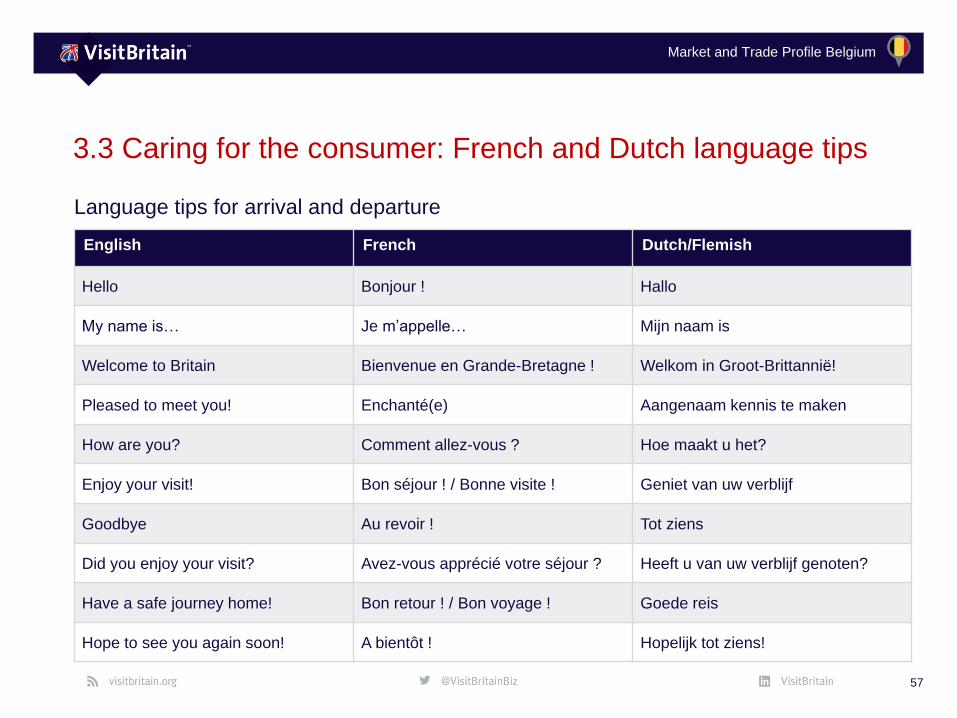
3.3 Caring for the consumer: French and Dutch language tips
57
Language tips for arrival and departure
English French Dutch/Flemish
Hello Bonjour ! Hallo
My name is… Je m’appelle… Mijn naam is
Welcome to Britain Bienvenue en Grande-Bretagne ! Welkom in Groot-Brittannië!
Pleased to meet you! Enchanté(e) Aangenaam kennis te maken
How are you? Comment allez-vous ? Hoe maakt u het?
Enjoy your visit! Bon séjour ! / Bonne visite ! Geniet van uw verblijf
Goodbye Au revoir ! Tot ziens
Did you enjoy your visit? Avez-vous apprécié votre séjour ? Heeft u van uw verblijf genoten?
Have a safe journey home! Bon retour ! / Bon voyage ! Goede reis
Hope to see you again soon! A bientôt ! Hopelijk tot ziens!

Market and Trade Profile Belgium
We can help you extend your reach
through:• Digital and social media such as through
Twitter, our Facebook page – Love GREAT
Britain, or Pinterest.
• Press and PR by sending us your newsworthy
stories or hosting our journalists and broadcast
crew
• Leisure, and the business travel trade via our
programme of sales missions, workshops and
exhibitions or promotion to our qualified
Britagents and supplier directory
• Print advertising in targeted media/Britain
supplements
• Retailing your product through the VisitBritain
shop
• Or as a major campaign partner
58
3.4 Working with VisitBritain
We are here to support you and look
forward to working with you.
To find out more browse our
opportunity search
(visitbritain.org/opportunities)
or trade website
(trade.visitbritain.com)
or contact the B2B events team
(Email: [email protected])
or campaign partnerships team
(Email: [email protected])
or trade support team
(Email: [email protected])
Market and Trade Profile Belgium
We have dedicated research and insights
available which include:
• Latest monthly and quarterly data from the
International Passenger Survey by ONS
(visitbritain.org/latest-monthly-data
visitbritain.org/latest-quarterly-data-uk-overall
visitbritain.org/latest-quarterly-data-area)
• Inbound Tourism Trends by Market
visitbritain.org/inbound-tourism-trends
• Sector-specific research
visitbritain.org/sector-specific-research
• 2017 Inbound Tourism Forecast
visitbritain.org/forecast
• Britain‘s competitiveness
visitbritain.org/britains-competitiveness
59
3.5 Useful research resources
We are here to support you and look
forward to working with you.
To find out more about the Belgian or
other inbound markets browse
our markets & segments pages or
(visitbritain.org/markets-segments)
our inbound research & insights or
(visitbritain.org/inbound-research-insights)
contact us directly
(Email: [email protected])
Market and Trade Profile Belgium
Market and
Trade Profile: Belgium
March 2018