market profile netherlands - visitbritain · market and trade profile netherlands • chapter 1:...
TRANSCRIPT
Market and Trade Profile Netherlands
Market and
Trade Profile: Netherlands
Netherlands
Market and Trade Profile Netherlands
• Chapter 1: Inbound market statistics provides insights on key statistics about
Dutch travellers and who they are. It takes a look at Britain and its competitive
set as well as activities of Dutch visitors in the UK.
• Chapter 2: Understanding the market takes a close look at Dutch consumer
trends, booking, planning and further travel behaviour of this source market.
Perceptions of Britain held by the Dutch are also highlighted.
• Chapter 3: Access and travel trade shows how the Dutch travel to the UK, how
to best cater for their needs and wants during their stay and gives insights into
the Dutch travel trade. Further ways of working with VisitBritain and other useful
research resources are pointed out.
2
Overview
Market and Trade Profile Netherlands
Contents
Chapter 1:
Inbound market statistics
1.1 Key statistics 6
1.2 Visitor demographics 17
1.3 Britain & competitors 21
1.4 Inbound activities 23
Chapter 2:
Understanding the market
2.1 Structural drivers 31
2.2 Consumer trends 35
2.3 Booking and planning 39
2.4 Reaching the consumer 42
2.5 Perceptions of Britain 47
Chapter 3:
Access and travel trade
3.1 Access 52
3.2 Travel Trade 56
3.3 Caring for the consumer 62
3.4 Working with VisitBritain 65
3.5 Useful research resources 66
3
Market and Trade Profile Netherlands
Inbound market
statistics
Chapter 1:
4
Market and Trade Profile Netherlands
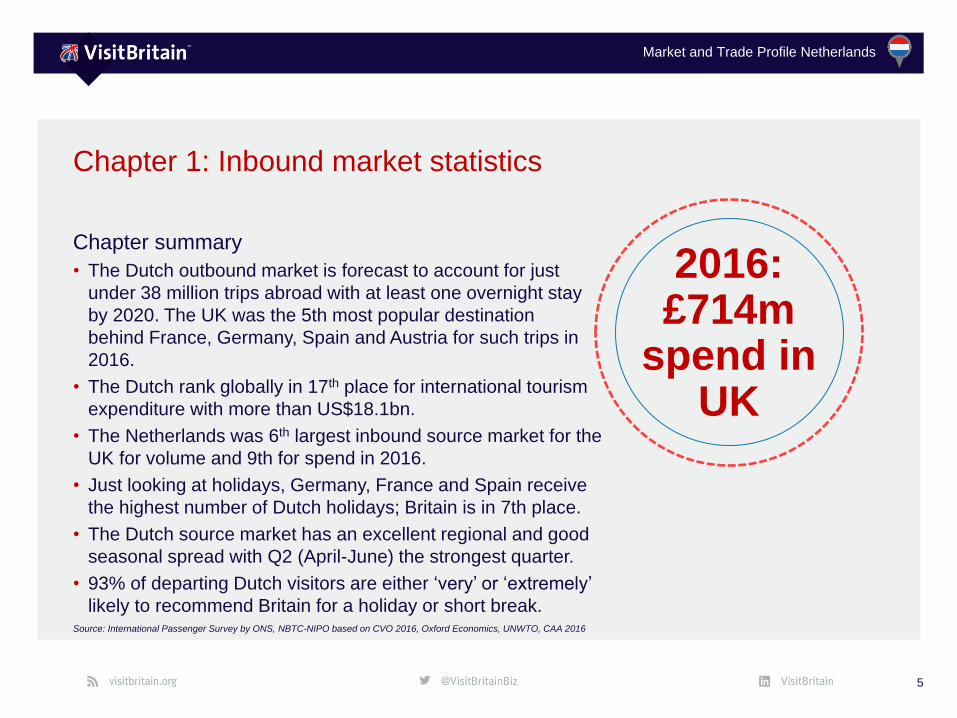
Chapter summary
• The Dutch outbound market is forecast to account for just
under 38 million trips abroad with at least one overnight stay
by 2020. The UK was the 5th most popular destination
behind France, Germany, Spain and Austria for such trips in
2016.
• The Dutch rank globally in 17th place for international tourism
expenditure with more than US$18.1bn.
• The Netherlands was 6th largest inbound source market for the
UK for volume and 9th for spend in 2016.
• Just looking at holidays, Germany, France and Spain receive
the highest number of Dutch holidays; Britain is in 7th place.
• The Dutch source market has an excellent regional and good
seasonal spread with Q2 (April-June) the strongest quarter.
• 93% of departing Dutch visitors are either ‘very’ or ‘extremely’
likely to recommend Britain for a holiday or short break.
5
Chapter 1: Inbound market statistics
Source: International Passenger Survey by ONS, NBTC-NIPO based on CVO 2016, Oxford Economics, UNWTO, CAA 2016
2016:£714m
spend in UK
Market and Trade Profile Netherlands
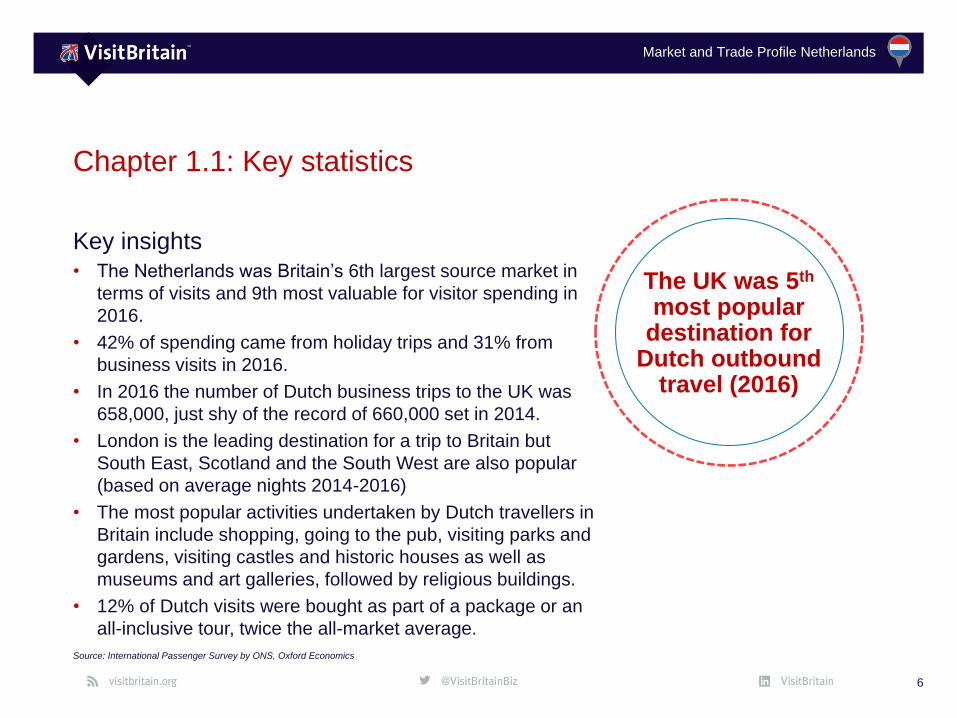
Key insights• The Netherlands was Britain’s 6th largest source market in
terms of visits and 9th most valuable for visitor spending in
2016.
• 42% of spending came from holiday trips and 31% from
business visits in 2016.
• In 2016 the number of Dutch business trips to the UK was
658,000, just shy of the record of 660,000 set in 2014.
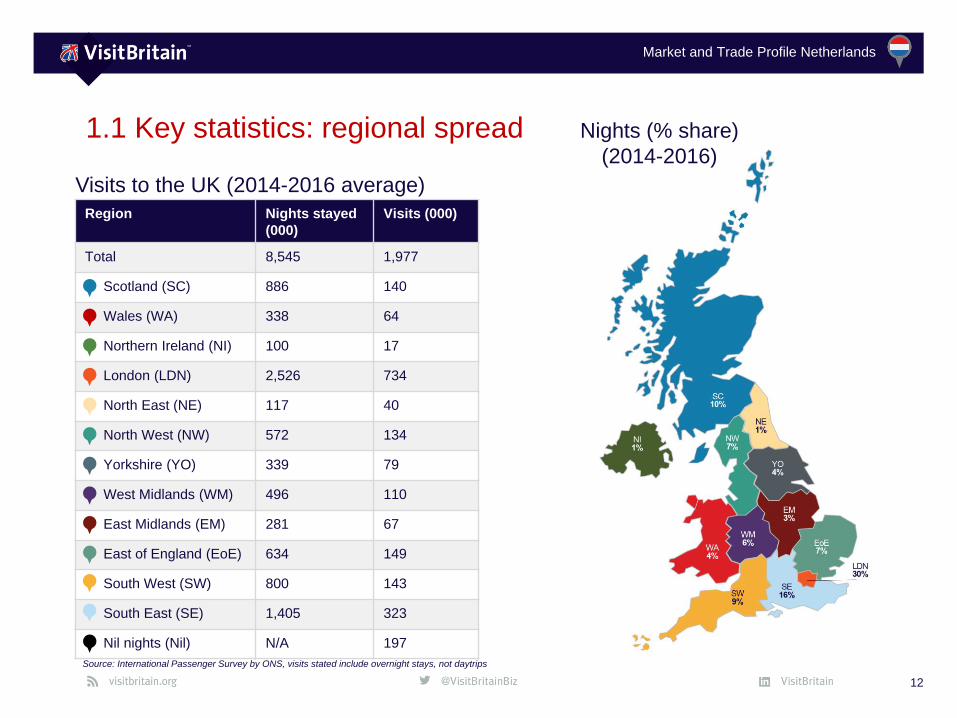
• London is the leading destination for a trip to Britain but
South East, Scotland and the South West are also popular
(based on average nights 2014-2016)
• The most popular activities undertaken by Dutch travellers in
Britain include shopping, going to the pub, visiting parks and
gardens, visiting castles and historic houses as well as
museums and art galleries, followed by religious buildings.
• 12% of Dutch visits were bought as part of a package or an
all-inclusive tour, twice the all-market average.
6
Chapter 1.1: Key statistics
Source: International Passenger Survey by ONS, Oxford Economics
The UK was 5th
most popular destination for
Dutch outbound travel (2016)
Market and Trade Profile Netherlands
1.1 Key statistics: global context and 10 year trend
7
Source: International Passenger Survey by ONS, UNWTO, Oxford Economics
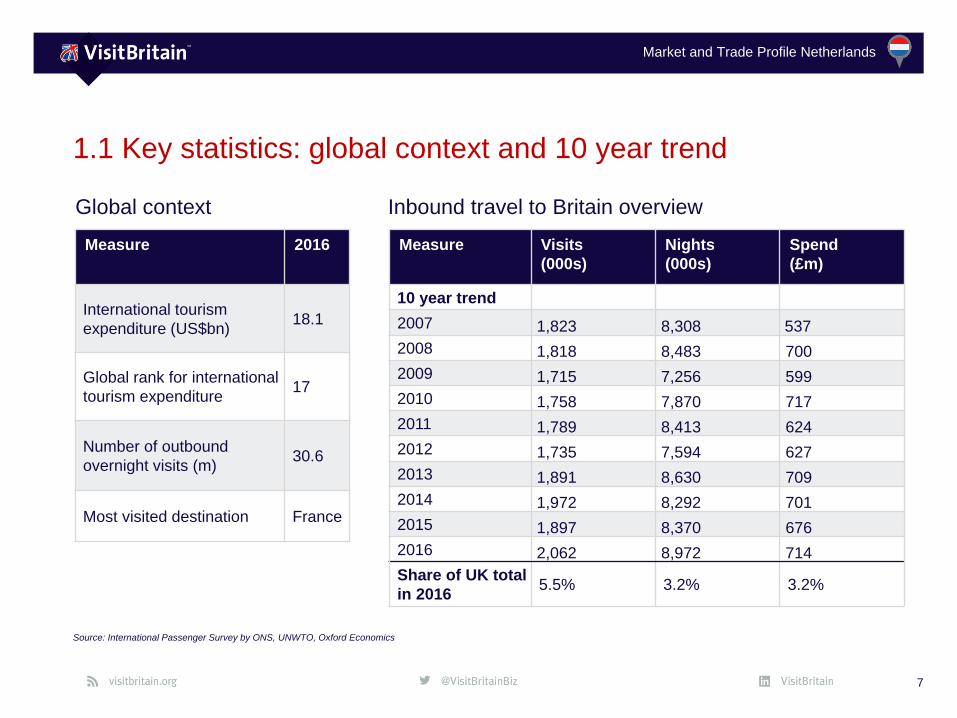
Measure 2016
International tourism
expenditure (US$bn)18.1
Global rank for international
tourism expenditure17
Number of outbound
overnight visits (m)30.6
Most visited destination France
Global context Inbound travel to Britain overview
Measure Visits
(000s)
Nights
(000s)
Spend
(£m)
10 year trend
2007 1,823 8,308 537
2008 1,818 8,483 700
2009 1,715 7,256 599
2010 1,758 7,870 717
2011 1,789 8,413 624
2012 1,735 7,594 627
2013 1,891 8,630 709
2014 1,972 8,292 701
2015 1,897 8,370 676
2016 2,062 8,972 714
Share of UK total
in 20165.5% 3.2% 3.2%
Market and Trade Profile Netherlands
1.1 Key statistics – volume and value
8
Source: International Passenger Survey by ONS
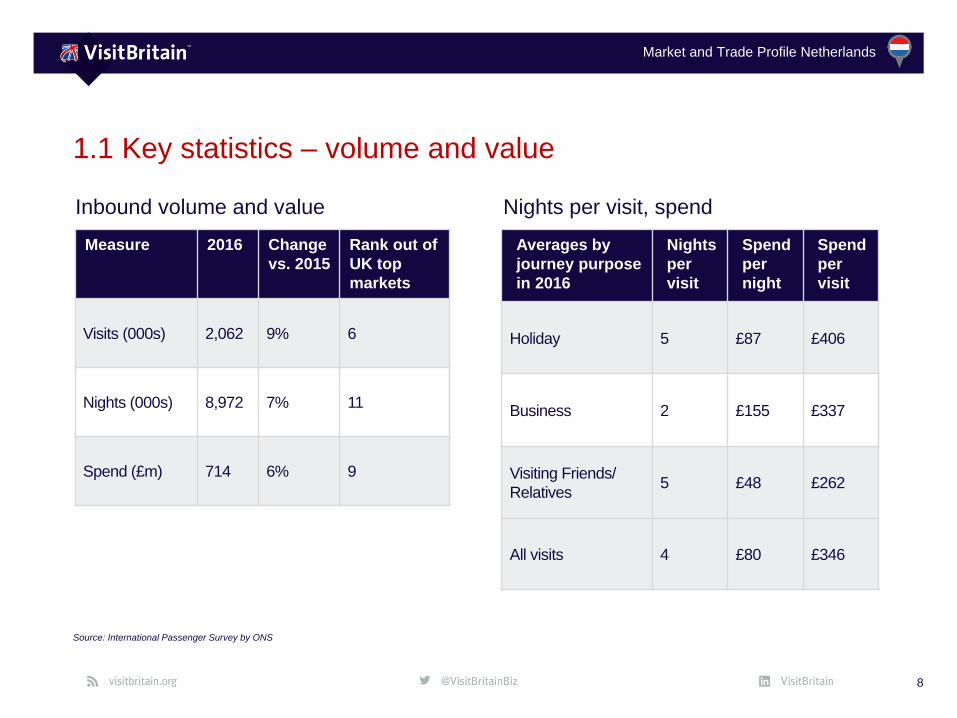
Measure 2016 Change
vs. 2015
Rank out of
UK top
markets
Visits (000s) 2,062 9% 6
Nights (000s) 8,972 7% 11
Spend (£m) 714 6% 9
Inbound volume and value Nights per visit, spend
Averages by
journey purpose
in 2016
Nights
per
visit
Spend
per
night
Spend
per
visit
Holiday 5 £87 £406
Business 2 £155 £337
Visiting Friends/
Relatives5 £48 £262
All visits 4 £80 £346
Market and Trade Profile Netherlands
1.1 Key statistics: journey purpose
9
Journey purpose 2016
Netherlands All markets
Source: International Passenger Survey by ONS; repeat / first time visitors question asked in 2015
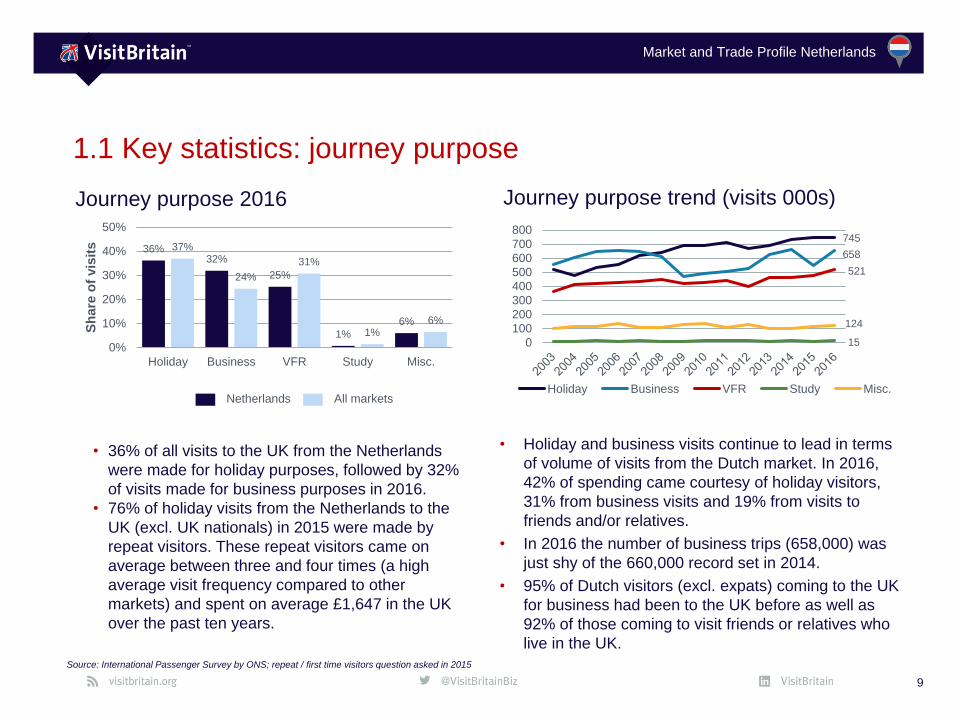
• Holiday and business visits continue to lead in terms
of volume of visits from the Dutch market. In 2016,
42% of spending came courtesy of holiday visitors,
31% from business visits and 19% from visits to
friends and/or relatives.
• In 2016 the number of business trips (658,000) was
just shy of the 660,000 record set in 2014.
• 95% of Dutch visitors (excl. expats) coming to the UK
for business had been to the UK before as well as
92% of those coming to visit friends or relatives who
live in the UK.
36%32%
25%
1%
6%
37%
24%
31%
1%6%
0%
10%
20%
30%
40%
50%
Holiday Business VFR Study Misc.
Sh
are
of
vis
its
Journey purpose trend (visits 000s)
• 36% of all visits to the UK from the Netherlands
were made for holiday purposes, followed by 32%
of visits made for business purposes in 2016.
• 76% of holiday visits from the Netherlands to the
UK (excl. UK nationals) in 2015 were made by
repeat visitors. These repeat visitors came on
average between three and four times (a high
average visit frequency compared to other
markets) and spent on average £1,647 in the UK
over the past ten years.
745
658
521
15
124
0
100
200
300
400
500
600
700
800
Holiday Business VFR Study Misc.
Market and Trade Profile Netherlands
1.1 Key statistics: seasonality
10
Seasonality 2016
Netherlands All markets
Source: International Passenger Survey by ONS
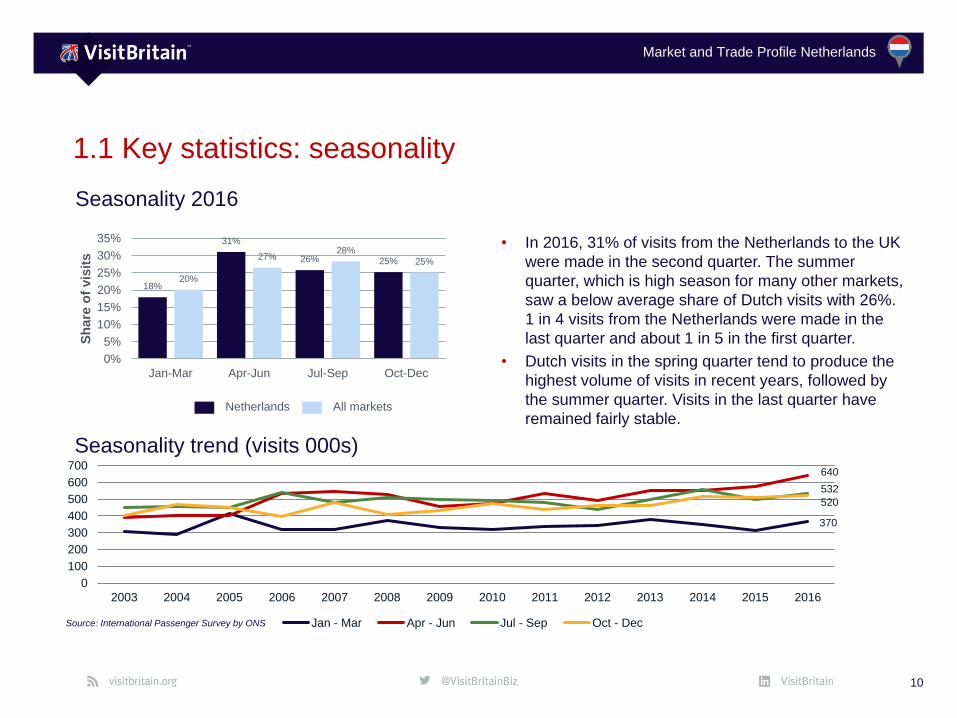
• In 2016, 31% of visits from the Netherlands to the UK
were made in the second quarter. The summer
quarter, which is high season for many other markets,
saw a below average share of Dutch visits with 26%.
1 in 4 visits from the Netherlands were made in the
last quarter and about 1 in 5 in the first quarter.
• Dutch visits in the spring quarter tend to produce the
highest volume of visits in recent years, followed by
the summer quarter. Visits in the last quarter have
remained fairly stable.
18%
31%
26% 25%
20%
27%28%
25%
0%
5%
10%
15%
20%
25%
30%
35%
Jan-Mar Apr-Jun Jul-Sep Oct-Dec
Sh
are
of
vis
its
Seasonality trend (visits 000s)
370
640
532
520
0
100
200
300
400
500
600
700
2003 2004 2005 2006 2007 2008 2009 2010 2011 2012 2013 2014 2015 2016
Jan - Mar Apr - Jun Jul - Sep Oct - Dec
Market and Trade Profile Netherlands
1.1 Key statistics: length of stay and accommodation
11
Source: International Passenger Survey by ONS
Accommodation stayed in, 2016
(nights, %share)
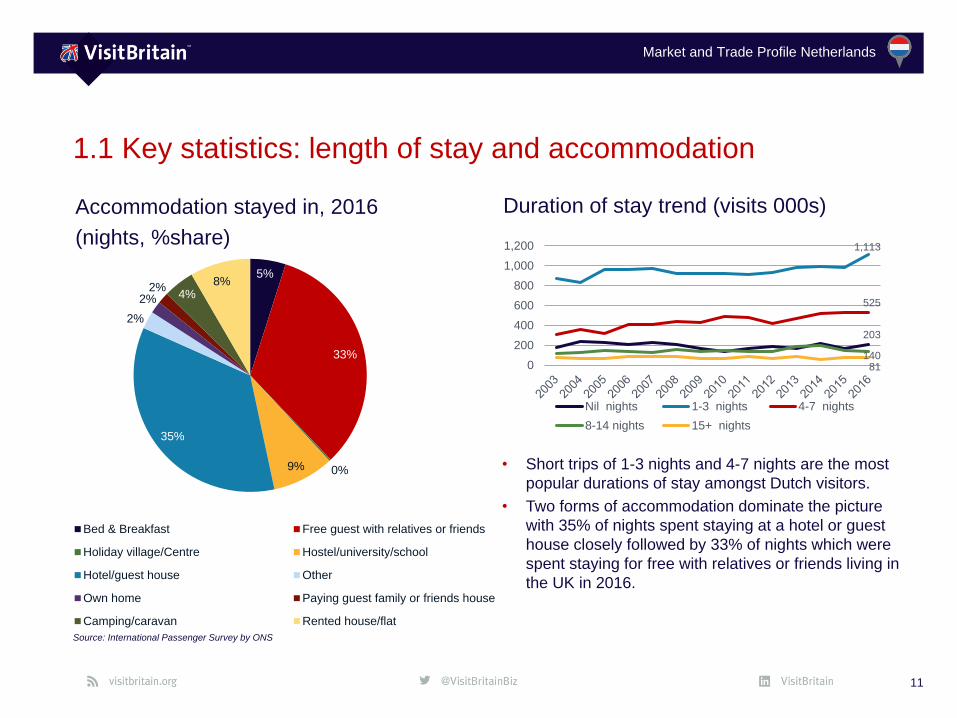
• Short trips of 1-3 nights and 4-7 nights are the most
popular durations of stay amongst Dutch visitors.
• Two forms of accommodation dominate the picture
with 35% of nights spent staying at a hotel or guest
house closely followed by 33% of nights which were
spent staying for free with relatives or friends living in
the UK in 2016.
Duration of stay trend (visits 000s)
5%
33%
0%9%
35%
2%
2%2%
4%8%
Bed & Breakfast Free guest with relatives or friends
Holiday village/Centre Hostel/university/school
Hotel/guest house Other
Own home Paying guest family or friends house
Camping/caravan Rented house/flat
203
1,113
525
140 81 0
200
400
600
800
1,000
1,200
Nil nights 1-3 nights 4-7 nights
8-14 nights 15+ nights
Market and Trade Profile Netherlands
1.1 Key statistics: regional spread
Region Nights stayed
(000)
Visits (000)
Total 8,545 1,977
Scotland (SC) 886 140
Wales (WA) 338 64
Northern Ireland (NI) 100 17
London (LDN) 2,526 734
North East (NE) 117 40
North West (NW) 572 134
Yorkshire (YO) 339 79
West Midlands (WM) 496 110
East Midlands (EM) 281 67
East of England (EoE) 634 149
South West (SW) 800 143
South East (SE) 1,405 323
Nil nights (Nil) N/A 197
12
Nights (% share)
(2014-2016)
Source: International Passenger Survey by ONS, visits stated include overnight stays, not daytrips
Visits to the UK (2014-2016 average)
Market and Trade Profile Netherlands
1.1 Key statistics: regional spread and top towns and cities
13
Source: International Passenger Survey by ONS, VisitBritain/IPSOS 2016, base: visitors
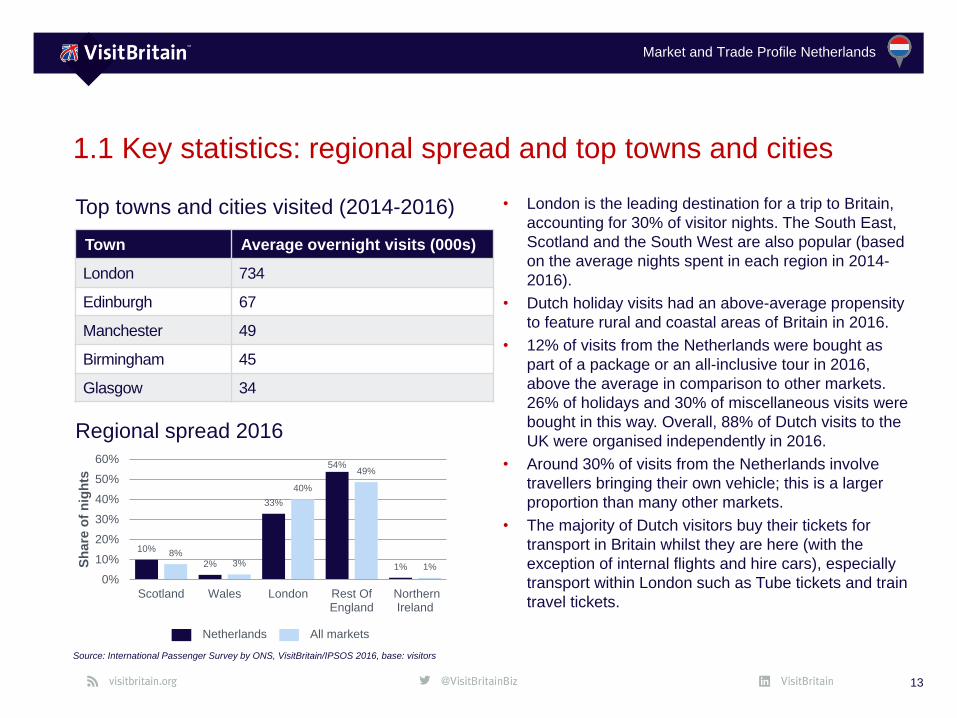
Town Average overnight visits (000s)
London 734
Edinburgh 67
Manchester 49
Birmingham 45
Glasgow 34
Top towns and cities visited (2014-2016) • London is the leading destination for a trip to Britain,
accounting for 30% of visitor nights. The South East,
Scotland and the South West are also popular (based
on the average nights spent in each region in 2014-
2016).
• Dutch holiday visits had an above-average propensity
to feature rural and coastal areas of Britain in 2016.
• 12% of visits from the Netherlands were bought as
part of a package or an all-inclusive tour in 2016,
above the average in comparison to other markets.
26% of holidays and 30% of miscellaneous visits were
bought in this way. Overall, 88% of Dutch visits to the
UK were organised independently in 2016.
• Around 30% of visits from the Netherlands involve
travellers bringing their own vehicle; this is a larger
proportion than many other markets.
• The majority of Dutch visitors buy their tickets for
transport in Britain whilst they are here (with the
exception of internal flights and hire cars), especially
transport within London such as Tube tickets and train
travel tickets.
Regional spread 2016
10%
2%
33%
54%
1%
8%3%
40%
49%
1%
0%
10%
20%
30%
40%
50%
60%
Scotland Wales London Rest OfEngland
NorthernIreland
Sh
are
of
nig
hts
Netherlands All markets
Market and Trade Profile Netherlands
1.1 Key statistics: visits to coast, countryside and villages
14
Source: International Passenger Survey by ONS 2016
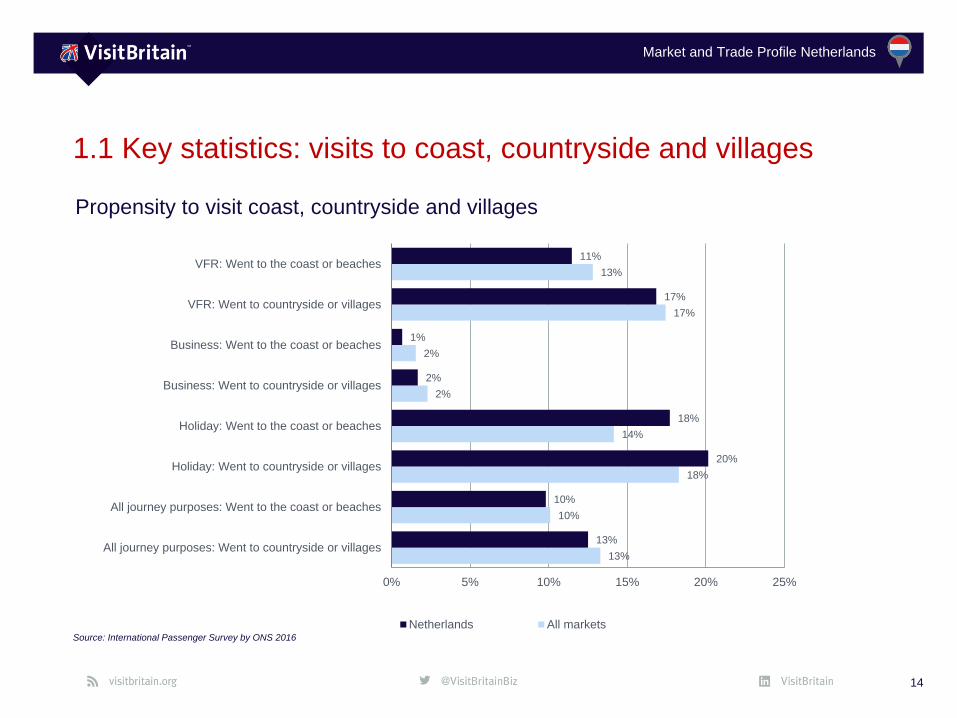
Propensity to visit coast, countryside and villages
13%
10%
18%
14%
2%
2%
17%
13%
13%
10%
20%
18%
2%
1%
17%
11%
0% 5% 10% 15% 20% 25%
All journey purposes: Went to countryside or villages
All journey purposes: Went to the coast or beaches
Holiday: Went to countryside or villages
Holiday: Went to the coast or beaches
Business: Went to countryside or villages
Business: Went to the coast or beaches
VFR: Went to countryside or villages
VFR: Went to the coast or beaches
Netherlands All markets
Market and Trade Profile Netherlands
1.1 Key statistics: use of internal modes of transport
15
Source: International Passenger Survey by ONS, 2013
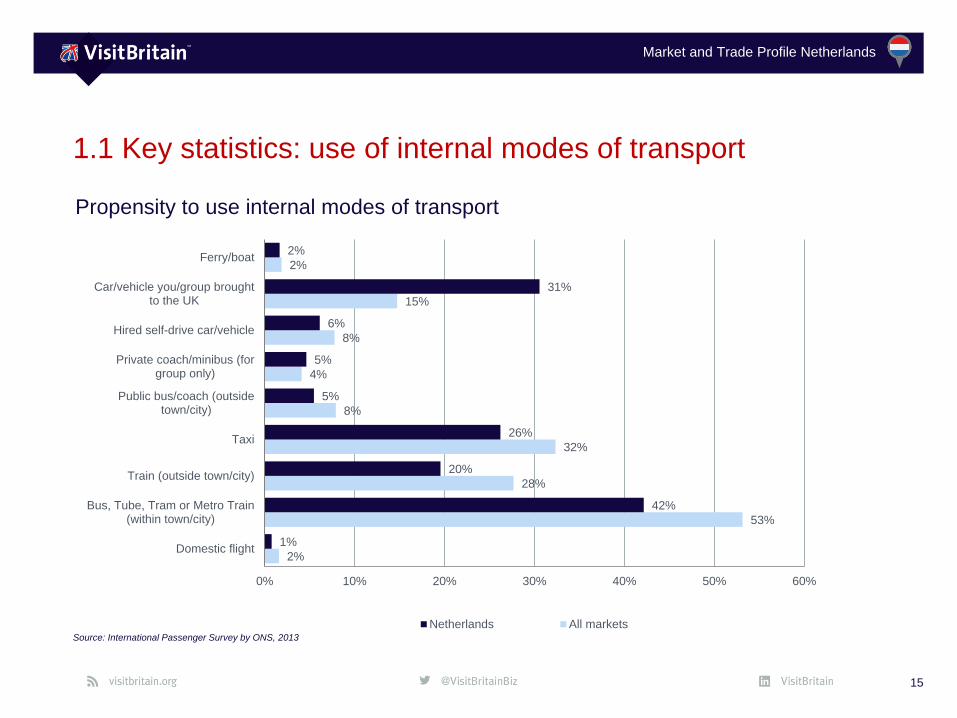
Propensity to use internal modes of transport
2%
53%
28%
32%
8%
4%
8%
15%
2%
1%
42%
20%
26%
5%
5%
6%
31%
2%
0% 10% 20% 30% 40% 50% 60%
Domestic flight
Bus, Tube, Tram or Metro Train(within town/city)
Train (outside town/city)
Taxi
Public bus/coach (outsidetown/city)
Private coach/minibus (forgroup only)
Hired self-drive car/vehicle
Car/vehicle you/group broughtto the UK
Ferry/boat
Netherlands All markets
Market and Trade Profile Netherlands
1.1 Key statistics: purchase of transport and package tours
16
International Passenger Survey by ONS, VisitBritain/IPSOS 2016, base: visitors
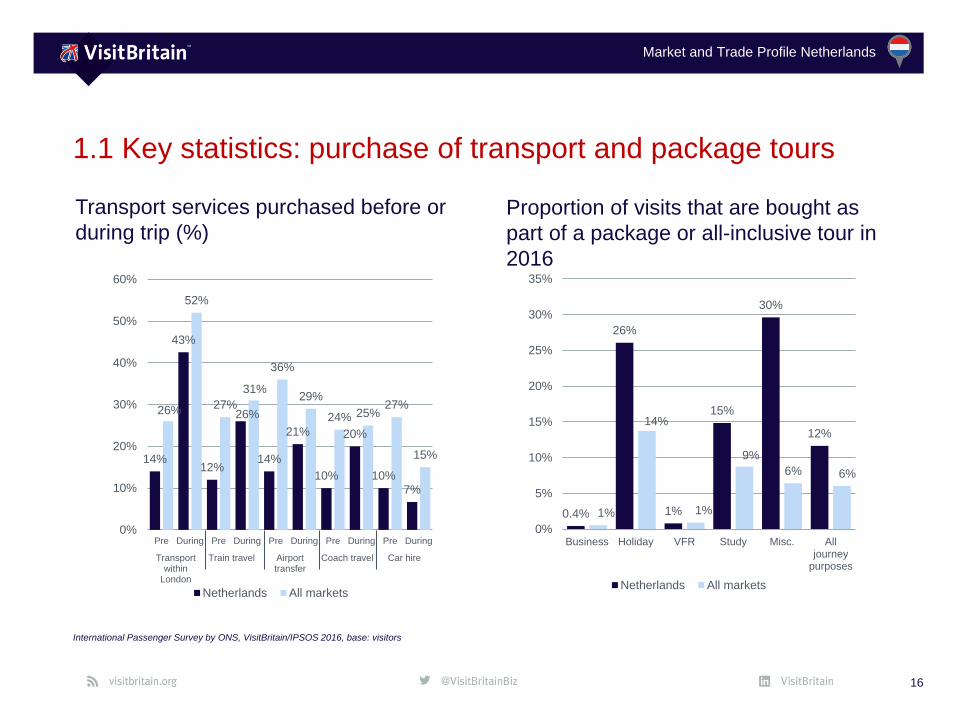
Transport services purchased before or
during trip (%) Proportion of visits that are bought as
part of a package or all-inclusive tour in
2016
0.4%
26%
1%
15%
30%
12%
1%
14%
1%
9%
6% 6%
0%
5%
10%
15%
20%
25%
30%
35%
Business Holiday VFR Study Misc. Alljourney
purposes
Netherlands All markets
14%
43%
12%
26%
14%
21%
10%
20%
10%7%
26%
52%
27%
31%
36%
29%
24% 25%27%
15%
0%
10%
20%
30%
40%
50%
60%
Pre During Pre During Pre During Pre During Pre During
Transportwithin
London
Train travel Airporttransfer
Coach travel Car hire
Netherlands All markets
Market and Trade Profile Netherlands
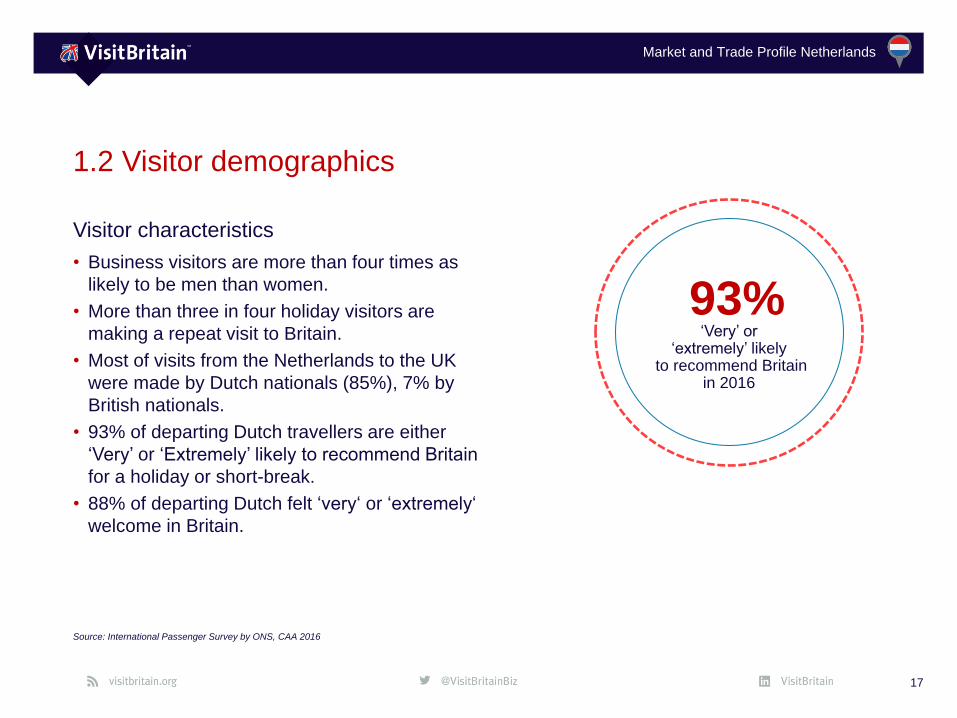
Visitor characteristics
• Business visitors are more than four times as
likely to be men than women.
• More than three in four holiday visitors are
making a repeat visit to Britain.
• Most of visits from the Netherlands to the UK
were made by Dutch nationals (85%), 7% by
British nationals.
• 93% of departing Dutch travellers are either
‘Very’ or ‘Extremely’ likely to recommend Britain
for a holiday or short-break.
• 88% of departing Dutch felt ‘very‘ or ‘extremely‘
welcome in Britain.
17
1.2 Visitor demographics
Source: International Passenger Survey by ONS, CAA 2016
93%‘Very’ or
‘extremely’ likelyto recommend Britain
in 2016
Market and Trade Profile Netherlands
1.2 Visitor demographics: gender and age groups
18
Source: International Passenger Survey by ONS
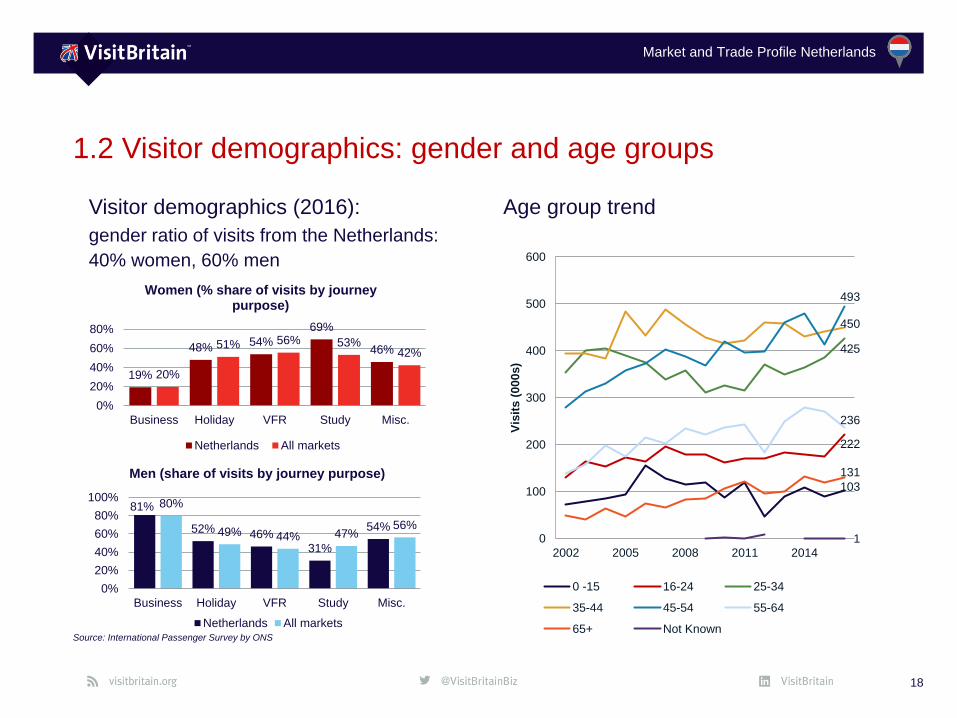
Visitor demographics (2016):
gender ratio of visits from the Netherlands:
40% women, 60% men
Age group trend
19%
48%54%
69%
46%
20%
51% 56% 53%42%
0%
20%
40%
60%
80%
Business Holiday VFR Study Misc.
Women (% share of visits by journey purpose)
Netherlands All markets
81%
52% 46%
31%
54%
80%
49% 44% 47%56%
0%
20%
40%
60%
80%
100%
Business Holiday VFR Study Misc.
Men (share of visits by journey purpose)
Netherlands All markets
103
222
425
450
493
236
131
10
100
200
300
400
500
600
2002 2005 2008 2011 2014
Vis
its (
000s)
0 -15 16-24 25-34
35-44 45-54 55-64
65+ Not Known
Market and Trade Profile Netherlands
High
Medium
Low
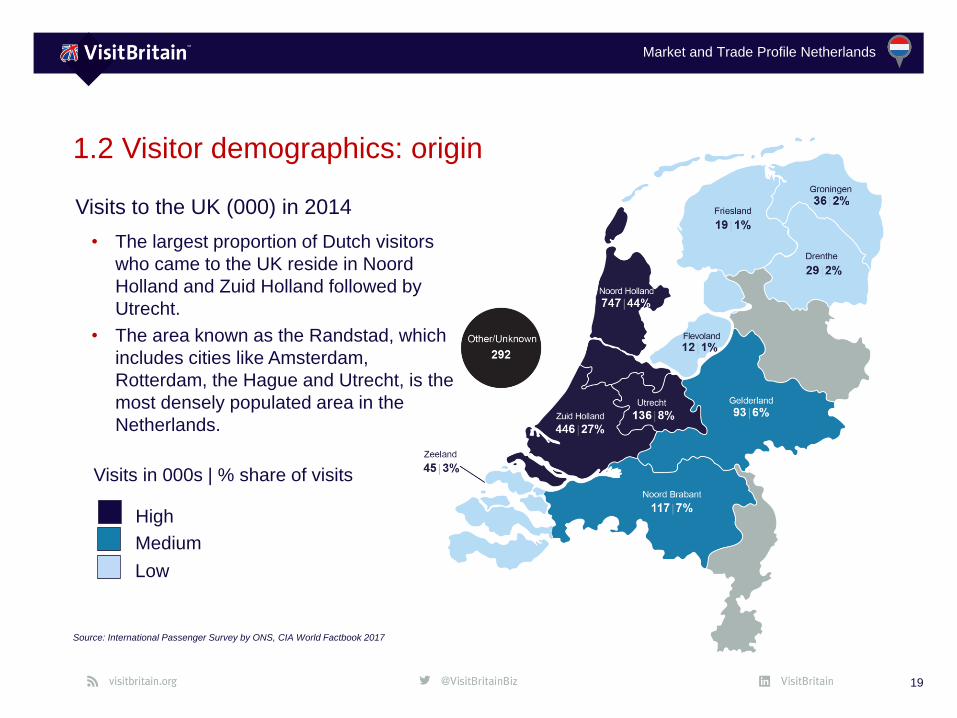
Visits in 000s | % share of visits
19
1.2 Visitor demographics: origin
Source: International Passenger Survey by ONS, CIA World Factbook 2017
Visits to the UK (000) in 2014
• The largest proportion of Dutch visitors
who came to the UK reside in Noord
Holland and Zuid Holland followed by
Utrecht.
• The area known as the Randstad, which
includes cities like Amsterdam,
Rotterdam, the Hague and Utrecht, is the
most densely populated area in the
Netherlands.
Market and Trade Profile Netherlands
1.2 Visitor demographics: welcome and recommending Britain
20
Source: CAA 2016
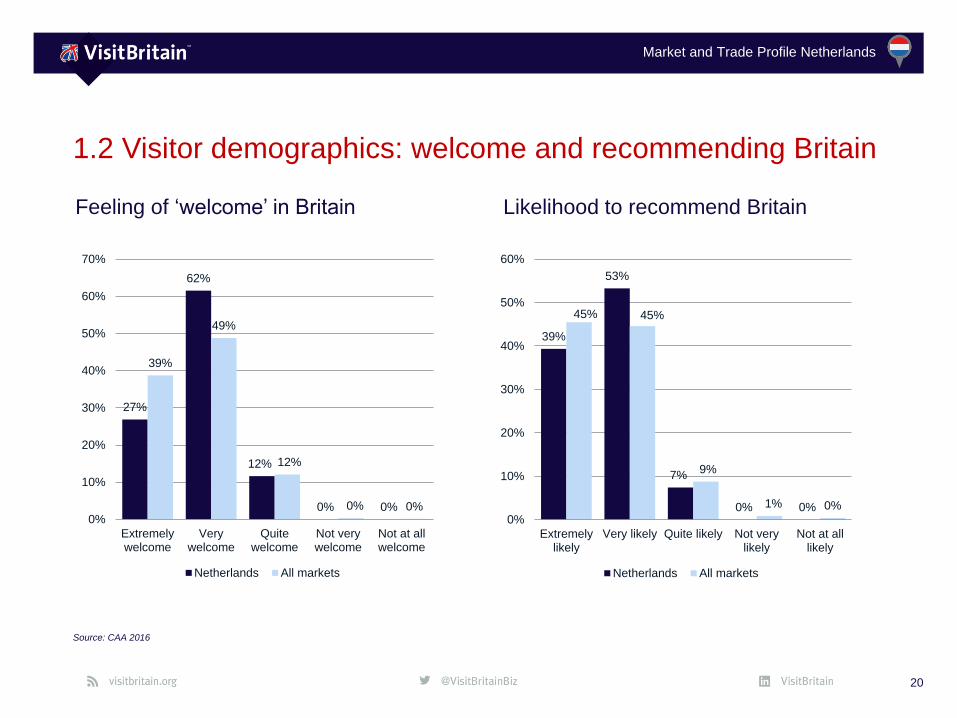
Feeling of ‘welcome’ in Britain Likelihood to recommend Britain
27%
62%
12%
0% 0%
39%
49%
12%
0% 0%0%
10%
20%
30%
40%
50%
60%
70%
Extremelywelcome
Verywelcome
Quitewelcome
Not verywelcome
Not at allwelcome
Netherlands All markets
39%
53%
7%
0% 0%
45% 45%
9%
1% 0%0%
10%
20%
30%
40%
50%
60%
Extremelylikely
Very likely Quite likely Not verylikely
Not at alllikely
Netherlands All markets
Market and Trade Profile Netherlands
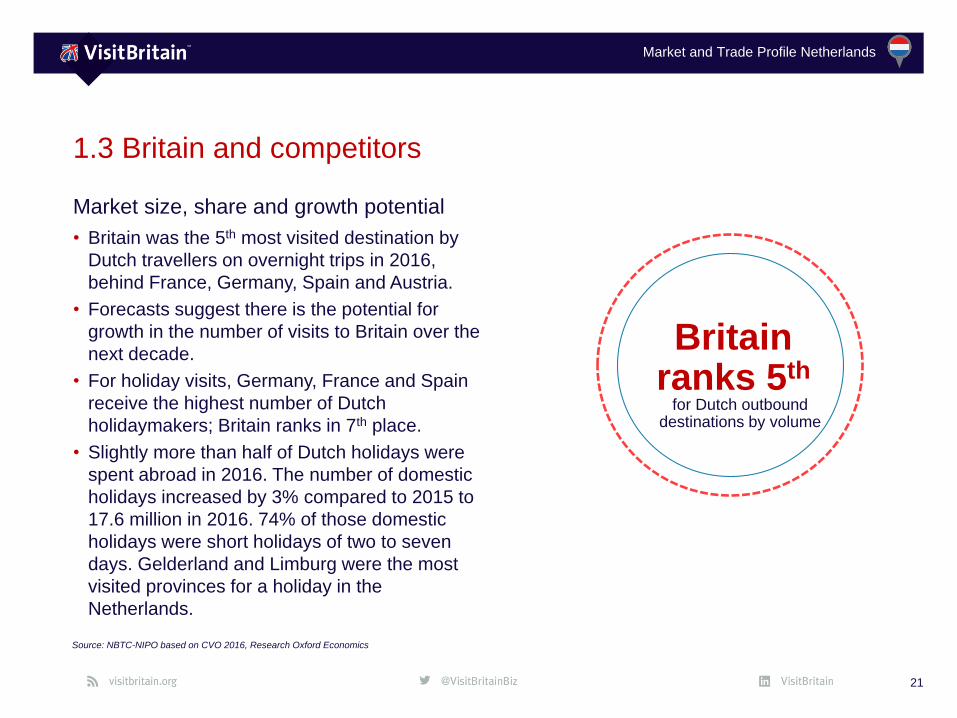
Market size, share and growth potential
• Britain was the 5th most visited destination by
Dutch travellers on overnight trips in 2016,
behind France, Germany, Spain and Austria.
• Forecasts suggest there is the potential for
growth in the number of visits to Britain over the
next decade.
• For holiday visits, Germany, France and Spain
receive the highest number of Dutch
holidaymakers; Britain ranks in 7th place.
• Slightly more than half of Dutch holidays were
spent abroad in 2016. The number of domestic
holidays increased by 3% compared to 2015 to
17.6 million in 2016. 74% of those domestic
holidays were short holidays of two to seven
days. Gelderland and Limburg were the most
visited provinces for a holiday in the
Netherlands.
21
1.3 Britain and competitors
Source: NBTC-NIPO based on CVO 2016, Research Oxford Economics
Britain ranks 5th
for Dutch outbounddestinations by volume
Market and Trade Profile Netherlands
1.3 Britain and competitors
22
Source: Oxford Economics, includes visits of at least one overnight
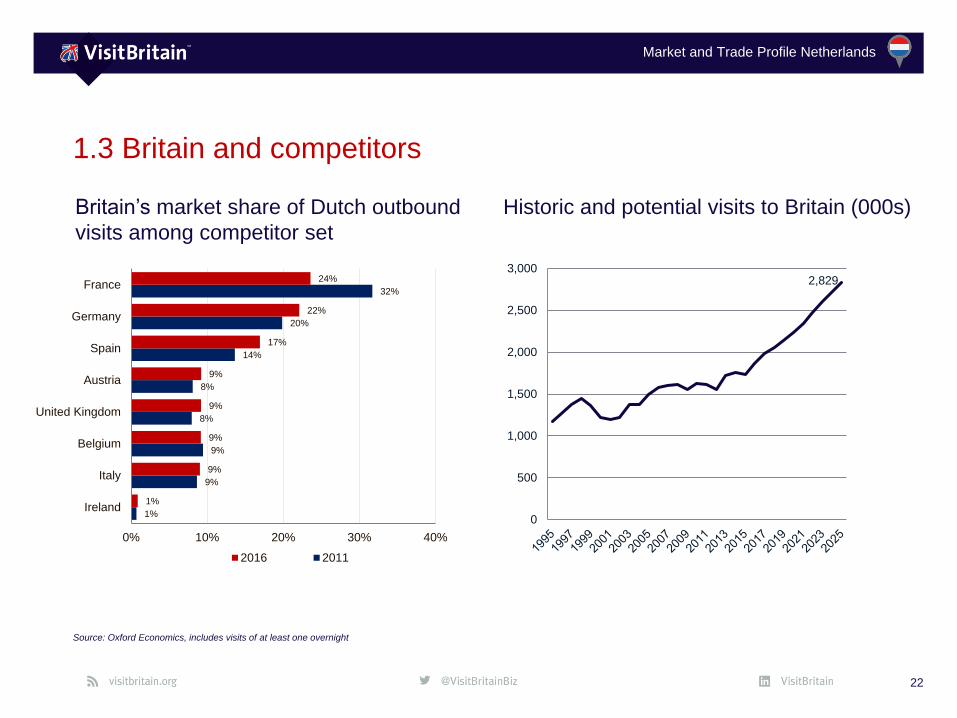
Britain’s market share of Dutch outbound
visits among competitor set
Historic and potential visits to Britain (000s)
2,829
0
500
1,000
1,500
2,000
2,500
3,000
1%
9%
9%
8%
8%
14%
20%
32%
1%
9%
9%
9%
9%
17%
22%
24%
0% 10% 20% 30% 40%
Ireland
Italy
Belgium
United Kingdom
Austria
Spain
Germany
France
2016 2011
Market and Trade Profile Netherlands
Inbound Britain activities
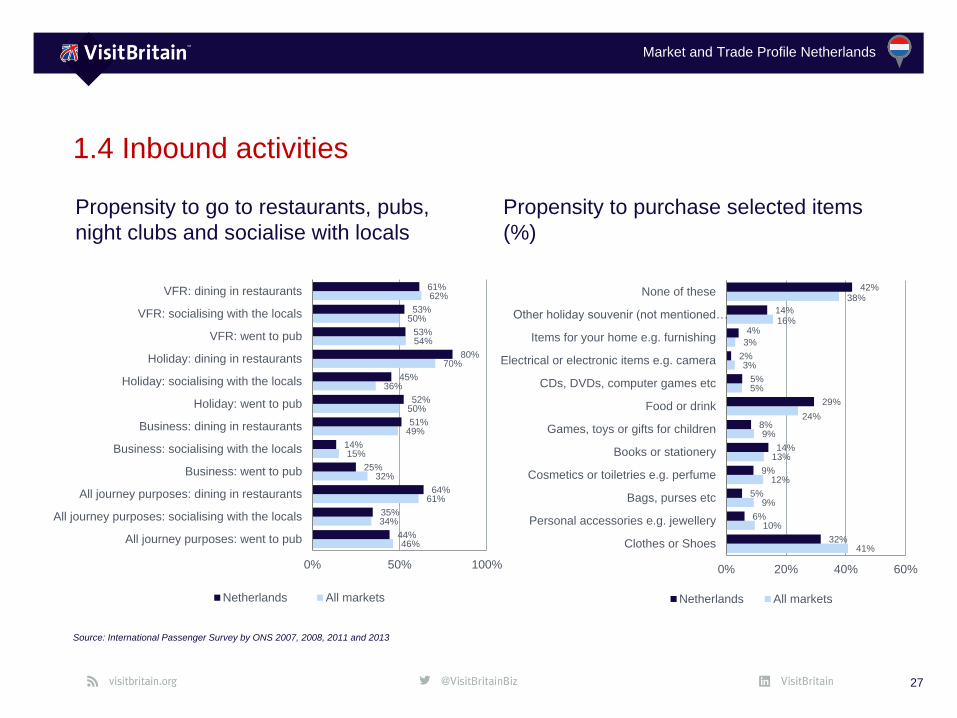
• Shopping is the number one activity
which features in many Dutch visits.
• Built heritage sites, and especially
museums, are important attractions for
many visitors from the Netherlands.
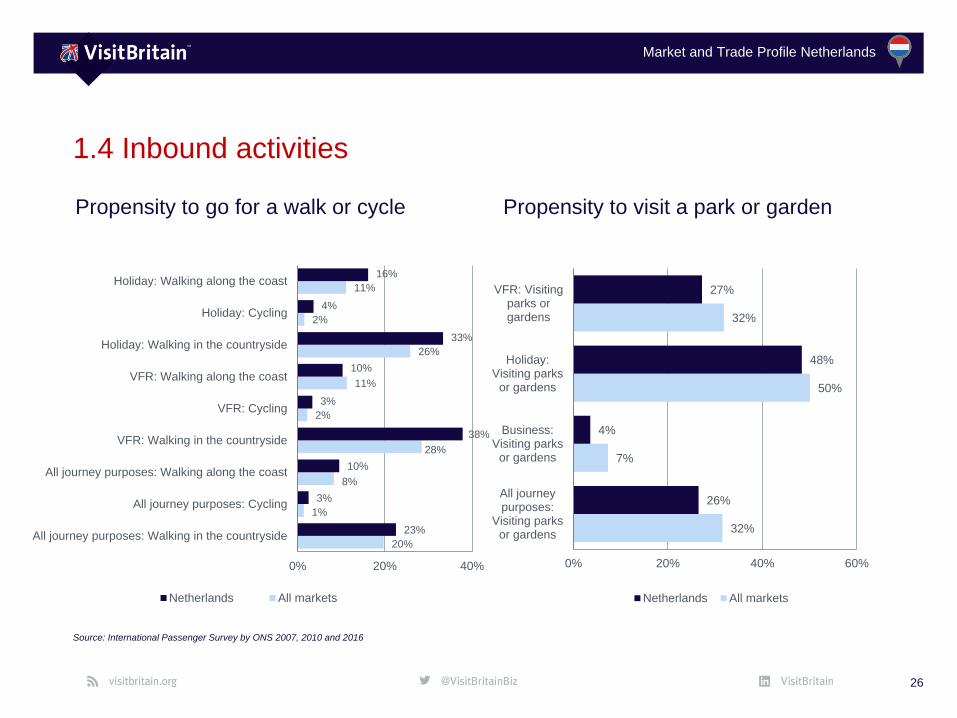
• About half of holiday visits involve time in
a park or garden, and walking in the
countryside and the coast are popular
with many Dutch holiday or VFR visitors.
• Most Dutch visitors like to dine in a
restaurant and many visit a pub and
socialise with locals while in Britain.
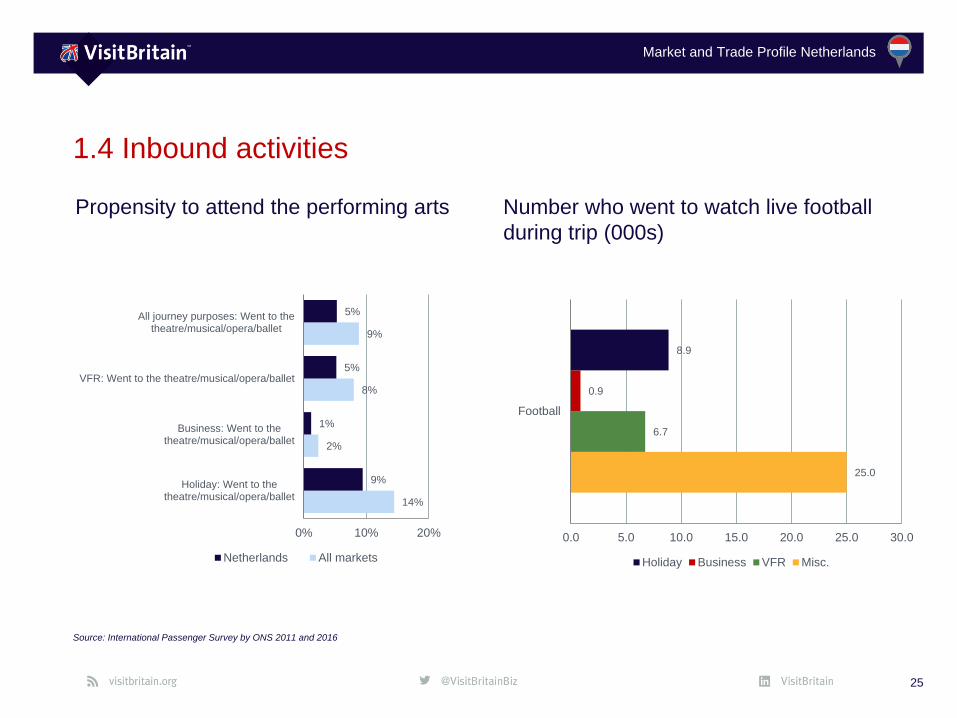
• More than 40,000 visits per annum
feature time watching football.
• Dutch visitors have a slightly below
average propensity to visit the performing
arts during their stay in Britain.
23
1.4 Inbound activities
Source: International Passenger Survey by ONS, rankings based on 2011 and 2016
Market and Trade Profile Netherlands
1.4 Inbound activities
24
Source: International Passenger Survey by ONS 2016
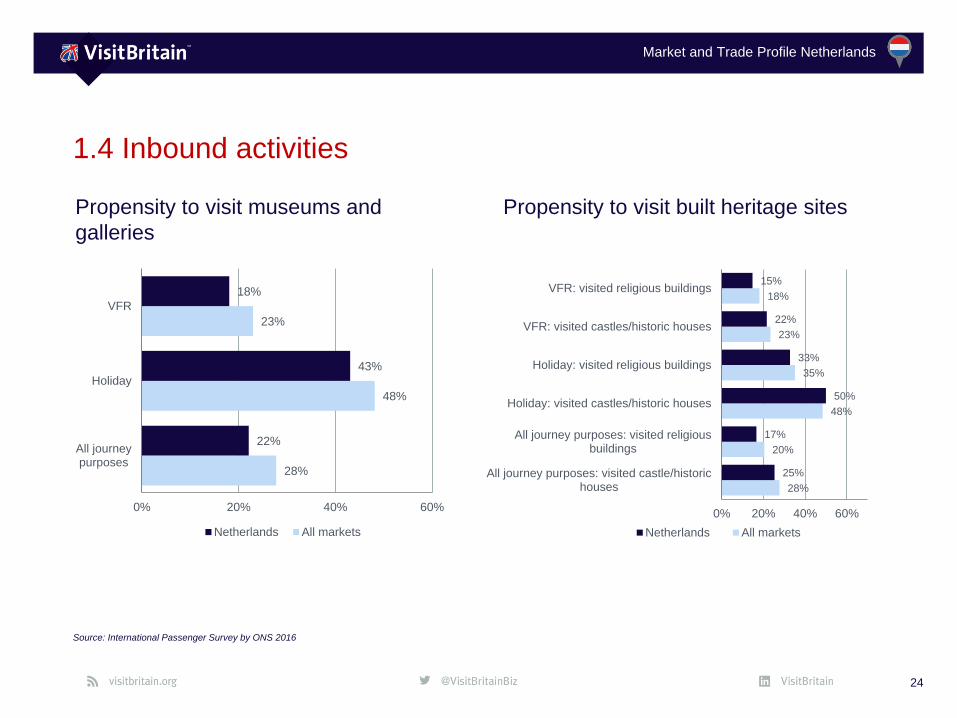
Propensity to visit museums and
galleries
Propensity to visit built heritage sites
28%
48%
23%
22%
43%
18%
0% 20% 40% 60%
All journeypurposes
Holiday
VFR
Netherlands All markets
28%
20%
48%
35%
23%
18%
25%
17%
50%
33%
22%
15%
0% 20% 40% 60%
All journey purposes: visited castle/historichouses
All journey purposes: visited religiousbuildings
Holiday: visited castles/historic houses
Holiday: visited religious buildings
VFR: visited castles/historic houses
VFR: visited religious buildings
Netherlands All markets
Market and Trade Profile Netherlands
1.4 Inbound activities
25
Source: International Passenger Survey by ONS 2011 and 2016
Propensity to attend the performing arts Number who went to watch live football
during trip (000s)
14%
2%
8%
9%
9%
1%
5%
5%
0% 10% 20%
Holiday: Went to thetheatre/musical/opera/ballet
Business: Went to thetheatre/musical/opera/ballet
VFR: Went to the theatre/musical/opera/ballet
All journey purposes: Went to thetheatre/musical/opera/ballet
Netherlands All markets
25.0
6.7
0.9
8.9
0.0 5.0 10.0 15.0 20.0 25.0 30.0
Football
Holiday Business VFR Misc.
Market and Trade Profile Netherlands
1.4 Inbound activities
26
Source: International Passenger Survey by ONS 2007, 2010 and 2016
Propensity to go for a walk or cycle Propensity to visit a park or garden
20%
1%
8%
28%
2%
11%
26%
2%
11%
23%
3%
10%
38%
3%
10%
33%
4%
16%
0% 20% 40%
All journey purposes: Walking in the countryside
All journey purposes: Cycling
All journey purposes: Walking along the coast
VFR: Walking in the countryside
VFR: Cycling
VFR: Walking along the coast
Holiday: Walking in the countryside
Holiday: Cycling
Holiday: Walking along the coast
Netherlands All markets
32%
7%
50%
32%
26%
4%
48%
27%
0% 20% 40% 60%
All journeypurposes:
Visiting parksor gardens
Business:Visiting parks
or gardens
Holiday:Visiting parks
or gardens
VFR: Visitingparks orgardens
Netherlands All markets
Market and Trade Profile Netherlands
1.4 Inbound activities
27
Source: International Passenger Survey by ONS 2007, 2008, 2011 and 2013
Propensity to go to restaurants, pubs,
night clubs and socialise with locals
Propensity to purchase selected items
(%)
46%
34%
61%
32%
15%
49%
50%
36%
70%
54%
50%
62%
44%
35%
64%
25%
14%
51%
52%
45%
80%
53%
53%
61%
0% 50% 100%
All journey purposes: went to pub
All journey purposes: socialising with the locals
All journey purposes: dining in restaurants
Business: went to pub
Business: socialising with the locals
Business: dining in restaurants
Holiday: went to pub
Holiday: socialising with the locals
Holiday: dining in restaurants
VFR: went to pub
VFR: socialising with the locals
VFR: dining in restaurants
Netherlands All markets
41%
10%
9%
12%
13%
9%
24%
5%
3%
3%
16%
38%
32%
6%
5%
9%
14%
8%
29%
5%
2%
4%
14%
42%
0% 20% 40% 60%
Clothes or Shoes
Personal accessories e.g. jewellery
Bags, purses etc
Cosmetics or toiletries e.g. perfume
Books or stationery
Games, toys or gifts for children
Food or drink
CDs, DVDs, computer games etc
Electrical or electronic items e.g. camera
Items for your home e.g. furnishing
Other holiday souvenir (not mentioned…
None of these
Netherlands All markets
Market and Trade Profile Netherlands
1.4 Inbound activities
28
Source: International Passenger Survey by ONS 2013
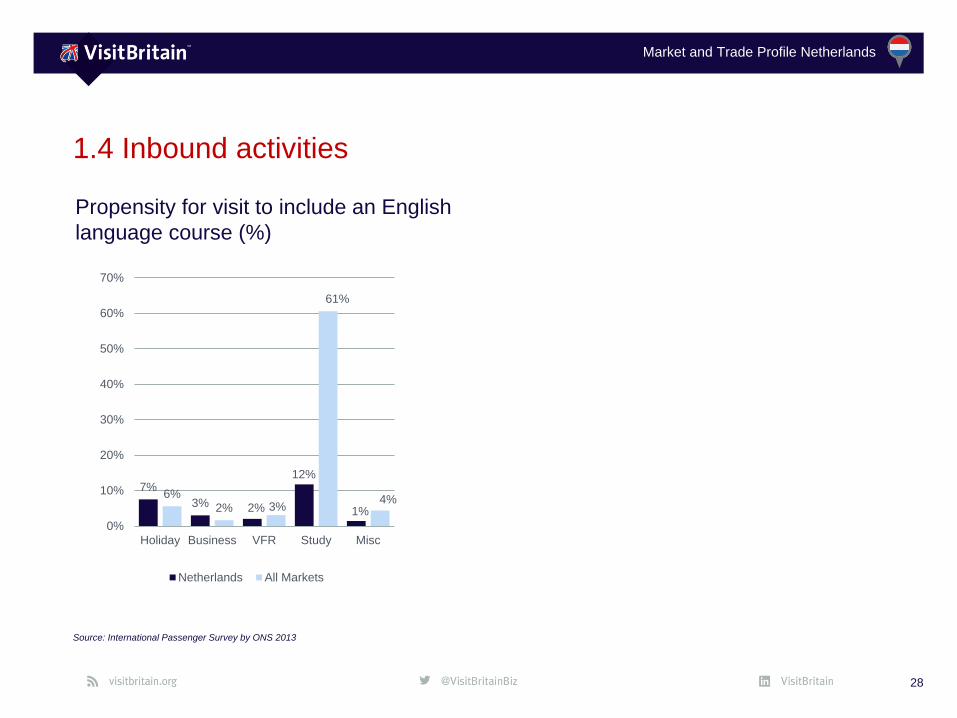
Propensity for visit to include an English
language course (%)
7%
3% 2%
12%
1%
6%2% 3%
61%
4%
0%
10%
20%
30%
40%
50%
60%
70%
Holiday Business VFR Study Misc
Netherlands All Markets

Market and Trade Profile Netherlands
Understanding
the market
Chapter 2:
29
Market and Trade Profile Netherlands
Chapter summary
• The Netherlands has a population of about 17 million.
• Whilst one in five Dutch did not take overnight trips away from
home, it is very common for the majority to go on more than one
such trip, indicating that travel is important to them.
• 32% of Dutch holiday visitors tend to start thinking about their trip to
Britain early, often more than half a year in advance.
• More than half of holiday bookings of a trip to Britain were made
within two months before arrival.
• Information on search engines is the most important influence on
the holiday destination choice.
• Cultural attractions, vibrant cities and the countryside/natural beauty
are amongst the most important motivations for choosing Britain as
a holiday destination. Amongst Britain‘s strengths are the
perceptions that it is a good destination for entertainment and
nightlife, watching sporting events as well as for shopping.
30
2.Understanding the market
Source: Arkenford 2013, Oxford Economcis, VisitBritain/IPSOS 2016, Flash Eurobarometer 432 by EC 2016
Cultural attractions
Most important draw for Dutch
visitors
Market and Trade Profile Netherlands
Demographics & society• Population of about 17 million.
• The Netherlands is a parliamentary constitutional monarchy.
• There are 4 regions (North, East, South and West Netherlands) which
are divided into 12 provinces: Drenthe, Flevoland, Fryslan, Gelderland,
Groningen, Limburg, Noord-Brabant, Noord-Holland, Overijssel, Utrecht,
Zeeland, Zuid-Holland.
• An area called Randstad which comprises cities like Amsterdam,
Rotterdam, the Hague and Utrecht is the area the most densely
populated in the Netherlands.
• More than 90% of the population live in cities.
• The official language is Dutch; Frisian is the official language in the
Fryslan province. English is taught as the first foreign language in
school and linguistic proficiency among Dutch visitors tends to be high.
• Dutch full time employees receive an average of 25 days annual leave.
31
2.1 Structural drivers
Source: Oxford Economics, CIA World Factbook 2017
17mDutch
population
Market and Trade Profile Netherlands
2.1 Structural drivers: population and economic indicators
32
Source: Oxford Economics, CIA World Factbook 2017
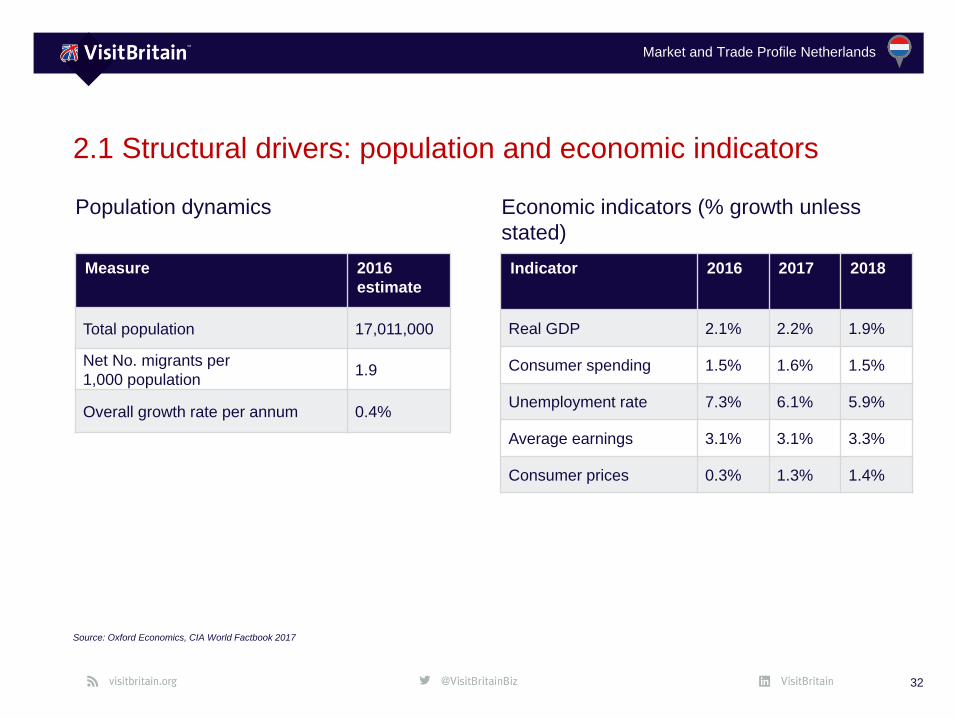
Measure 2016
estimate
Total population 17,011,000
Net No. migrants per
1,000 population1.9
Overall growth rate per annum 0.4%
Population dynamics
Indicator 2016 2017 2018
Real GDP 2.1% 2.2% 1.9%
Consumer spending 1.5% 1.6% 1.5%
Unemployment rate 7.3% 6.1% 5.9%
Average earnings 3.1% 3.1% 3.3%
Consumer prices 0.3% 1.3% 1.4%
Economic indicators (% growth unless
stated)
Market and Trade Profile Netherlands
2.1 Structural drivers: general market overview
33
Source:, Oxford Economics, Capgemini World Wealth Report 2016, CIA World Factbook 2017
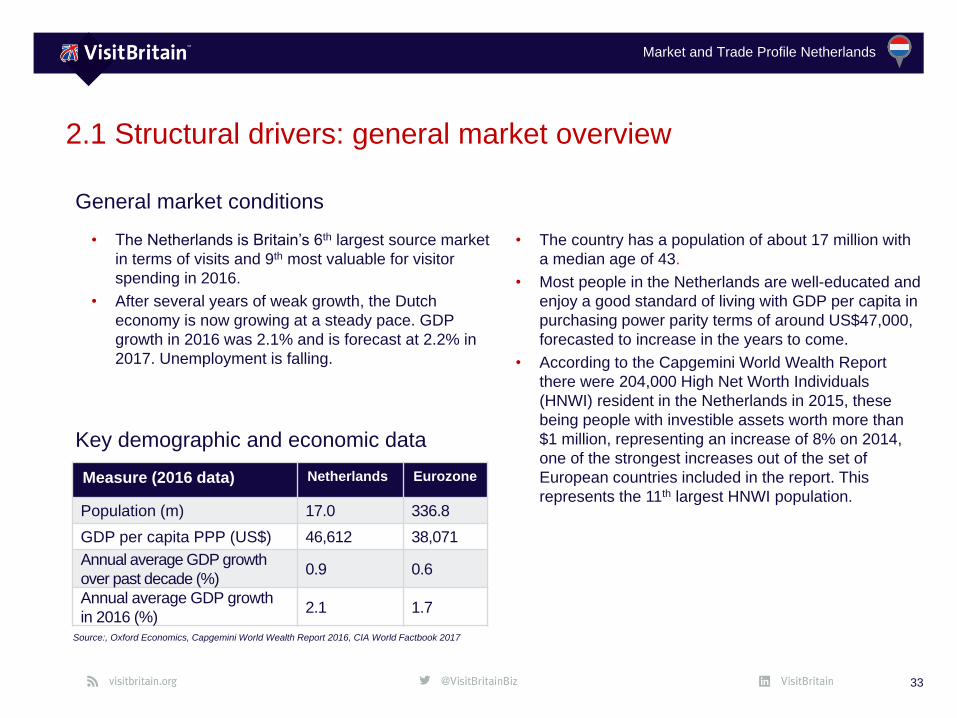
Key demographic and economic data
Measure (2016 data) Netherlands Eurozone
Population (m) 17.0 336.8
GDP per capita PPP (US$) 46,612 38,071
Annual average GDP growth
over past decade (%)0.9 0.6
Annual average GDP growth
in 2016 (%)2.1 1.7
General market conditions
• The Netherlands is Britain’s 6th largest source market
in terms of visits and 9th most valuable for visitor
spending in 2016.
• After several years of weak growth, the Dutch
economy is now growing at a steady pace. GDP
growth in 2016 was 2.1% and is forecast at 2.2% in
2017. Unemployment is falling.
• The country has a population of about 17 million with
a median age of 43.
• Most people in the Netherlands are well-educated and
enjoy a good standard of living with GDP per capita in
purchasing power parity terms of around US$47,000,
forecasted to increase in the years to come.
• According to the Capgemini World Wealth Report
there were 204,000 High Net Worth Individuals
(HNWI) resident in the Netherlands in 2015, these
being people with investible assets worth more than
$1 million, representing an increase of 8% on 2014,
one of the strongest increases out of the set of
European countries included in the report. This
represents the 11th largest HNWI population.
Market and Trade Profile Netherlands
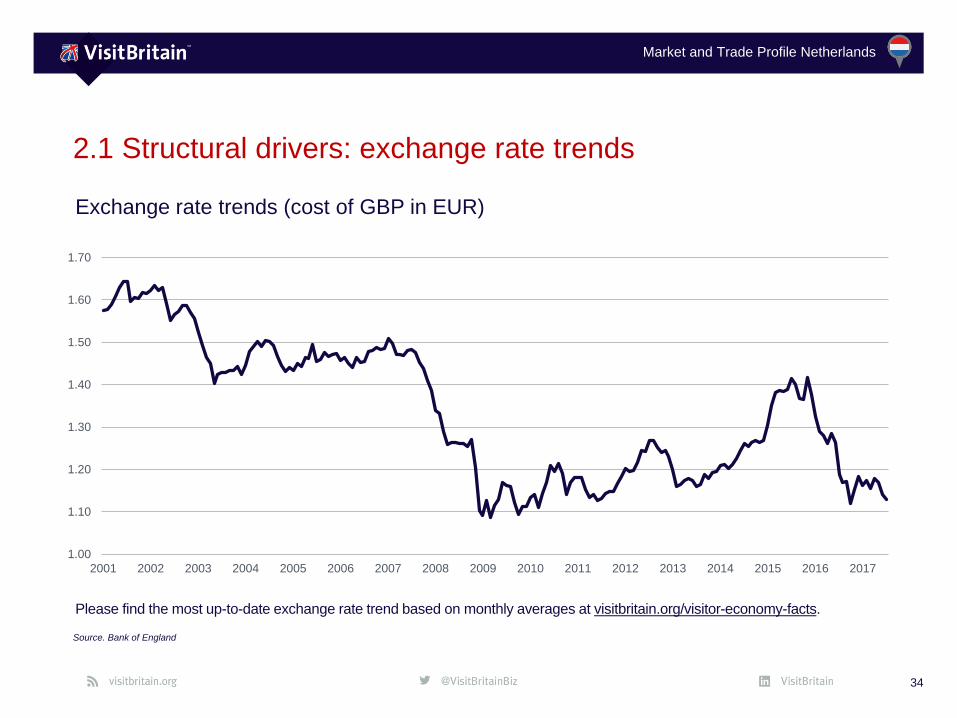
2.1 Structural drivers: exchange rate trends
34
Source. Bank of England
Exchange rate trends (cost of GBP in EUR)
1.00
1.10
1.20
1.30
1.40
1.50
1.60
1.70
2001 2002 2003 2004 2005 2006 2007 2008 2009 2010 2011 2012 2013 2014 2015 2016 2017
Please find the most up-to-date exchange rate trend based on monthly averages at visitbritain.org/visitor-economy-facts.
Market and Trade Profile Netherlands
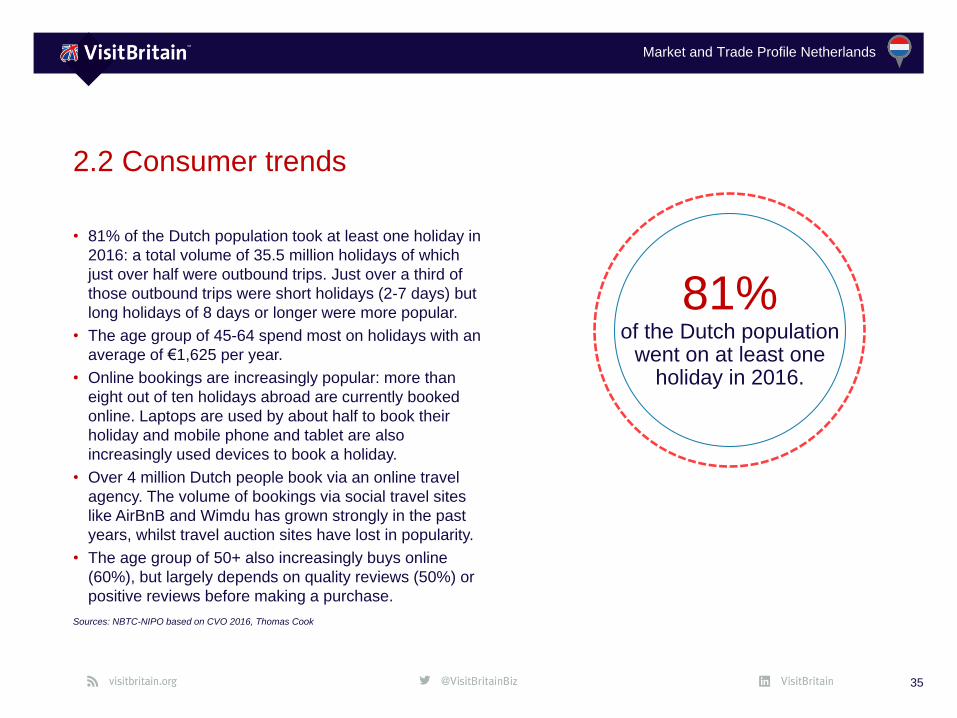
• 81% of the Dutch population took at least one holiday in
2016: a total volume of 35.5 million holidays of which
just over half were outbound trips. Just over a third of
those outbound trips were short holidays (2-7 days) but
long holidays of 8 days or longer were more popular.
• The age group of 45-64 spend most on holidays with an
average of €1,625 per year.
• Online bookings are increasingly popular: more than
eight out of ten holidays abroad are currently booked
online. Laptops are used by about half to book their
holiday and mobile phone and tablet are also
increasingly used devices to book a holiday.
• Over 4 million Dutch people book via an online travel
agency. The volume of bookings via social travel sites
like AirBnB and Wimdu has grown strongly in the past
years, whilst travel auction sites have lost in popularity.
• The age group of 50+ also increasingly buys online
(60%), but largely depends on quality reviews (50%) or
positive reviews before making a purchase.
35
2.2 Consumer trends
Sources: NBTC-NIPO based on CVO 2016, Thomas Cook
81% of the Dutch population
went on at least one holiday in 2016.
Market and Trade Profile Netherlands
2.2 Consumer trends: overall travel trends
36
Source: NBTC-NIPO based on CVO 2016, Thomas Cook
Travel trends
• The Dutch holiday market continues to grow. The
proportion taking holidays increased for the second
consecutive year: 81% of the Dutch population went on
at least one holiday in 2016.
• The Dutch went on a total volume of 35.5 million
holidays of which just over half (17.9m) were outbound
trips in 2016 (a slight decrease from 18.1 million
holidays abroad in 2015). Of the holidays abroad, just
over a third were short holidays lasting between two
and seven days (up 2% on 2015), but longer holidays of
8 days or more were more popular but decreased
slightly compared to 2015 (2%). The number of Dutch
domestic holidays increased from 17.0 million to 17.6
million (3% on 2015) with both short and long holidays
gaining in volume.
• Whilst the volume of holidays taken by the Dutch
increased, overall spend on holidays declined slightly
(by 2%). The Dutch spent €15.7bn on their holidays
with €12.6bn of this spent on holidays outside of their
own country; this represents a 3% year-on-year decline,
mainly due to fewer holidays taken abroad.
• The age group of 45-64 spend most on holidays with
an average of €1,625 per year.
• Looking specifically at holidays,Germany and France
held their position as number one and number 2 as the
most popular destinations for Dutch holidaymakers.
Spain experienced strong growth (11% compared to
2015) and now is the third most popular holiday
destination among the Dutch, followed by Belgium,
Austria, Italy and Great Britain (stable market share
year-on-year of 5%) ahead of Turkey, Greece and
Portugal. Overall the number of Dutch holidays in the
Mediterranean and the volume of intercontinental
holidays decreased 3% and 2% respectively.
• Online bookings are increasingly popular: more than
eight out of ten holidays abroad are currently booked
online. Laptops are used by about half to book their
holiday and mobile phone and tablet are also
increasingly used devices to book a holiday.
• The age group of 50+ also increasingly buys online
(60%), but largely depends on quality reviews (50%) or
positive reviews before making a purchase.
Market and Trade Profile Netherlands
2.2 Consumer trends: motivation and attitudes to holidays
37
Source: Flash Eurobarometer 432 by EC 2016: During 2015, how many times did you travel for professional or personal reasons where you were away from home for a minimum of one night?, NBTC-NIPO
based on CVO 2016, Thomas Cook
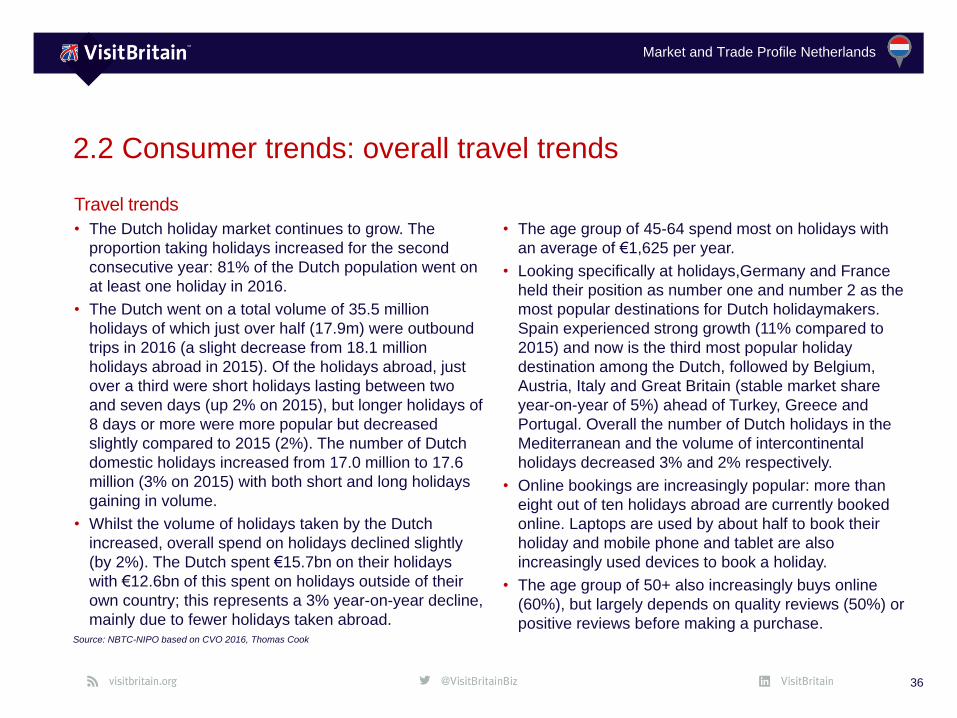
Number of overnight trips away from home
for all journey purposes (%)
20%
15%14%
12%
18%
10%11%
0%0%
5%
10%
15%
20%
25%
None 1 2 3 4-5 6-10 10+ DK
• Whilst one in five Dutch did not take overnight trips away
from home it is very common for the majority to go on more
than one such trip indicating that travel is important to them.
Motivation and attitudes to holidays
• The majority of Dutch said that they were unlikely to
amend their holiday plans due to the economic situation
(62%). Only 12% said that they go on holidays in 2016 but
are likely to spend less (Flash Eurobarometer 432 by EC).
This shows a lower impact than the European average.
• The Dutch tend to be very price-conscious holiday-
makers who look for good value for money.
• Wi-Fi is one important criterea for accommodation
bookings (82%) and children tend to have a strong
influence, too.
• The Dutch, generally speaking, are interested in making
contact with locals, learning about their culture and
customs and in tasting local food and drink.
• Britain as well as neighbouring destinations like Belgium
and Germany are mainly visited for short holidays while
Spain, Italy, Austria, France and Denmark are typical
destinations for longer holidays.
Market and Trade Profile Netherlands
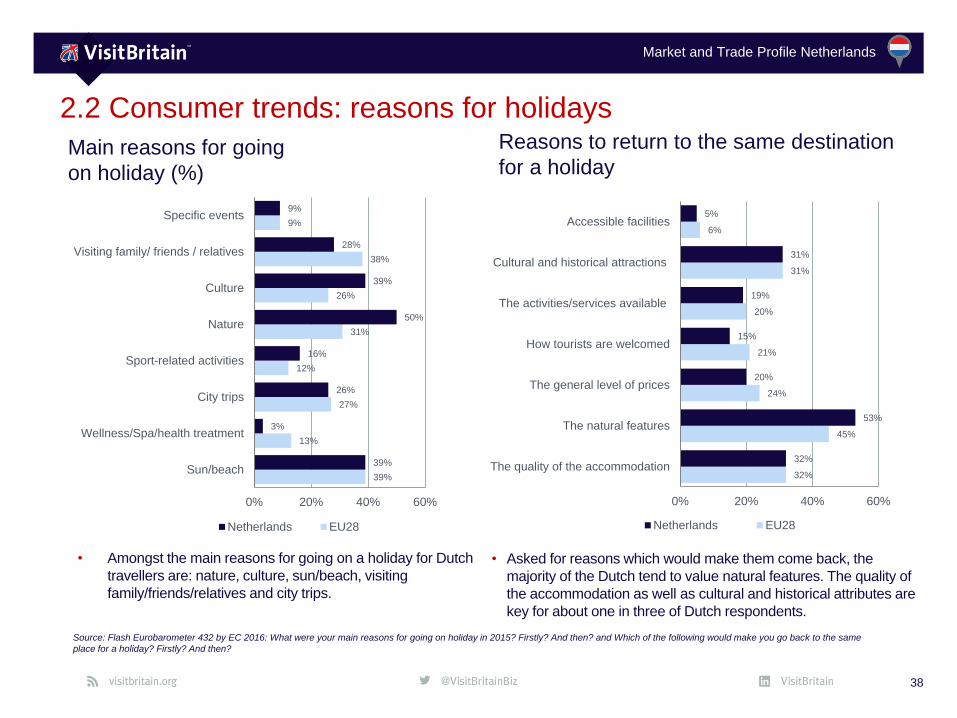
2.2 Consumer trends: reasons for holidays
Main reasons for going
on holiday (%)
38
Reasons to return to the same destination
for a holiday
• Asked for reasons which would make them come back, the
majority of the Dutch tend to value natural features. The quality of
the accommodation as well as cultural and historical attributes are
key for about one in three of Dutch respondents.
• Amongst the main reasons for going on a holiday for Dutch
travellers are: nature, culture, sun/beach, visiting
family/friends/relatives and city trips.
39%
13%
27%
12%
31%
26%
38%
9%
39%
3%
26%
16%
50%
39%
28%
9%
0% 20% 40% 60%
Sun/beach
Wellness/Spa/health treatment
City trips
Sport-related activities
Nature
Culture
Visiting family/ friends / relatives
Specific events
Netherlands EU28
32%
45%
24%
21%
20%
31%
6%
32%
53%
20%
15%
19%
31%
5%
0% 20% 40% 60%
The quality of the accommodation
The natural features
The general level of prices
How tourists are welcomed
The activities/services available
Cultural and historical attractions
Accessible facilities
Netherlands EU28
Source: Flash Eurobarometer 432 by EC 2016: What were your main reasons for going on holiday in 2015? Firstly? And then? and Which of the following would make you go back to the same
place for a holiday? Firstly? And then?
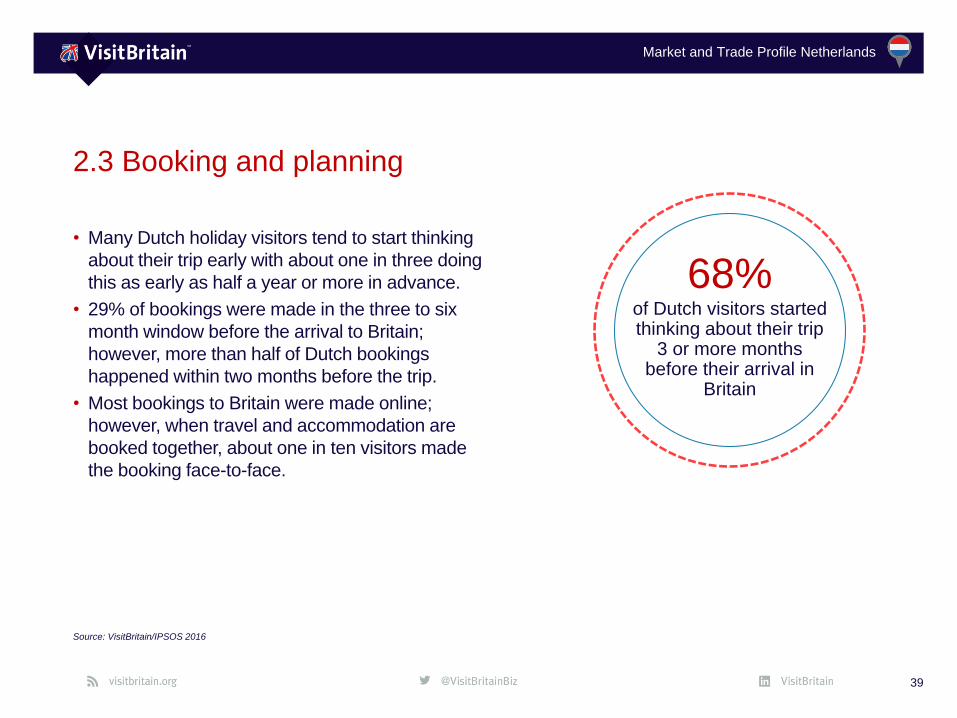
Market and Trade Profile Netherlands
• Many Dutch holiday visitors tend to start thinking
about their trip early with about one in three doing
this as early as half a year or more in advance.
• 29% of bookings were made in the three to six
month window before the arrival to Britain;
however, more than half of Dutch bookings
happened within two months before the trip.
• Most bookings to Britain were made online;
however, when travel and accommodation are
booked together, about one in ten visitors made
the booking face-to-face.
39
2.3 Booking and planning
Source: VisitBritain/IPSOS 2016
68%of Dutch visitors started thinking about their trip
3 or more months before their arrival in
Britain
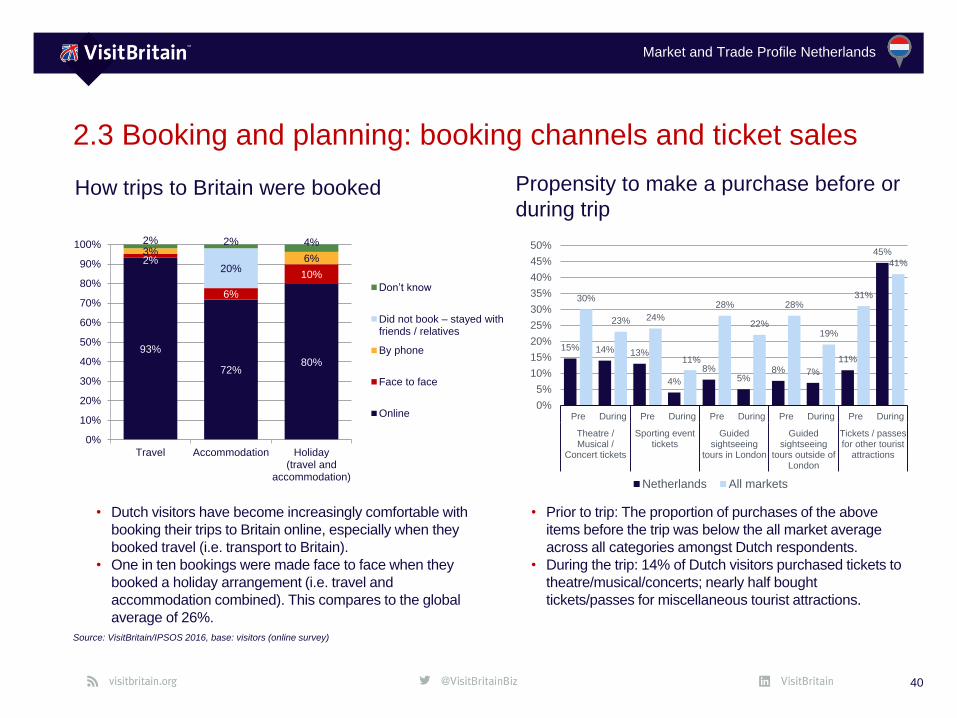
Market and Trade Profile Netherlands
2.3 Booking and planning: booking channels and ticket sales
40
Source: VisitBritain/IPSOS 2016, base: visitors (online survey)
How trips to Britain were booked Propensity to make a purchase before or
during trip
15% 14% 13%
4%
8%5%
8% 7%
11%
45%
30%
23% 24%
11%
28%
22%
28%
19%
31%
41%
0%
5%
10%
15%
20%
25%
30%
35%
40%
45%
50%
Pre During Pre During Pre During Pre During Pre During
Theatre /Musical /
Concert tickets
Sporting eventtickets
Guidedsightseeing
tours in London
Guidedsightseeing
tours outside ofLondon
Tickets / passesfor other tourist
attractions
Netherlands All markets
• Dutch visitors have become increasingly comfortable with
booking their trips to Britain online, especially when they
booked travel (i.e. transport to Britain).
• One in ten bookings were made face to face when they
booked a holiday arrangement (i.e. travel and
accommodation combined). This compares to the global
average of 26%.
• Prior to trip: The proportion of purchases of the above
items before the trip was below the all market average
across all categories amongst Dutch respondents.
• During the trip: 14% of Dutch visitors purchased tickets to
theatre/musical/concerts; nearly half bought
tickets/passes for miscellaneous tourist attractions.
93%
72%80%
2%
6%
10%
3%6%
20%
2% 2% 4%
0%
10%
20%
30%
40%
50%
60%
70%
80%
90%
100%
Travel Accommodation Holiday(travel and
accommodation)
Don’t know
Did not book – stayed with friends / relatives
By phone
Face to face
Online
Market and Trade Profile Netherlands
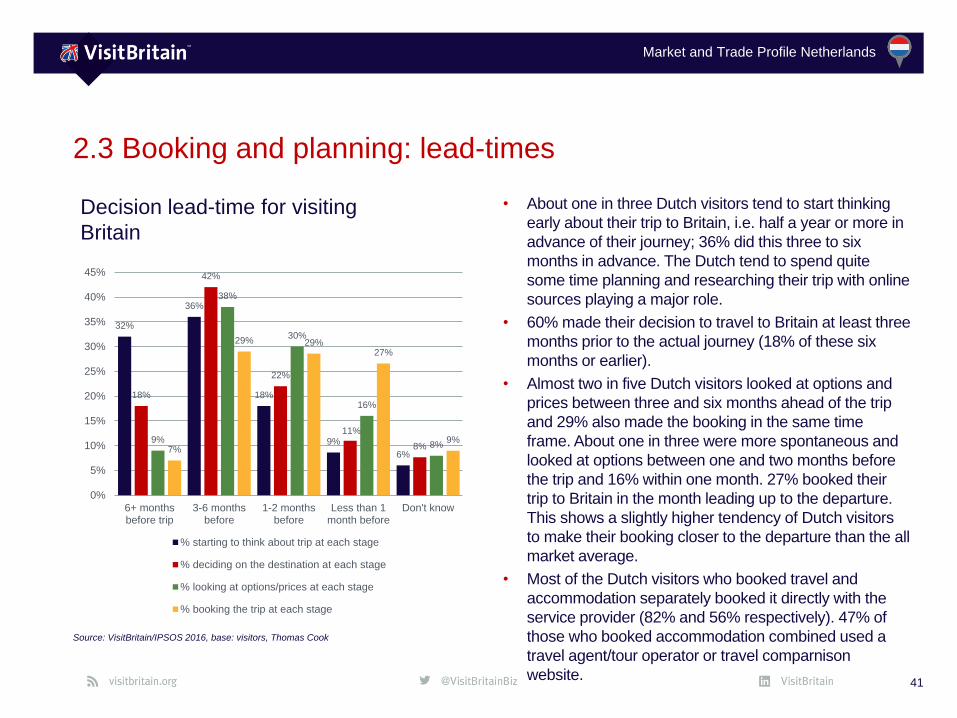
2.3 Booking and planning: lead-times
41
Source: VisitBritain/IPSOS 2016, base: visitors, Thomas Cook
Decision lead-time for visiting
Britain
• About one in three Dutch visitors tend to start thinking
early about their trip to Britain, i.e. half a year or more in
advance of their journey; 36% did this three to six
months in advance. The Dutch tend to spend quite
some time planning and researching their trip with online
sources playing a major role.
• 60% made their decision to travel to Britain at least three
months prior to the actual journey (18% of these six
months or earlier).
• Almost two in five Dutch visitors looked at options and
prices between three and six months ahead of the trip
and 29% also made the booking in the same time
frame. About one in three were more spontaneous and
looked at options between one and two months before
the trip and 16% within one month. 27% booked their
trip to Britain in the month leading up to the departure.
This shows a slightly higher tendency of Dutch visitors
to make their booking closer to the departure than the all
market average.
• Most of the Dutch visitors who booked travel and
accommodation separately booked it directly with the
service provider (82% and 56% respectively). 47% of
those who booked accommodation combined used a
travel agent/tour operator or travel comparnison
website.
32%
36%
18%
9%
6%
18%
42%
22%
11%
8%9%
38%
30%
16%
8%7%
29% 29%27%
9%
0%
5%
10%
15%
20%
25%
30%
35%
40%
45%
6+ monthsbefore trip
3-6 monthsbefore
1-2 monthsbefore
Less than 1month before
Don't know
% starting to think about trip at each stage
% deciding on the destination at each stage
% looking at options/prices at each stage
% booking the trip at each stage
Market and Trade Profile Netherlands
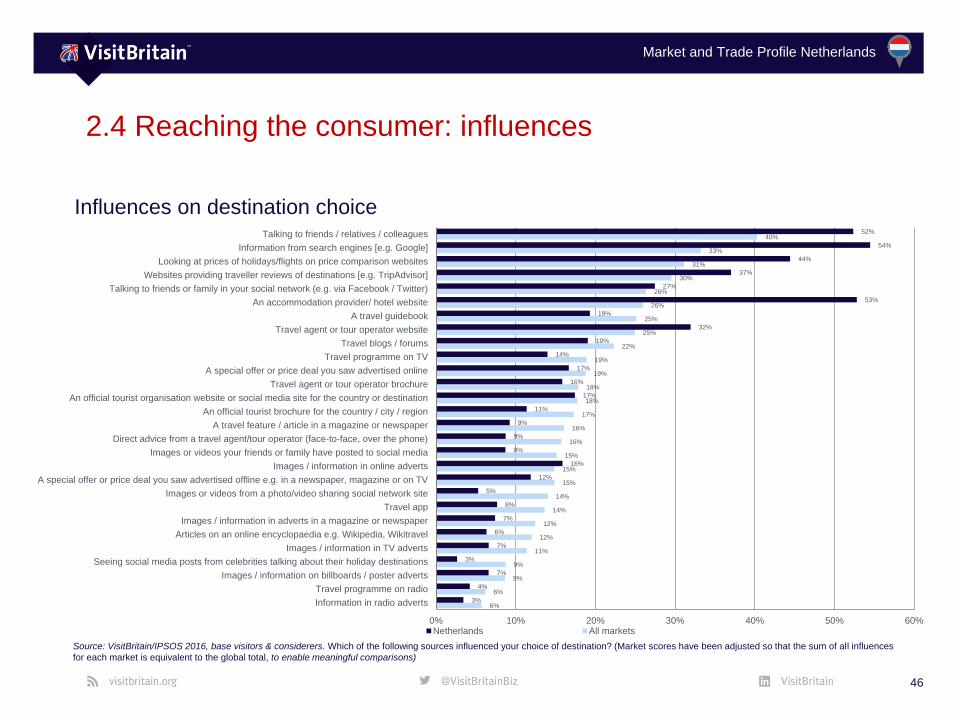
• The most influential source for destination
choice for Dutch visitors is information from
search engines, closely followed by websites of
accommodation providers/hotels and their
friends, family and colleagues.
• Looking at prices of holidays/flights on price
comparison websites and websites providing
traveller reviews of destinations and travel
agent and tour operator websites are also
important for many Dutch in their destination
choice. This highlights a high affinity to online
sources in comparison to the all-market
average.
• The Dutch spend on average 8.5 hours per day
on media with TV being the most popular
medium (average of 154 minutes/day). On
average 2 hours per day are spent online.
42
2.4 Reaching the consumer
Sources: VisitBritain/IPSOS 2016, SKO, Media: Tijd
Information from search
enginges#1 Influence for the destination choice
of the Dutch
Market and Trade Profile Netherlands
Broadcast media• The Dutch watch TV for 153 mins on average each day.
Watching TV is still most popular via a traditional TV set
despite the growing popularity of mobile devices. (SKO)
• 3 public TV channels, 16 commercial TV channels.
• Travel shows on Dutch TV: 3 op Reis, Campinglife, De
zomer voorbij, Erica op reis, Groeten van Max, Ik vertrek,
Lekker weg in eigen land.
2.4 Reaching the consumer: broadcast media, radio and papers
Source: SKO June 2017, Carat factbook, Media: tijd
Radio• 6 public and 14 commercial radio stations. (Carat factbook)
• The Dutch spend on average 2 hours and 43 mins on
listening to media each day. Two hours and 8 mins (79%)
are used to listen to live radio, the rest on listening to own
music. (Media: tijd)
• There are no dedicated travel shows on Dutch radio. (Media:
tijd)
Newspapers• Half of the Dutch households read print versions daily.
Newspaper readers spend on average 45-60 mins for
reading their paper (Media: tijd)
• There are 9 national newspapers in the Netherlands. The
biggest publications are Telegraaf (390.000), Algemeen
Dagblad (322.000) and Volkskrant (219.000). In addition,
there are 18 regional papers, many of them have local
editions of the paper. (Carat factbook)
• Nearly all Dutch newspapers (90%) are owned by the
Belgian publishers Persegroep and Mediahuis
• Almost all newspapers have weekly travel or lifestyle
sections and/or supplements with travel content sourced
internally (often the result of press visits) or produced by
news agencies or freelance journalists.
Market and Trade Profile Netherlands
Magazines• The Netherlands has a very extensive print media
landscape with around 1,200 consumer magazines.
Family, women’s and culinary magazines have the
highest circulation. 472 million magazines are printed
each year.
• 80% of the Dutch population (11.4 million people) read
magazines.
• Top Dutch travel magazines: REIZ& Magazine
(circulation: 22,624), National Geographic Traveler
(circulation: 37,403), Lonely Planet Traveller (circulation:
25,000) and Columbus Travel (circulation: 45,000).
• Media trends:
• Consumption on digital platforms increases, but print still
main ‘platform’.
• Many magazines are expanding their activities to e-
commerce, events and video to build a strong multi-
platform future.
• Web to print development where native online players
launch ‘old-school‘ print magazines.
Online media• Nearly all Dutch print publications have an online representation.
5.9 million people visit one or more of these digital platforms of
magazines once a month and 37% reaches the magazine brands
through social media.
• The amount of Dutch travel blogs and vlogs has grown
exponentially over the last years. Image-led content, like posts on
Instagram, has the most influence on travel behaviour.
(TravelNext). Most Dutch influencers share their content in English,
so they have a global rather than a local reach.
• 12 million Dutch people have installed WhatsApp on their
smartphones. 9.6 million of those use the messaging app daily,
11.3 million at least once a week. WhatsApp is used more than
Facebook and Snapchat. The Facebook app has been installed
9.2 million times and is used daily by 77% of those downloaders.
Snapchat is used daily by 2.1 million people.
2.4 Reaching the consumer: magazines and online media
Source: MMA, TravelNext
Market and Trade Profile Netherlands
2.4 Reaching the consumer: social media on holiday
45
Source: VisitBritain/IPSOS 2016, base: all respondents: Have you used social media in any of the following ways whilst on your last holiday to Britain (visitors) /on your last holiday to a foreign
destination (considerers)?
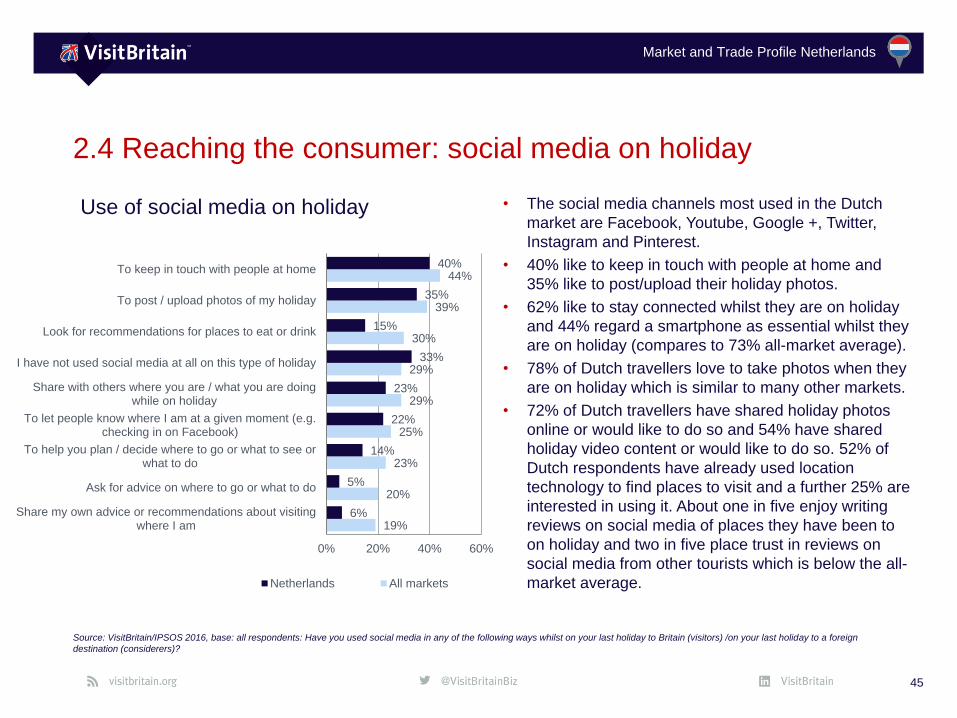
Use of social media on holiday • The social media channels most used in the Dutch
market are Facebook, Youtube, Google +, Twitter,
Instagram and Pinterest.
• 40% like to keep in touch with people at home and
35% like to post/upload their holiday photos.
• 62% like to stay connected whilst they are on holiday
and 44% regard a smartphone as essential whilst they
are on holiday (compares to 73% all-market average).
• 78% of Dutch travellers love to take photos when they
are on holiday which is similar to many other markets.
• 72% of Dutch travellers have shared holiday photos
online or would like to do so and 54% have shared
holiday video content or would like to do so. 52% of
Dutch respondents have already used location
technology to find places to visit and a further 25% are
interested in using it. About one in five enjoy writing
reviews on social media of places they have been to
on holiday and two in five place trust in reviews on
social media from other tourists which is below the all-
market average.
19%
20%
23%
25%
29%
29%
30%
39%
44%
6%
5%
14%
22%
23%
33%
15%
35%
40%
0% 20% 40% 60%
Share my own advice or recommendations about visitingwhere I am
Ask for advice on where to go or what to do
To help you plan / decide where to go or what to see orwhat to do
To let people know where I am at a given moment (e.g.checking in on Facebook)
Share with others where you are / what you are doingwhile on holiday
I have not used social media at all on this type of holiday
Look for recommendations for places to eat or drink
To post / upload photos of my holiday
To keep in touch with people at home
Netherlands All markets
Market and Trade Profile Netherlands
6%
6%
9%
9%
11%
12%
12%
14%
14%
15%
15%
15%
16%
16%
17%
18%
18%
19%
19%
22%
25%
25%
26%
26%
30%
31%
33%
40%
3%
4%
7%
3%
7%
6%
7%
8%
5%
12%
16%
9%
9%
9%
11%
17%
16%
17%
14%
19%
32%
19%
53%
27%
37%
44%
54%
52%
0% 10% 20% 30% 40% 50% 60%
Information in radio adverts
Travel programme on radio
Images / information on billboards / poster adverts
Seeing social media posts from celebrities talking about their holiday destinations
Images / information in TV adverts
Articles on an online encyclopaedia e.g. Wikipedia, Wikitravel
Images / information in adverts in a magazine or newspaper
Travel app
Images or videos from a photo/video sharing social network site
A special offer or price deal you saw advertised offline e.g. in a newspaper, magazine or on TV
Images / information in online adverts
Images or videos your friends or family have posted to social media
Direct advice from a travel agent/tour operator (face-to-face, over the phone)
A travel feature / article in a magazine or newspaper
An official tourist brochure for the country / city / region
An official tourist organisation website or social media site for the country or destination
Travel agent or tour operator brochure
A special offer or price deal you saw advertised online
Travel programme on TV
Travel blogs / forums
Travel agent or tour operator website
A travel guidebook
An accommodation provider/ hotel website
Talking to friends or family in your social network (e.g. via Facebook / Twitter)
Websites providing traveller reviews of destinations [e.g. TripAdvisor]
Looking at prices of holidays/flights on price comparison websites
Information from search engines [e.g. Google]
Talking to friends / relatives / colleagues
Netherlands All markets
2.4 Reaching the consumer: influences
46
Source: VisitBritain/IPSOS 2016, base visitors & considerers. Which of the following sources influenced your choice of destination? (Market scores have been adjusted so that the sum of all influences
for each market is equivalent to the global total, to enable meaningful comparisons)
Influences on destination choice
Market and Trade Profile Netherlands
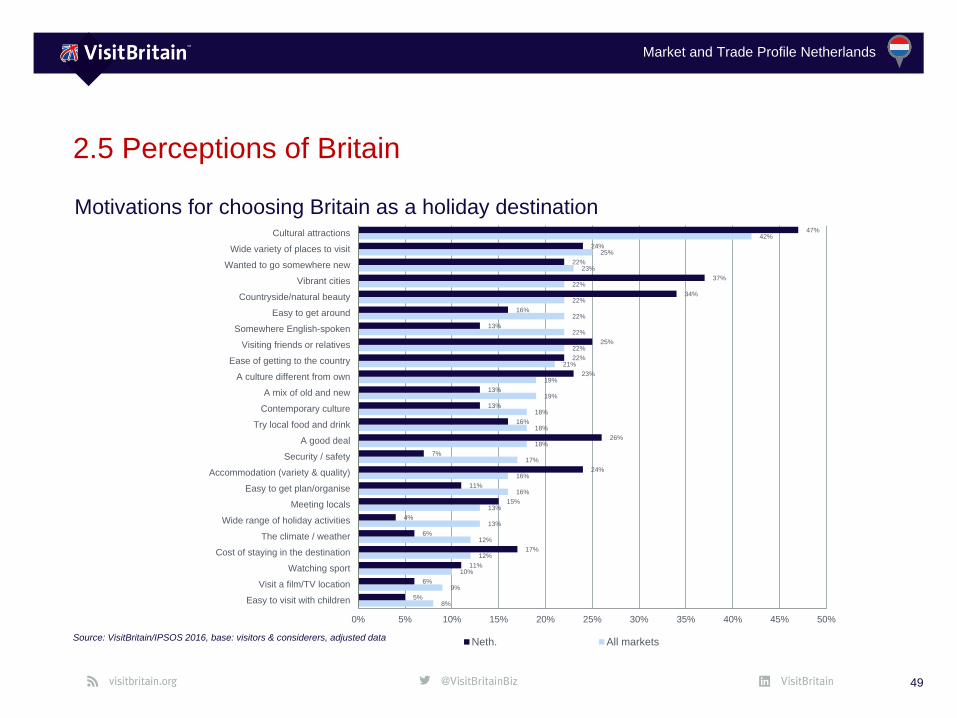
• Amongst the most important reasons for choosing Britain as a
holiday destination, Dutch respondents stated cultural attractions,
vibrant cities and the countryside/natural beauty followed by a
good deal, visiting friends and/or relatives as well as a wide variety
of places to visit and the quality and variety of the accommodation.
• Australia, USA and Italy are the destinations that the Dutch
consider the ‘best place’ for delivering the things they most want
from a holiday destination.
• Areas of strength for Britain include entertainment and nightlife,
visiting places with a lot of history/historic sites, watching sporting
events, soaking up the atmoshpere, the ease of getting around and
good shopping. Very few consider Britain as the ‘best place for
‘food and drink’ – or to experience something new, which indicates
high levels of familiarity with Britain as a destination.
47
2.5 Perceptions of Britain
Source: Arkenford 2013, VisitBritain/IPSOS 2016
Biggest draws for Dutch holiday visitors:
Cultural attractions,
vibrant cities and countryside
Market and Trade Profile Netherlands
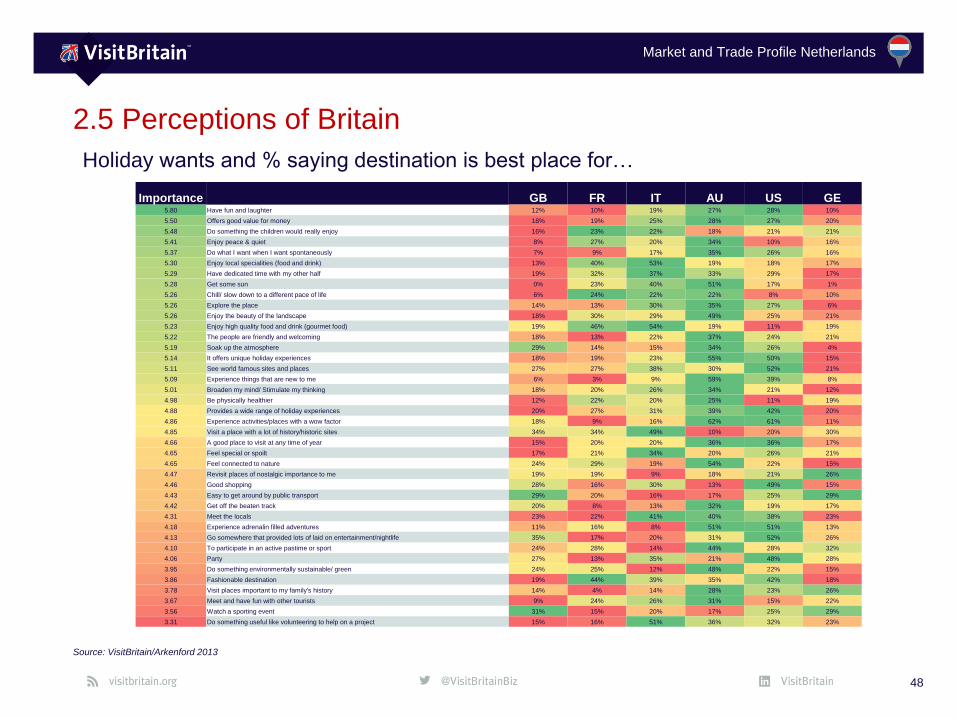
2.5 Perceptions of Britain
48
Holiday wants and % saying destination is best place for…
Source: VisitBritain/Arkenford 2013
Importance GB FR IT AU US GE5.80 Have fun and laughter 12% 10% 19% 27% 28% 10%
5.50 Offers good value for money 18% 19% 25% 28% 27% 20%
5.48 Do something the children would really enjoy 16% 23% 22% 18% 21% 21%
5.41 Enjoy peace & quiet 8% 27% 20% 34% 10% 16%
5.37 Do what I want when I want spontaneously 7% 9% 17% 35% 26% 16%
5.30 Enjoy local specialities (food and drink) 13% 40% 53% 19% 18% 17%
5.29 Have dedicated time with my other half 19% 32% 37% 33% 29% 17%
5.28 Get some sun 0% 23% 40% 51% 17% 1%
5.26 Chill/ slow down to a different pace of life 6% 24% 22% 22% 8% 10%
5.26 Explore the place 14% 13% 30% 35% 27% 6%
5.26 Enjoy the beauty of the landscape 18% 30% 29% 49% 25% 21%
5.23 Enjoy high quality food and drink (gourmet food) 19% 46% 54% 19% 11% 19%
5.22 The people are friendly and welcoming 18% 13% 22% 37% 24% 21%
5.19 Soak up the atmosphere 29% 14% 15% 34% 26% 4%
5.14 It offers unique holiday experiences 18% 19% 23% 55% 50% 15%
5.11 See world famous sites and places 27% 27% 38% 30% 52% 21%
5.09 Experience things that are new to me 6% 3% 9% 59% 39% 8%
5.01 Broaden my mind/ Stimulate my thinking 18% 20% 26% 34% 21% 12%
4.98 Be physically healthier 12% 22% 20% 25% 11% 19%
4.88 Provides a wide range of holiday experiences 20% 27% 31% 39% 42% 20%
4.86 Experience activities/places with a wow factor 18% 9% 16% 62% 61% 11%
4.85 Visit a place with a lot of history/historic sites 34% 34% 49% 10% 20% 30%
4.66 A good place to visit at any time of year 15% 20% 20% 36% 36% 17%
4.65 Feel special or spoilt 17% 21% 34% 20% 26% 21%
4.65 Feel connected to nature 24% 29% 19% 54% 22% 15%
4.47 Revisit places of nostalgic importance to me 19% 19% 9% 18% 21% 26%
4.46 Good shopping 28% 16% 30% 13% 49% 15%
4.43 Easy to get around by public transport 29% 20% 16% 17% 25% 29%
4.42 Get off the beaten track 20% 8% 13% 32% 19% 17%
4.31 Meet the locals 23% 22% 41% 40% 38% 23%
4.18 Experience adrenalin filled adventures 11% 16% 8% 51% 51% 13%
4.13 Go somewhere that provided lots of laid on entertainment/nightlife 35% 17% 20% 31% 52% 26%
4.10 To participate in an active pastime or sport 24% 28% 14% 44% 28% 32%
4.06 Party 27% 13% 35% 21% 48% 28%
3.95 Do something environmentally sustainable/ green 24% 25% 12% 48% 22% 15%
3.86 Fashionable destination 19% 44% 39% 35% 42% 18%
3.78 Visit places important to my family's history 14% 4% 14% 28% 23% 26%
3.67 Meet and have fun with other tourists 9% 24% 26% 31% 15% 22%
3.56 Watch a sporting event 31% 15% 20% 17% 25% 29%
3.31 Do something useful like volunteering to help on a project 15% 16% 51% 36% 32% 23%
Market and Trade Profile Netherlands
2.5 Perceptions of Britain
49
Source: VisitBritain/IPSOS 2016, base: visitors & considerers, adjusted data
Motivations for choosing Britain as a holiday destination
8%
9%
10%
12%
12%
13%
13%
16%
16%
17%
18%
18%
18%
19%
19%
21%
22%
22%
22%
22%
22%
23%
25%
42%
5%
6%
11%
17%
6%
4%
15%
11%
24%
7%
26%
16%
13%
13%
23%
22%
25%
13%
16%
34%
37%
22%
24%
47%
0% 5% 10% 15% 20% 25% 30% 35% 40% 45% 50%
Easy to visit with children
Visit a film/TV location
Watching sport
Cost of staying in the destination
The climate / weather
Wide range of holiday activities
Meeting locals
Easy to get plan/organise
Accommodation (variety & quality)
Security / safety
A good deal
Try local food and drink
Contemporary culture
A mix of old and new
A culture different from own
Ease of getting to the country
Visiting friends or relatives
Somewhere English-spoken
Easy to get around
Countryside/natural beauty
Vibrant cities
Wanted to go somewhere new
Wide variety of places to visit
Cultural attractions
Neth. All markets
Market and Trade Profile Netherlands
Access and travel
trade
Chapter 3:
50
Market and Trade Profile Netherlands
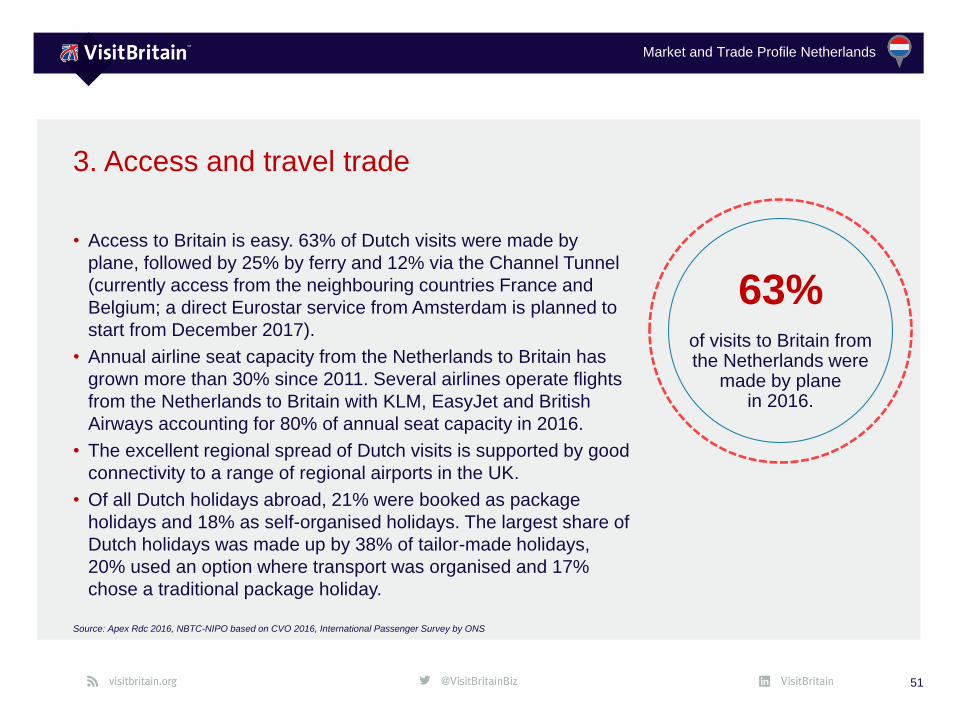
• Access to Britain is easy. 63% of Dutch visits were made by
plane, followed by 25% by ferry and 12% via the Channel Tunnel
(currently access from the neighbouring countries France and
Belgium; a direct Eurostar service from Amsterdam is planned to
start from December 2017).
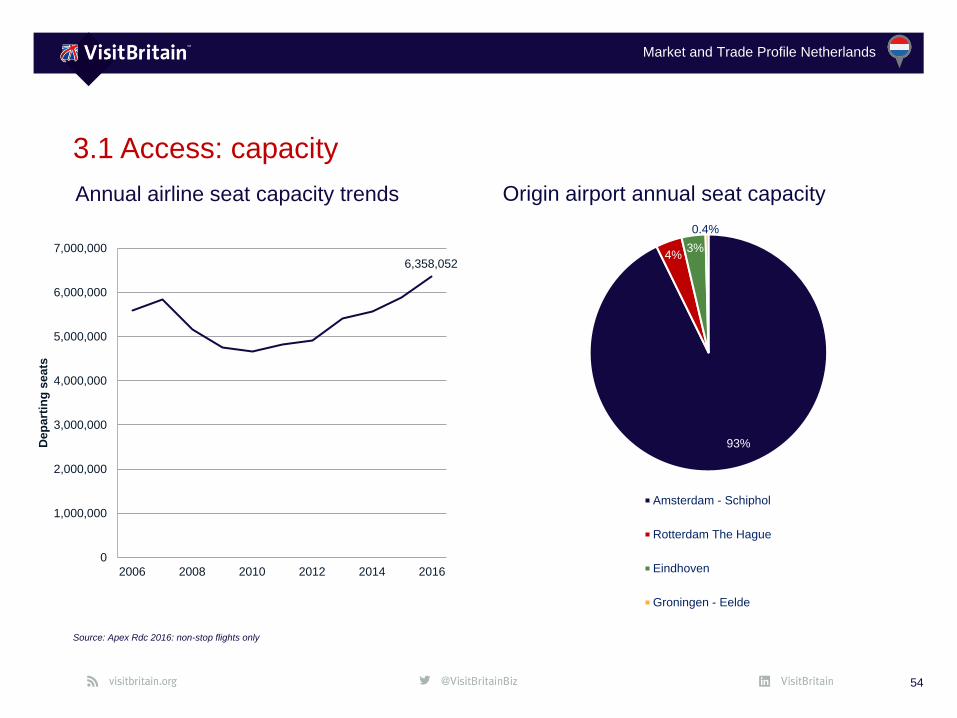
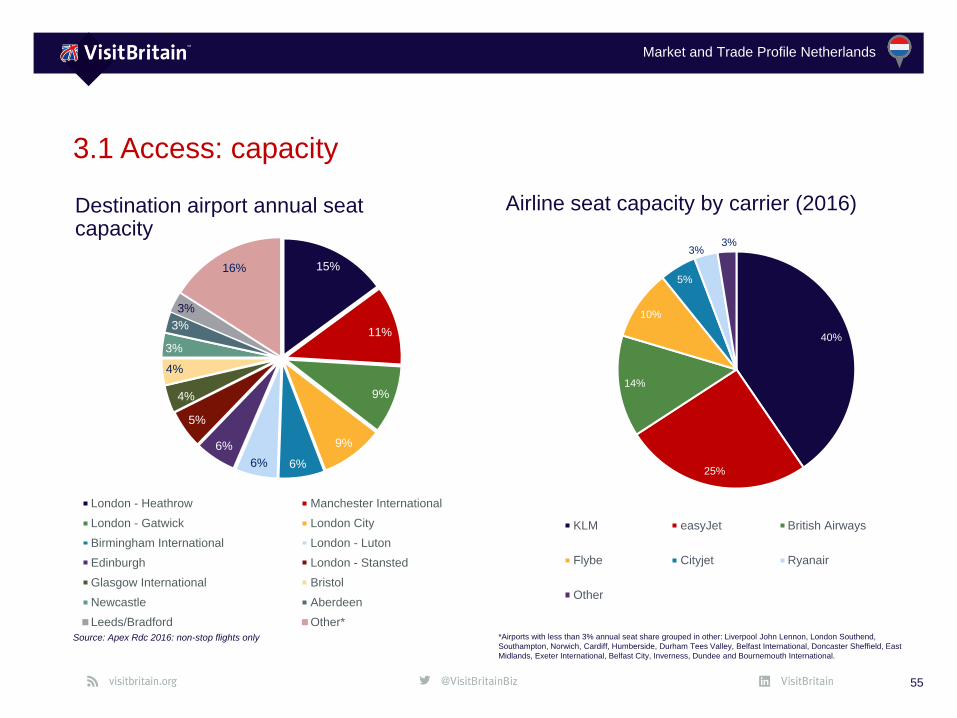
• Annual airline seat capacity from the Netherlands to Britain has
grown more than 30% since 2011. Several airlines operate flights
from the Netherlands to Britain with KLM, EasyJet and British
Airways accounting for 80% of annual seat capacity in 2016.
• The excellent regional spread of Dutch visits is supported by good
connectivity to a range of regional airports in the UK.
• Of all Dutch holidays abroad, 21% were booked as package
holidays and 18% as self-organised holidays. The largest share of
Dutch holidays was made up by 38% of tailor-made holidays,
20% used an option where transport was organised and 17%
chose a traditional package holiday.
51
3. Access and travel trade
Source: Apex Rdc 2016, NBTC-NIPO based on CVO 2016, International Passenger Survey by ONS
63%of visits to Britain from the Netherlands were
made by planein 2016.
Market and Trade Profile Netherlands
3.1 Access: key facts
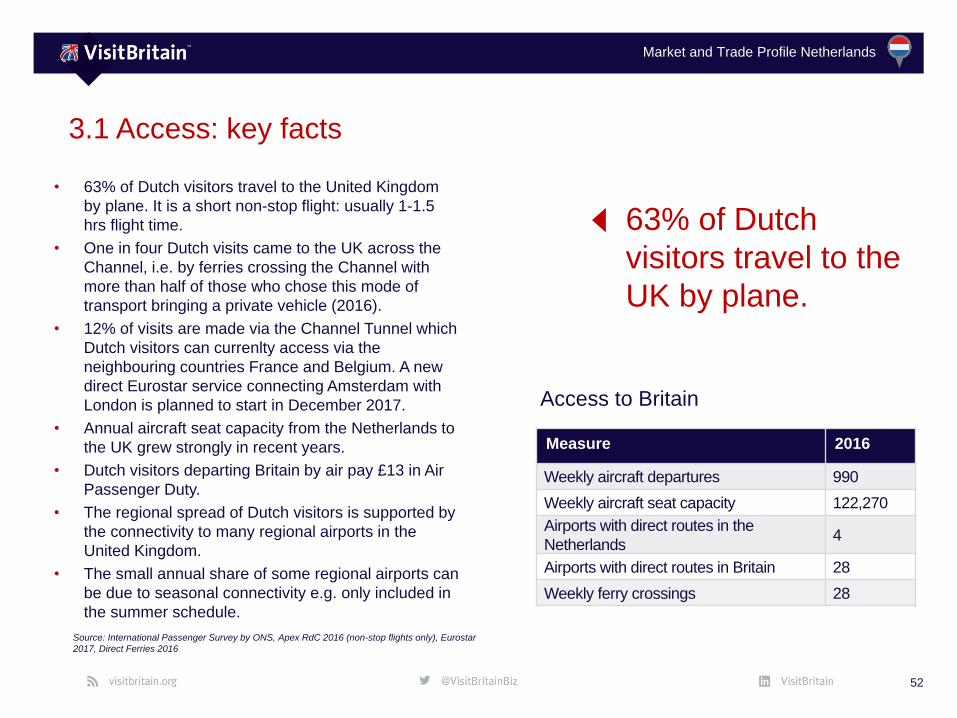
• 63% of Dutch visitors travel to the United Kingdom
by plane. It is a short non-stop flight: usually 1-1.5
hrs flight time.
• One in four Dutch visits came to the UK across the
Channel, i.e. by ferries crossing the Channel with
more than half of those who chose this mode of
transport bringing a private vehicle (2016).
• 12% of visits are made via the Channel Tunnel which
Dutch visitors can currenlty access via the
neighbouring countries France and Belgium. A new
direct Eurostar service connecting Amsterdam with
London is planned to start in December 2017.
• Annual aircraft seat capacity from the Netherlands to
the UK grew strongly in recent years.
• Dutch visitors departing Britain by air pay £13 in Air
Passenger Duty.
• The regional spread of Dutch visitors is supported by
the connectivity to many regional airports in the
United Kingdom.
• The small annual share of some regional airports can
be due to seasonal connectivity e.g. only included in
the summer schedule.
52
63% of Dutch
visitors travel to the
UK by plane.
Source: International Passenger Survey by ONS, Apex RdC 2016 (non-stop flights only), Eurostar
2017, Direct Ferries 2016
Measure 2016
Weekly aircraft departures 990
Weekly aircraft seat capacity 122,270
Airports with direct routes in the
Netherlands4
Airports with direct routes in Britain 28
Weekly ferry crossings 28
Access to Britain
Market and Trade Profile Netherlands
3.1 Access: mode of transport
53
Source: International Passenger Survey by ONS
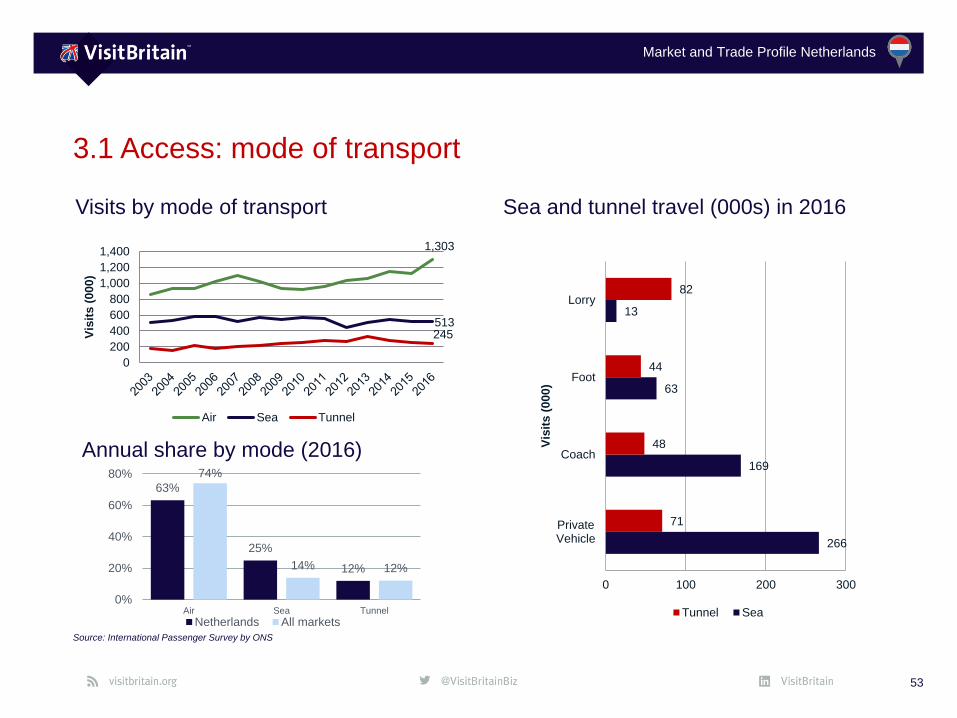
Visits by mode of transport Sea and tunnel travel (000s) in 2016
1,303
513 245
0
200
400
600
800
1,000
1,200
1,400
Vis
its (
000)
Air Sea Tunnel
Annual share by mode (2016)
63%
25%
12%
74%
14% 12%
0%
20%
40%
60%
80%
Air Sea Tunnel
Netherlands All markets
266
169
63
13
71
48
44
82
0 100 200 300
PrivateVehicle
Coach
Foot
Lorry
Vis
its (
000)
Tunnel Sea
Market and Trade Profile Netherlands
3.1 Access: capacity
54
Source: Apex Rdc 2016: non-stop flights only
Annual airline seat capacity trends Origin airport annual seat capacity
93%
4%3%
0.4%
Amsterdam - Schiphol
Rotterdam The Hague
Eindhoven
Groningen - Eelde
6,358,052
0
1,000,000
2,000,000
3,000,000
4,000,000
5,000,000
6,000,000
7,000,000
2006 2008 2010 2012 2014 2016
Dep
art
ing
seats
Market and Trade Profile Netherlands
3.1 Access: capacity
55
Airline seat capacity by carrier (2016)
Source: Apex Rdc 2016: non-stop flights only
Destination airport annual seat capacity
*Airports with less than 3% annual seat share grouped in other: Liverpool John Lennon, London Southend,
Southampton, Norwich, Cardiff, Humberside, Durham Tees Valley, Belfast International, Doncaster Sheffield, East
Midlands, Exeter International, Belfast City, Inverness, Dundee and Bournemouth International.
15%
11%
9%
9%
6%6%
6%
5%
4%
4%
3%
3%
3%
16%
London - Heathrow Manchester International
London - Gatwick London City
Birmingham International London - Luton
Edinburgh London - Stansted
Glasgow International Bristol
Newcastle Aberdeen
Leeds/Bradford Other*
40%
25%
14%
10%
5%
3%3%
KLM easyJet British Airways
Flybe Cityjet Ryanair
Other
Market and Trade Profile Netherlands
• The Dutch travel trade is made up of tour operators, coach
operators and travel agents. However, it is also made up of
schools and associations that organise trips for their
members/students through the travel trade. Niche operators
are becoming more popular and there is a higher demand for
niche holidays which requires operators to expand their
current offer.
• The Dutch operators can be found all over the Netherlands
but as it is a small country it might be possible to schedule
several visits in one day.
• Many Dutch operators who offer Britain as a destination offer
touring holidays, short breaks or city trips.
• The Dutch tour operators work both with DMCs and ground
handlers but also contract packages directly.
• For Britain a range of smaller and specialist operators are
also important.
56
3.2 Travel trade: general overview
Many tour operators who feature Britain offer touring
holidays, short breaks andcity trips.
Market and Trade Profile Netherlands
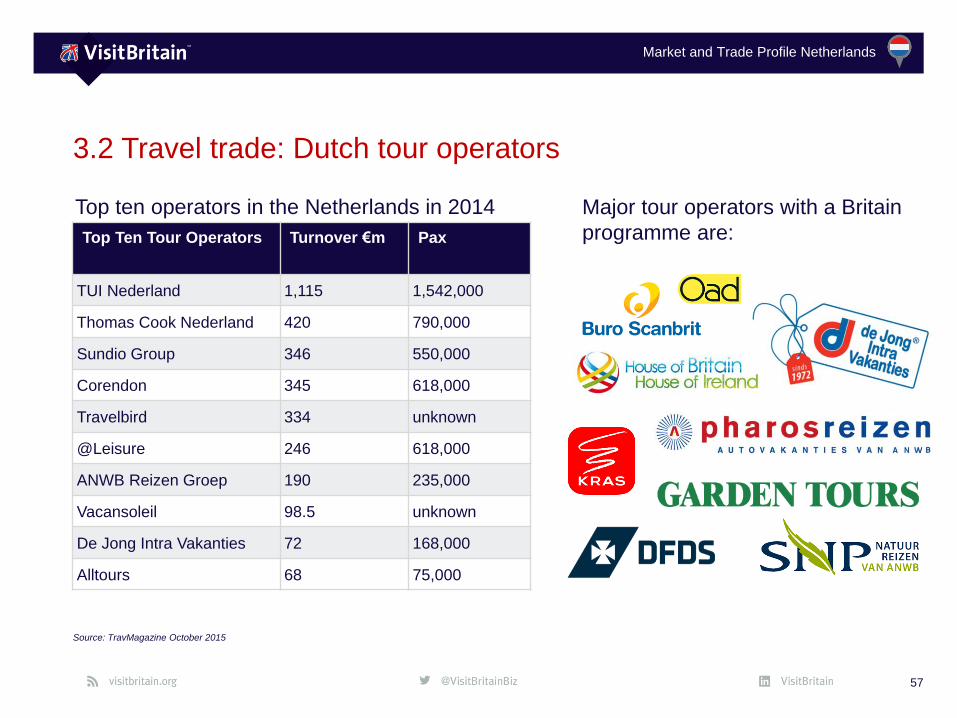
3.2 Travel trade: Dutch tour operators
57
Source: TravMagazine October 2015
Top Ten Tour Operators Turnover €m Pax
TUI Nederland 1,115 1,542,000
Thomas Cook Nederland 420 790,000
Sundio Group 346 550,000
Corendon 345 618,000
Travelbird 334 unknown
@Leisure 246 618,000
ANWB Reizen Groep 190 235,000
Vacansoleil 98.5 unknown
De Jong Intra Vakanties 72 168,000
Alltours 68 75,000
Top ten operators in the Netherlands in 2014 Major tour operators with a Britain
programme are:
Market and Trade Profile Netherlands
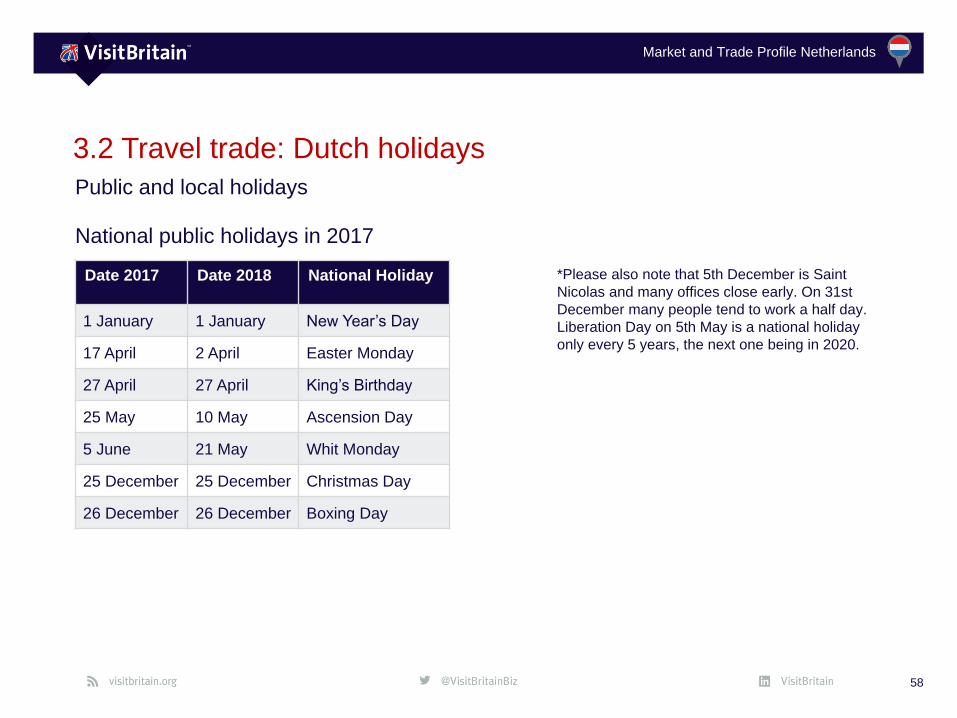
3.2 Travel trade: Dutch holidays
58
National public holidays in 2017
Public and local holidays
Date 2017 Date 2018 National Holiday
1 January 1 January New Year’s Day
17 April 2 April Easter Monday
27 April 27 April King’s Birthday
25 May 10 May Ascension Day
5 June 21 May Whit Monday
25 December 25 December Christmas Day
26 December 26 December Boxing Day
*Please also note that 5th December is Saint
Nicolas and many offices close early. On 31st
December many people tend to work a half day.
Liberation Day on 5th May is a national holiday
only every 5 years, the next one being in 2020.
Market and Trade Profile Netherlands
3.2 Travel trade: practical information
General practical information:
• Business hours are usually 09:00 – 17:00 (with a 30
minute lunch break).
• When introduced expect to shake hands. Be careful of
using first names until invited. Until then, please call
them Mr. or Mrs.
• Check your trip does not coincide with the summer
months, during this time many of your business partners
will be on holidays or on contracting trips (an opportunity
to potentially meet them in Britain). The Carnival period
in the South of the country is also best avoided.
• Dress code: The Dutch tend to dress informally although
business dress is appreciated for meetings.
• Business Meeting Etiquette: Appointments are
mandatory and should be made one to two weeks in
advance and reconfirm the day before. Punctuality is
important. If you expect to be delayed, telephone and offer
an explanation.
• Meetings are important to the Dutch. Many are familiar
with doing business with foreigners as the Netherlands
has a long history of international trade. The Dutch tend
to appreciate a direct and forthright approach which is to
the point. In general, ideas will be discussed openly at
meetings.
• The Dutch tend to take a long-term perspective when
looking at business, so be clear what your company‘s
intensions are. It is also important to demostrate how the
relationship would be mutually beneficial. When coming to
an agreement it is regarded as binding for both sides.
• Send potential business partners your sales
documentation in advance so that they can prepare for the
meeting.
• Follow up after your meeting and renew contact regularly
to develop a business relationship.
59
Market and Trade Profile Netherlands
3.2 Travel trade: sales calls
Sales calls
The travel trade in the Netherlands is spread all over the
country. As it is small you might find that you can visit more
than one trade partner in one day. Before you embark on a
sales visit to the Netherlands, VisitBritain recommends that
you take the following steps:
• Provide the operators you are visiting with a
comprehensive information pack about your products,
ideally in advance so they can prepare for the meeting.
• On your return to Britain ensure that you follow up quickly
and renew contact regularly.
• The Dutch trade tends to plan 12-18 months in advance.
Spring is used for contracting and visiting UK suppliers. In
the fall the new programmes and brochures are produced.
Generally speaking, new programmes and/or brochures
are released at the end of November or the beginning of
December.
• Keep in touch with VisitBritain; let us know about your
progress. Regular market intelligence is essential for our
future plans and activities.
• It is also important to note that a significant number of the
key Britain players attend VisitBritain’s ExploreGB
workshop, Best of Britain, BIM Marketplace and
VisitScotland Expo. Please contact VisitBritain London for
details of those attending. Some operators also visit World
Travel Market but register with the organisers
independently.
60
Market and Trade Profile Netherlands
3.2 Travel trade: hospitality etiquette
61
Hospitality etiquette
If there is the opportunity it is a good idea to take your
Dutch business partner out for a meal (lunch is more
common than dinner as the Dutch working population
tends to appreciate their private time after work) – either
to build up a relationship or to thank them for business
given in the past. Here are some practical tips to help you
plan this:
• When choosing a restaurant please make sure to
check beforehand if credit cards are accepted and
bring sufficient cash if this is not the case. VISA and
Mastercard are the most commonly accepted.
• Arrive on time and if possible, before the invite, as
punctuality indicates reliability.
• If you order water you will be asked if you want mineral
still or sparkling; the ‘kraanwater’ (tap water) is another
common option.
• It is common practice to eat sandwiches for lunch.
Generally speaking, the Dutch do not expect a
business lunch to include a 3- or 4-course meal.
• Service and VAT are included in the menu price in
restaurants and bars. It is still typical to ‘round up’ the
amount to some more-or-less round figure. A rule of
thumb is to add 5-10% to a full Euro amount.
Market and Trade Profile Netherlands
3.3 Caring for the consumer
62
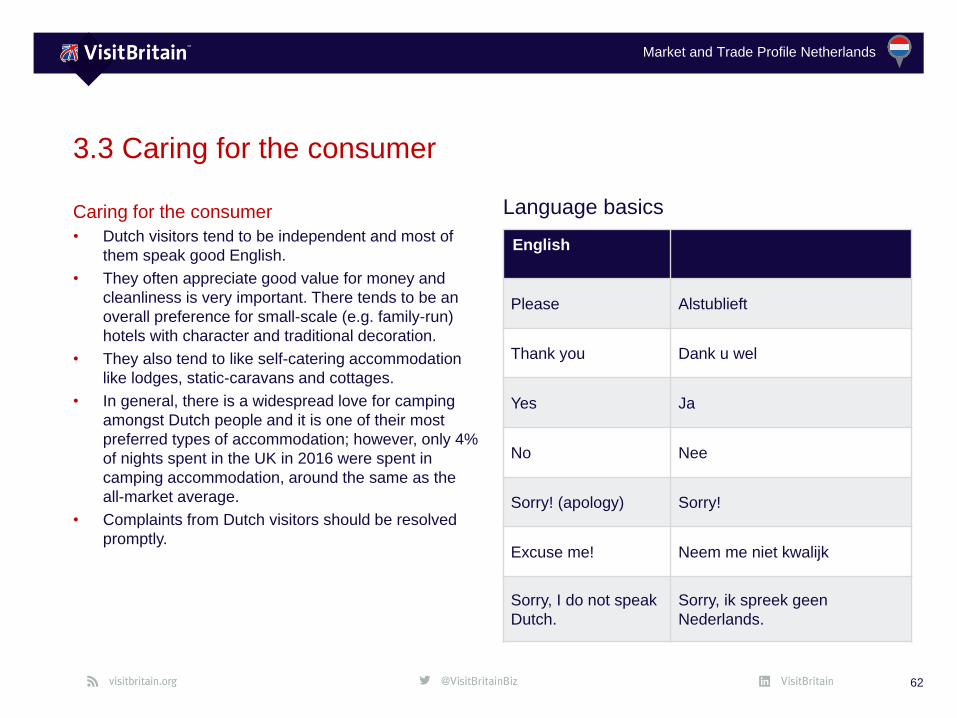
Language basics
English
Please Alstublieft
Thank you Dank u wel
Yes Ja
No Nee
Sorry! (apology) Sorry!
Excuse me! Neem me niet kwalijk
Sorry, I do not speak
Dutch.
Sorry, ik spreek geen
Nederlands.
Caring for the consumer
• Dutch visitors tend to be independent and most of
them speak good English.
• They often appreciate good value for money and
cleanliness is very important. There tends to be an
overall preference for small-scale (e.g. family-run)
hotels with character and traditional decoration.
• They also tend to like self-catering accommodation
like lodges, static-caravans and cottages.
• In general, there is a widespread love for camping
amongst Dutch people and it is one of their most
preferred types of accommodation; however, only 4%
of nights spent in the UK in 2016 were spent in
camping accommodation, around the same as the
all-market average.
• Complaints from Dutch visitors should be resolved
promptly.
Market and Trade Profile Netherlands
3.3 Caring for the Consumer
63
Caring for the Consumer:
• The Dutch tend to be sceptical about traditional
British cuisine. However, Celebrity Chefs (Jamie
Oliver, Gordon Ramsey, Gary Rhodes, Rick Stein)
have positively influenced perceptions.
• The Dutch appreciate value for money when they go
out for dinner. British gastro pubs seem like a well-
suited option for the Dutch as they enjoy the
atmosphere of a traditional pub.
• Dutch guests tend to enjoy a simple breakfast in the
morning and it is rare for them to prepare a cooked
breakfast at home, but while visiting Britain many do
enjoy a traditional full English breakfast.
• The Dutch tend to only invite people for dinner whom
they are closely acquainted to. Instead, coffee has a
strong social significance. Neighbours often invite
each other over for a cup of coffee, and the morning
coffee break at work is a true institution.
• The Dutch are also very fond of drinking tea and
having a traditional afternoon-tea while in Britain is
often high on the wish list.
• The debit card (‘pinpas‘) is the most popular way of
paying while on holiday to avoid cash payments.
Market and Trade Profile Netherlands
3.3 Caring for the consumer: Dutch language tips
64
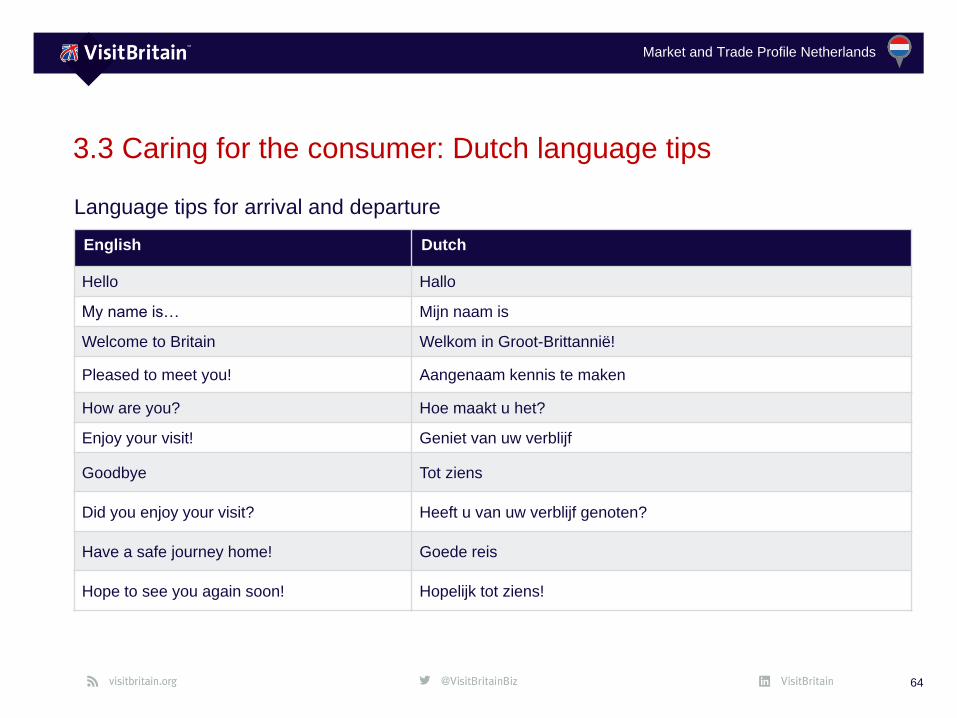
Language tips for arrival and departure
English Dutch
Hello Hallo
My name is… Mijn naam is
Welcome to Britain Welkom in Groot-Brittannië!
Pleased to meet you! Aangenaam kennis te maken
How are you? Hoe maakt u het?
Enjoy your visit! Geniet van uw verblijf
Goodbye Tot ziens
Did you enjoy your visit? Heeft u van uw verblijf genoten?
Have a safe journey home! Goede reis
Hope to see you again soon! Hopelijk tot ziens!
Market and Trade Profile Netherlands
We can help you extend your reach
through:• Digital and social media such as through
Twitter, our Facebook page – Love GREAT
Britain, or Pinterest.
• Press and PR by sending us your newsworthy
stories or hosting our journalists and broadcast
crew
• Leisure, and the business travel trade via our
programme of sales missions, workshops and
exhibitions or promotion to our qualified
Britagents and supplier directory
• Print advertising in targeted media/Britain
supplements
• Retailing your product through the VisitBritain
shop
• Or as a major campaign partner
65
3.4 Working with VisitBritain
We are here to support you and look
forward to working with you.
To find out more browse our
opportunity search
(visitbritain.org/opportunities)
or trade website
(trade.visitbritain.com)
or contact the B2B events team
(Email: [email protected])
or campaign partnerships team
(Email: [email protected])
or trade support team
(Email: [email protected])
Market and Trade Profile Netherlands
We have dedicated research and insights
available which include:
• Latest monthly and quarterly data from the
International Passenger Survey by ONS
(visitbritain.org/latest-monthly-data
visitbritain.org/latest-quarterly-data-uk-overall
visitbritain.org/latest-quarterly-data-area)
• Inbound Tourism Trends by Market
visitbritain.org/inbound-tourism-trends
• Sector-specific research
visitbritain.org/sector-specifc-research
• 2017 Inbound Tourism Forecast
visitbritain.org/forecast
• Britain‘s competitiveness
visitbritain.org/britains-competitiveness
66
3.5 Useful research resources
We are here to support you and look
forward to working with you.
To find out more about the Dutch or other
inbound markets browse
our markets & segments pages or
(visitbritain.org/markets-segments)
our inbound research & insights or
(visitbritain.org/inbound-research-insights)
contact us directly
(Email: [email protected])
Market and Trade Profile Netherlands
We have dedicated research and insights
available which include:
• Planning, decision-making and booking cycle of
international leisure visitors to Britain
https://www.visitbritain.org/understanding-
international-visitors
• Technology and social media
https://www.visitbritain.org/understanding-
international-visitors
• Gateways in England, insights on overseas
visitors to England's regions, participation in
leisure activities, multi-destination trips and
more
visitbritain.org/visitor-characteristics-and-
behaviour
67
3.5 Useful market-specific research resources
We are here to support you and look
forward to working with you.
To find out more about the Dutch or other
inbound markets browse
our markets & segments pages or
(visitbritain.org/markets-segments)
our inbound research & insights or
(visitbritain.org/inbound-research-insights)
contact us directly
(Email: [email protected])
Market and Trade Profile Netherlands
Market and
Trade Profile: Netherlands