market risk-adjusted dividend policy and price-to-book...
TRANSCRIPT

1
Market Risk-Adjusted Dividend Policy and Price-to-Book Ratio
Tarek Ibrahim Eldomiaty
Professor of Finance
British University in Egypt
Faculty of Business Administration, Economics and Political Science
PO Box – 43 - 11837
Cairo
EGYPT
(Tel: +202 2687-5892/3)
(Fax: +202 26875889 / 97)
E-mail: [email protected]
July 2012

2
Market Risk-Adjusted Dividend Policy and Price-to-Book Ratio
Abstract
This paper offers a new mathematical formulation that addresses the relationship
between expected price-to-book ratio, dividend per share, dividend payout ratio,
systematic and unsystematic risks. The sample includes the non-financial firms in
the DJIA covering the period 1997-2006. The general results show that the
expected price-to-book ratios are: (a) positively associated with the expected
dividend payout ratios, (b) negatively associated with the current dividend payout
ratios, (c) due to an improvement in the expected firm profitability.
The paper contributes to the current literature in two ways. First, the variations in
price-to-book ratios, systematic and unsystematic risks are not due to dividends
per se. Second, the relationships between expected price-to-book ratio and
dividend payout ratios are intrinsically nonlinear, which is not addressed in the
relevant literature. Third, the expected dividend payout ratios can be used
efficiently for signaling purposes as well as a proxy for measuring the agency
problem.
JEL classification: G32, G35
Key Words: Dividend Signaling Hypotheses, Systematic Risk, Unsystematic Risk,
Price-to-Book Ratio, DJIA

3
Introduction
The advances in the literature of corporate finance have raised the necessity to
further examine two issues. First, what are the impacts of different types of risks
on the financial decisions? Second, what are the impacts of corporate financial
decisions on the market? This paper develops a mathematical formulation that
integrates the basic components of a dividends policy (dividends per share and
dividends payout ratio) and shareholder value. This integration includes also the
impacts of systematic and unsystematic risks on shareholder value.
Shareholders’ reaction towards dividends has been subject to an on-going
research. The literature cites mixed results: positive and negative effects on stock
returns. These effects are known in the literature as “Dividends Signaling
Hypotheses.” This paper examines the effects of dividends per share and
dividends payout ratios on price-to-book ratio (being used as a proxy for the
shareholder value). The paper adopts the risk-return approach which is a new
approach suggested by the author for testing the dividend signaling hypothesis.
The return part considers the two elements of a dividend policy: dividend per
share and dividend payout ratio. The risk part considers the systematic and
unsystematic risk.
Concerning the return part, the Dividend Yield (DY) ratio is employed to come up
with a relationship between dividends and shareholder value. The mathematical
derivation is described in part II. The risk part considers the use of dividend yield
as a suggested method for the calculation of systematic and unsystematic risk in
addition to the conventional approach that uses the stock returns.
Objectives of the Study
This paper aims at examining the objectives that follow.
1. Examine the effects of the dividends per share on price-to-book ratio.
2. Examine the effects of the dividend payout ratio on the price-to-book ratio.
3. Examine the effects of systematic risk-adjusted dividends on price-to-book
ratio.
4. Examine the effects of unsystematic risk-adjusted dividends on price-to-
book ratio.
4
5. Examine the most important factors (among the above mentioned factors)
that can be used to improve price-to-book ratio.
Contribution of the Study
This study contributes to the current literature as follows.
1- The study offers a mathematical formulation that adjusts dividends
according to the systematic as well as the unsystematic risks.
2- The study offers an integrated model that recognizes both dividends and
risk-adjusted dividends.
3- The study offers a mathematical formulation that links risk-adjusted
dividends to price-to-book ratio which is used in the literature as one
proxy for shareholder value.
The paper is organized as follows. Section I discusses the theoretical background
of dividends decisions. Section II discusses the elements of the methodology such
as a mathematical formulation that integrates expected price-to-book ratio,
dividends per share, dividends payout ratio, systematic risk and unsystematic risk.
Section II includes also the development of research hypotheses and model
estimation. Section III reports and discusses the results. Section IV concludes.
Corporate Dividend Policy: Theoretical Background
Explaining dividend policy has been one of the most difficult challenges facing
financial economists. For long time this topic has been studied without being
understood completely, there is still the unsolved question which factors influence
the dividend policy and how are those factors interacting. Black (1976) states that:
“The harder we look at the dividend picture, the more it seems like a puzzle, with
pieces that just don’t fit together”. The situation is almost the same today. Allen
and Michaely (1995) concluded that “much more empirical and theoretical
research on the subject of dividends is required before a consensus can be
reached”.
The first empirical study of dividend policy was provided by Lintner (1956), who
surveyed corporate managers to understand how they arrived at the dividend
policy.

5
He concluded that managers usually have reasonably definitive target payout
ratios. Miller and Modigliani (1961) prove under conditions of perfect capital
markets, that Firm’s value is independent of its dividend policy. Unfortunately
markets are not perfect and previous studies suggest that the dividend policy
continues to affect the value of common shares as suggested by dividend discount
model.
Dividend Signalling: The Effect of Information Asymmetry
The dividend discount model was very proactive starting point to the extent that
series of research papers examined many aspects of the relationship between
dividends and stock prices. Consequently, a theory of information asymmetry has
been developed and progressed that provides generic explanation of the mutual
effects between changes in prices and changes in dividends. The literature on
information asymmetry, its effects and applications were nobelized due to the
works of George A. Akerlof (1970), Andrew M. Spence (1973, 1974) and Joseph
E. Stiglitz (1981) and Greenwald and Stiglitz (1986).
In the context of corporate finance, it is widely accepted that firm’s managers
have more information regarding the future performance of the firm than its
shareholders do. Watts (1973) proposes that management may use dividends to
convey information to the market and shareholders. Thus, dividend payments
decrease the firm’s information asymmetries. Bhattacharyya (1979) argues that
managers have insider information about the distribution of the paper cash flow
and therefore can, signal this knowledge to the market through their choice of
dividends. Bhattacharyya concludes that the better the news, the higher are the
dividends. Bhattacharyya (1979) argues that some investors need periodic cash
income from their investments. For such investors, the alternatives include
receiving periodic dividends or selling small portions of their investments.
However, selling securities incurs transaction costs. For some investors it may be
more cost efficient to have management pay dividends to generate income instead
of shareholders generating their own income by periodically selling small portions
of their holdings.

6
Significant research in signalling paradigm of dividend policy is presented by
Miller and Rock (1985), John and Williams (1985), Ambarish et al. (1987), and
Williams (1988). These signalling models typically characterize the informational
asymmetry by bestowing the manager or the insider with information about some
aspects of the future cash flow. The equilibrium in these models shows that the
higher the expected cash flow the higher is the dividend. Bar-Yosef and Venezia
(1991) came up with a rational equilibrium expectation model. It states that
Bayesian investors expect that dividends will be proportional to cash flows
because managers have advance information about the future cash flow. Thus,
investors update their belief about the cash flow. Brennan and Thakor (1990)
focus on new questions in this topic assuming that there are two classes of
shareholders - informed and uninformed. They show that in a tender offer the
uninformed shareholder always tenders, whereas the informed holds onto his/her
shares. The situation is reversed in an open market operation, where the informed
shareholder always sells his/her holding and the uninformed never does.
Benartzi et al., (1997) show that a firm’s stock price changes with changes in its
dividend policy. Yet, the factors that affect this relation continue to be topics of
debate and academic research. The propositions that are attempting to explain the
dividend policy include arguments suggesting that (1) the dividend policy serves
as a signal of future earnings growth, (2) investors feel that cash in hand is
superior to an unrealized capital gain, (3) investors value dividends when the
alternative ways to distribute money to shareholders are more costly, and (4) as a
way to decrease the potential waste of resources by management. The issues of
dividend policy have been examined as well. Fama and French (2001) argue that
transaction costs have decreased over time. Therefore, the desirability for
dividends may have decreased as some investors are now creating their own
homemade dividend. Bhattacharyya (2000, 2007) state that research on the effects
of dividends still puzzling.
Dividend Payouts and "Signaling Effect"
Early literature (Graham and Dodd 1951; Durrand 1955) focuses on how the
dividend payout ratio affects common stock prices. It concludes that firms can
affect the market value of their common stock by changing their dividend policy.
Subsequent studies reveal that the relationship between dividends and stock prices

7
is enormously complex and inconclusive. By isolating the impact on systematic
risk, conclusions about how firm value is affected by dividend policy in the
absence of other mitigating factors, can be drawn. Several empirical studies have
focused on how dividend policy affects stock price volatility and the firm's level
of systematic risk. A negative relationship is found between payout ratios and
firms' betas in studies by Beaver, et al. (1970) and Ben-Zion and Shalit (1975).
The thinking behind this theory stems from how variances in dividends affect the
timing of an asset's cash flows. Dyl and Hoffmeister (1986) argue that dividend
policy affects security duration and, ultimately, the riskiness of the underlying
stock.1 A high dividend paying stock has a shorter duration because of more near-
term cash flow. The earlier one receives payment, the less susceptible is the value
of a capital asset to changes in the discount factor. With the dividend in hand,
investors are subject to less interest rate risk, thus reduced level of systematic risk.
All other things being equal, the reduced level of systematic risk will influence the
firm's cost of capital and, eventually, the firm's stock price (Gordon, 1959).
The practice of dividends payout is examined by Brav, et al., (2005) who
surveyed and interviewed 384 financial executives to determine why they pay
dividends. The results of their survey indicate the predictable reasons that include
avoidance of negative consequences, signaling, common stock valuation, making
the firm less risky. Nevertheless, no quantifiable reason is given for how or why
the firm becomes less risky even though financial executives continue to site it as
a reason for paying dividends.
The study of Carter and Schmidt (2008) fills this gap in the literature and
addresses the concerns raised by Dyl and Hoffmeister (1986) by providing a
mathematical model illustrating the relationship between dividend yield and
systematic risk. A significant inverse relationship between a firm's dividend yield
and the corresponding level of systematic risk has been found. This confirms that
a firm's dividend yield should be considered as a determining factor in the
assessment of a firm's level of systematic risk. Moreover, individual firms may be
able to affect the risk level of their common stock by altering their dividend
policy. In so doing, firms may be able to realize the benefits of a lower cost of
1 Duration, as demonstrated by Macaulay (1938), is the elasticity of the value of a capital asset
with respect to changes in the discount factor. It is calculated as the weighted average of the length
of time needed to recover the current cost of the asset.
8
capital and broader access to long term capital markets. At this point, their model
is not robust with regard to signaling effects. This offers a chance for further
research on the signaling issue.
Fama and French (2001) document changes in managerial behavior towards
dividends over the past 25 years. They find that firms that pay dividends usually
have specific characteristics that distinguish them from other firms. Once they
control for these characteristics, they find that firms that posses them have a
declining propensity to pay dividends. Furthermore, they report that these
characteristics are becoming less common in firms who are now listing on stock
exchanges. DeAngelo, et al., (2004) consider the same time period that is
examined by Fama and French (2001) and find that the total payout of dividends
in real dollars has actually increased. This leads to the conclusion that fewer firms
are paying dividends, but those who do pay dividends are actually paying larger
amounts. In addition, DeAngelo, et al., (2000) consider the role of special
dividends in the payout policies. They observe that the use of special dividends as
a way to distribute earnings has been declining. They hypothesize that share
repurchases may have replaced special dividends as a method of returning money
to shareholders when the firm does not want to commit to a higher dividend level.
However, they conclude that special dividends are used less often because they
served as a substitute to regular dividends. Allen and Michaely (2003) provide an
extensive review of the payout policies of corporations including both share
repurchases and dividend payments. They suggest that, historically, dividends
have been the most important form of payout but share repurchases are becoming
a more important part of a firm’s payout policy. For example the average dividend
and share repurchases payouts (payout is defined as dividends paid or expenditure
on repurchases divided by the firm’s earnings) in the 1970s were 38% and 3%
respectively. In the 1980s the average dividend payout increased to 58% while the
average share repurchase payout increased 9 times to 27%. In addition,
corporations smooth dividends relative to earnings, which is not surprising as
Lintner (1956) came to the same conclusion. Lintner found that management sets
the dividend policy first, and then adjusts other policies as needed. For example, if
a firm was undertaking a large investment that requires more cash than was
available, management would not consider cutting the dividend but would instead
look for other sources of capital. The market reacts positively to firms that either

9
increase their dividends or initiate a share repurchase. In contrast, the market
reacts negatively to a firm that decreases its payout policy. Fracassi (2008)
classifies the reasons for positive (negative) price reaction to dividends increases
(decreases). His results provide empirical evidence that positive stock price
response to dividend increases is due primarily to the signaling of higher future
earnings, to the managers catering to the time-varying premium assigned by the
market to dividend paying stocks, and partially to the reduction of agency
problems. The negative price response to dividend decreases is mainly due to the
transition from a mature life-cycle stage to a decline stage with higher systematic
risk.
Methodology and Data
The methodology is designed to examine the effects of the two components of a
dividend policy (dividend per share and dividends payout ratio) on the expected
Price-to-Book ratio. The latter is commonly used as a proxy for shareholder value.
As indicated earlier, the main objective is to design a risk-adjusted dividend
policy that takes into account systematic and unsystematic risks. The
methodology is outlined in figure 1 that follows. The data include the non-
financial firms listed in the Dow Jones Industrial Average (DJIA). The data
covers the years 1997-2006. The data are obtained from the Reuters©
finance
center.
--------------------------------------------
Insert figure 1 about here
--------------------------------------------
Extending the Coefficient of Variation to address Systematic and
Unsystematic Risks
The idea of the model suggests a risk-adjusted dividend yield that corporate
managers can use to develop a risk-based dividend policy. The latter includes the
effects of systematic and unsystematic risk. This idea requires that dividend yield
is to increase according to the ‘coefficient of variation’
i
j
R
σCV .

10
The CV is one of the oldest measures of risk in investment (Holzinger, 1928). The
use of CV has long been recognized for its advantage of addressing the very
common relationship in finance which is risk-return relationship (Sharpe, 1964,
1970; Black, et al., 1972; Bower and Lessard, 1973). The CV is also used as a
measure of risk for adjusting the return when making the capital budgeting
decisions (Rubinstein, 1973; Osteryoung, et al., 1977a, b). The usefulness of the
CV, in general, was extended in the field of investments as a performance
measure that addresses the safety of an investment (Roy, 1952; Wachowicz and
Shrieves, 1980).
In this paper, the author extends the use of the CV to recognize and examine the
two components of the total risk (standard deviation): systematic and
unsystematic risks. This view is not addressed in the relevant literature.
Statistically, the use of CV as a risk measure can offer the smallest asymptotic
variances that are associated with precise confidence interval (Iglewicz, 1967;
Brief and Owen, 1969; Bennett, 1977; Doornbos and Dijkstra, 1983; Miller, 1991;
Ahmed, 1994, 1995; Gupta and Ma, 1996; Boyle and Rao, 2001; Curto and Pinto,
2009).
The sections that follow discuss the proposed formulation for adjusting the
dividends per share and dividend payout ratio according to the systematic and
unsystematic risks. It is plausible to assume that a risk-adjusted dividend yield
would add value to shareholders.
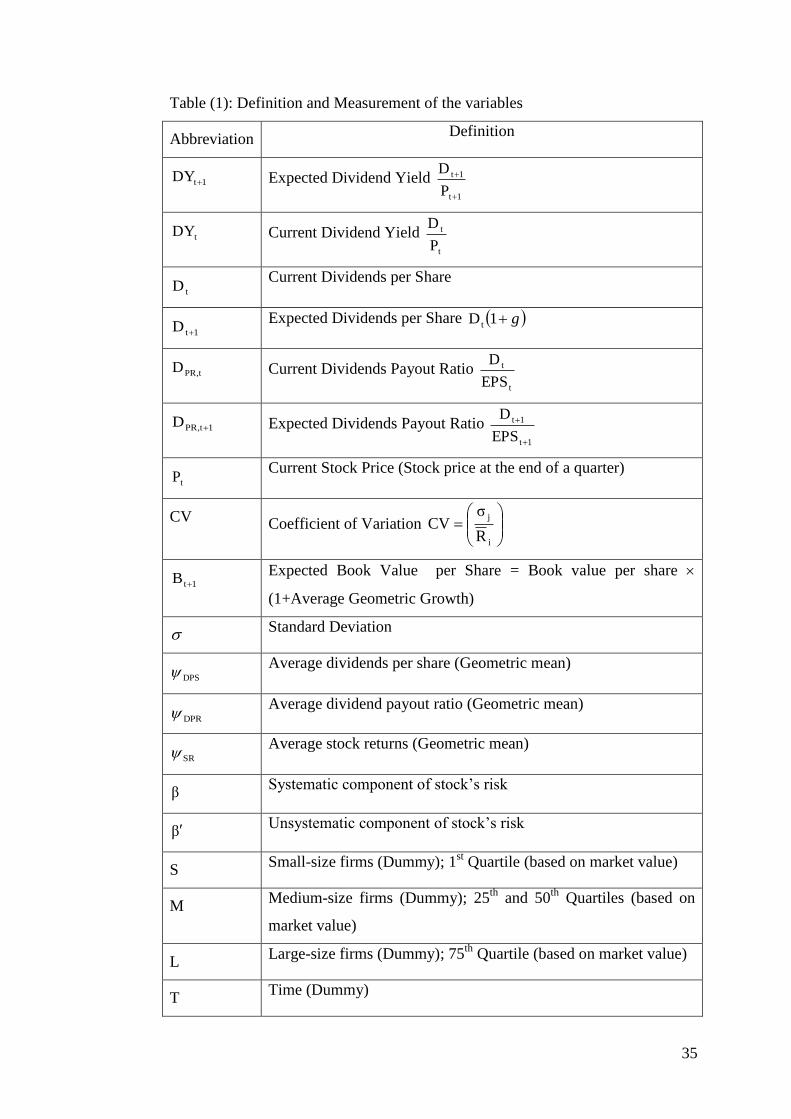
The abbreviations and definitions of the variables used in the mathematical
formulation are summarized in table (1).
------------------------------------------
Insert Table 1 about here
------------------------------------------
In terms of dividing total riskiness of the stock (standard deviation) into
systematic and unsystematic risks, the conventional approach is as follows (Ben-
Horim and Levy, 1980; Bohren, 1997).
2).........(..........Risk Systematic-βRisk icUnsystemat
)1.........(........................................βRisk Systematic
j
M
The total market risks (beta) are calculated as follows.
11
)3....(..........
R,RCOVβ
2
M
Mj
Where the return is calculated as the natural logarithm of changes in stock prices
1-t
t
tP
PlnR
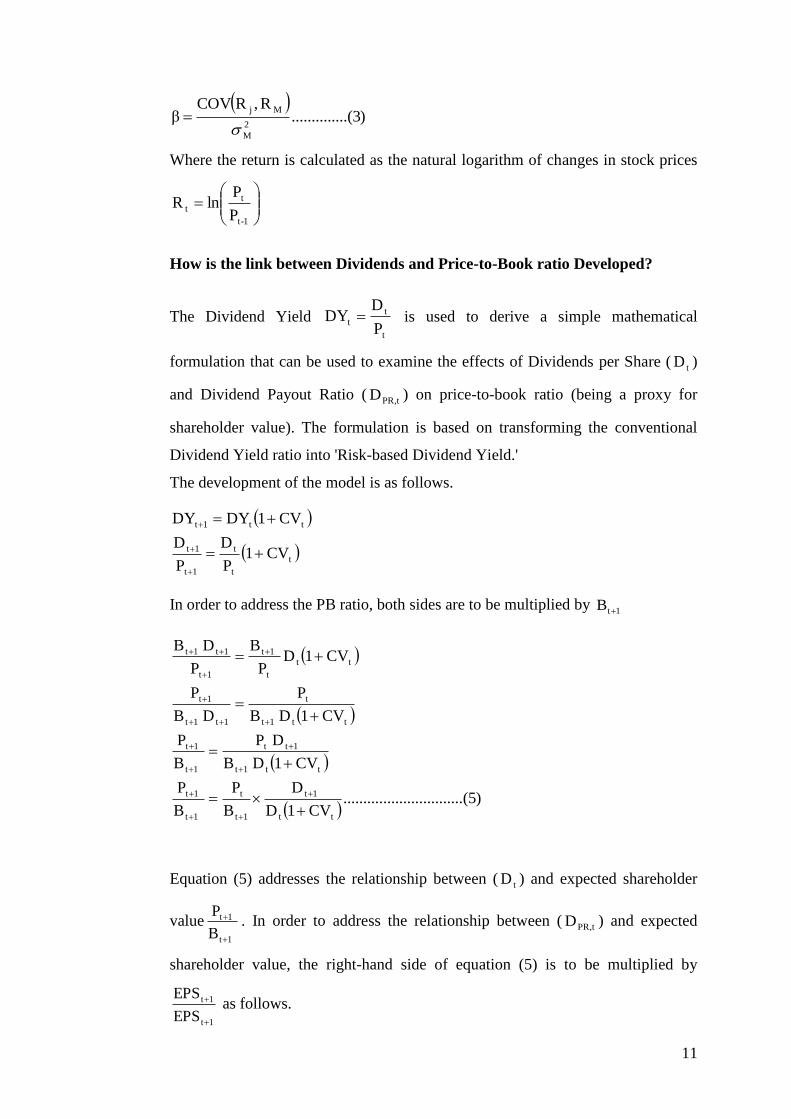
How is the link between Dividends and Price-to-Book ratio Developed?
The Dividend Yield t
t
tP
DDY is used to derive a simple mathematical
formulation that can be used to examine the effects of Dividends per Share ( tD )
and Dividend Payout Ratio ( tPR,D ) on price-to-book ratio (being a proxy for
shareholder value). The formulation is based on transforming the conventional
Dividend Yield ratio into 'Risk-based Dividend Yield.'
The development of the model is as follows.
t
t
t
1t
1t
tt1t
CV1P
D
P
D
CV1DYDY
In order to address the PB ratio, both sides are to be multiplied by 1tB
)5(..............................
CV1D
D
B
P
B
P
CV1D B
D P
B
P
CV1D B
P
D B
P
CV1DP
B
P
D B
tt
1t
1t
t
1t
1t
tt1t
1tt
1t
1t
tt1t
t
1t1t
1t
tt
t
1t
1t
1t1t
Equation (5) addresses the relationship between ( tD ) and expected shareholder
value B
P
1t
1t
. In order to address the relationship between ( tPR,D ) and expected
shareholder value, the right-hand side of equation (5) is to be multiplied by
1t
1t
EPS
EPS
as follows.
12
tt
1tPS,
1tPR,
1t
t
1t
1t
CV1D
E D
B
P
B
P
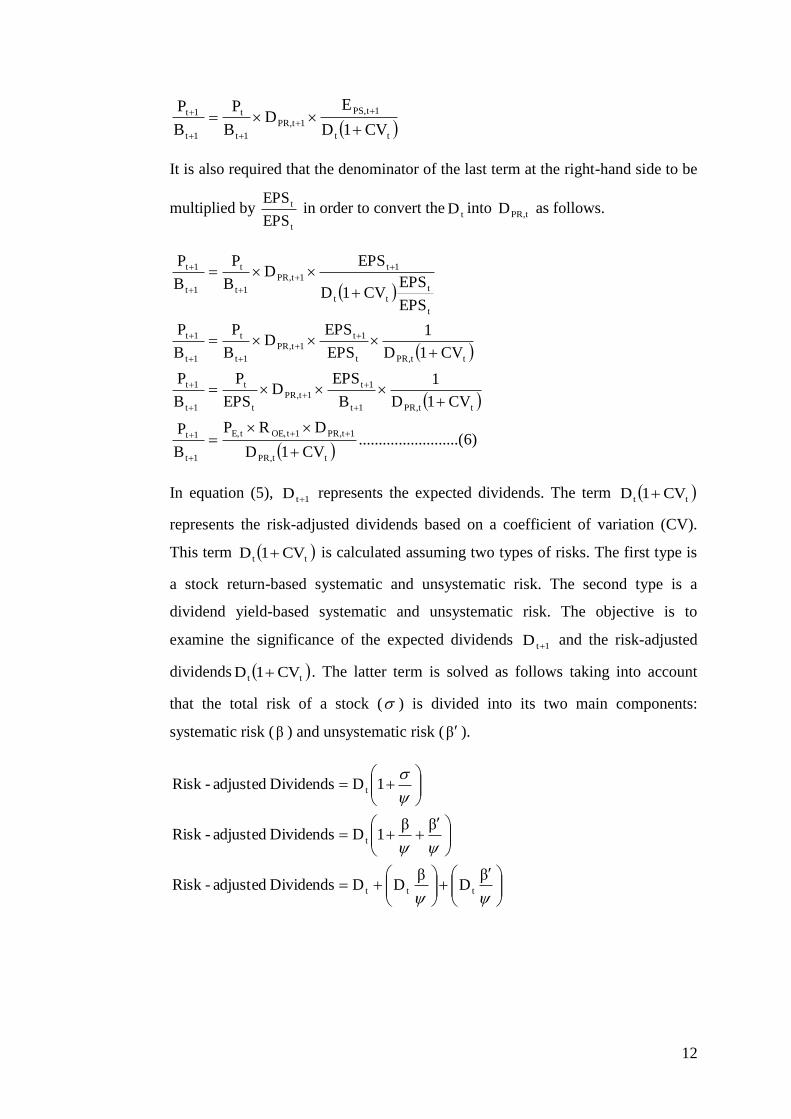
It is also required that the denominator of the last term at the right-hand side to be
multiplied by t
t
EPS
EPS in order to convert the
tD into tPR,D as follows.
)6.....(....................
CV1D
DR P
B
P
CV1D
1
B
EPS D
EPS
P
B
P
CV1D
1
EPS
EPS D
B
P
B
P
EPS
EPSCV1D
EPS D
B
P
B
P
ttPR,
1tPR,1tOE,tE,
1t
1t
ttPR,1t
1t
1tPR,
t
t
1t
1t
ttPR,t
1t
1tPR,
1t
t
1t
1t
t
t
tt
1t
1tPR,
1t
t
1t
1t
In equation (5), 1tD represents the expected dividends. The term tt CV1D
represents the risk-adjusted dividends based on a coefficient of variation (CV).
This term tt CV1D is calculated assuming two types of risks. The first type is
a stock return-based systematic and unsystematic risk. The second type is a
dividend yield-based systematic and unsystematic risk. The objective is to
examine the significance of the expected dividends 1tD and the risk-adjusted
dividends tt CV1D . The latter term is solved as follows taking into account
that the total risk of a stock ( ) is divided into its two main components:
systematic risk (β ) and unsystematic risk (β ).
βD
β DDDividends adjusted-Risk
ββ 1DDividends adjusted-Risk
1DDividends adjusted-Risk
ttt
t
t

13
The term
β DD tt represents the systematic risk-adjusted dividend per share
and the term
βDD tt represents the unsystematic risk-adjusted dividend per
share. Equation (5) is re-written as follows.
7...................β
Dβ
DD
D
B
PPB
DPS
t
DPS
tt
1t
1t
t
1t
Where
β= systematic coefficient of variation and
β = Unsystematic coefficient
of variation.
Equation (6) is also re-written in terms of systematic and unsystematic risks as
follows
8....................β
Dβ
DD
DRPPB
DPR
tPR,
DPR
tPR,tPR,
1tPR,1tOE,tE,
1t
Practically, the current (expected) dividends per share and current (expected)
dividend payout ratio require an explicit consideration of firm’s current (expected)
investment. The rational is that the amount of dividends determines the amount of
internal financing the firm may use for financing current and/or expected
investments.
Dividend Policy and the Role of Free Cash Flow
The interdependence between current dividends tD and cash flow requires a
second-stage estimation equation. The free cash flow ( tCFF , ) equation presents a
practical formulation that takes into account firm’s operating cash flows and
investment decisions (investments in fixed assets as well as investments in
working capital) simultaneously. The standard computation of the free cash flow
is as follows.
9...............
,
ttttt
ttttCF
NWCFTaxDepEBIT
NWCFOCFF
The free cash flow formulation presents further advantage that is included in the
Earnings Before Interest and Taxes (EBIT). The accounting identity assures that

14
10...............ttttt
ttttt
TaxIntREDEBIT
REDTaxIntEBIT
Substituting equation (10) into (9) results in a wider perspective for calculating
the free cash flows as follows.
11..............., tttttttCF NWCFDepIntREDF
In order to maintain a uniform measurement, the variables in the right and left
hand side of equation (11) are measured per share.
A Structure for Estimating the Effect of Risk-adjusted Dividends per Share
on Price-to-Book ratio
In equation (7), two parameters are to be predicted: the current dividend per share
tD and the expected dividend per share 1tD . The relationship between dividend
per share and investment decisions can be examined by addressing the free cash
flow computation.
The Prediction of Free Cash low
The interdependence between free cash flow ( tCFF , ) and price-to-book ( tPB )
requires the estimation of the predicted changes in free cash flow tCFF ,ˆ using a
first-stage estimator as follows.
12...............T LMS
α
11,10,9,8,
7654321,
iiiii
titititititititCF NWCFDepIntREDPBF
The current dividends ( tD ) in equation (7) can be calculated using the free cash
flow equation (11) as follows.
13..............., ttttttCFt NWCFDepIntREFD
The Prediction of Current Dividends
The interdependence between current dividends ( tD ) and current price-to-book
tPB requires the estimation of the predicted current dividends ( tD̂ ) using a first-
stage estimator as follows.

15
14...............T LMS 11,10,9,8,
76543,21
iiiii
titititititCFitit NWCFDepIntREFPBD
The Prediction of Excepted Dividends
In the same sense, the expected dividends ( 1tD ) in equation (7) can be calculated
using the free cash flow equation (11) as follows.
15...............111111,1 ttttttCFt NWCFDepIntREFD
The interdependence between expected dividends 1tD and expected price-to-book
ratio 1tPB requires the estimation of the predicted expected dividends 1ˆ
tD using
a first-stage estimator as follows.
16...............T LMS 11,10,9,8,
17161514131,2111
iiiii
titititititCFitit NWCFDepIntREFPBD
The expected level of each variable calculates as gxx tt 11 , where g = the
average continuous compound growth rate.
A Structure for Estimating the Effect of Risk-adjusted Dividends Payout
Ratio on Price-to-Book ratio
In equation (8), four parameters are to be predicted: the current dividend payout
ratio ,D tPR, the expected dividend payout ratio 1tPR,D , the current price-Earnings
ratio tPE and the expected return on equity 1tOE,R . The relationship between
dividend payout ratio and investment decisions can be examined by addressing
the free cash flow computation that can be used for predicting the dividend payout
ratio. Dividing both sides of equation (11) by Net Income ( tNI ), rearrange it and
solving for tPR,D produces.
17...............NI
ΔNWC
NI
ΔF
NI
Dep
NI
Int
NI
RE
NI
FD
t
t
t
t
t
t
t
t
t
t
t
tCF,
tPR,
The Prediction of Current Dividend Payout Ratio
16
The interdependence between current dividend payout ratio ( tPR,D ) and current
price-to-book tPB requires the estimation of the predicted current dividend
payout ratio ( tPRD ,ˆ ) using a first-stage estimator as follows.
18...............T LMS
NI
ΔNWC
NI
ΔF
NI
Dep
NI
Int
NI
RE
NI
FPBD
11,10,9,8,
t
t
7
t
t
6
t
t
5
t
t
4
t
t
3
t
tCF,
2t1tPR,
iiiii
iiiiiii
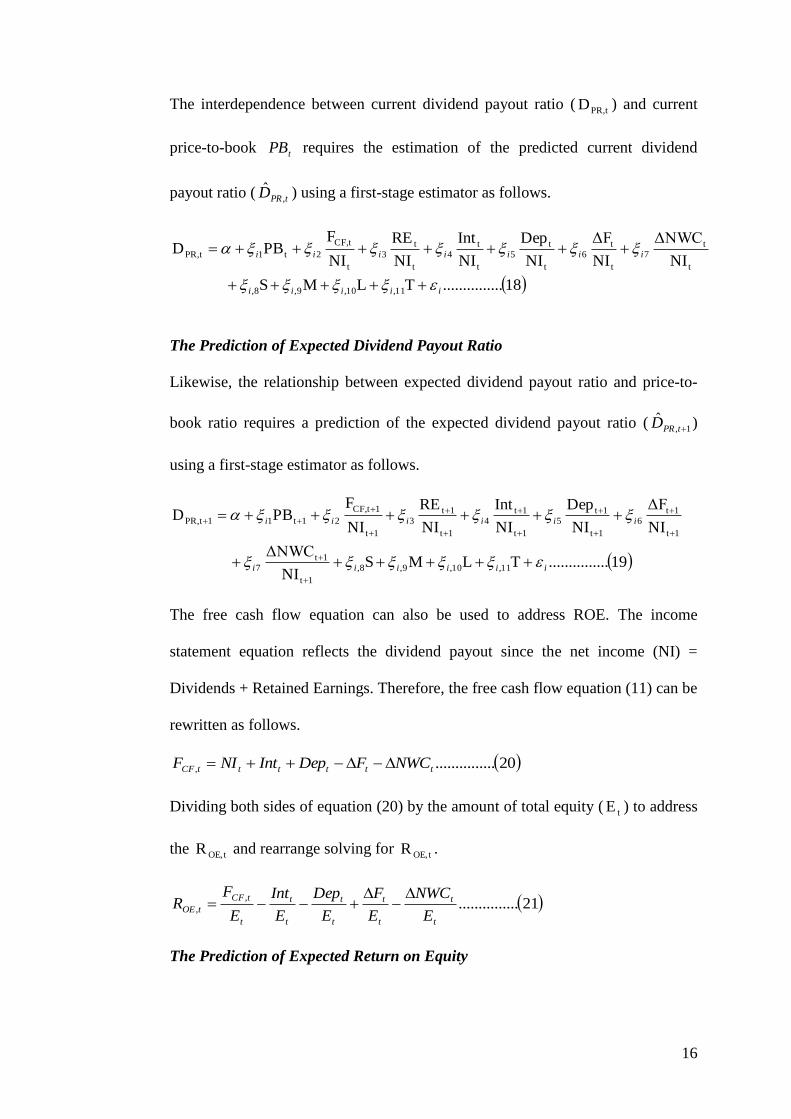
The Prediction of Expected Dividend Payout Ratio
Likewise, the relationship between expected dividend payout ratio and price-to-
book ratio requires a prediction of the expected dividend payout ratio ( 1,ˆ
tPRD )
using a first-stage estimator as follows.
19...............T LMSNI
ΔNWC
NI
ΔF
NI
Dep
NI
Int
NI
RE
NI
FPBD
11,10,9,8,
1t
1t
7
1t
1t
6
1t
1t
5
1t
1t
4
1t
1t
3
1t
1tCF,
21t11tPR,
iiiiii
iiiiii
The free cash flow equation can also be used to address ROE. The income
statement equation reflects the dividend payout since the net income (NI) =
Dividends + Retained Earnings. Therefore, the free cash flow equation (11) can be
rewritten as follows.
20..............., ttttttCF NWCFDepIntNIF
Dividing both sides of equation (20) by the amount of total equity ( tE ) to address
the tOE,R and rearrange solving for tOE,R .
21...............,
,
t
t
t
t
t
t
t
t
t
tCF
tOEE
NWC
E
F
E
Dep
E
Int
E
FR
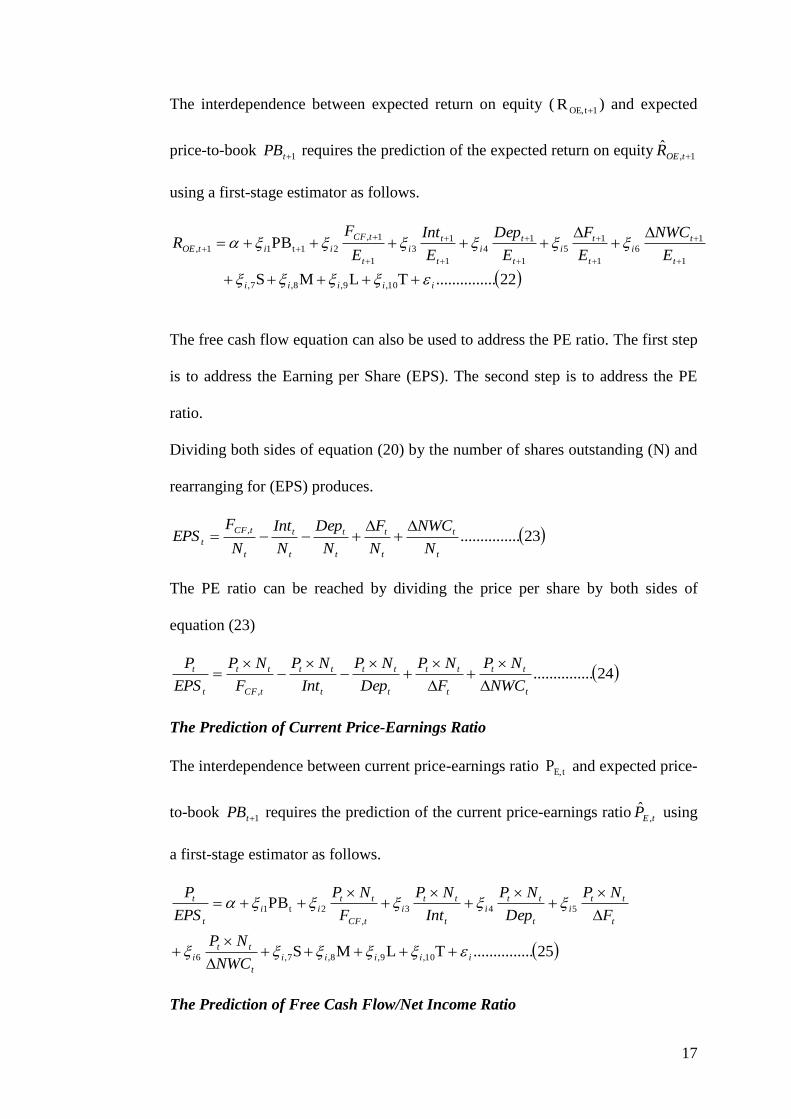
The Prediction of Expected Return on Equity
17
The interdependence between expected return on equity ( 1tOE,R ) and expected
price-to-book 1tPB requires the prediction of the expected return on equity 1,ˆ
tOER
using a first-stage estimator as follows.
22...............T LMS
PB
10,9,8,7,
1
1
6
1
1
5
1
1
4
1
1
3
1
1,
21t11,
iiiii
t
t
i
t
t
i
t
t
i
t
t
i
t
tCF
iitOEE
NWC
E
F
E
Dep
E
Int
E
FR
The free cash flow equation can also be used to address the PE ratio. The first step
is to address the Earning per Share (EPS). The second step is to address the PE
ratio.
Dividing both sides of equation (20) by the number of shares outstanding (N) and
rearranging for (EPS) produces.
23...............,
t
t
t
t
t
t
t
t
t
tCF
tN
NWC
N
F
N
Dep
N
Int
N
FEPS
The PE ratio can be reached by dividing the price per share by both sides of
equation (23)
24..............., t
tt
t
tt
t
tt
t
tt
tCF
tt
t
t
NWC
NP
F
NP
Dep
NP
Int
NP
F
NP
EPS
P
The Prediction of Current Price-Earnings Ratio
The interdependence between current price-earnings ratio tE,P and expected price-
to-book 1tPB requires the prediction of the current price-earnings ratio tEP ,ˆ using
a first-stage estimator as follows.
25...............T LMS
PB
10,9,8,7,6
543
,
2t1
iiiii
t
tt
i
t
tt
i
t
tt
i
t
tt
i
tCF
tt
ii
t
t
NWC
NP
F
NP
Dep
NP
Int
NP
F
NP
EPS
P
The Prediction of Free Cash Flow/Net Income Ratio

18
The predicted free cash flow to net income )̂NI
F(
t
tCF,is estimated using equation (18)
as follows.
26...............T LMS
NI
ΔNWC
NI
ΔF
NI
Dep
NI
Int
NI
REDPB
NI
F
11,10,9,8,
t
t
7
t
t
6
t
t
5
t
t
4
t
t
3tPR,2t1
t
tCF,
iiiii
iiiiiii
Research Hypotheses
In terms of dividend per share, two hypotheses are developed as follows.
H1: “A positive relationship exists between expected dividend per share and
expected price-to-book ratio.”
H2: “A negative relationship exists between systematic and unsystematic risk-
adjusted dividend per share and expected price-to-book ratio.”
In terms of dividends payout ratios, five hypotheses are developed as follows.
H3: “A positive relationship exists between expected price-to-book ratio and
current price-earnings ratio.”
H4: “A positive relationship exists between expected price-to-book ratio and
expected return on equity.”
H5: “A positive relationship exists between expected price-to-book ratio and
expected dividend payout ratio.”
H6: “A negative relationship exists between expected price-to-book ratio and
current dividend payout ratio.”
H7: “A negative relationship exists between expected price-to-book ratio,
systematic and unsystematic risk-adjusted dividend payout ratios.”
Model Estimation
Since the data are cross section-time series panel, the Hausman specification test
(Hausman, 1978; Hausman and Taylor, 1981) is required to determine whether
the fixed or random effects model should be used. The test looks for the
correlation between the observed itx and the unobserved k , thus is run under the
hypotheses that follow.

19
0,cov:H
0,cov:H
k1
k0
it
it
x
x
Where itx = regressors, and
k =error term.
The results of the test show that the coefficient of k is significant at 1% level.
Therefore, the random effect model is relevant and appropriate. The issue of
linearity versus nonlinearity is addressed and examined as well. Regression
Equation Specification Error Test, RESET (Ramsey, 1969; Thursby and Schmidt,
1977; Thursby, 1979; Sapra, 2005; Wooldridge, 2006) is employed to test the two
hypotheses that follow.
0ˆ,ˆ :H
0ˆ,ˆ :H
32
1
32
0
The null hypothesis refers to linearity and the alternative refers to nonlinearity.
The results of the F test %5 for equations (12), (14) and (16) show that the
F statistic is greater than the critical value leading to the rejection of the null
hypothesis, thus a nonlinear model is appropriate.2 The general estimating
equation of the random effect nonlinear models in equations (12), (14) and (16)
take the form of Least Squares Dummy Variables (LSDV) that follows.
k
1i
tkk
3
itkikk
3
tk βα Xy
Where t = 1, …..,n
k = number of firms in each group.
tky = Current dividends, expected dividends and free cash flow per share
respectively.
itkX = The predictors
k = Random error term due to the individual effect.
tk = Random error.
The Estimation of the Effect of Dividend per Share on Price-to-Book Ratio
2
K-TSSE
JSSE-SSEstatistic
U
UR
F where RSSE and
USSE are the sum squared errors for
the restricted and unrestricted models respectively, J refers to the two hypotheses under
consideration, T is the number of observations, and K is the number of regressors.

20
The final estimation equation for the expected shareholder value takes the form of
“Partial Adjustment Model’ as follows.
28..........................T LMS
F̂β
D̂D̂PBαPB
27..........................T LMS
F̂β
D̂D̂PBαPB
8,7,6,5,
3
tCF,4,t3
3,
3
1t2,
3
t1
3
1 ti,
8,7,6,5,
3
tCF,4,t3
3,
3
1t2,
3
t1,
3
1 ti,
iiiii
iiii
iiiii
iiii
Where
1,i = speed of adjusting the current PB ratio to a target level.
S, M, and L are dummies for small, medium and large firm size respectively.
T is a dummy for the time effect.
The Estimation of the the Effect of Dividend Payout Ratio on Price-to-Book
Ratio
Equation 8 is structured and examined as follows.
30...............T LMS)̂NI
F(
βD̂
D̂D̂R̂P̂PBαPB
29...............T LMS)̂NI
F(
βD̂
D̂D̂R̂P̂PBαPB
i11,10,9,8,3
t
3
tCF,
7,
3
tPR,6,
3
tPR,5,
3
1tPR,4,
3
1tOE,3,
3
tE,2,
3
t1,
3
1ti,
i11,10,9,8,3
t
3
tCF,
7,
3
tPR,6,
3
tPR,5,
3
1tPR,4,
3
1tOE,3,
3
tE,2,
3
t1,
3
1ti,
iiiiii
iiiii
iiiiii
iiiii
Equations (29-30) take into account the systematic and unsystematic risks
respectively.
The General Method of Moments (GMM) is recommended in the literature of
econometrics due to its superiority to the OLS and GLS in cases of α is distributed
randomly across the panel (Sargan, 1958; Newey, 1985; Ogaki, 1992; Greene,
2000; Hayashi, 2000; Chay and Powell, 2001; Baum, et al., 2003; Altonji, et al.,
2005; Kleibergen, 2005; Lee, 2007).

21
The J test (denoted to Hansen’s J) is used for testing the ‘overidentifying
restrictions.’3 (Davidson and MacKinnon, 1981, 1993; Hansen, 1982; Hansen et
al., 1996; Baum et al., 2007). The value J of the GMM objective function
evaluated at the efficient GMM estimator is distributed as 2 with (L-K) degrees
of freedom under the null hypothesis that the full set of orthogonality conditions
are valid.
Results and Discussion
This section is divided into two parts. The first part reports the results of the first
and second stage regression for the determinants of divided per share. The second
part reports the results of the first and second stage regression for the determinants
of divided payout ratio.
Part 1: The Effects of Risk-Adjusted Dividend per Share on Price-to-Book
Ratio
The results of the first-stage regression for estimating the predicted variables
3
tCF,
3
1t
3
t F̂,D̂,D̂ in equations (27) and (28) are reported in tables (2) and (3).
------------------------------------------
Insert table 2 about here
-----------------------------------------
The results in table 2 show that the coefficients of the determinants of free cash
flow equation (12) have the true signs except for the change in new working
capital 3
tNWC . The results also show an advantage of using the two-stage
regression estimation. That is, the positive and significant coefficient of price-to-
book ratio reflects interdependence between the two parameters. The plausible
explanation is that the appreciation in PB ratio implies an investment opportunity
that call for an increasing free cash flow. The latter can be achieved by decreasing
the dividends paid out.
In the dividends per share equation (14), the coefficients have the true signs
except for the free cash flow per share, depreciation per share and change in net
working capital per share. This result reflects, to a large extent, that the dividend
3 This is known variously as the Sargan Statistic, Hansen J statistic, Sargan-Hansan J test or
simply a test of overidentifying restrictions.

22
policy is not entirely designed based on free cash flow perspectives. In terms of
signaling, the negative coefficient of the PB ratio shows that dividends per share
are associated with negative impact on stock price.
--------------------------------------
Insert table 3 about here
--------------------------------------
The results in table 3 show that the retained earnings per share is the only
significant variable associated with the true negative sign. The net interest per
share and depreciation per share have the opposite signs. The other determinates
are not statically significant. These results provide an extended support to the
results reported in table 2 that the planning for dividend policy is not quite
directed by the free cash flow perspectives.
The Relationship between Systematic and Unsystematic Risk-adjusted Dividend
per Share and Price-to-Book Ratio
The regression estimates in equations (12), (14) and (16) are used for estimating
the predicted values of free cash flow, dividends per share, and expected
dividends per share ( 3
1t
3
t
3
tCF, D̂,D̂ ,F̂ ) respectively. The predicted estimates are used
in the second-stage regression runs for equations (17) and (18).
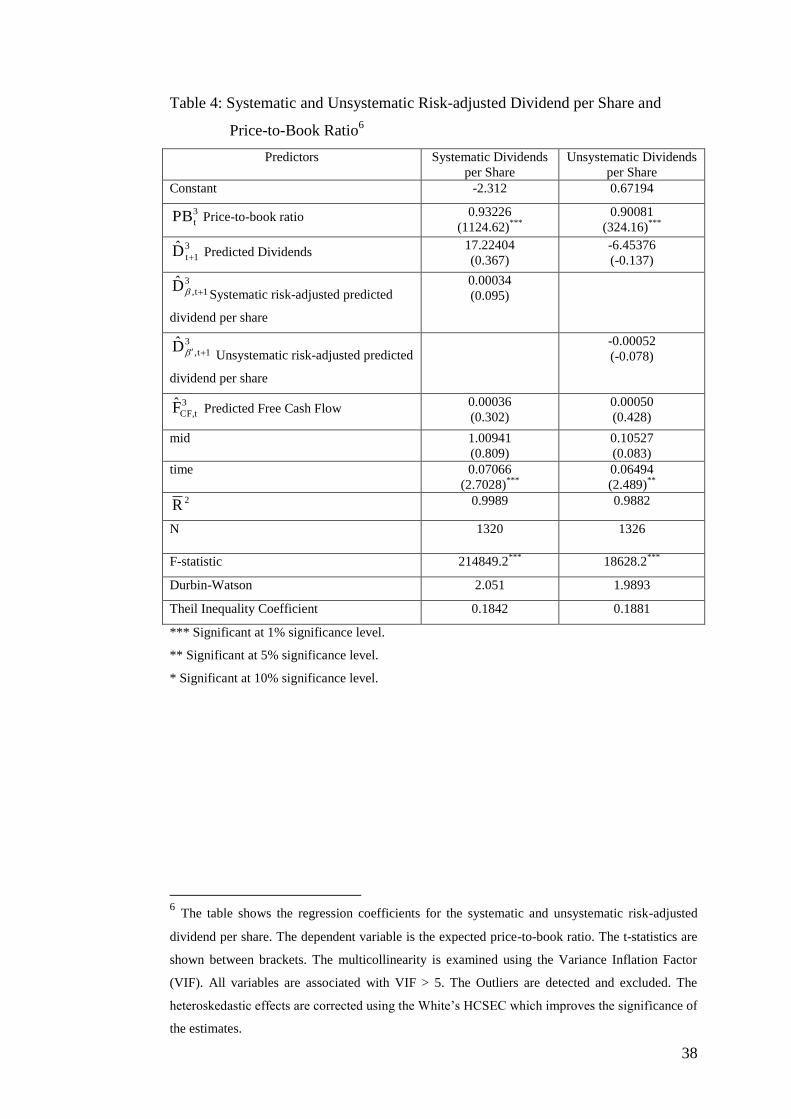
Table 4 reports the results of the determinants of expected price-to-book ratio
using a systematic risk-adjusted and unsystematic risk-adjusted dividend per
share.
----------------------------------------
Insert table 4 about here
-----------------------------------------
Table 4 reports the results for the determinants of the expected PB ratio related to
dividends per share. The table reports the results of regression equations 27 and
28. The results show that the only significant variable is the current PB ratio.
These results show that almost all (in terms of 2R ) of the expected variations in
PB ratio are associated with the current PB ratio. It is easy to conclude that a
technical analysis is deriving price expectations rather than variations in dividends
per share. Moreover, the latter is not deriving the systematic and unsystematic
changes in stock returns. These results present a doubt to the usefulness of the
‘birds-in-hands’ explanation of dividend payout. The latter assumes that a certain
class of investors appreciates the payout of dividends. A fair comparison calls for

23
reverting to the other alternative explanation. That is, the DJIA investors represent
a class that prefers reinvesting in the firm’s business. This explanation is also not
supported by the results since the coefficient of retained earnings is negative and
statistically significant (Table 2).
Part 2: The Effects of Risk-Adjusted Dividend Payout Ratio on Price-to-Book
Ratio
Equation (8) provides a structure for examining the relationship between dividend
payout ratio and the expected shareholder value (PB ratio). Practically, the
dividend payout ratio may have a separate effect on shareholders’ reaction. A firm
may announce a high dividend payout ratio but the expected dividend per share
stays at the same amount when the company increases the number of shares
outstanding proportionally. This possibility calls for a separate examination of the
effect of dividend payout ratio on shareholder value (price-to-book ratio).
Table (5) reports the results of the first stage regression for estimating the
predicted variables )̂NI
F( ,D̂ ,D̂ ,R̂ ,P̂
3
t
3
tCF,3
tPR,
3
1tPR,
3
1tOE,
3
tE, in equations (29) and (30).
These are the results of the regression runs for equations (18), (19), (22), (25) and
(26).
-----------------------------------------
Insert table 5 about here
-----------------------------------------
The results in the 1st column in table 5 show the results for the PE ratio equation
(25). The coefficient of the market value /net interests is the only significant
coefficients associated with the true sign. Other coefficients are not statistically
significant. The positive and statistically significant coefficient of the current PB
ratio materializes the advantage of using the two-stage estimation for considering
the mutual effects between PB and PE ratios.
The 2nd
column in table 5 reports the results for the ROE equation (22). The
coefficient of net interest/equity ratio is the only significant coefficient associated
with the true sign. The positive and statistically significant coefficient of the
24
expected PB ratio materializes the advantage of using the two-stage estimation for
considering the mutual effects between expected PB and expected ROE.
The 3rd
column in table 5 reports the results for the expected dividend payout ratio
equation (19). The coefficients of the retained earnings/net income and change in
fixed assets/net income are associate with the true sign and statistically
significant. The other variables are associated with the opposite sign, although
statistically significant.
The 4th
column in table 5 reports the results for the current dividend payout ratio
equation (18). The positive and statistically coefficient of retained earnings/net
income is the only one that comes with the true sign. The other variables are
associated with the opposite sign and/or statistically insignificant. Nevertheless, a
profound result is the negative and mutual relationship between current dividend
payout ratio and current price-to-book ratio. This result shows that the dividends
payout ratio, rather than dividends per share, are to be considered for examining
the signaling effect.
The 5th
column in table 5 reports the results for the free cash flow/net income
equation (26). The negative coefficient of the change in fixed assets/net income is
the only statistically significant estimate that comes with the true sign. Although
the other variables are statically significant, they are associated with the opposite
signs.
The Relationship between Systematic and Unsystematic Risk-adjusted Dividend
Payout Ratio and Price-to-Book Ratio
The regression estimates in equations (18), (19), (22), (25) and (26) are used for
estimating the predicted values of price-Earnings ratio3
tE,P , Return on Equity
3
1tOE,R , Current and Expected Dividend Payout Ratio 3
1tPR,
3
tPR, D ,D and Free
Cash flow/Net Income ratio3
t
3
tCF,
NI
F. The predicted estimates are used in the second-
stage regression runs for equations (29) and (30). Table 6 reports the results of the
determinants of expected price-to-book ratio using a systematic risk-adjusted and
unsystematic risk-adjusted dividend payout ratio.
--------------------------------------------
Insert table 6 about here
---------------------------------------------
25
Table 6 reports the results for the determinants of the expected PB ratio related to
dividend payout ratio. The table reports the results of regression equations 29 and
30. Overall, the results carry important implications related to the dividends
signaling effect. Specifically, the results show that:
1- A positive and statistically significant relationship exists between current
and expected PB ratio. In the two regression equations (systematic and
unsystematic dividend payout ratio), the coefficient of 3
tB,P measures the
speed of adjusting the current PB ratio to the expected (target) PB ratio. In
the two regression equations, the speed of adjustment is close to 100%
(98.50% and 98.44%) which indicates that the calculation of the target
(expected) PB ratio using the geometric growth rate provides an efficient
estimation of the true variations in the observed PB ratios.
2- The coefficients of the predicted PE ratio, ROE, expected and current
dividend payout ratios are associated with the true signs as stated in
equation (8). This is a profound result indicating that equation (8) is a true
representation of the relationship between dividend payout ratios and
price-to-book ratio.
3- In terms of dividends signaling, the results show that the current dividend
payout ratios are associated with negative and statistically significant
coefficients with the expected PB ratios, while the expected dividend
payout ratios are associated with positive and statistically significant
coefficients with the expected PB ratios.
4- The systematic and unsystematic risk adjusted dividends payout ratios are
not statistically significant although they are associated with the true
negative signs.

26
Conclusion
This paper offers an approach that integrates Price-to-Book (PB) ratio, dividends
per share, dividends payout ratio, systematic and unsystematic risks. Since the
dividends (part of the financing decisions) and investment decisions (in terms of
the variations in fixed assets) are interrelated intrinsically, the free cash flow
computation is used to empirically examine the determinants of dividends. The
relationship between expected PB ratio and dividends is categorized in the
literature of corporate finance as “Dividends Signaling Hypotheses.” The new
approach suggested in this paper extends the signaling relationship to take into
account the elements of systematic and unsystematic risks. The underlying
assumption states that since dividends send signals to shareholders, the changes in
prices imply changes in systematic and unsystematic risks as well. Overall, the
results conclude what follows.
1- The relationships between dividends per share (in terms of current and
expected dividends as well as systematic and unsystematic risk-adjusted
dividends) and price-to-book are statistically insignificant. These results
provide solid and robust evidence that the variations in systematic and
unsystematic risks are not due to variations in dividends per share. That is,
the variations in stock prices are due to other factors than dividend per
share.
2- The relationships between current and expected dividend payout ratios and
price-to-book are statistically significant. In addition, their behavior
reflects the true signs as stated in equation (8).
3- The results carry important implications to the ‘signaling hypotheses,’
that, when planning for the dividend policy, the information about
dividend payout ratio can be used efficiently for signaling purposes.
4- The results carry also important implications to the ‘agency problem,’ that
dividend payout ratios can be used efficiently as a proxy for the agency
problem.

27
References
Ahmed, S. E. 1994. Improved Estimation of the Coefficient of Variation. Journal
of Applied Statistics, 21(6): 565-573.
__________.1995. A Pooling Methodology for Coefficient of Variation. Sankhya:
The Indian Journal of Statistics, 57(B1): 57-75.
Allen, F. and Michaely, R. 1995. Dividend policy., in Jarrow, R.A., Maksimovic,
V. and Ziemba,W.T. (Eds), Finance, Elsevier, Amsterdam, New York,
NY.
Allen, Franklin and Michaely, R. 2003. Payout policy. Constantinides, M. Harris
and R. M. Stulz (ed.), Handbook of the Economics of Finance, edition 1,
volume 1, chapter 7, pp. 337-429, Elsevier.
Altonji, Joseph G. and Rosa L. Matzkin. 2005. Cross Section and Panel Data
Estimators for Nonseparable Models with Endogenous Regressors.
Econometrica, 73(4): 1053-1102.
Akerlof , George A. 1970. The Market for "Lemons": Quality Uncertainty and the
Market Mechanism. The Quarterly Journal of Economics, 84(3): 488-500.
Ambarish, R., Kose, J. and Williams, J. 1987. Efficient Signalling with Dividends
and Investments. The Journal of Finance, 42(2): 321-343.
Baum, C., M. Schaffer, and Stillman, S. 2003. Instrumental Variables and GMM:
Estimation and Testing. Working Paper No. 545, Boston College.
Baum , Christopher F., Schaffer, Mark E. and Stillman, S. 2007. Enhanced
routines for instrumental variables/GMM estimation and testing. Boston
College Economics, Working Paper no. 667
Bar-Yosef, S. and I. Venezia, 1991. Earnings Information and the Determination
of Dividend Policy. The Journal of Economics and Business, 43(3): 197-
214.
Beaver, W., P. Kettler and M. Scholes. 1970. The Association Between Market
Determined and Accounting Determined Risk Measures. Accounting
Review, 45 (4): 654-682.
Ben-Zion, U. and Shalit, S. 1975. Size, Leverage, and Dividend Record as
Determinants of Equity Risk. Journal of Finance, 30(4): 1015-1026.
Ben-Horim, M. and Levy, H. 1980. Total risk, diversifiable risk and
nondiversifiable risk: a pedagogical note. Journal of Financial and
Quantitative Analysis, 15, 289-297.
28
Bennett , B.M., 1977. LR tests for Homogeneity of Coefficients of Variation in
Repeated Samples, Sankhya: The Indian Journal of Statistics, 55(39): 400–
405.
Bernartzi, S.; Michaely, R.; and Thaler, R. 1997. Do changes in dividends signal
the future or the past? Journal of Finance 52(2): 1007-1030.
Bhattacharyya, N. 1979. Imperfect information, dividend policy, and ‘the bird in
the hand’ fallacy. Bell Journal of Economics, 10(1): 259-70.
______________. 2000. Essays on dividend policy. PhD dissertation, University
of British Columbia.
______________. 2007. Dividend policy: a Review. Managerial Finance, 33(1):
4-13.
Black, F. 1976. The dividend puzzle. Journal of Portfolio Management, 2: 5-8.
_______., Jensen, M., and Scholes, M. 1972. The Capital Asset Pricing Model:
Some Empirical Tests, in “Jensen, M. (ed.) Studies in the Theory of
Capital Markets. Praeger.
Bohren, O. 1997. Risk Components and the Market Model: a Pedagogical Note.
Applied Financial Economics, 7: 307-310.
Boyle, Glenn. W. and Rao, Ramesh. K. S. 1988. The Mean-Generalized
Coefficient of Variation Selection Rule and Expected Utility
Maximization, Southern Economic Journal, 55(1): 1-8.
Bower, Richard S., and Lessard, Donald R. 1973. An Operational Approach to
Risk-Screening. Journal of Finance, 28(2): 321-337
Brav, A., J. Graham, C. Harvey & R. Michaely 2005. Payout Policy in the 21st
Century. Journal of Financial Economics, 77(3): 483-527.
Brief, R.P. and Owen , J. 1969. A Note on Earnings Risk and the Coefficient of
Variation, Journal of Finance 24: 901–904.
Brennan, M.J. and Thakor, A.V. 1990. Shareholder preferences and dividend
policy. Journal of Finance, 45(4): 993-1018.
Carter, M. S., Schmidt, Bill H. 2008. The relationship between dividend payouts
and systematic risk: a mathematical approach, Academy of Accounting
and Financial Studies Journal, May
Chay , Kenneth Y. and Powel, James L. 2001. Semiparametric Censored
Regression Models. Journal of Economic Perspectives, 15(4): 29-42.

29
Curtoa , José D. and Pinto, José C. 2009. The Coefficient of Variation Asymptotic
Distribution in the Case of non-iid Random Variables. Journal of Applied
Statistics, 36(1): 21-32
Davidson, R. and J. G. MacKinnon.1981. Several Tests for Model Specification in
the Presence of Alternative Hypotheses. Econometrica, 49(3): 781-793.
______________________________. 1993. Estimation and Inference in
Econometrics. 2nd
edition. New York: Oxford University Press
DeAngelo, H., Linda DeAngelo and Douglas J. Skinner. 2000. Special Dividends
and the Evolution of Dividend Signaling. Journal of Financial Economics,
57(3): 309- 354.
_____________________________________________. 2004. Are dividends
disappearing? Dividend concentration and the consolidation of earnings.
Journal of Financial Economics, 72(3): 425-456.
Doornbos, R. and Dijkstra, J.B. 1983. A Multi Sample Test for the Equality of
Coefficients of Variation in Normal Populations, Communications in
Statistics - Simulation and Computation 12(2): 147–158.
Durrand, D. 1955. Bank Stocks and the Analysis of Covariance. Econometrica,
23(1): 30-45.
Dyl, E. and R. Hoffmeister. 1986. A Note on Dividend Policy and Beta. Journal of
Business Finance and Accounting, 13(1): 107-115.
Gordon, M. 1959. Dividends, Earnings, and Stock Prices. Review of Economics
and Statistics, 41(2): 99-105.
Graham, B. and David L. Dodd. 1951. Security Analysis: Principles and
Techniques. McGraw-Hill Professional.
Greene, William H. 2000. Econometric Analysis. 4th
Edition, Prentice Hall.
Greenwald, Bruce C. and Joseph E. Stiglitz. 1986. Externalities in Economies
with Imperfect Information and Incomplete Markets. The Quarterly
Journal of Economics, 101(2): 229-264.
Gupta , C. R. and Ma , S. 1996. Testing the Equality of Coefficients of Variation
in k normal populations, Communications in Statistics - Theory and
Methods, 25(1): 115–132.
Fama, E. F., and K.R. French. 2001. Disappearing Dividends: Changing Firm
Characteristics or Lower Propensity to Pay? Journal of Financial
Economics, 60(1): 3-43.

30
Fracassi, C. 2008. Stock Price Sensitivity to Dividend Changes. Working Paper,
UCLA Anderson School of Management.
Hansen, L. 1982. Large Sample Properties of Generalized Method of Moments
Estimators. Econometrica, 50(4): 1029-1054.
_________, J. Heaton, and A. Yaron. 1996. Finite sample properties of some
alternative GMM estimators. Journal of Business and Economic Statistics
14(3): 262–280.
Hausman, J. A. 1978. Specification Tests in Econometrics, Econometrica, 46(6):
1251-1271.
_________. and Taylor, William E. 1981. Panel Data and Unobservable
Individual Effects, Econometrica, 49(6): 1377-1398.
Hayashi, F. 2000. Econometrics. Princeton University Press, New Jersey.
Holzinger, Karl J. 1928. Statistical Methods for Students in Education. Boston
Iglewicz, B. 1967. Some Properties of the Coefficient of Variation, Ph.D. thesis,
Virginia Polytechnic Institute.
John, K. and Williams, J. 1985. Dividends, dilution and taxes: a signaling
equilibrium. Journal of Finance, 40(4): 1053-1070.
Kleibergen, F. 2005. Testing Parameters in GMM without Assuming That They
Are Identified. Econometrica, 73(4): 1103-1123
Lee, Lung-fei. 2007. GMM and 2SLS estimation of mixed regressive, spatial
autoregressive models. Journal of Econometrics, 137(2): 489-514.
Lintner, J. 1956. Distribution of incomes of corporations among dividends,
retained earnings and taxes. American Economic Review, 46(2): 97-113.
Macaulay, F. 1938. The Movements of Interest Rates. Bond Yields and Stock
Prices in the United States since 1856, New York: National Bureau of
Economic Research
Miller, M. H. and Modigliani, F. 1961. Dividend policy, Growth and the
Valuation 20 of Shares. Journal of Business, 34(4): 411-33.
___________. and Rock, K. 1985. Dividend policy under asymmetric
information. Journal of Finance, 40(4): 1031-51.
Miller , G. E. 1991. Asymptotic Test Statistics for Coefficients of Variation,
Communications in Statistics - Theory and Methods, 20(10): 3351–3363.
Newey, W. 1985. Generalized Method of Moments Specification Testing,”
Journal of Econometrics, 29, 229-256.

31
Ogaki, M. 1992. Generalized Method of Moments: Econometric Applications, in
G. Maddala, C. Rao, and H. Vinod (eds.), Handbook of Statistics, Volume
11: Econometrics, North-Holland, Amsterdam.
Osteryoung, Jerome S., Roenfeldt, Rodney, L. and Nast, Donald A. 1977(a).
Capital Asset Pricing Model and Traditional Risk Measures for Capital
Budgeting. Financial Review, 12(1): 48-58.
__________________., Scott, E., and Roberts, Gordon S. 1977(b). Selecting
Capital Projects with the Coefficient of Variation. Financial Management,
6(2): 65-70.
Ramsey, J. B. 1969. Tests for Specification Errors in Classical Linear Least
Squares Regression Analysis. Journal of Royal Statistical Society B,
31(2): 350–371.
Roy, A. D. 1952. Safety First and the Holding of Assets. Econometrics, 20(3):
431-449.
Rubenstein, Mark E. 1973. A Mean-Variance Synthesis of Corporate Financial
Theory. Journal of Finance, 28(1): 167-181.
Sapra, S. 2005. A regression error specification test (RESET) for generalized
linear models. Economics Bulletin, 3(1): 1-6.
Sargan, D. 1958. The Estimation of Economic Relationships Using Instrumental
Variables. Econometrica, 26(3): 393-415.
Sharpe, William. F. 1964. Capital asset prices: a theory of market equilibrium
under conditions of risk, Journal of Finance, 19(3), 425–442.
_______________. 1970. Portfolio Theory and Capital Markets. McGraw-Hill:
New York.
Spence, A. M. 1973. Job Market Signaling. Quarterly Journal of Economics,
87(3): 355–374.
_________. 1974. Market Signaling: Informational Transfer in Hiring and Related
Screening Processes. Cambridge: Harvard University Press.
Stiglitz, Joseph E. and Andrew Weiss. 1981. Credit Rationing in Markets with
Imperfect Information. The American Economic Review, 71(3): 393–410
Thursby, Jerry G., Schmidt, P. 1977. Some Properties of Tests for Specification
Error in a Linear Regression Model. Journal of the American Statistical
Association, 72(359): 635–641.

32
______________. 1979. Alternative Specification Error Tests: A Comparative
Study. Journal of the American Statistical Association, 74(365): 222-225.
Wachowicz, John M. and Shrieves, Ronald E. 1980. An argument for
“Generalized” Mean-Coefficient of Variation Analysis. Financial
Management, 9(4): 51-58.
Watts, R. 1973. The information content of dividends. Journal of Business, 46(2):
191-211.
Williams, J. 1988. Efficient Signalling with Dividends, Investment, and Stock
Repurchases. The Journal of Finance, 43(3): 737-747.
Wooldridge, Jeffrey M. 2006. Introductory Econometrics - A Modern Approach.
Thomson South-Western, International Student Edition.

33
Appendix
Thirty Companies of the Dow Jones Industrial Average Index
Company Symbol Industry
3M MMM Diversified industrials
Alcoa AA Aluminum
American Express AXP Consumer finance
AT&T T Telecommunication
Bank of America BAC Institutional and retail banking
Boeing BA Aerospace & defense
Caterpillar CAT Construction and mining equipment
Chevron Corporation CVX Oil and Gas
Cisco Systems CSCO Computer networking
Coca-Cola KO Beverages
DuPont DD Commodity chemicals
ExxonMobil XOM Integrated oil & gas
General Electric GE Conglomerate
Hewlett- Packard HPQ Diversified computer systems
The Home Depot HD Home improvement retailers
Intel INTC Semiconductors
IBM IBM Computer services
Johnson & Johnson JNJ Pharmaceuticals
JPMorgan Chase JPM Banking
Kraft Foods KFT Food processing
McDonald’s MCD Restaurant & bars
Merck MRK Pharmaceuticals
Microsoft MSFT Software
Pfizer PFE Pharmaceuticals
Procter & Gamble PFE Non-durable household products
Travelers TRV Insurance
United Technologies
Corporations
UTX Aerospace, heating/cooling, elevators
Verizon Communications VZ Telecommunication
Wal-mart WMT Broadline retailers
Walt Disney DIS Broadcasting & entertainment

34
Figure 1: Components of Risk-Adjusted Dividend Policy
Components of Dividends Policy
Dividends per Share Dividends Payout Ratio
Systematic
Risk
Unsystematic
Risk
35
Table (1): Definition and Measurement of the variables
Abbreviation Definition
1tDY Expected Dividend Yield
1t
1t
P
D
tDY Current Dividend Yield t
t
P
D
tD Current Dividends per Share
1tD
Expected Dividends per Share g1Dt
tPR,D Current Dividends Payout Ratio t
t
EPS
D
1tPR,D Expected Dividends Payout Ratio
1t
1t
EPS
D
tP Current Stock Price (Stock price at the end of a quarter)
CV Coefficient of Variation
i
j
R
σCV
1tB
Expected Book Value per Share = Book value per share
(1+Average Geometric Growth)
Standard Deviation
DPS Average dividends per share (Geometric mean)
DPR Average dividend payout ratio (Geometric mean)
SR Average stock returns (Geometric mean)
β Systematic component of stock’s risk
β Unsystematic component of stock’s risk
S Small-size firms (Dummy); 1
st Quartile (based on market value)
M Medium-size firms (Dummy); 25
th and 50
th Quartiles (based on
market value)
L Large-size firms (Dummy); 75
th Quartile (based on market value)
T Time (Dummy)

36
Table 2: Regression results for the determinants of free cash flow and dividends
per share4
Predictors Free Cash Flow 3
tCF,F
(Equation 12)
Dividends Per
Share 3
tD̂
( Equation 14)
Constant -0.08057 -0.0013930
Price-to-Book ratio 3
tPB 0.00001
(2.181)**
-0.0000001
(-2.190)**
Free Cash Flow per share 3
tCF,F -0.0000002
(-0.188)
Dividends per share 3
tD 5.97160
(1416.37)***
Retained Earnings per share 3
tRE
6.85893
(108801.7)***
-0.0000562
(-40.187)***
Net Interest per share 3
tINT -0.0000157
(-4.666)***
Depreciation per share 3
tDEP 0.49914
(950.03)***
0.0005212
(56.462)***
Change in Fixed Assets per share3
tF
-0.0000004
(-20.096)***
Change in Net Working Capital
per share 3
tNWC
0.00009
(31498.2)***
Medium Size 0.03288
(2.812)***
0.0001632
(0.650)
Time -0.00259
(-10.24)***
0.0001129
(21.383)***
2R 0.9999 0.9434
N 1185 1434
F-statistic 8761.41***
797.457***
Durbin-Watson 1.572 0.2755
Theil Inequality Coefficient 0.1580 0.1641 *** Significant at 1% significance level.
** Significant at 5% significance level.
* Significant at 10% significance level.
4 These are the results of the regression runs for equations (12) and (14). The table shows the
regression estimated coefficients for two regression equations. The dependent variables are free
cash flow and dividends per share respectively. The t-statistics are shown between brackets. The
multicollinearity is examined using the Variance Inflation Factor (VIF) and the variables
associated with VIF > 5 are excluded. The outliers are detected and excluded as well. The
heteroskedastic effects are corrected using the White’s HCSEC which improves the significance of
the estimates.

37
Table 3: Regression results for the determinants of expected dividends per share5
Predictors Expected Dividends per share 3
1tD̂ (equation 16)
Constant -0.00160
Price-to-Book ratio 3
1tPB -0.00003
(-.784)
Free Cash Flow per share 3
1tCF,F -0.00005
(-43.754)***
Retained Earnings per share 3
1tRE -0.00001
(-24.865)***
Net Interest per share 3
1tINT 0.00010
(30.944)***
Depreciation per share 3
1tDEP 0.00002
(2.005)**
Change in Fixed Assets per share 3
1tF -0.00007
(-1.574)
Change in Net Working Capital per share3
1tNWC
0.000081
(1.194)
Medium 0.00047
(1.863)*
Time 0.00012
(21.769)***
2R 0.94371
N 1433
F-statistic 775.470***
Durbin-Watson 0.32281
Theil Inequality Coefficient 0.1637 *** Significant at 1% significance level.
** Significant at 5% significance level.
* Significant at 10% significance level.
5 These are the results of the regression run for equation (16). The table shows the regression
estimated coefficients for the expected dividends regression equation. The dependent variable is
the expected dividends per share. The t-statistics are shown between brackets. The
multicollinearity is examined using the Variance Inflation Factor (VIF) and the variables
associated with VIF > 5 are excluded. The Outliers are detected and excluded as well. The
heteroskedastic effects are corrected using the White’s HCSEC which improves the significance of
the estimates.
38
Table 4: Systematic and Unsystematic Risk-adjusted Dividend per Share and
Price-to-Book Ratio6
Predictors Systematic Dividends
per Share
Unsystematic Dividends
per Share
Constant -2.312 0.67194
3
tPB Price-to-book ratio 0.93226
(1124.62)***
0.90081
(324.16)***
3
1tD̂ Predicted Dividends 17.22404
(0.367)
-6.45376
(-0.137)
3
1t,D̂ Systematic risk-adjusted predicted
dividend per share
0.00034
(0.095)
3
1t,D̂ Unsystematic risk-adjusted predicted
dividend per share
-0.00052
(-0.078)
3
tCF,F̂ Predicted Free Cash Flow 0.00036
(0.302)
0.00050
(0.428)
mid 1.00941
(0.809)
0.10527
(0.083)
time 0.07066
(2.7028)***
0.06494
(2.489)**
2R 0.9989 0.9882
N 1320 1326
F-statistic 214849.2***
18628.2***
Durbin-Watson 2.051 1.9893
Theil Inequality Coefficient 0.1842 0.1881
*** Significant at 1% significance level.
** Significant at 5% significance level.
* Significant at 10% significance level.
6 The table shows the regression coefficients for the systematic and unsystematic risk-adjusted
dividend per share. The dependent variable is the expected price-to-book ratio. The t-statistics are
shown between brackets. The multicollinearity is examined using the Variance Inflation Factor
(VIF). All variables are associated with VIF > 5. The Outliers are detected and excluded. The
heteroskedastic effects are corrected using the White’s HCSEC which improves the significance of
the estimates.

39
Table 5: The Regression results for the determinants of price-Earnings ratio3
tE,P ,
Return on Equity3
1tOE,R , Current and Expected Dividend Payout Ratio
3
1tPR,
3
tPR, D ,D and Free Cash flow/Net Income ratio 3
t
3
tCF,
NI
F 7
Predictors 3
tE,P 3
1tOE,R 3
1tPR,D 3
tPR,D
3
t
3
tCF,
NI
F
Constant 347388.97 0.00013 0.06487 0.7102 2.201
3
tPB 536.9
(32.61)***
-0.00003
(-3.45)***
-0.00006
(-1.81)*
3
t(MV/FCF) -0.00006
(-0.415)
3
t(MV/INT) 0.0007
(5.91)***
3
t(MV/DEP) -0.0001
(-2.511)***
3
tF)(MV/ -0.00003
(-1.18)
3
tNWC)(MV/ -0.00008
(-1.02)
3
1tPB 0.00003
(33.98)***
0.00002
(1.25)
3
1t(INT/E) -0.02743
(-5.03)***
3
1t(DEP/E) 0.00749
(5.82)***
3
1tF/E)( -0.00004
(-2.12)**
3
1tNWC/E)( 0.00007
(0.04)
3
1t(FCF/NI) -0.00002
7 The table shows the regression estimated coefficients for the instrumental variables. The
dependent variables are price-Earnings ratio3
tE,P , Return on Equity3
1tOE,R , Current and
Expected Dividend Payout Ratio3
1tPR,
3
tPR, D ,D and Free Cash flow/Net Income ratio3
t
3
tCF,
NI
F. The
t-statistics are shown between brackets. The multicollinearity is examined using the Variance
Inflation Factor (VIF). The variables associated with VIF > 5 are excluded. The Outliers are
detected and excluded. The heteroskedastic effects are corrected using the White’s HCSEC which
improves the significance of the estimates.

40
(-13.91)***
3
1t(INT/NI) 0.03266
(6407.46)***
3
1t(DEP/NI) 0.01053
(115132)***
3
1tF/NI)( 0.00005
(6419)***
3
1tNWC/NI)( -0.00009
(-6.83)***
3
t(FCF/NI) 0.00004
(0.773)
3
t(RE/NI) -1.51075
(-1460)***
-3.81385
(-6869)***
3
t(INT/NI) 0.0015
(25.06)***
-2.25416
(-8830)***
3
tNWC/NI)( -0.00001
(-68.47)***
3
tF/NI)( -0.87004
(-7516)***
mid -83885.04
(-3.80)***
0.00001
(0.55)
-0.02162
(-4.83)***
0.01915
(0.88)
0.1395
(1.35)
time 726.39
(1.35)
0.00002
(2.50)**
-0.00017
(-1.42)
-0.00194
(-3.33)***
-0.00364
(-1.33)
2R 0.5611 0.5291 0.9999 0.9995 0.9999
N 1029 1127 1064 1029 783
F-statistic 165.27***
181.77***
1703266562***
317490***
22955313***
Durbin-Watson 1.2556 1.082 0.841 0.407 1.127
Theil Inequality
Coefficient
0.1710 0.1737 0.1526 0.1541 0.1524
*** Significant at 1% significance level.
** Significant at 5% significance level.
* Significant at 10% significance level.

41
Table 6: Systematic and Unsystematic Risk-Adjusted Dividend Payout Ratio and
Price-to-Book Ratio8
Predictors Systematic Dividend
Payout Ratio
Unsystematic
Dividend Payout
Ratio
Constant -15.88 -16.04
3
tPB Price-to-Book ratio 0.9850
(222.09)***
0.9844
(221.96) )***
3
tE,P̂ Predicted Price-earnings ratio 0.000017
(3.83)***
0.00002
(3.91)***
3
1tOE,R̂ Predicted Return on Equity 66216.7
(6.21)***
66465.2
(6.23***)
3
1tPR,D̂ Predicted expected Dividend Payout Ratio 0.006
(1.823)**
0.00621
(1.82) **
3
tPR,D̂ Predicted current payout ratio -0.357
(-6.33)***
-0.35618
(-6.31)***
3
t)̂(FCF/NI Predicted Free Cash Flow/Net Income
-0.001
(-0.311)
-0.00052
(-0.313)
3
t,PR,D̂ Systematic risk-adjusted predicted dividend
payout ratio
-0.000003
(-0.073)
3
t,PR,D̂ Unsystematic risk-adjusted predicted dividend
payout ratio
-0.00001
(-0.074)
mid 1.736
(0.942)
1.75989
(0.954)
time -0.061
(-1.37)
-0.06073
(-1.365)
2R 0.99642 0.99640
N 1025 1027
F-statistic 31648.2*** 31594.7***
Durbin-Watson 2.1277 2.124
Theil Inequality Coefficient 0.23121 0.23136
*** Significant at 1% significance level.
** Significant at 5% significance level.
* Significant at 10% significance level.
8 The table shows the regression coefficients. The dependent variable is the expected Price-to-book
ratio. The t-statistics are shown between brackets. The multicollinearity is examined using the
Variance Inflation Factor (VIF). All variables are associated with VIF > 5. The Outliers are
detected and excluded. The heteroskedastic effects are corrected using the White’s HCSEC, which
improves the significance of the estimates.