market structure, patient elective patients · market structure, patient choice and hospital...
TRANSCRIPT

CHE Research Paper 139
Market Structure, Patient Choice and Hospital Quality for Elective Patients
Giuseppe Moscelli, Hugh Gravelle,Luigi Siciliani


Market structure, patient choice and hospital quality for elective patients
aGiuseppe Moscelli aHugh Gravelle abLuigi Siciliani
a Centre for Health Economics, University of York, York, UK b Department of Economics and Related Studies, University of York, York, UK November 2016
Background to series
CHE Discussion Papers (DPs) began publication in 1983 as a means of making current research material more widely available to health economists and other potential users. So as to speed up the dissemination process, papers were originally published by CHE and distributed by post to a worldwide readership. The CHE Research Paper series takes over that function and provides access to current research output via web-based publication, although hard copy will continue to be available (but subject to charge). Acknowledgements
The work reported in this paper was funded by a grant from the Department of Health to the Policy Research Unit in the Economics of Health and Social Care Systems (Ref 103/0001). The views expressed are those of the authors and not necessarily those of the funders. Hospital Episode Statistics are Copyright 2002-2016, re-used with the permission of NHS Digital. All rights reserved. We are grateful for comments received at seminars in Monitor, the Universities of Duisburg-Essen and York, and at the European Health Economics Association conference (Hamburg, July 2016).
Further copies
Copies of this paper are freely available to download from the CHE website www.york.ac.uk/che/publications/ Access to downloaded material is provided on the understanding that it is intended for personal use. Copies of downloaded papers may be distributed to third-parties subject to the proviso that the CHE publication source is properly acknowledged and that such distribution is not subject to any payment. Printed copies are available on request at a charge of £5.00 per copy. Please contact the CHE Publications Office, email [email protected], telephone 01904 321405 for further details. Centre for Health Economics Alcuin College University of York York, UK www.york.ac.uk/che © Giuseppe Moscelli, Hugh Gravelle, Luigi Siciliani

Market structure, patient choice and hospital quality for elective patients i
Abstract
We examine the change in the effect of market structure on hospital quality for elective procedures (hip and knee replacements, and coronary artery bypass grafts) following the 2006 loosening of restrictions on patient choice of hospital in England. We allow for time-varying endogeneity due to the effect of unobserved patient characteristics on patient choice of hospital using Two Stage Residual Inclusion. We find that the change in the effect of market structure due to the 2006 choice reforms was to reduce quality by increasing the probability of a post-operative emergency readmission for hip and knee replacement patients. There was no effect of the choice reform on hospital quality for coronary bypass patients. We find no evidence of self-selection of patients into hospitals, suggesting that a rich set of patient-level covariates controls for differences in casemix. JEL Nos: H51, I11, I18, L32, L33. Keywords: competition, quality, hospital, choice, electives.

ii CHE Research Paper 139

Market structure, patient choice and hospital quality for elective patients 1
1. Introduction
Policy makers have expanded the scope of competition in the health care sector (EXPH, 2015; OECD, 2012). With low or zero co-payments, patient choice of hospital is influenced by quality and in many countries hospitals face regulated prices per patient treated and so can compete only over quality. In these circumstances it is argued that increasing competition amongst hospitals will lead to higher quality. Theory predicts that competition will increase quality when hospitals are profit maximisers and face regulated prices and constant marginal costs (Gaynor, 2006) provided that the price exceeds the cost of the marginal patient. But predictions are ambiguous when additional features of the hospital sector and the institutional context are taken into account (Katz, 2013). Hospitals in publicly-funded systems may face constraints on capacity resulting in an increasing marginal cost of treatment. Public and non-profit hospitals may have altruistic motives and a limited ability to appropriate profits. These may lead hospitals to treat patients whose marginal cost exceeds the regulated price. They can then react to increases in competition which make demand more responsive to quality by reducing quality (Brekke et al, 2011, 2014). An empirical literature, mostly from the US, and more recently from the UK, has investigated the effect of hospital competition on quality and has been the subject of intense debate (Bevan and Skellern, 2011; Bloom et al, 2011, 2012; Gaynor et al, 2013; OHE, 2012; Gravelle et al, 2012; Pollock et al 2011a; 2011b). A key concern is how to measure quality. Most studies have measured quality as the mortality rate for patients with emergency conditions, usually those who have had an acute myocardial infarction (AMI). But hospitals compete for elective (non-emergency) patients rather than emergency patients. The rationale for using a measure of quality for emergency patients is that unobservedly sicker elective patients may be more likely to choose higher quality hospitals thereby biasing the estimated relationship between quality and competition. Using health outcomes for emergency patients who are less likely to be choosing their provider mitigates potential bias from unobserved selection. But it relies on the assumption that quality for emergency patients is strongly correlated with quality for elective patients. Such correlation may arise because hospitals have altruistic concerns for both elective and emergency patients or because greater competition leads to better hospital management which improves both types of quality (Bloom et al, 2015). Hence it has been suggested that AMI mortality acts as a canary in the mineshaft for poor quality in other conditions, including electives. But correlations amongst measures of emergency quality, amongst measures of elective quality, and between emergency and elective quality are low. Gravelle et al (2014) examined 16 quality indicators across English hospitals and found correlations ranging
between 16% and 32%. In contrast to almost all the previous literature, we examine the relationship between competition and quality of care for the elective patients over whom hospitals should compete. We allow for time-invariant unobserved severity by using hospital fixed effects and control for endogeneity due to time-varying unobserved severity with a rich set of patient casemix variables and by using Two Stage Residual Inclusion (2SRI) (Terza et al, 2008) in which we instrument for choice of hospital using patient-hospital distances. We focus on three common elective procedures: hip and knee replacement, and coronary artery bypass grafts (CABG). In the English National Health Service (NHS) before 2006 the choice of hospitals for elective treatment was generally constrained to the set of local NHS hospitals which had contracts with the patient’s local health authority. In 2006 these constraints were relaxed and patients had to be offered a choice of at least 4 providers. We find that the change in the effect of market structure due to the 2006 choice reforms was to reduce quality as measured by the

2 CHE Research Paper 139
probability of a post-operative emergency readmission for hip and knee replacement patients. We find no effects of the choice reform on the quality of care (as measured by emergency readmission rates or mortality rates) for coronary artery bypass patients.
1.1 Related literature
We contribute to the growing empirical literature on the effect of competition on hospital quality. The evidence from the US is mixed. Kessler and McClellan (2000) and Kessler and Geppert (2005) find that AMI mortality was lower in more competitive markets. Gowrisankaran and Town (2003) report that more competition reduced heart attack and pneumonia mortality for patients with some types of insurance but increased it for others. Shen (2003) finds that competition, measured by the penetration of Health Maintenance Organisations (HMOs) at county level, increased 90-day mortality and the joint probability of dying or having complications within one year for AMI patients. In Mukamel et al (2001) market concentration had no effect on all-cause mortality. Colla et al (2014) find that competition reduced AMI mortality rates. Chou et al (2014) find that report cards on the quality of providers reduced CABG mortality for more severely ill patients in more competitive areas. The most recent empirical literature from England reports positive effects of competition on hospital quality. Bloom et al (2015) instrument for competition with the marginality of local Parliamentary seats and find that hospitals in more competitive areas had lower AMI mortality. Cooper et al (2011) and Gaynor et al (2013) find that hospitals in more competitive areas had sharper reductions in AMI mortality following the choice reforms of 2006. But studies of an earlier period find that competition reduced quality. Propper et al (2004) report that in the 1990s, providers facing more competition had higher AMI mortality. Propper et al (2008) find that when competition was allowed during the 1990s, providers in more competitive areas had a slower decline of AMI mortality and shorter waiting times. One possible reason for these contrasting findings is that, in the 1990s, hospital contracts and prices were negotiated with local health authorities rather than set nationally as was increasingly the case after 2002/3. Moreover there was poor information on quality and the focus of patients and local health authorities was on the more easily observed waiting times. We have a similar identification strategy to Cooper et al (2011) and Gaynor et al (2013) but use the 2006 choice reform to examine the effect of competition on elective rather than emergency quality. Fewer studies have examined the effect of competition on elective quality. Colla et al (2014) rely on observables to adjust for casemix and find that competition had no effect on 30-day emergency readmission rates for Medicare hip and knee replacement patients and reduced quality for dementia patients. Wilson (2016), like us, uses 2SRI to control for unobserved selection amongst haemodialysis patients in Atlanta and finds that quality at a provider is reduced when it takes over another facility. In a cross-section study of English hip replacement patients Feng et al (2015) measures quality using patient reported outcomes and find that increased competition has a positive but statistically insignificant association with quality. Cooper et al (2016) find that the opening of a private hospital near an NHS hospital led to a reduction in its pre-operative length of stay for hip and knee replacement patients, but left the NHS provider to treat sicker patients who had longer post-operative length of stay. In the next section we sketch the institutional background. Section 3 explains the econometric specification and Section 4 describes the data. We present the results in Section 5 and discuss their implications in Section 6.

Market structure, patient choice and hospital quality for elective patients 3
2. Institutional background
NHS hospital treatment is tax funded and there are no charges to patients. Patients can only access elective hospital care by a referral from their general practitioner. Most hospital care for NHS patients is provided by public hospitals (NHS Trusts) which are public bodies subject to tight financial and regulatory control and expected to break even. A series of changes in the market for NHS funded hospital care were introduced during our study period with the intention of reducing waiting times for hospital care and stimulating competition to improve quality (Department of Health, 2000; 2002). From 2003/4 private sector providers (Independent Sector Treatment Centres – ISTCs) were encouraged to enter the market. By 2010/11, they treated 4% of NHS elective patients, concentrating on a small number of high volume procedures such as hip replacements (Hawkes, 2012). Local health authorities (Primary Care Trusts – PCTs) held budgets from the Department of Health to purchase hospital care for their populations. Before 2003/4, PCTs mainly placed block contracts with local healthcare providers, with the provider receiving a lump sum for agreeing to treat all patients from the PCT who were referred by their GP. GPs could in principle refer to any NHS provider, with an out of area tariff being charged if the provider was not in contract with the PCT in which the patient was resident. Between 2003/4 and 2008/9 prospective payment per patient was rolled out, with the proportion of treatments covered increasing over time. Under prospective pricing, hospitals can increase their profits if they attract more patients and the cost of treatment is smaller than the nationally fixed per patient tariff. Until 2006, the amount of choice for elective care varied across PCTs and general practices, depending on the set of hospital with which the PCT had placed block contracts and GPs’ willingness to refer outside this set. In January 2006, NHS elective patients were given the right to be offered a choice of at least four providers. From April 2008 onwards, they had the right to choose any qualified provider, public or private. To complement the choice reform, an electronic booking service for outpatient appointments was rolled out from 2005 to help patients and their GPs make a firm booking during a consultation (Dusheiko and Gravelle, 2015). In 2007 the NHS Choices website was established to provide public information on services and quality of providers. These policies led to changes in demand patterns and increased hospital elasticity of demand with respect to quality (Gaynor et al, 2016; Moscelli et al, 2016).

4 CHE Research Paper 139
3. Methods
3.1 Model specification
We estimate patient level linear1 models for the probability that the patient has an emergency readmission within 28 days of their discharge from hospital following their elective procedure for hip replacement, knee replacement, or CABG. For CABG patients we also estimate linear probability models for death (in or outside hospital) within 30 days of index admission for their CABG procedure (see Section 4.1). The models include measures of market structure interacted with a choice policy reform indicator which is turned on for the years from 2006 onwards when it was introduced. Our baseline specification is
0 ( ) 1 1 2 22006/72005/6ˆ
iht t t t h it ht r ht h it htttq M X X r
1 1 (1)
where qiht is equal to 1 if patient i treated in site h in year t (t = 2002/3,…,2010/11)2 had an
emergency readmission within 28 days of hospital admission and zero otherwise. hM is market
structure, measured as the equivalent number of rivals (see section 4.2), facing site h averaged
across the years before the introduction of patient choice in 2006. 1itX is a vector of patient
covariates, 2htX is a vector of hospital-specific time-varying covariates, h is a time-invariant
hospital site effect. εit is the effect of unobserved patient characteristics and εht is the effect of
unobserved provider characteristics. ( )t t1 is a vector of year dummies to control for temporal shifts
in readmission or mortality risk. 2006/7t
1 is the choice policy indicator, being equal to 0 in the four
pre-choice reform years (2002/3 to 2005/6) and to 1 in the five post-reform years (2006/7 to
2010/11). Finally, htr is the residual from a first stage demand model and is included to allow for
patient selection of provider based on unobserved morbidity (described in detail in section 0 below). The key coefficient is γ which is the change in the effect of having more competitors after the relaxation of constraints on patient choice in 2006. This coefficient requires careful interpretation. There can be no change in incentives for quality from lifting restrictions on patient choice for a provider with no rivals. Hence, with a linear relationship between market structure and quality, the
effect of the 2006 choice reform on quality for a provider with hM rivals is γ
hM : the policy reform
pivots the linear quality function about its intercept on the quality axis. Thus the sign of γ conveys useful policy information: whether the 2006 choice reform increased or reduced readmission or
mortality and γhM is the magnitude of this effect for hospital h. But estimates of γ by themselves
do not tell us whether having more competitors will increase or reduce readmissions or mortality. We estimate (1) with hospital site fixed effects and with cluster robust standard errors to allow for heteroscedasticity and correlation of the outcomes of patients within hospital sites. Hospital site fixed effects control for unobserved time-invariant provider heterogeneity. Year dummies control for time-varying factors such as other policy changes and technical progress. We use a rich set of patient characteristics to control for severity (see Section 4.1).
1 Like most other papers on hospital quality and competition we prefer the linear probability specification to non-linear
alternatives. The estimation of the hospital fixed effects is biased in nonlinear models when the panel is shorter than 20 periods (Greene, 2004). Nonlinear models are also more sensitive to measurement error affecting either the dependent or independent variables (Hausman, 2001). 2 Data is for financial years (1 April to 31 March).

Market structure, patient choice and hospital quality for elective patients 5
There are two main threats to identification of the effects of market structure and choice policy: endogeneity of market structure and patient selection of providers. Our preferred measure of market structure is based on the Herfindahl Hirschman Index (HHI): the sum of the square of provider market shares. Since observed market shares may depend on provider quality we follow the standard practice (Kessler and McClellan, 2000) of computing the HHI using predicted market shares from a model in which patient choice of provider depends on distance and other covariates but does not depend on quality (see Section 4.2). Using predicted HHI does not eliminate another source of potential endogeneity of market structure: new providers may choose to locate near poor quality incumbents. Hence in our baseline
specification (1) we follow Gaynor et al (2013) and use time-invariant market structure (hM ) that is
not affected by endogenous entry and exit decisions. Moreover, the main source of changes in market structure over the period 2002/3 to 2010/11 was the entry of ISTCs specialising in a small number of treatments including hip and knee and replacements. ISCTs were encouraged to locate in areas where NHS patients were experiencing long waiting times (Department of Health, 2004; Department of Health, 2006). Cooper et al (2016, Table A3) found that whilst ISTC entry was more likely where existing NHS providers had longer waiting times it was not associated with length of stay or quality. Thus endogeneity may not be a problem even if we measure market structure at treatment level. If pressure on management to improve quality is driven by overall elective competition, as in Bloom et al (2105), then the fact that ISTCs accounted for only 4% of elective NHS treatments even at the end of our period also suggests that endogeneity may not be an important problem. Our baseline model uses measures of competition for all electives but we also report results from models using market structure measured at speciality and treatment level.
3.2 Endogenous patient selection of hospital
The second potential identification problem is that unobservable patient morbidity εit, which will affect the probability of readmission or mortality qiht, may also affect patient choice of provider and bias the estimates of effects of market structure on hospital quality (Gowrisankaran and Town, 1999;
Geweke et al, 2003). Dropping r from (1) we can write quality as ihtq = 0 + qht + φ1X1it + εit + εht,
where hospital h quality in year t (its contribution to patient outcome qiht) is qht = 2006/7h t
M
1
2 2ht hX . The specification without r will yield biased estimates of the coefficients , h, 2
determining qht if
cov( , )ht itq = (cov( , ) cov( , [ ]ht it ht itE q h E q h E h cov( , [ ])ht itq E h ≠ 0. (2)
From Bayes’ Rule3
[ ]itE h( , , )
( )( , , ) ( )
tit htit it it
t
it ht it
P qf d
P q f d
(3)
where P(it,qht,) = Pr ith = Piht is the probability that patient i in year t chooses hospital h and
ft(it) is the density function for unobserved patient morbidity in year t. Sufficient conditions for
3 Pr Pr / Pr Pr Pr / Prit it it ith h h h h .

6 CHE Research Paper 139
cov( , )ht itq ≠ 0 are that unobserved morbidity affects choice of provider (P(it,qht)/ht ≠ 0)
(otherwise [ ]itE h = [ ]itE ) and that the probability of choice of provider h varies with provider
quality (P2(it,qht)/qhtht ≠ 0). Our baseline quality specification (1) allows for this potential endogeneity in two ways. First, we use a rich set of observed patient characteristics, including comorbidities and past emergency hospital admission. Second, we use a variant of Two Stage Residual Inclusion (2SRI) (Terza et al, 2008). In the first stage we model patient choice of provider as depending only on patient characteristics and on distances to providers and use it to predict the number of patients choosing each provider. We then estimate the patient level quality model including the first stage regression residuals (the difference between the actual and predicted number of patients using the hospital). The residuals
htr pick up the effect of unobserved average patient morbidity on the choice of hospital and so
remove the bias produced by endogenous patient selection of hospital. The large number of hospital sites in our sample makes it unfeasible to estimate the first stage patient choice model as a multinomial probit (as in Geweke et al, 2003). Instead we estimate a Poisson choice model of the number of patients at each hospital which is equivalent to the conditional logit (Guimaraes et al, 2003). The model is estimated separately for each year and specifies the conditional mean of the number of patients resident in Lower Super Output Area (LSOA)4 j choosing hospital h in year t as
1 50| , ,..., , ,jht t j t j t jt htn d d X X
50 3 50 3
1 2 1exp .Xd
t t ht t jt kt jkt kt jkt jtk kX X d d X
(4)
Here Xht are hospital characteristics, jtX are average characteristics of patients in LSOA j (age,
gender, comorbidities, past emergency admissions), and djkt is the distance between the centroid of LSOA j and k’th nearest hospital in the choice set of LSOA j. The distances djkt are the excluded instruments (Gowrisankaran and Town, 1999, Kessler and McLellan, 2000, Geweke et al, 2003). We use the 50 nearest hospitals since 99.5% of elective patients choose a hospital from this set. Given the large number of LSOA-hospital pairs which have zero admissions, we estimate (4) as a zero-inflated Poisson regression model (Lambert, 1992, Long and Freese, 2006). For each year, we compute the hospital standardized residual as
0.5
ˆ ˆ ˆht ht ht htr n n n where nht =
1
J
jhtjn
and ˆhtn =
1ˆ
J
jhtjn
are the actual and predicted
number of patients treated at hospital h in year t. The standardized residuals are included in the baseline quality model (1) and we bootstrap the standard errors with 1000 replications to account
for the sampling error resulting from the inclusion of the imputed regressors htr (Murphy and Topel,
1985).
4 There were 32,482 LSOA in England with average populations of 1500. They had a mean population of 1500
and were constructed to be socially homogeneous with respect to housing tenure.
Market structure, patient choice and hospital quality for elective patients 7
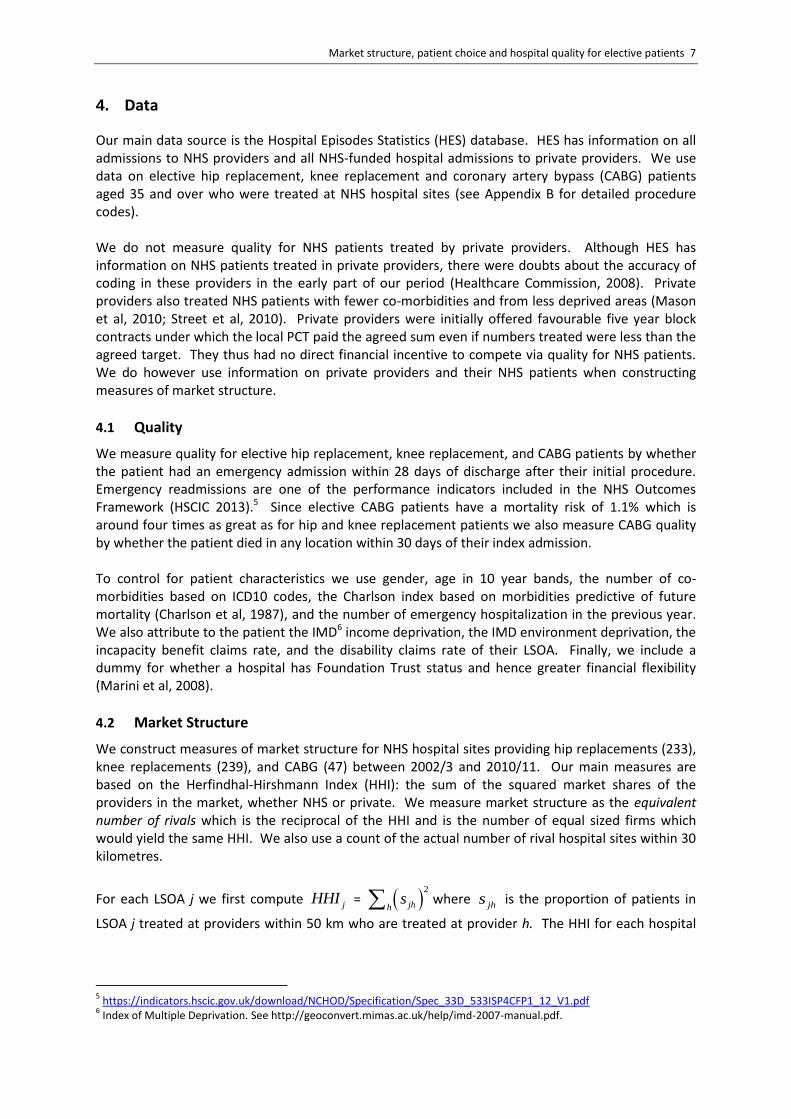
4. Data
Our main data source is the Hospital Episodes Statistics (HES) database. HES has information on all admissions to NHS providers and all NHS-funded hospital admissions to private providers. We use data on elective hip replacement, knee replacement and coronary artery bypass (CABG) patients aged 35 and over who were treated at NHS hospital sites (see Appendix B for detailed procedure codes). We do not measure quality for NHS patients treated by private providers. Although HES has information on NHS patients treated in private providers, there were doubts about the accuracy of coding in these providers in the early part of our period (Healthcare Commission, 2008). Private providers also treated NHS patients with fewer co-morbidities and from less deprived areas (Mason et al, 2010; Street et al, 2010). Private providers were initially offered favourable five year block contracts under which the local PCT paid the agreed sum even if numbers treated were less than the agreed target. They thus had no direct financial incentive to compete via quality for NHS patients. We do however use information on private providers and their NHS patients when constructing measures of market structure.
4.1 Quality
We measure quality for elective hip replacement, knee replacement, and CABG patients by whether the patient had an emergency admission within 28 days of discharge after their initial procedure. Emergency readmissions are one of the performance indicators included in the NHS Outcomes Framework (HSCIC 2013).5 Since elective CABG patients have a mortality risk of 1.1% which is around four times as great as for hip and knee replacement patients we also measure CABG quality by whether the patient died in any location within 30 days of their index admission. To control for patient characteristics we use gender, age in 10 year bands, the number of co-morbidities based on ICD10 codes, the Charlson index based on morbidities predictive of future mortality (Charlson et al, 1987), and the number of emergency hospitalization in the previous year. We also attribute to the patient the IMD6 income deprivation, the IMD environment deprivation, the incapacity benefit claims rate, and the disability claims rate of their LSOA. Finally, we include a dummy for whether a hospital has Foundation Trust status and hence greater financial flexibility (Marini et al, 2008).
4.2 Market Structure
We construct measures of market structure for NHS hospital sites providing hip replacements (233), knee replacements (239), and CABG (47) between 2002/3 and 2010/11. Our main measures are based on the Herfindhal-Hirshmann Index (HHI): the sum of the squared market shares of the providers in the market, whether NHS or private. We measure market structure as the equivalent number of rivals which is the reciprocal of the HHI and is the number of equal sized firms which would yield the same HHI. We also use a count of the actual number of rival hospital sites within 30 kilometres.
For each LSOA j we first compute jHHI = 2
jhhs where
jhs is the proportion of patients in
LSOA j treated at providers within 50 km who are treated at provider h. The HHI for each hospital
5 https://indicators.hscic.gov.uk/download/NCHOD/Specification/Spec_33D_533ISP4CFP1_12_V1.pdf
6 Index of Multiple Deprivation. See http://geoconvert.mimas.ac.uk/help/imd-2007-manual.pdf.

8 CHE Research Paper 139
site h is the weighted average of the jHHI with weights given by the proportion of patients from
LSOA j treated at hospital h,
2
h j hj jhjj hj hHHI HH s ss I
(5)
where shj is the proportion of site h patients from LSOA j within 50 km of site h. The equivalent
number of rivals within 50 km of NHS hospital site h is 1/hHHI .
Regressing quality on 1/hHHI where
hHHI is computed using actual patient flows runs the risk of
bias from reverse causality since the number of patients choosing hospital h will be affected by its quality (Kessler and McClellan, 2000). We therefore follow the standard practice of using HHIs computed from predicted patient flows from a model of patient choice which does not include hospital quality as an explanatory. We estimate Poisson choice models (Guimaraes et al, 2003; Guimaraes, 2004), for each year 2002/3 to 2010/11, in which the conditional mean number of patients7 from LSOA j choosing provider h in year t is
2 2
1 2 1 2| , , expjht jt jh ht tj t jh t jh ht tX jh ht t X jh ht t Xn d X d d X d X d X (6)
where djh is the straight line distance from the centroid of LSOA j to hospital site h and Xht is a vector of dummies for hospital characteristics (NHS or private, belonging to a Foundation Trust, belonging to a teaching Trust, located in London) for hospital h in year t. We then use the predicted shares,
ˆ ˆ ˆ/jht jht jhths n n and ˆ ˆ ˆ/hjt jht jhtj
s n n to compute the predicted HHI and the predicted
equivalent number of equally sized rivals. It is possible that quality for a procedure depends on competition in the market for that procedure (hip replacement, knee replacement, CABG) or in the market for the speciality (musculoskeletal, circulatory),8 or in the market for all electives. We therefore compute the equivalent number of rivals using predicted HHIs defined by choice of provider by patients receiving the procedure, by all patients being treated in the speciality, and by all elective patients.
7 In the choice models, we only use elective admissions that are classified by the HSCIC as booked or from the waiting lists
and exclude planned admissions which are usually part of a sequence of admissions for a course of treatment such as dialysis for kidney disease or chemo-therapy for cancer. 8 See Appendix B for formal definitions of the procedures and specialties.

Market structure, patient choice and hospital quality for elective patients 9
5. Results
5.1 Summary statistics
Table 1 reports the descriptive statistics on NHS patients treated in NHS providers. Mean ages are 65 years for CABG, 68 for hip replacement, and 68 for knee replacement. Over 80% of CABG patients are male, and 60% and 58% of hip and knee replacement are female. Hip and knee replacement patients have an average of three co-morbidities whilst CABG patients have five. CABG patients had more emergency admissions in the year prior to treatment than hip and knee replacement patients. CABG patients travelled 19 kilometres further to their provider than hip and knee replacement patients, reflecting the smaller number of CABG providers. Figure 1 shows trends in the number of patients treated in NHS hospitals between 2002/3 and 2010/11. Hip and knee replacements increased and then fell slightly as private providers took more NHS patients. CABGs declined over the entire period.
Figure 1. Volume of CABG, hip and knee replacement elective operations in NHS hospitals, financial years
2002/03-2010/11.

10 CHE Research Paper 139
Table 1. Elective patients: descriptive statistics.
Hip Replacement Patients
Knee Replacement Patients
CABG Patients
Mean SD Min Max
Mean SD Min Max
Mean SD Min Max
Emergency readmission within 28 days 0.0518 0.2216 0 1
0.0182 0.1335 0 1
0.041 0.199 0 1
Died within 30-days 0.0028 0.0529 0 1
0.0022 0.0473 0 1
0.011 0.106 0 1
Emergency admissions in year before treatment 0.08 0.37 0 25
0.07 0.33 0.00 45
0.29 0.65 0 41
Age 68.42 10.81 35 103
69.99 9.26 35.00 103
65.36 9.16 35 95
Female 0.60 0.49 0 1
0.58 0.49 0 1
0.18 0.39 0 1
Number of diagnoses on admission 3.03 2.07 1 20
3.10 2.06 1 20
5.69 2.95 1 20
Charlson Index: zero co-morbidities 0.79 0.41 0 1
0.75 0.43 0 1
0.57 0.50 0 1
Charlson Index: one co-morbidity 0.16 0.37 0 1
0.19 0.40 0 1
0.30 0.46 0 1
Charlson Index: more than one co-morbidity 0.05 0.21 0 1
0.05 0.22 0 1
0.13 0.34 0 1
Distance to chosen hospital 13.29 17.77 0.00 540.14
11.83 15.33 0.00 473.76
32.70 36.74 0.00 489.25
IMD income deprivation 0.12 0.10 0.00 0.96
0.14 0.11 0.00 0.96
0.14 0.11 0.00 0.96
IMD living environment 18.61 14.65 0.06 93.52
19.43 15.19 0.06 93.52
20.42 15.97 0.14 93.52
Incapacity claims 0.03 0.02 0.00 0.25
0.03 0.02 0.00 0.25
0.04 0.02 0.00 0.25
Disability claims 0.05 0.03 0.00 0.25
0.05 0.03 0.00 0.25
0.05 0.03 0.00 0.25
Number of patients 454,782
486,325
113,526 Note. NHS patients treated in NHS hospital sites only, 2002/3 to 2010/11.

Market structure, patient choice and hospital quality for elective patients 11
Figure 2. Trends in risk-adjusted standardised hospital quality measures.
Notes: Data points plot from an OLS regression of the risk-adjusted hospital quality measures (readmission or mortality rates) on years. Regression R
2 provided in the graphs.
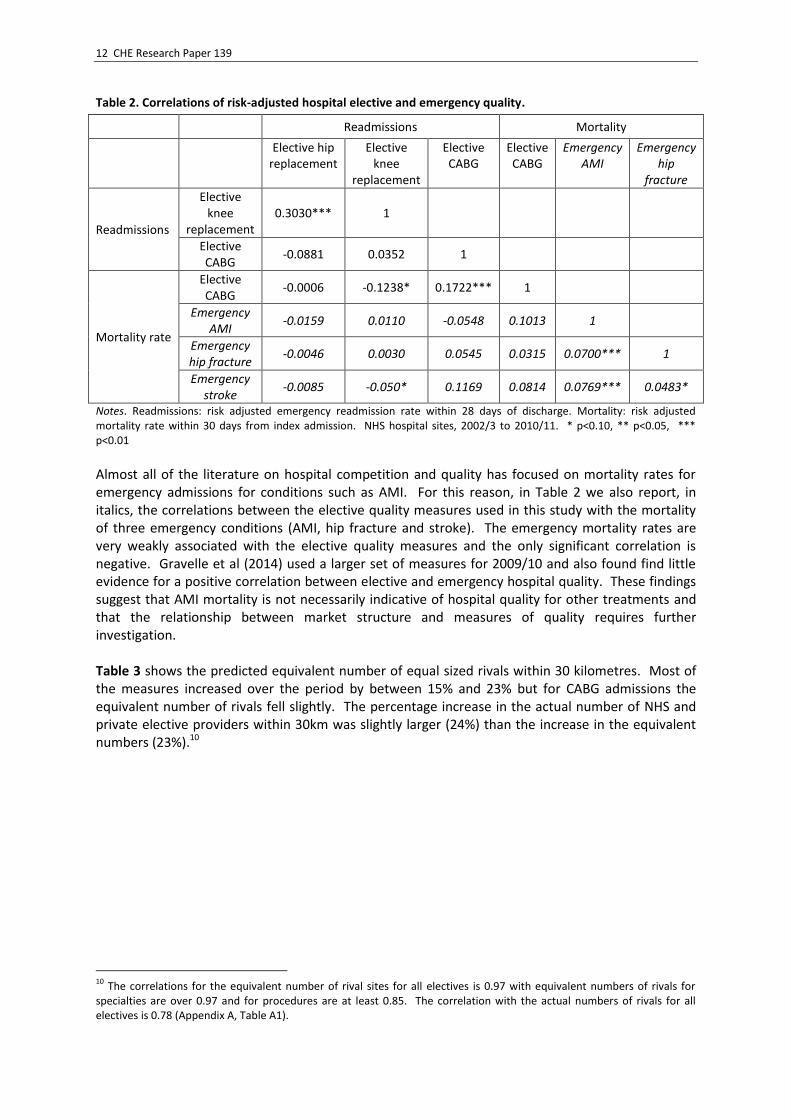
Figure 2 has the trends in risk-adjusted quality.9 Figure 2 suggests that risk-adjusted quality declined over the period reflecting either a secular decline in provider quality or an increase in unobserved morbidity of admitted patients, possibly due to changes in GP referral and hospital admission thresholds. Table 2 reports correlations among risk-adjusted NHS hospital site quality measures for our three elective procedures. Knee and hip replacement emergency readmission rates are significantly positively correlated (0.3) which is perhaps to be expected since they are in the same speciality and may be carried out by the same surgical teams. CABG readmission and mortality rates are also significantly positively correlated (0.17). The correlations between the CABG and the hip and knee replacement quality measures are weak and three out of four are negative.
9 We follow HSCIC methodology in risk adjusting for patient casemix (HSCIC, 2015). We estimate risk-adjusted emergency
readmissions (or CABG mortality) based on a logit model and controlling for Charslon index co-morbidities, number of diagnosis, age groups, gender, interactions of age groups with gender, income deprivation at LSOA level, day of the week, month and year of admission.
12 CHE Research Paper 139
Table 2. Correlations of risk-adjusted hospital elective and emergency quality.
Readmissions Mortality
Elective hip replacement
Elective knee
replacement
Elective CABG
Elective CABG
Emergency AMI
Emergency hip
fracture
Readmissions
Elective knee
replacement 0.3030*** 1
Elective CABG
-0.0881 0.0352 1
Mortality rate
Elective CABG
-0.0006 -0.1238* 0.1722*** 1
Emergency AMI
-0.0159 0.0110 -0.0548 0.1013 1
Emergency hip fracture
-0.0046 0.0030 0.0545 0.0315 0.0700*** 1
Emergency stroke
-0.0085 -0.050* 0.1169 0.0814 0.0769*** 0.0483*
Notes. Readmissions: risk adjusted emergency readmission rate within 28 days of discharge. Mortality: risk adjusted mortality rate within 30 days from index admission. NHS hospital sites, 2002/3 to 2010/11. * p<0.10, ** p<0.05, *** p<0.01 Almost all of the literature on hospital competition and quality has focused on mortality rates for emergency admissions for conditions such as AMI. For this reason, in Table 2 we also report, in italics, the correlations between the elective quality measures used in this study with the mortality of three emergency conditions (AMI, hip fracture and stroke). The emergency mortality rates are very weakly associated with the elective quality measures and the only significant correlation is negative. Gravelle et al (2014) used a larger set of measures for 2009/10 and also found find little evidence for a positive correlation between elective and emergency hospital quality. These findings suggest that AMI mortality is not necessarily indicative of hospital quality for other treatments and that the relationship between market structure and measures of quality requires further investigation. Table 3 shows the predicted equivalent number of equal sized rivals within 30 kilometres. Most of the measures increased over the period by between 15% and 23% but for CABG admissions the equivalent number of rivals fell slightly. The percentage increase in the actual number of NHS and private elective providers within 30km was slightly larger (24%) than the increase in the equivalent numbers (23%).10
10
The correlations for the equivalent number of rival sites for all electives is 0.97 with equivalent numbers of rivals for specialties are over 0.97 and for procedures are at least 0.85. The correlation with the actual numbers of rivals for all electives is 0.78 (Appendix A, Table A1).

Market structure, patient choice and hospital quality for elective patients 13
Table 3. Market structure measures.
2002/3-2005/6 2006/7-2010/11
Mean SD Min Max Mean SD Min Max
Equivalent number hospital sites within 30km All elective admissions 3.39 2.46 1 12.99 4.05 2.76 1 13.78
Circulatory admissions 3.46 2.50 1 12.32 4.02 2.82 1 12.23 Musculoskeletal admissions 2.77 1.91 1 9.93 3.40 2.13 1 10.93 Hip Replacement admissions 1.60 0.78 1 4.59 1.86 1.02 1 5.50 Knee Replacement admissions 1.60 0.75 1 4.40 1.87 0.87 1 4.68 CABG admissions 2.04 1.40 1 5.04 2.00 1.45 1 4.91 Number NHS & ISP sites within 30km 14.47 16.93 0 63 17.99 20.58 0 76 Number ISP sites within 30km 0.15 0.43 0 2 1.73 2.24 0 12 Notes. Equivalent number: inverse of the predicted Herfindahl-Hirschman Index. ISP (NHS) hospital sites: privately (NHS) owned sites treating at least 100 NHS funded elective (excluding planned) patients per year.
5.2 Estimation results
Table 4 reports the coefficient (γ) on the interaction between the pre-2006 market structure (based on all elective patients) and the post-2006 choice reform indicator from with our baseline specification (1) with time-invariant market structure. In panels a and b of Table 4 the interaction coefficient is positive and statistically significant at 5% and 10% level for hip and knee emergency readmissions respectively. Thus the impact of the 2006 choice reform was to increase emergency readmissions following hip and knee replacements, with a bigger increase for providers with a larger equivalent number of rivals in the pre-reform period. For CABG emergency readmission and mortality the interaction coefficient is negative but not statistically significant even at 10% level. The comparison of panels a and b of Table 4 shows that adding the residuals from a first-stage model of patient demand for each provider to control for possible time-varying selection of sicker patients into higher quality hospitals makes no difference to the estimated impact of the choice reforms and the residuals are not significant for any of the procedures. The implied absolute increase in the readmission probability for hip replacement evaluated at the mean pre-choice market structure is 0.0044 (γ*M = 0.0013*3.39). Given a readmission probability over the sample period of 0.0518, this implies a relative increase in the risk of readmission of 8.5% (100*(0.0044/0.0518)). For knee replacements the absolute increase in the readmission probability is 0.0014 compared with a readmission probability of 0.0182, which implies relative increase in risk of readmission of is 7.7% and similar to the relative increase for hip replacement.

14 CHE Research Paper 139
Table 4. Impact of choice reform with time-invariant pre reform market structure
(1) (2) (3) (4)
Hip Replacement Emergency
Readmission
Knee Replacement Emergency
Readmission
CABG Emergency
Readmission
CABG Mortality
a. No allowance for selection Choice Policy*Mkt Structure (γ) 0.0013** 0.0004* -0.0001 -0.0001
(2.096) (1.847) (-0.229) (-0.310)
R2 0.0088 0.0029 0.0029 0.017
b. With allowance for selection Choice Policy*Mkt Structure (γ) 0.0013** 0.0004* -0.0001 -0.0002 (2.080) (1.921) (-0.246) (-0.411) Standardised residual 0.0148 -0.0345 0.0058 0.0257 (0.272) (-1.147) (0.086) (0.722) R
2 0.0088 0.0029 0.0029 0.017
c. With private providers Choice Policy*Mkt Structure (γ1) 0.0012* 0.0004* -0.0001 -0.0001 (1.833) (1.685) (-0.129) (-0.357) Num. of Priv. Hosp. 30km 0.0003 0.0001 -0.0002 -0.0001 (0.726) (0.235) (-0.309) (-0.183) Standardized residual 0.0150 -0.0345 0.0045 0.0253 (0.277) (-1.142) (0.065) (0.715) R
2 0.0088 0.0029 0.0029 0.017
Patients 453151 484844 112098 113524 Hospital Sites 233 239 47 47
Notes. Dependent variables: patient in NHS provider had emergency readmission within 28 days from discharge following index admission, or CABG patient in NHS provider died within 30 days. Choice Policy: indicator for 2006/7 onwards. Market structure: average of estimated equivalent number of rival hospital sites (= 1/(predicted HHI)) for all elective patients, 2002/3 to 2005/6. Standardised residual: difference between actual number of patients and number predicted from 1stage model excluding quality divided by standard deviation of predicted number. Financial years 2002/3- 2010/11. All models include year effects, hospital site fixed effects, patient and hospital covariates. t-statistics in parentheses; *p<0.1,
** p<0.05, *** p<0.01.
It has been suggested that private providers attract less severe NHS patients (Mason et al, 2010; Street et al, 2010). Hence with an increasing number of private providers over the period considered in our analysis the unobserved severity of patients treated in NHS providers could have increased.11 To address this concern, in panel c of Table 4 we add the number of private providers within 30km to our baseline model and find that its coefficient is not statistically significant and that the interaction coefficient γ is almost unchanged. This suggests that trends in severity of patients in NHS providers due to the increase in private providers are adequately captured by our set of patient casemix controls and the demand residuals.
11
This was the case for the observed morbidity measures. For example, the number of comorbidities increased from 4.88 before the choice reform to 6.54 post reform for CABG, from 2.6 to 3.33 for hip replacement, and from 2.63 to 3.4 for knee replacement.

Market structure, patient choice and hospital quality for elective patients 15
Table 5. Impact of choice reform with time-invariant pre reform market structure with and without casemix controls.
(1) (2) (3) (4) (5)
Hip Replacement Emergency Readmission
Choice Policy * Mkt Struct. (γ) 0.0014** 0.0015** 0.0015** 0.0013** 0.0013**
(2.320) (2.348) (2.455) (2.077) (2.080)
Standardised residual 0.0091 0.0121 0.0183 0.0152 0.0148
(0.164) (0.218) (0.330) (0.278) (0.272)
R2 0.0042 0.007 0.0073 0.0087 0.0088
Knee Replacement Emergency Readmission
Choice Policy * Mkt Struct. (γ) 0.0005** 0.0005** 0.0005** 0.0004* 0.0004*
(2.287) (2.287) (2.296) (1.918) (1.921)
Standardised residual -0.0409 -0.0398 -0.0338 -0.0349 -0.0345
(-1.377) (-1.334) (-1.128) (-1.161) (-1.147)
R2 0.0016 0.0025 0.0026 0.0029 0.0029
CABG Emergency Readmission
Choice Policy * Mkt Struct. (γ) -0.0001 -0.0001 -0.0001 -0.0001 -0.0001
(-0.284) (-0.257) (-0.124) (-0.248) (-0.246)
Standardised residual 0.0144 0.0134 0.0140 0.0059 0.0058
(0.210) (0.199) (0.216) (0.088) (0.086)
R2 0.0011 0.0014 0.0023 0.0029 0.0029
CABG Mortality
Choice Policy * Mkt Struct. (γ) -0.0001 -0.0001 -0.0001 -0.0002 -0.0002
(-0.345) (-0.297) (-0.204) (-0.409) (-0.411)
Standardised residual 0.0440* 0.0428* 0.0419 0.0256 0.0257
(1.831) (1.798) (1.637) (0.719) (0.722)
R2 0.0015 0.0057 0.0061 0.016 0.017
Controls: Patient age & gender N Y Y Y Y Area income, disability, incapacity N N Y Y Y Patient comorbidity (excluding past emergency admissions)
N N N Y Y
Past emergency admissions N N N N Y Notes. Dependent variables emergency readmission within 28 days from discharge, CABG patient died within 30 days. Choice Policy: indicator for 2006/7 onwards. Market structure: average of Equivalent N rival hospital sites (= 1/(predicted HHI)) years 2002/3-2005/6. Standardised residual: difference between actual number of patients and number predicted from 1stage model excluding quality divided by standard deviation of predicted number. Financial years 2002/3-2010/11. All models include year effects, hospital site fixed effects, patient and hospital covariates. Same number of observations and sites as Table 4 except CABG models 1 and 2 which have 2 additional patients. t-statistics in parentheses; *p<0.1,
**
p<0.05, *** p<0.01.
The fact that the demand residuals are not significant and make no difference to the interaction coefficient γ between choice reform and market structure in Table 4 does not imply that there is no endogenous selection bias: the residuals might be poorly correlated with unobserved morbidity. Hence as a robustness check we report in Table 5 the results from five models which include the demand residuals and increasingly comprehensive sets of patient casemix controls. The full set of casemix controls (age, gender, number of co-morbidities, Charlson index, number of emergency admissions in the previous year, area income deprivation, environment deprivation, incapacity and disability benefit claims) are jointly highly statistically significant in explaining quality. Hence models which omit them are potentially subject to endogenous selection bias. If the demand model residuals are poor at picking up unobserved morbidity then, as the set of included casemix controls varies there will be no change in the coefficient on the demand residuals, but there will be changes in the coefficient on the interaction of market structure and the choice reform indicator.

16 CHE Research Paper 139
As the set of included casemix controls is increased in models 1 to 5 in Table 5 there is little change in the interaction coefficient between market structure and the choice reform for any of the quality measures. The demand residual coefficient is never significant when quality is measured by emergency readmissions. When quality is measured by CABG mortality the demand residuals are significant at 10% for the two models with the fewest number of casemix controls and the coefficients and their t-statistics get smaller as more casemix controls are added. These results suggest that there is no potential bias from endogenous selection in the models where quality is measured by emergency readmissions. When the CABG outcome is mortality, there may be endogenous selection when there are no or few casemix controls but this is absorbed by the demand residuals and becomes unimportant with a fuller set of casemix controls. We next investigate whether the results are robust to the definition of market structure and to the level at which market structure is measured (all elective, specialty or procedure). In panel a of Table 6 we measure market structure by a count of the number of rivals within 30km. The measure is unaffected by demand and hence quality, but it has the disadvantage that it makes no allowance for whether rivals differ in size. The results in Table 4, panel b, are very similar to those in the baseline model once we allow for the difference in the scale of the market structure measures (see Table 3). In panels b and c of Table 6 the markets are defined at speciality and at procedure level. Results are, again allowing for the change in scale of the market measures, very similar to those when the market is defined for all elective patients. This is reassuring though perhaps not surprising given that the unconditional correlations amongst the measures across all years are never less than 0.75 (see Appendix A, Table A1).
Table 6. Impact of choice reform with alternative time invariant market definitions
(1) (2) (3) (4)
Hip Replacement Emergency
Readmission
Knee Replacement Emergency
Readmission
CABG Emergency
Readmission
CABG Mortality
a. Mkt: number of rival hospitals 30km Choice Policy*Mkt Structure (γ) 0.0002*** 0.0001* -0.0000 0.0000 (2.702) (1.900) (-0.452) (0.300) Standardised residual 0.0048 -0.0373 0.0089 0.0201 (0.088) (-1.233) (0.129) (0.560)
b. Mkt: specialties
Choice Policy*Mkt Structure (γ) 0.0018** 0.0005** -0.0002 -0.0002
(2.270) (2.134) (-0.310) (-0.458)
Standardised residual 0.0160 -0.0340 0.0065 0.0262
(0.293) (-1.144) (0.096) (0.728)
c. Mkt: procedures
Choice Policy*Mkt Structure (γ) 0.0043** 0.0015** 0.0002 0.0005
(2.489) (2.534) (0.122) (0.609)
Standardised residual 0.0083 -0.0367 0.0019 0.0180
(0.154) (-1.226) (0.027) (0.504)
Notes. Dependent variables: patient in NHS provider had emergency readmission within 28 days from discharge
following index admission, or CABG patient in NHS provider died within 30 days from index admission. Choice Policy: indicator for 2006/7 onwards. Market structure: panel a – actual number of rival hospitals providing elective admissions; panel b – estimated equivalent number of rival hospital sites (= 1/(predicted HHI)) providing elective admissions in the speciality; panel c - estimated equivalent number of rival hospital sites (= 1/(predicted HHI)) providing elective admissions for the procedure. All market structure measures are means over 2002/3 to 2005/6. Standardised residual: difference between actual number of patients and number predicted from 1stage model excluding quality divided by standard deviation of predicted number. Financial years 2002/3- 2010/11. All models include year effects, hospital site fixed effects, patient and hospital covariates, and the same numbers of patients and sites as the models in Table 4. t-statistics in parentheses; *p<0.1,
** p<0.05, *** p<0.01.

Market structure, patient choice and hospital quality for elective patients 17
Our baseline specification (1) provides an estimate of the change in the effect of market structure due to the choice reform (γ). By using a time-invariant pre-reform market structure and provider fixed effects, as in Gaynor et al (2013), we avoid identification problems arising from possible endogeneity of market structure. To investigate how serious such endogeneity might be we estimate a specification where the choice policy indicator is interacted with time-varying market structure:
0 ( ) 1 1 2 22006/72005/6ˆ .iht t t t ht ht it ht ht h it httt
q M M X X r 1 1 (7)
Here Mht is the market structure facing site h in year t, δ is the marginal effect of market structure on
quality in the pre-Choice reform period, is the change in the marginal effect of market structure due to the choice reform. This specification with a time-varying measure of market structure is similar to Kessler and McClellan (2000) who examine the effect of market structure on AMI mortality and how this effect changed between two periods with different managed care penetration. Cooper et al (2011) also use a time-varying measure. Table 7. Impact of choice reform and time varying market structure
(1) (2) (3) (4)
Hip Replacement Emergency
Readmission
Knee Replacement Emergency
Readmission
CABG Emergency
Readmission
CABG Mortality
a. Mkt: all electives, time-varying Mkt Structure pre-reform (δ) 0.0002 0.0006 -0.0008 0.0000
(-0.216) (-1.262) (-0.819) (-0.027)
Choice Policy*Mkt Structure (γ) 0.0012** 0.0004** 0.0000 -0.0001
(2.134) (2.010) (0.046) (-0.343)
Mkt Structure post reform (δ+γ) 0.0014 0.0010 -0.0008 -0.0001 (1.408) (2.255) (-0.822) (-0.178) Standardised residual 0.0089 -0.0412 0.0045 0.0255
(0.163) (-1.351) (0.066) (0.717)
b. Mkt: specialities
Mkt Structure pre-reform (δ) 0.0004 -0.0003 -0.0008 0.0004
(0.269) (-0.437) (-0.752) (0.536)
Choice Policy*Mkt Structure (γ) 0.0015** 0.0005** 0.0001 -0.0001
(2.119) (2.261) (0.145) (-0.334)
Mkt Structure post reform (δ+γ) 0.0019 0.0002 -0.0007 0.0003 (1.493) (0.478) (-0.781) (0.382) Standardised residual 0.0128 -0.0352 0.0027 0.0247
(0.232) (-1.176) (0.039) (0.681)
c. Mkt: procedures
Mkt Structure pre-reform (δ) -0.0021 -0.0007 0.0017 0.0050
(-0.782) (-0.638) (0.370) (1.623)
Choice Policy*Mkt Structure (γ) 0.0043*** 0.0014*** 0.0002 0.0006
(2.672) (2.581) (0.099) (0.695)
Mkt Structure post reform (δ+γ) 0.0022 0.0007 0.0019 0.0056 (1.069) (0.766) (0.387) (1.857) Standardised residual 0.0088 -0.0368 -0.0000 0.0111 (0.163) (-1.228) (-0.000) (0.320) Notes. Dependent variables: patient had emergency readmission within 28 days from discharge following index admission OR CABG patient died within 30 days from index admission. Choice Policy: indicator for 2006/7 onwards. Market structure: equivalent N rival hospital sites (= 1/(predicted HHI)) in each year 2002/3 to 2010/11. All models include year effects, hospital site fixed effects, patient and hospital covariates, and the same number of sites and patients as the models in Table 4. t-statistics in parentheses; *p<0.1,
** p<0.05, *** p<0.01.

18 CHE Research Paper 139
In panels a to c of Table 7 we report results from specification (7) with time-varying measures of market structure based on all electives patients, patients within the relevant speciality, or patients in a given procedure. The coefficients on the interaction (γ) of time-varying market structure and the post-reform indicator in these panels are very similar to the interaction using the time-invariant market structure in Tables 4 (panel b) and Table 6 (panels b and c).12 Table 7 also reports estimates of the effects of time-varying market structure in the pre-reform period (δ) and the post-reform period (δ + γ). The fact that we obtain very similar estimates of the change in the effect of market structure (γ) from models with time-invariant and models with time-varying market structure, suggests that time-varying market structure is not endogenous or, less plausibly, that endogeneity induces the same amount of bias in the estimates of the effect of market structure for the pre- and post-reform periods. If we are willing to accept the first explanation, then δ and δ + γ in Table 7 are estimates of the effects of market structure on quality before and after the choice reform. However, all of the coefficients on market structure are imprecisely estimated and the estimated effects of market structure in the pre- and post-reform periods vary in sign across the quality indicators and the market definitions.
12
In their study of AMI mortality Gaynor et al (2013, Table A4, panel 3) also estimate a model with time-varying market structure and find that the coefficient on the interaction of choice policy and time-varying market structure (HHI) is very similar to the coefficient using time-invariant market structure.

Market structure, patient choice and hospital quality for elective patients 19
6. Conclusion
In this paper we investigated how the relaxation of constraints on patient choice of provider in the English NHS in 2006 changed the relationship between market structure and quality for three common elective NHS hospital treatments. For hip and knee replacements the effect of the 2006 choice reforms was to increase emergency readmissions within 28 days of discharge: quality fell. The choice reform had no effect on emergency readmissions or mortality for CABG patients. These results are robust to whether we measure market structure (the equivalent number of providers, ie the inverse of the Herfindhal index) for all elective patients, for patients within the speciality to which the selected procedure belongs (i.e. musculoskeletal specialty for hip and knee replacement, and circulatory specialty for coronary bypass) or for patients receiving the same procedure. They are also robust to how we allow for the possibility that patient choice of provider is influenced by their morbidity or severity. The estimated effects of the 2006 choice reform are very similar whether we instrument patient choice of provider using patient distances to alternative providers or just rely on a rich set of patient covariates. The implied absolute increase in the readmission probability for hip replacement due to the 2006 choice reform evaluated at the mean market structure is 0.0044, compared to readmission probability of 0.0518 across the whole period. For knee replacement the absolute increase in the readmission probability is smaller (0.0014) but, with a risk of readmission over the whole period of 0.0182, the relative increase is similar to that for hip replacement. The reduction in quality for elective hip and knee replacement patients following the 2006 lifting of restrictions on patient choice is perhaps surprising but is consistent with theoretical models showing that the effect of increased demand responsiveness to quality depend on the preferences of hospital decision makers and hospital cost functions (Brekke et al, 2011, 2104). For example, quality could fall following an increase in competition if the regulated price is less that the cost of treating additional patients or if the marginal cost of treatment is greater when quality is higher. Some other empirical studies have also found negative effects on elective quality. Nor are our results for elective quality incompatible with those from studies of emergency quality (Cooper et al, 2011; Gaynor et al, 2013) which use the same identification strategy but find that the patient choice reforms improved quality for AMI patients. For example, if the marginal cost of elective quality is higher the greater is emergency quality, then an increase in the responsiveness of elective demand to quality could reduce elective quality and increase emergency quality. In conclusion, our analysis highlights that the choice reforms have had mixed effects on hospital quality, depending on the type of procedure. The reductions in hospital quality in hospitals for hip and knee replacement procedures do not mean that patients undergoing these procedures were made worse off by the 2006 relaxation of constraints on choice of provider. Patients may place an intrinsic value on having a choice of provider (Dixon et al, 2010). Moreover, even if the reform reduced hospital quality patients could still gain from being able to switch to providers they preferred but which would have previously been unobtainable.
20 CHE Research Paper 139
References
Bevan. G., Skellern, M. (2011). Does competition between hospitals improve clinical quality? A review of evidence from two eras of competition in the English NHS, British Medical Journal, 343, d6470. Bloom, N., Propper, C., Seiler, S., Van Reenen, J. (2015). The impact of competition on management quality: evidence from public hospitals. The Review of Economic Studies, 82 (2), 457-489. Bloom, N., Cooper, Z., Gaynor, M., Gibbons, S., Jones, S., McGuire, A., Moreno-Serra, R., Propper, C., Van Reenen, J., Seiler, S. (2011). In defence of our research on competition in England's National Health Service. The Lancet, December 17/24/31, 2064-2065. Bloom, N., Cooper, Z., Gaynor, M., Gibbons, S., Jones, S., McGuire, A., Moreno-Serra, R., Propper, C., Van Reenen, J., Seiler, S. (2012). A response to Pollock et al., http://www.bristol.ac.uk/cmpo/publications/other/cpresponse.pdf. Brekke, K.R., Siciliani, L., Straume, O.R., (2011). Hospital competition and quality with regulated prices. Scandinavian Journal of Economics, 113, 444-469. Brekke, K.R., Gravelle, H., Siciliani, L., Straume, O.R. (2014). Patient choice, mobility and competition among health care providers, Chapter 1, pages 1-26, in R. Levaggi and M. Montefiori (eds.), Health Care Provision and Patient Mobility, Developments in Health Economics and Public Policy, 12, DOI: 10.1007/978-88-470-5480-6_1, Springer-Verlag. Chou, S., Deily, M.E., Li, S., (2014). Travel distance and health outcomes for scheduled surgery. Medical Care, 52(3), 250-257. Charlson, M. E., Pompei, P., Ales, K. L., MacKenzie, C. R. (1987). A new method of classifying prognostic comorbidity in longitudinal studies: development and validation. Journal of Chronic Diseases, 40(5), 373-383. Colla, C., Bynum, J., Austin, A., Skinner, J. (2014). Hospital Competition, Quality, and Expenditures in the US Medicare Population. https://tippie.uiowa.edu/economics /tow/papers/skinner-fall2014.pdf Cooper, Z., Gibbons, S., Jones, S., McGuire, A. (2011). Does hospital competition save lives? evidence from the English NHS patient choice reforms. The Economic Journal, 121(554), F228-F260. Cooper, Z., Gibbons, S., Skellern, M. (2016). Does competition from private surgical centres improve public hospitals’ performance? Evidence from the English National Health Service. Centre for Economic Performance Discussion Paper 1434. Department of Health (2000). The NHS Plan: A Plan for Investment, A Plan for Reform. Cm 4818-I. The Stationery Office, London. Department of Health (2002). Delivering the NHS Plan. Cm 5503. The Stationery Office, London. Department of Health (2004). The NHS improvement plan: Putting people at the heart of public services Cm 6268). The Stationery Office, London.

Market structure, patient choice and hospital quality for elective patients 21
Department of Health (2006). The Government’s Response to the Health Committee’s Report on Independent Treatment Centres. Cm 6930, The Stationery Office, London. Dixon, A., Robinson, R., Appleby, J., Burge, P., Devlin, N., Magee, H. (2010). Patient Choice: How Patients Choose and How Providers Respond. Kings Fund. London. Dusheiko, M., Gravelle, H. (2015). Choosing and booking – and attending? Impact of an electronic booking system on outpatient referrals and non-attendances. CHE Research Paper 116. EXPH - Expert Panel on Effective Ways of Investing in Health (2015). Investigating Policy Options regarding Competition among Providers of Health Care Services in EU Member States. European Union, http://ec.europa.eu/health/expert_panel/ index_en.htm. Last accessed 15 May 2105. Feng, Y., Pistollato, M., Charlesworth, A., Devlin, N., Propper, C., Sussex, J. (2015). Association between market concentration of hospitals and patient health gain following hip replacement surgery. Journal of Health Services Research & Policy, 20(1), 11–17. Gaynor, M. (2006). What do we know about competition and quality in health care markets? National Bureau of Economic Research Working paper w12301. Gaynor, M. (2006). What do we know about competition and quality in health care markets? National Bureau of Economic Research Working paper w12301 Gaynor, M., Moreno-Serra, R., Propper, C. (2013). Death by market power: reform, competition, and patient outcomes in the National Health Service. American Economic Journal: Economic Policy, 5(4), 134-166. Gaynor, M., Propper, C., Seiler, S. (2016). Free to choose? reform, choice, and consideration sets in the English National Health Service. American Economic Review (forthcoming). Geweke, J., Gowrisankaran, G., Town, R J. (2003). Bayesian inference for hospital quality in a selection model. Econometrica, 71(4), 1215-1238. Government’s Response to the Health Committee’s Report on Independent Sector Treatment Centres (2006), UK Government. Gowrisankaran, G., Town, R.J. (1999). Estimating the quality of care in hospitals using instrumental variables. Journal of Health Economics, 18(6), 747-767. Gowrisankaran, G., Town, R. 2003. Competition, payers, and hospital quality. Health Services Research, 38, 1403-1422. Gravelle, H., Santos, R., Siciliani, L., Goudie, R. (2012). Hospital quality competition under fixed prices (No. 080cherp). Gravelle, H., Santos, R., Siciliani, L. (2014). Does a hospital’s quality depend the quality of other hospitals? A spatial econometrics approach. Regional Science & Urban Economics, 49, 203-216. Greene, W. (2004). The behaviour of the maximum likelihood estimator of limited dependent variable models in the presence of fixed effects. The Econometrics Journal, 7(1), 98-119. Guimaraes, P., Figueirdo, O. and Woodward, D. (2003). A tractable approach to the firm location decision problem. Review of Economics and Statistics, 85(1), 201-204.

22 CHE Research Paper 139
Guimaraes, P. (2004). Understanding the multinomial-Poisson transformation. Stata Journal, 4(3), 265-273. Hausman, J. (2001). Mismeasured variables in econometric analysis: problems from the right and problems from the left. Journal of Economic Perspectives, 57-67. Hawkes, N. (2012). Private hospitals look to NHS for elective operations as private medical insurance falls, British Medical Journal, 345. Healthcare Commission (2008). Independent Sector Treatment Centres: The evidence so far. London: Commission for Healthcare Audit and Inspection. HSCIC (2013). Compendium of Population Health Indicators. https://indicators.ic.nhs.uk/download/NCHOD/Specification/Spec_33D_533ISP4CPP1_12_V1.pdf. HSCIC (2015). Indicator Specification: Summary Hospital-level Mortality Indicator. http://www.hscic.gov.uk/media/19099/SHMI-specification/pdf/SHMI_specification.pdf. Katz, M. L. (2013). Provider competition and healthcare quality: More bang for the buck?. International Journal of Industrial Organization, 31(5), 612-625. Kessler, D. P., McClellan, M. B. (2000). Is hospital competition socially wasteful? The Quarterly Journal of Economics, 115(2), 577-615. Kessler, D. P., Geppert, J. J., (2005). The effects of competition on variation in the quality and cost of medical care. Journal of Economics and Management Strategy, 14(3), 575-589. Lambert, D. (1992). Zero-inflated Poisson regression, with an application to defects in manufacturing. Technometrics, 34(1), 1-14. Long, J.S., Freese, J. (2006). Regression models for categorical dependent variables using Stata. Stata press. Marini, G., Miraldo, M., Jacobs, R., Goddard, M. (2008). Giving greater financial independence to hospitals—does it make a difference? The case of English NHS trusts. Health Economics, 17(6), 751-775. Mason, A., Street, A., Verzulli, R. (2010), Private sector treatment centres are treating less complex patients than the NHS, Journal of the Royal Society of Medicine, 103(8), 322–31. Moscelli, G., Sicilliani, L., Gutacker, N., Gravelle, H. (2016). Location, quality and choice of hospital: evidence from England 2002-2013. Regional Science & Urban Economics, 60, 112-124. Mukamel, D., Zwanziger, J., Tomaszewski, K.J., (2001). HMO penetration, competition and risk-adjusted hospital mortality. Health Services Research, 36, 1019-1035. Murphy, K., Topel, R. (1985). Estimation and Inference in Two-Step Econometric Models. Journal of Business & Economic Statistics, 3(4), 370-379. OECD (2012). Competition in Hospital Services, OECD Policy Roundtables, Directorate for Financial and Enterprise Affairs Competition Committee; available at www.oecd.org/daf/competition/50527122.pdf.

Market structure, patient choice and hospital quality for elective patients 23
OHE (2012). Report of the Office of Health Economics Commission on Competition in the NHS. Office of Health Economics. Pollock, A., Macfarlane, A., Kirkwood, G., Majeed, A., Greener, I., Morrelli, C., Boyle, S., Mellett, H., Godden, S., Price, D., Brhlikova, P. (2011a). No evidence that patient choice in the NHS saves lives. The Lancet, 378, December 17/24/31, 2057-2060. Pollock, A., Majeed, A., Macfarlane, A., Greener, I., Kirkwood, G., Mellett, H., Godden, S., Boyle, S., Morrelli, C., Brhlikova, P. (2011b). Authors' reply. The Lancet, 378, December 17/24/31, 2065-2066. Propper, C., Burgess, S., Green, K. (2004). Does competition between hospitals improve the quality of care?: Hospital death rates and the NHS internal market. Journal of Public Economics, 88(7), 1247-1272. Propper, C., Burgess, S., Gossage, D. (2008). Competition and quality: evidence from the NHS internal market 1991-9. The Economic Journal, 118, 138-170. Terza, J. V., Basu, A., Rathouz, P.J. (2008). Two-stage residual inclusion estimation: addressing endogeneity in health econometric modeling. Journal of Health Economics, 27(3), 531-543. Shen, Y.-S. (2003). The effect of financial pressure on the quality of care in hospitals. Journal of Health Economics, 22, 243-269. Street, A., Sivey, P., Mason, A., Miraldo, M., and Siciliani, L. (2010). Are English treatment centres treating less complex patients? Health Policy, 94(2), 150–7. Wilson, N. E., (2016). Market structure as a determinant of patient care quality. American Journal of Health Economics, 2(2), 241-271.

24 CHE Research Paper 139
Appendix A. Additional results
Table A1. Correlations amongst measures of market structure.
Equiv. Num. of hospital sites within 30km
All elective admissions
Circulatory admissions
Musculoskeletal admissions
Hip Replacement admissions
Knee Replacement admissions
CABG admissions
Equiv. Num. of hospital sites within 30km Circulatory admissions 0.9707 Musculoskeletal admissions 0.9692 0.9544
Hip Replacement admissions 0.8495 0.8941 0.8568 Knee Replacement admissions 0.8891 0.9120 0.9043 0.9335
CABG admissions 0.8508 0.8814 0.8044 0.8745 0.7683 Num. of NHS & ISP sites within 30km 0.7808 0.8551 0.7476 0.8939 0.7997 0.9020
Notes. Correlations are across sites and years. All correlations are significant at a p-value level of 1%.

Market structure, patient choice and hospital quality for elective patients 25
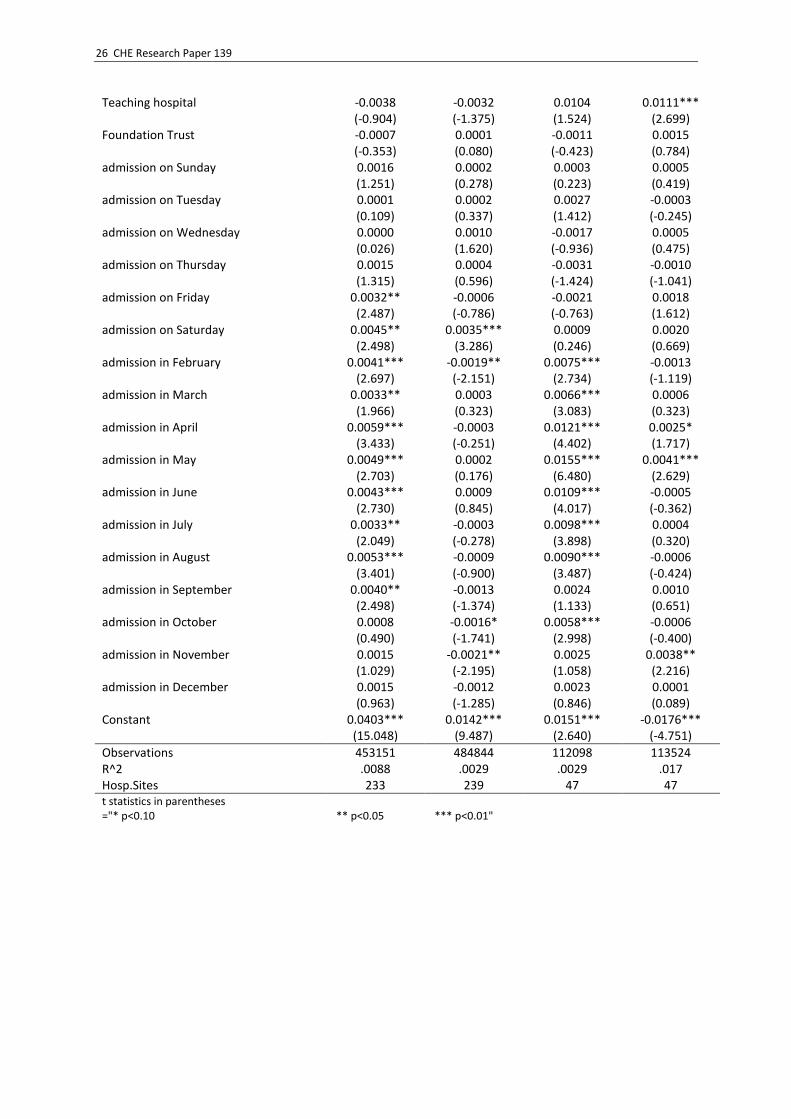
Table A2. Full results for models in text Table 4, panel b
(1) (2) (3) (4)
Hip Replacement Emergency
Readmission
Knee Replacement Emergency
Readmission
CABG Emergency
Readmission
CABG Mortality
2002 -0.0007 -0.0018** -0.0036 0.0054***
(-0.379) (-2.070) (-1.467) (2.754)
2003 -0.0022 -0.0004 -0.0040* 0.0040**
(-1.294) (-0.509) (-1.718) (2.157)
2004 -0.0015 -0.0019** -0.0003 0.0028**
(-0.946) (-2.208) (-0.142) (2.311)
2006 -0.0039 0.0000 -0.0014 0.0007
(-1.491) (0.044) (-0.388) (0.314)
2007 -0.0091*** -0.0016 0.0009 -0.0050**
(-3.536) (-1.532) (0.239) (-2.142)
2008 -0.0082*** -0.0011 -0.0025 -0.0049**
(-3.016) (-1.022) (-0.637) (-2.188)
2009 -0.0114*** 0.0010 -0.0052 -0.0070***
(-4.080) (0.939) (-1.294) (-2.671)
2010 -0.0140*** 0.0043*** -0.0012 -0.0117***
(-5.179) (3.563) (-0.307) (-4.666)
Choice Policy * Mkt Struct. 0.0013** 0.0004* -0.0001 -0.0002
(2.080) (1.921) (-0.246) (-0.411)
Pearson Residuals 0.0148 -0.0345 0.0058 0.0257
(0.272) (-1.147) (0.086) (0.722)
age 35-44 years -0.0206*** -0.0019 0.0038 -0.0058***
(-11.883) (-0.880) (0.768) (-4.072)
age 45-54 years -0.0171*** -0.0027*** -0.0022 -0.0069***
(-14.599) (-3.052) (-1.213) (-7.130)
age 55-64 years -0.0088*** -0.0021*** -0.0022 -0.0046***
(-9.823) (-4.185) (-1.602) (-5.610)
age 75-84 years 0.0099*** 0.0051*** 0.0045** 0.0088***
(10.394) (10.469) (2.093) (7.751)
age 85-94 years 0.0172*** 0.0122*** -0.0136* 0.0289***
(9.041) (8.604) (-1.739) (3.022)
age over 95 years 0.0403** 0.0228 -0.0218*** 0.0058**
(2.232) (1.333) (-7.203) (2.142)
emerg. adm. previous year 0.0048*** -0.0028*** -0.0015* 0.0019***
(4.752) (-5.134) (-1.799) (3.068)
Female -0.0093*** -0.0022*** 0.0040** 0.0049***
(-13.397) (-5.629) (2.419) (5.245)
Num of Diagnosis 0.0024*** 0.0010*** 0.0017*** 0.0033***
(11.190) (7.123) (7.153) (6.397)
Weighted Charlson Index = 1 0.0100*** 0.0009* 0.0026* 0.0012
(8.920) (1.678) (1.788) (1.057)
Weighted Charlson Index >= 2 0.0184*** 0.0018* 0.0053** 0.0152***
(8.780) (1.825) (2.377) (8.680)
IMD income deprivation 0.0128* 0.0085* 0.0268*** 0.0007
(1.847) (1.929) (3.154) (0.105)
IMD living environment deprivation 0.0001*** 0.0000* 0.0000 0.0000**
(2.799) (1.737) (0.557) (1.971)
Incapacity claims % -0.1508*** -0.0461* -0.1664** 0.0180
(-3.259) (-1.881) (-2.538) (0.433)
Disability claims % 0.1827*** 0.0339* 0.1085** -0.0342
(5.083) (1.825) (2.179) (-1.209)
26 CHE Research Paper 139
Teaching hospital -0.0038 -0.0032 0.0104 0.0111***
(-0.904) (-1.375) (1.524) (2.699)
Foundation Trust -0.0007 0.0001 -0.0011 0.0015
(-0.353) (0.080) (-0.423) (0.784)
admission on Sunday 0.0016 0.0002 0.0003 0.0005
(1.251) (0.278) (0.223) (0.419)
admission on Tuesday 0.0001 0.0002 0.0027 -0.0003
(0.109) (0.337) (1.412) (-0.245)
admission on Wednesday 0.0000 0.0010 -0.0017 0.0005
(0.026) (1.620) (-0.936) (0.475)
admission on Thursday 0.0015 0.0004 -0.0031 -0.0010
(1.315) (0.596) (-1.424) (-1.041)
admission on Friday 0.0032** -0.0006 -0.0021 0.0018
(2.487) (-0.786) (-0.763) (1.612)
admission on Saturday 0.0045** 0.0035*** 0.0009 0.0020
(2.498) (3.286) (0.246) (0.669)
admission in February 0.0041*** -0.0019** 0.0075*** -0.0013
(2.697) (-2.151) (2.734) (-1.119)
admission in March 0.0033** 0.0003 0.0066*** 0.0006
(1.966) (0.323) (3.083) (0.323)
admission in April 0.0059*** -0.0003 0.0121*** 0.0025*
(3.433) (-0.251) (4.402) (1.717)
admission in May 0.0049*** 0.0002 0.0155*** 0.0041***
(2.703) (0.176) (6.480) (2.629)
admission in June 0.0043*** 0.0009 0.0109*** -0.0005
(2.730) (0.845) (4.017) (-0.362)
admission in July 0.0033** -0.0003 0.0098*** 0.0004
(2.049) (-0.278) (3.898) (0.320)
admission in August 0.0053*** -0.0009 0.0090*** -0.0006
(3.401) (-0.900) (3.487) (-0.424)
admission in September 0.0040** -0.0013 0.0024 0.0010
(2.498) (-1.374) (1.133) (0.651)
admission in October 0.0008 -0.0016* 0.0058*** -0.0006
(0.490) (-1.741) (2.998) (-0.400)
admission in November 0.0015 -0.0021** 0.0025 0.0038**
(1.029) (-2.195) (1.058) (2.216)
admission in December 0.0015 -0.0012 0.0023 0.0001
(0.963) (-1.285) (0.846) (0.089)
Constant 0.0403*** 0.0142*** 0.0151*** -0.0176*** (15.048) (9.487) (2.640) (-4.751)
Observations 453151 484844 112098 113524 R^2 .0088 .0029 .0029 .017 Hosp.Sites 233 239 47 47 t statistics in parentheses
="* p<0.10 ** p<0.05 *** p<0.01"

Market structure, patient choice and hospital quality for elective patients 27
Appendix B. Procedure and speciality definitions
Hip replacement admissions are those with (i) a first OPCS procedure code: W371, W381, W391, W931, W941, W951, W378, W379, W388, W389, W398, W399, W938, W939, W948, W949, W958, W959, W373, W374, W383, W384, W393, W395, W933, W943, W953, W370, W372, W380, W382, W390, W392, W932, W930, W940, W942, W950, W952; (ii) W580, W581, W582 as the 1st procedure and Z843 in 2nd to 4th procedure fields; (iii) W580, W370, W380, W390 in 2nd to 4th procedures. Knee replacement admissions are those with (i) a first OPCS procedure code W401, W411, W421, W408, W408, W418, W419, W428, W429, W403, W404, W413, W414, W423, W425, W401, W411, W421, W400, W402, W410, W412, W420, W422; (ii) W580, W581, W582 as the 1st procedure and Z846 in 2nd to 4th procedure fields; (iii) W400, W410, W420 in 2nd to 4th procedure fields. CABG admissions are those with (i) a first OPCS procedure code K40, K41, K42, K43, K44, K45, K46 excluding patients simultaneously undergoing a heart valve replacement (any procedure being coded from K23 to K38) or a dominant angioplasty (PTCA) operation (in the first procedure coded as K751, K752, K753, K754, K758, K759, K49, K501, K504, K508, K509). Circulatory admissions are those with a main ICD10 diagnostic code starting with I (diseases of the circulatory system) or main procedure OPCS code starting with K or L (heart, arteries and veins procedures). Musculoskeletal admissions are those with main ICD10 diagnostic code starting with M (diseases of the musculoskeletal system) main procedure OPCS code starting with V or W (bones and joints procedures).