market timing digest march 2010 timing digest march 2010.pdf · market timing digest, worldwide...
TRANSCRIPT
Copyright © Schogt Market Timing, The Netherlands, 2010 1
Market Timing Digest, worldwide platform for financ ial astrology
3rd complete year, March 2010
Irma Schogt ©
Introduction Market Timing Digest turning data notes excellent, accurate figures From November 2008 – January 2010 90% of our turning data was accurate within 3 trading days. 82.5% indicated reversals of at least 4% within 2 trading days. Market Timing Digest turning data also showed the most significant tops and dips in the S&P. In this issue you can read which financial astrologers helped achieve this. The Market Timing Digest analyst’s team expands again! This month we introduce you again to a new participant, Elmer Hogervorst. Elmer, like the new participant that joined our team of financial astrologers last month, is also part of the analyst’s team with GannTrader.nl in The Netherlands, founded by Jan van Gemeren. With this expansion our analysts team now counts 12 participants; a nice amount who every month share with us their carefully considered prospects for the financial markets for the coming month. The Sun, the Moon, and Your Investments is an analysis report that is especially valuable for so-called swing traders, that is, traders who want to take advantage of short movements of an average of two weeks. Analyst Elmer Hogervorst, specializes in Robert Taylor’s investment technique, which is based on gravity. Gravity varies, and is determined by the powers of the sun and the moon. Just as gravity causes high and low tides, it also affects human emotions. It is well known that emotions (greed, fear, etc.) affect investor behavior, and therefore financial markets. Our analyst, Elmer, combines several techniques, through which he finds reliable turning points in the AEX, DAX, S&P500, China, Hang Seng, gold, silver, bonds, and euro/dollar. Summery of future prospects for the markets in March:
- Shares: Buy during declines in March – April to be long before the temperatures and markets rise
- Gold: Analysts choose the safe side and are considerably bullish for Gold. Declines are buying opportunities.
- Euro/Dollar : The Euro may recover a but in March (a short while?) to the upside before the Dollar takes over and rises again.
Copyright © Schogt Market Timing, The Netherlands, 2010 2
CONTENTS Looking back and to the future .................................................................................................. 3
Last month’s figures............................................................................................................... 3 Turning data ............................................................................................................................... 9
Turning data books excellent results...................................................................................... 9 Turning data indicates most significant market turnings ....................................................... 9
More about turning data ..................................................................................................... 9 Looking back at turning data from the past month .................................................................. 10
Turning data March 2010................................................................................................. 10 Model portfolio ................................................................................................................ 13
Astrology.................................................................................................................................. 15 GOLD – a window of opportunities......................................................................................... 18
Looking back and to the future ........................................................................................ 18 Looking back........................................................................................................................ 18
EURO/Dollar 25 Looking back and to the future......................................................................................... 25
Disclaimer Due to the time that is needed to publicise and send the information it is possible that the opinions of the analysts might have changed even before the date of publication. Every financial astrologer has his/her own view on the markets, compares different historical similarities with the upcoming astrological aspects. For a more complete version from the analysts I suggest consulting their individual websites, which are mentioned in Market Timing Digest.
Copyright © Schogt Market Timing, The Netherlands, 2010 3
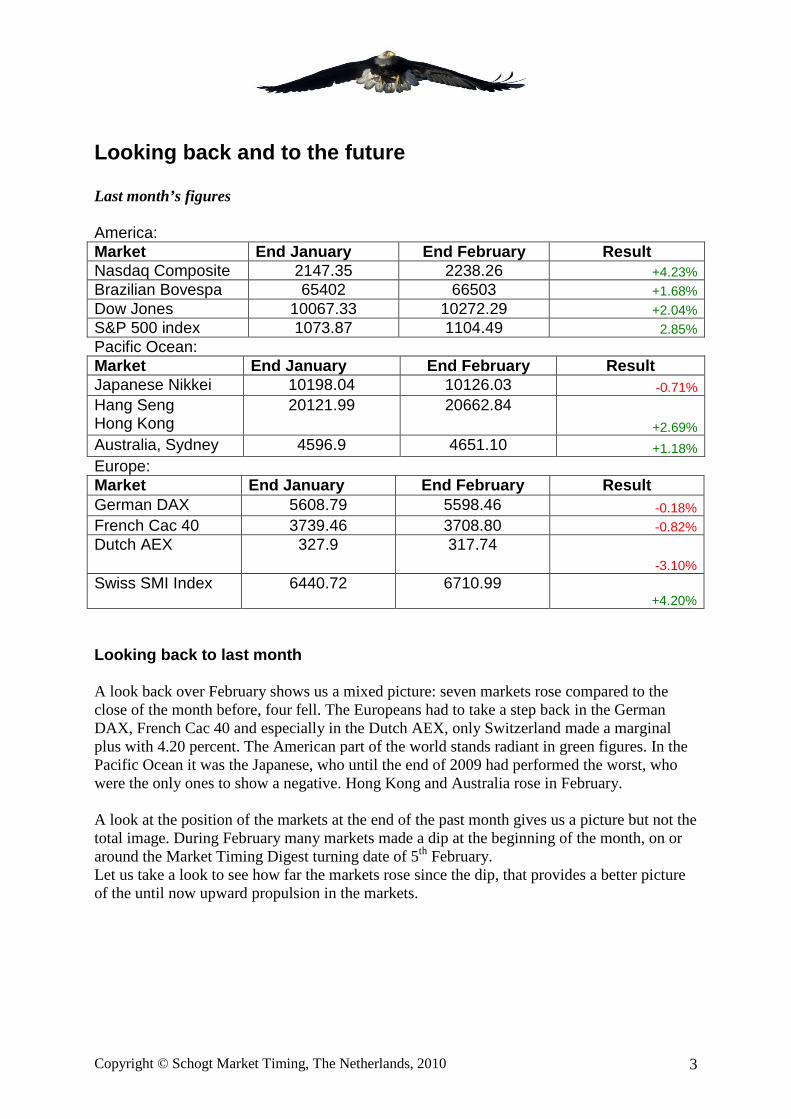
Looking back and to the future Last month’s figures America: Market End January End February Result Nasdaq Composite 2147.35 2238.26 +4.23% Brazilian Bovespa 65402 66503 +1.68% Dow Jones 10067.33 10272.29 +2.04% S&P 500 index 1073.87 1104.49 2.85% Pacific Ocean: Market End January End February Result Japanese Nikkei 10198.04 10126.03 -0.71% Hang Seng Hong Kong
20121.99 20662.84 +2.69%
Australia, Sydney 4596.9 4651.10 +1.18% Europe: Market End January End February Result German DAX 5608.79 5598.46 -0.18% French Cac 40 3739.46 3708.80 -0.82% Dutch AEX 327.9 317.74
-3.10% Swiss SMI Index 6440.72 6710.99
+4.20% Looking back to last month A look back over February shows us a mixed picture: seven markets rose compared to the close of the month before, four fell. The Europeans had to take a step back in the German DAX, French Cac 40 and especially in the Dutch AEX, only Switzerland made a marginal plus with 4.20 percent. The American part of the world stands radiant in green figures. In the Pacific Ocean it was the Japanese, who until the end of 2009 had performed the worst, who were the only ones to show a negative. Hong Kong and Australia rose in February. A look at the position of the markets at the end of the past month gives us a picture but not the total image. During February many markets made a dip at the beginning of the month, on or around the Market Timing Digest turning date of 5th February. Let us take a look to see how far the markets rose since the dip, that provides a better picture of the until now upward propulsion in the markets.
Copyright © Schogt Market Timing, The Netherlands, 2010 4
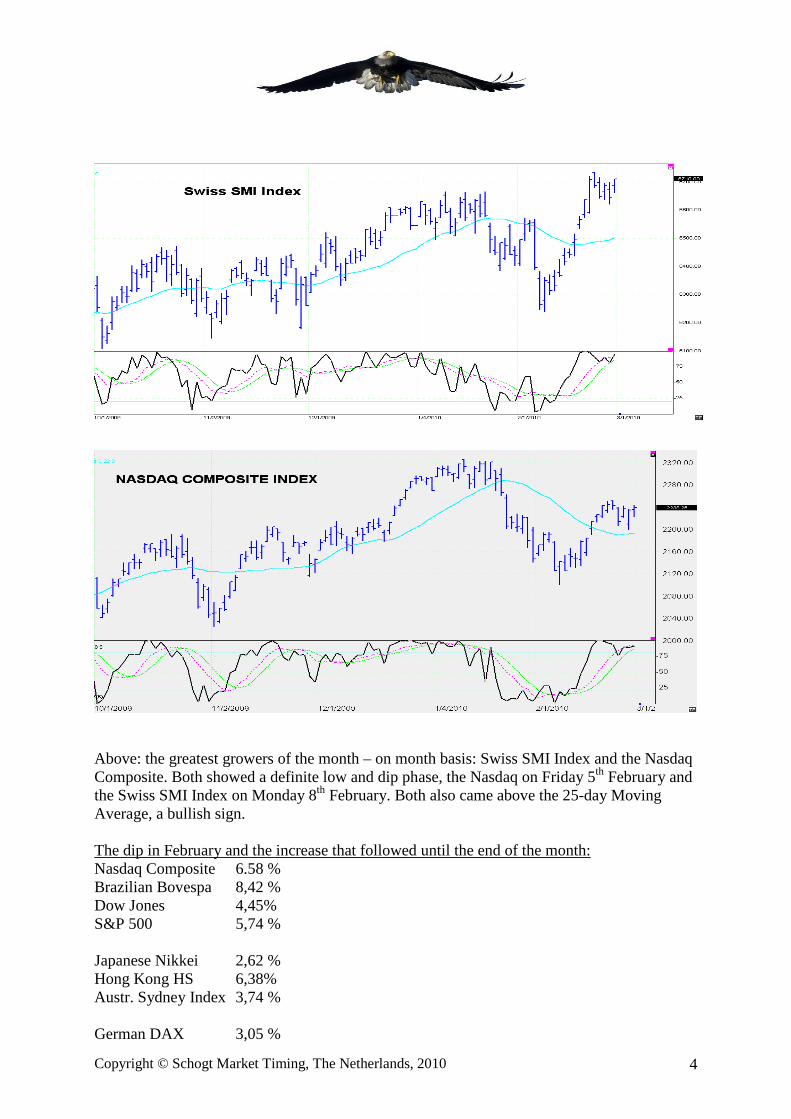
Above: the greatest growers of the month – on month basis: Swiss SMI Index and the Nasdaq Composite. Both showed a definite low and dip phase, the Nasdaq on Friday 5th February and the Swiss SMI Index on Monday 8th February. Both also came above the 25-day Moving Average, a bullish sign. The dip in February and the increase that followed until the end of the month: Nasdaq Composite 6.58 % Brazilian Bovespa 8,42 % Dow Jones 4,45% S&P 500 5,74 % Japanese Nikkei 2,62 % Hong Kong HS 6,38% Austr. Sydney Index 3,74 % German DAX 3,05 %
Copyright © Schogt Market Timing, The Netherlands, 2010 5
French CAC 40 4,59 % Dutch AEX 2,11 % Swiss SMI 7,54 % The Brazilian Bovespa that month after month only showed a 1.68% profit came “out of the dip” as the winner. Brazil was also the index that came out of the dip in March 2009 with the greatest profit, in declining recovery as well as in hard figures. The Nasdaq is a good second in the American area. Hong Kong is the most powerful market that we follow in the Pacific Ocean and the Swiss SMI is the most powerful in Europe. It is possible that due to the crisis situation that Switzerland, that has historically been an escape haven, is again becoming interesting compared to the other European countries. The Dutch AEX comes out as the weakest European link. The AEX is the smallest market in our row. In 2009 The Netherlands stood at the 7th place in the list of the world’s richest countries, but the country is strongly dependable on export and profits from banks, where now the backlash is strongest. The index has also, following Japan in 2009, shown the smallest recovery from the preceding decline and still has to recover a lot to come back on track with the other indices.
“New soap bubble seems to have been born” From: Brains & Analysis by Jan van Gemeren, www.ganntrader.nl
“It has recently been revealed that large financial organisations have held governments (such as Greece) in strangulation with their speculative games (derivatives) and thus they had to keep calm in these areas (have you noticed that there has not been any official research done in to these illegal practices?), and now the speculative playing field of the large financial parties are shifting again to the shares and raw material markets. Until the end of 2011 the FED will finance with free money the ‘gambles’ from the financial organisations and that should have a lifting effect on the financial markets for a long time. One of the lessons from the low interest politics at the beginning of this decennium was the real estate soap bubble. A new soap bubble seems to have been born. The FED seems to be, just as the last time, choosing for short-term success with free money politics. Over a few years the taxpayer will again receive the bill as the new soap bubble bursts. But in the meantime the markets can remain afloat with thanks to the rescue from the FED.” Jan van Gemeren.
*) http://www.ganntrader.org/cms/affiliate-redirect.php?affiliate_user_id=575&product_id=1
Copyright © Schogt Market Timing, The Netherlands, 2010 6
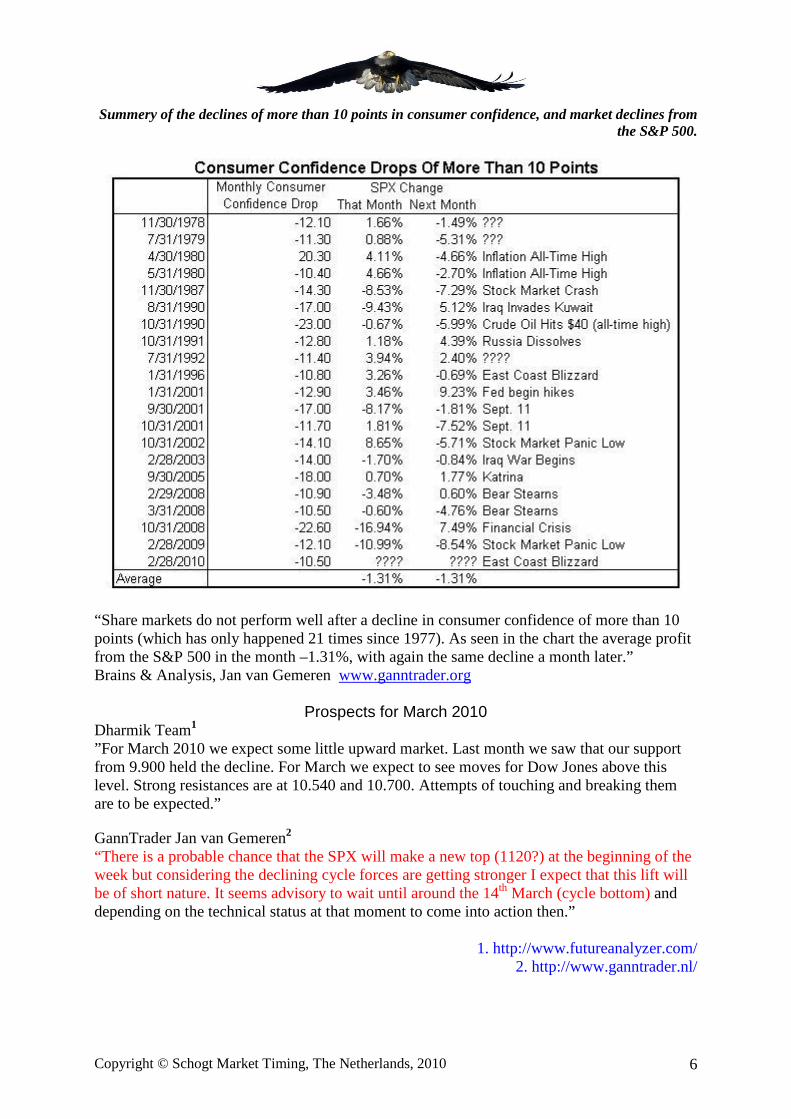
Summery of the declines of more than 10 points in consumer confidence, and market declines from the S&P 500.
“Share markets do not perform well after a decline in consumer confidence of more than 10 points (which has only happened 21 times since 1977). As seen in the chart the average profit from the S&P 500 in the month –1.31%, with again the same decline a month later.” Brains & Analysis, Jan van Gemeren www.ganntrader.org
Prospects for March 2010 Dharmik Team1
”For March 2010 we expect some little upward market. Last month we saw that our support from 9.900 held the decline. For March we expect to see moves for Dow Jones above this level. Strong resistances are at 10.540 and 10.700. Attempts of touching and breaking them are to be expected.” GannTrader Jan van Gemeren2 “There is a probable chance that the SPX will make a new top (1120?) at the beginning of the week but considering the declining cycle forces are getting stronger I expect that this lift will be of short nature. It seems advisory to wait until around the 14th March (cycle bottom) and depending on the technical status at that moment to come into action then.”
1. http://www.futureanalyzer.com/ 2. http://www.ganntrader.nl/
Copyright © Schogt Market Timing, The Netherlands, 2010 7
Robert Hitt3
“I look for the retrace rally to run out of "positives" to keep going this week.. When mercury and jupiter conjunct I expect this to create a situation where an obvious danger has been ignored and a downdraft could come in the march 7th to 11th timeframe.. This appears to be only a correction of the move down to the spx 150 area so it would be a fibbo of that rally with 1075 an interesting spot to look for a low around the 11th with a buy out mentality on the low. later in march Uranus comes into play and should bring an unsettled atmosphere and another leg down cannot be ruled out later in march... around the 21st looks interesting for a low of some kind. . the astro in april is the start of many months of systemic problems and I would expect that TAX REVENUE will become an issue both before and after April 15th. This problem does NOT appear to be priced in yet as of now.. I expect that before tax time some sort of rules changes to boost stocks are in play to help boost tax revenues..” Elmer Hogervorst 4
“Analysis for the rest of the month say declines are most likely. Declining from Tue. March 9 – Fri. March 12, declining from Mon. March 15 – Fri. March 19, declining from Mon. March 22- Thurs. March 25, and again from Mon./Tues. March 29-30.” Victor Ledeboer 5 “From 7th until and including 19th-22nd March bearish. The following phase should be extremely bearish. I have doubts if the fall will be really that big. Hold onto the market goal of 281.” Raymond Merriman 6
“What we need to watch is whether a decline will result that will test or even take out the lows of February 5. If the lows hold, then the stock market will be in great shape to surge to new yearly highs, and maybe even now all-time highs, over the next 6 months, for Jupiter and Uranus will start to move into orb of their conjunction in Aries in late May and early June. This can coincide with a bubble, or blow off, in which may financial markets could double in price, including stocks.” Gaby Mittelman 7
“.. for the time being, I expect the Dow to go above 10800, even higher. The bull is back.”
3. http://www.astroecon.com/8thhousesun/index8thhousesun.htm 4. http://www.ganntrader.org/intl_cms/affiliate-redirect.php?affiliate_user_id=72&product_id
5. http://www.decyclusanalist.nl 6. http://www.markettiming.nl/nl_products/se_weekly.php
7. http://www.astroworld.co.il/default.asp?iID=LLDFG
Copyright © Schogt Market Timing, The Netherlands, 2010 8
Grace Morris 8
Grace doesn’t really mention March in her considerations, but does state that 2010 is on the one hand one of the worst years for shares in the president cycle but that Jupiter and Uranus (conjunct from 6th June) want to pull the whole lot up and that new funds that are established will become enormously interesting due to their growth potential. And: “… it is likely if the market declines more than 10%, then more fiscal stimulus and more money will be printed to support equity prices. Be prepared for by keeping your watch list of stocks up-to-date as 2010 may be another big opportunity.” Ted Phillips9: "The stock indices completed a bottom of a minor correction on the February 5th Jupiter sextile Pluto aspect. I am neutral this month unless the January highs on the S & P at 1150 can be taken out. If price cannot break down below 1044, the S & P will remain in a trading range.” Markus Rose 10 “I am currently still a bear for both Gold and Stocks, but intend to shift to LONG on March 3 or 4 in both markets. March 12 is going to be a high for stock indices, Oil and Gold. March 22 a low for the Euro and stocks....Overall I currently that stocks are in an up-trend and will continue to rise after March 22.” Barry Rosen 11
“…There is another false optimism cycle peaking into Feb. 28 but it should be felt through March 15. In that cycle there is a tendency to ignore hard facts and push markets up any way. Usually the peak in markets occurs 1-2 days after the exact energy point, which is around March 1-, and we think this will be an important high for gold, crude and stocks. ---- There are many scenarios out there but between now and April we think we are still undergoing a correction from the 1150 cash region. (…) There is still a big 5-wave down needed that will probably take out 1000 into April 7-12.If the S&P takes out 1077 firs then we will only see a secondary high into March 8.” Tjerk Spriensma 12 “In the longer term, the trend is up ward from the LTD6 to the LTD7 around the end of June. Only if we get below the light green line will the MLTD14-15/LTD5-6 still be moved. This might yet happen in April.”
8. . http://www.astroeconomics.com/ 9. http://www.astroadvisor.com/
10. http://www.rosecast.com 11..http://www.fortucast.com
12. http://www.ganntrader.org/intl_cms/affiliateredirect. php?affiliate_user_id=72&product_id=2
Conclusion
It is a mixed image this month. Depending on their personal preception, one is more inclining towards the chances of declines in March, the other is more neutral and the rest would rather look for possible buying opportunities. The underlying long-term tone with the majority is positive. To summarize it all I would like to say to investors: pay special attention in March (may be even April) for possible buying opportunities. The market is ripe for at least a minor correction that could be bought. If the decline is less mild, than it offers more opportunity to
Copyright © Schogt Market Timing, The Netherlands, 2010 9
buy even cheaper. Spring and summer 2010 promises to be very good for the markets, it’s coming.
Turning data Turning data books excellent results From November 2008 until and incl. January 2010 Market Timing Digest has publicized 40 turning dates before hand, based on the information provided by participating f nancial astrologers. 36 of the by us filtered turning dates coincided with a market turning with a top or a dip of at least 4%, or rather 90% were accurate within 3 trading days. 82.5% of all turning data coincided with a top of dip within 2 trading days. Nine dates indicated the exact day, thirteen within one day, ten within 2 days and four within 3 days. Turning data indicates most significant market turnings The most noticeable turning dates in the year were: 6th January 2009 the last top before the nearly 30 percent fall to: 6th March 2009. After that, in the rising market until January 2010, the declines in July and November were also notable. The highest rate was made in January 2010 and this was only one day removed from a Market Timing Digest turning date. This date came about with the information from Barry Rosen, Gaby Mittelman, Ted Phillips, Victor Ledeboer and Ray Merriman. The lowest of the year was 6th March in the S&P, also one day away from a turning date. Had we taken the European markets as the norm then this day would have been exact. This date was made with the help from Ted Phillips, Victor Ledeboer, and Ray Merriman. During March 2009 when the financial media was extremely negative about the markets we mentioned the following: “The majority of the analysts agree that March offers space and possibilities for a recovery. One was looking for signs of a bottom from the beginning of the month.” On the 6th of January 2009 a last top was made: we had indicated a turning date on the 5th January, based on information from Gaby Mittelman and Ted Phillips. July 2009 offered a chance to step in on the 8th July, two trading days after our turning date of 6th July, with thanks to Victor Ledeboer, Ray Merriman and Jan van Gemeren’s prognosis. November 2009 formed together with March and July an important underlying support line. The dip in November was one of our turning dates, with thanks to Gaby Mittelman, Ted Phillips and Raymond Merriman’s turning data. Our thanks and praise goes out to our analysts without whom this would not have been possible and have been important in providing the above mentioned significant data: Barry Rosen, Jan van Gemeren, Victor Ledeboer, Gaby Mittelman, Raymond Merriman and Ted Phillips who with their delivered data were the closest to the most notable and most important turning dates from the past years. We continue to work on, also in 2010, holding this high level of accuracy or even to improve it.
More about turning data We choose at Market Timing Digest to continually use the S&P as a norm for the success or not of our turning data as the American markets are the most trustworthy for setting the norm. Our new Market Timing Digest analyst Elmer Hogervorst writes about it, see below.
Copyright © Schogt Market Timing, The Netherlands, 2010 10
Elmer Hogervorst indicates in his ‘Sun, Moon & Investments’ that it is good to look at the American markets for the best grip on the relationship between cycles (Elmer uses tides) and the markets. It is no wonder that where the most money flows, these markets set the tone. Cycle analysis works best with large markets and less so with smaller ones such as the AEX index. “For the big picture best look at what the Dow Jones or the S&P500 is doing. Click for instance at http://finance.yahoo.com/q/ta?s=^DJI&t=5d&l=on&z=l&q=l&p=&a=&c= for the five-day graph of the Dow Jones. … The European markets deviate at times from the American indices in a lateral market. That was clear in the past few weeks.”
Looking back at turning data from the past month The turning dates for February were: 4th February*, 15th February* and 1st March*. The first date fell together with the low from 5th February in the S&P. 15th February was a speed up of the up trend but no reversal. As yet we cannot say much about the 1st March.
Turning data March 2010 The following dates come forward as having the greatest chance of, within 2 to 3 trading days, coming together with the onset of a correction on the shares market. The more stars, the more powerful the effect in the ruling trend in the days and weeks before.
1st March * 11th March ** 22nd March * 5th April **
Turning data is filtered from the information about possible trend reversals provided by financial astrologers. They often form the heart of periods full of astrological aspects that coincide with changes in the markets and ruling sentiment amongst investors.
Copyright © Schogt Market Timing, The Netherlands, 2010 11
Prospects per index
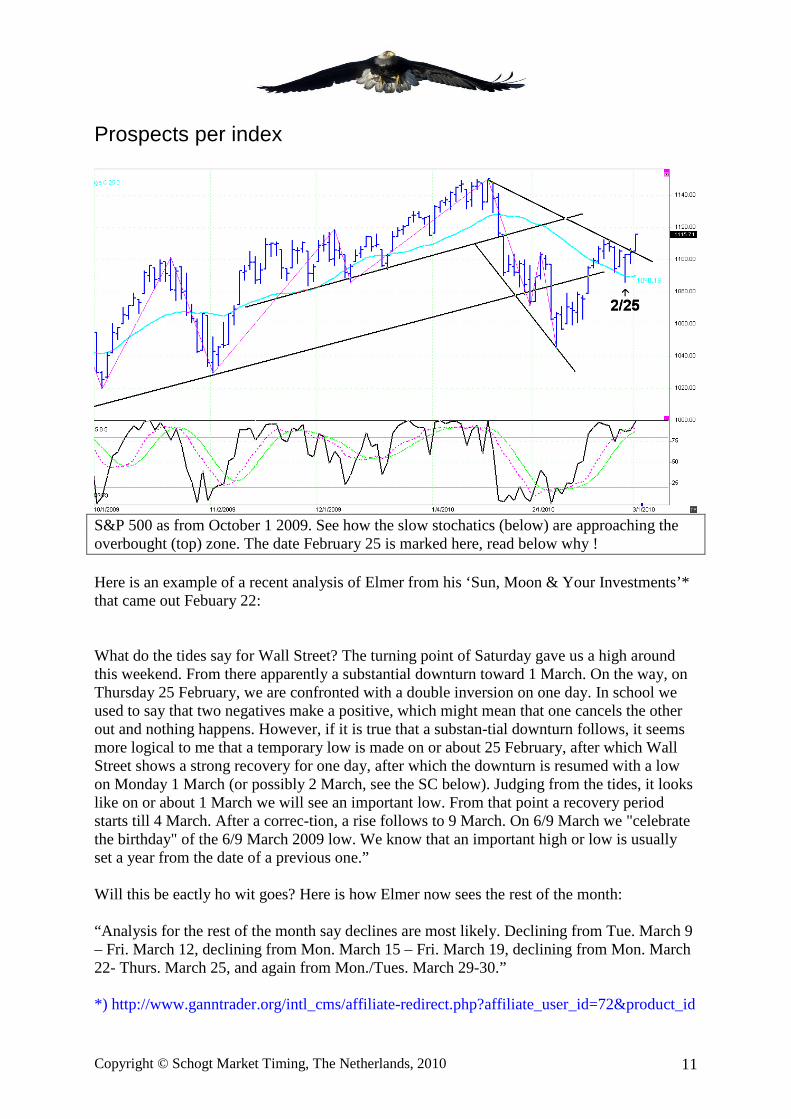
S&P 500 as from October 1 2009. See how the slow stochatics (below) are approaching the overbought (top) zone. The date February 25 is marked here, read below why ! Here is an example of a recent analysis of Elmer from his ‘Sun, Moon & Your Investments’* that came out Febuary 22: What do the tides say for Wall Street? The turning point of Saturday gave us a high around this weekend. From there apparently a substantial downturn toward 1 March. On the way, on Thursday 25 February, we are confronted with a double inversion on one day. In school we used to say that two negatives make a positive, which might mean that one cancels the other out and nothing happens. However, if it is true that a substan-tial downturn follows, it seems more logical to me that a temporary low is made on or about 25 February, after which Wall Street shows a strong recovery for one day, after which the downturn is resumed with a low on Monday 1 March (or possibly 2 March, see the SC below). Judging from the tides, it looks like on or about 1 March we will see an important low. From that point a recovery period starts till 4 March. After a correc-tion, a rise follows to 9 March. On 6/9 March we "celebrate the birthday" of the 6/9 March 2009 low. We know that an important high or low is usually set a year from the date of a previous one.” Will this be eactly ho wit goes? Here is how Elmer now sees the rest of the month: “Analysis for the rest of the month say declines are most likely. Declining from Tue. March 9 – Fri. March 12, declining from Mon. March 15 – Fri. March 19, declining from Mon. March 22- Thurs. March 25, and again from Mon./Tues. March 29-30.” *) http://www.ganntrader.org/intl_cms/affiliate-redirect.php?affiliate_user_id=72&product_id
Copyright © Schogt Market Timing, The Netherlands, 2010 12
Dow Jones Index
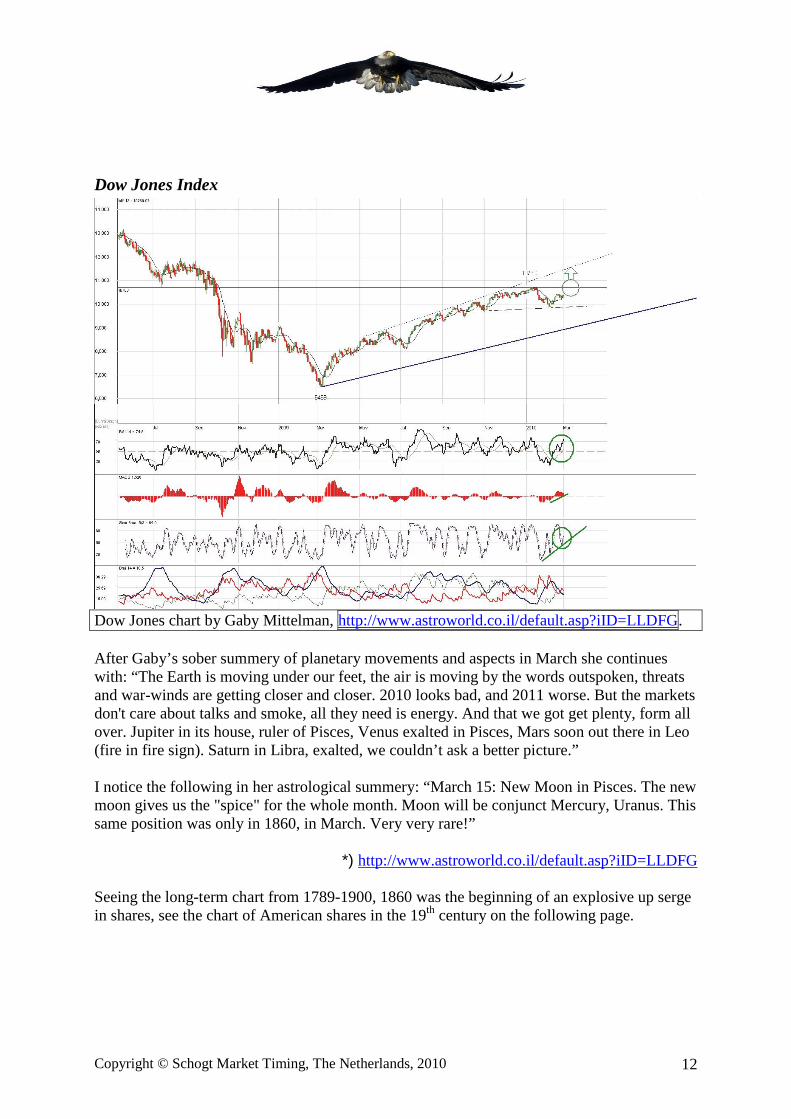
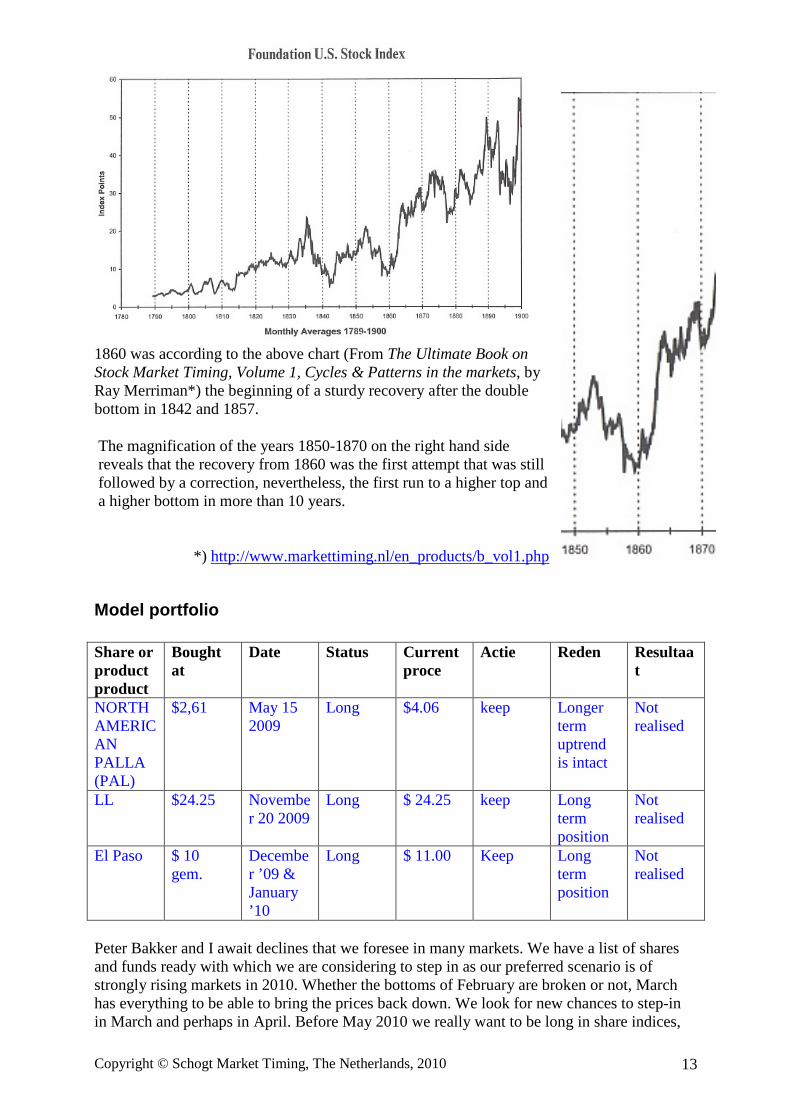
Dow Jones chart by Gaby Mittelman, http://www.astroworld.co.il/default.asp?iID=LLDFG. After Gaby’s sober summery of planetary movements and aspects in March she continues with: “The Earth is moving under our feet, the air is moving by the words outspoken, threats and war-winds are getting closer and closer. 2010 looks bad, and 2011 worse. But the markets don't care about talks and smoke, all they need is energy. And that we got get plenty, form all over. Jupiter in its house, ruler of Pisces, Venus exalted in Pisces, Mars soon out there in Leo (fire in fire sign). Saturn in Libra, exalted, we couldn’t ask a better picture.” I notice the following in her astrological summery: “March 15: New Moon in Pisces. The new moon gives us the "spice" for the whole month. Moon will be conjunct Mercury, Uranus. This same position was only in 1860, in March. Very very rare!”
*) http://www.astroworld.co.il/default.asp?iID=LLDFG Seeing the long-term chart from 1789-1900, 1860 was the beginning of an explosive up serge in shares, see the chart of American shares in the 19th century on the following page.
Copyright © Schogt Market Timing, The Netherlands, 2010 13
1860 was according to the above chart (From The Ultimate Book on Stock Market Timing, Volume 1, Cycles & Patterns in the markets, by Ray Merriman*) the beginning of a sturdy recovery after the double bottom in 1842 and 1857.
The magnification of the years 1850-1870 on the right hand side reveals that the recovery from 1860 was the first attempt that was still followed by a correction, nevertheless, the first run to a higher top and a higher bottom in more than 10 years.
*) http://www.markettiming.nl/en_products/b_vol1.php
Model portfolio Share or product product
Bought at
Date Status Current proce
Actie Reden Resultaat
NORTH AMERICAN PALLA (PAL)
$2,61
May 15 2009
Long $4.06 keep Longer term uptrend is intact
Not realised
LL $24.25 November 20 2009
Long $ 24.25 keep Long term position
Not realised
El Paso $ 10 gem.
December ’09 & January ’10
Long $ 11.00 Keep Long term position
Not realised
Peter Bakker and I await declines that we foresee in many markets. We have a list of shares and funds ready with which we are considering to step in as our preferred scenario is of strongly rising markets in 2010. Whether the bottoms of February are broken or not, March has everything to be able to bring the prices back down. We look for new chances to step-in in March and perhaps in April. Before May 2010 we really want to be long in share indices,
Copyright © Schogt Market Timing, The Netherlands, 2010 14
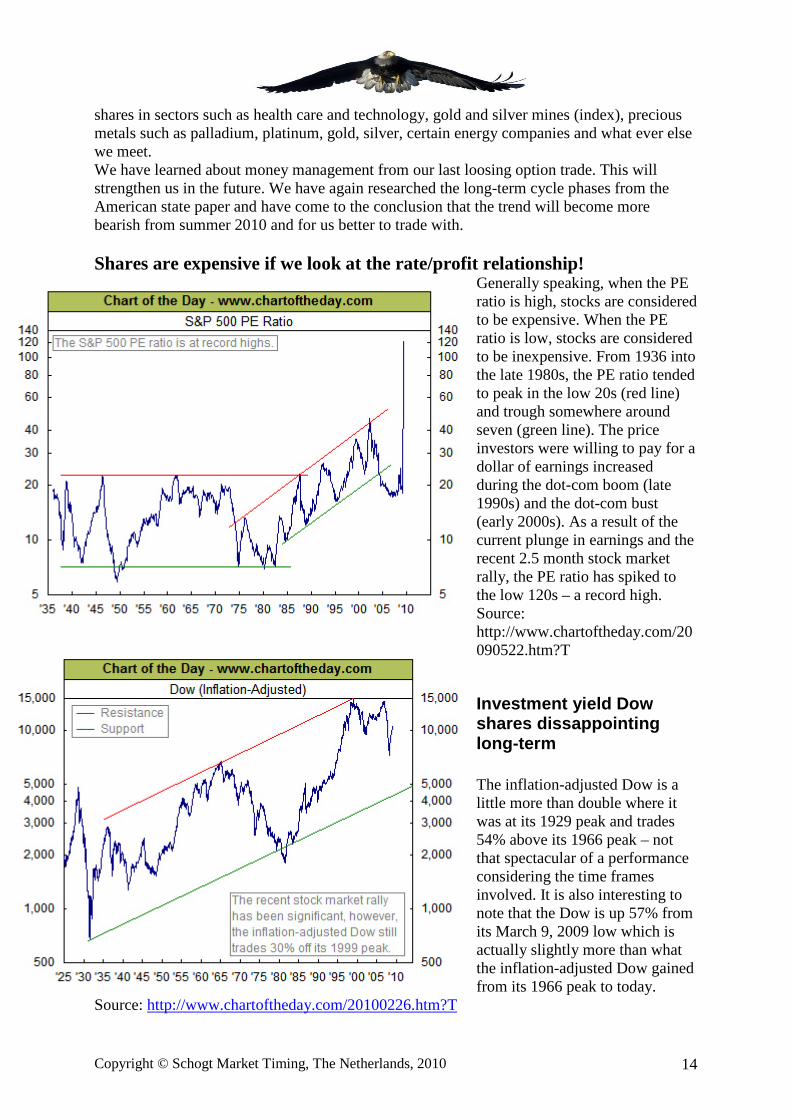
shares in sectors such as health care and technology, gold and silver mines (index), precious metals such as palladium, platinum, gold, silver, certain energy companies and what ever else we meet. We have learned about money management from our last loosing option trade. This will strengthen us in the future. We have again researched the long-term cycle phases from the American state paper and have come to the conclusion that the trend will become more bearish from summer 2010 and for us better to trade with. Shares are expensive if we look at the rate/profit relationship!
Generally speaking, when the PE ratio is high, stocks are considered to be expensive. When the PE ratio is low, stocks are considered to be inexpensive. From 1936 into the late 1980s, the PE ratio tended to peak in the low 20s (red line) and trough somewhere around seven (green line). The price investors were willing to pay for a dollar of earnings increased during the dot-com boom (late 1990s) and the dot-com bust (early 2000s). As a result of the current plunge in earnings and the recent 2.5 month stock market rally, the PE ratio has spiked to the low 120s – a record high. Source: http://www.chartoftheday.com/20090522.htm?T
Investment yield Dow shares dissappointing long-term The inflation-adjusted Dow is a little more than double where it was at its 1929 peak and trades 54% above its 1966 peak – not that spectacular of a performance considering the time frames involved. It is also interesting to note that the Dow is up 57% from its March 9, 2009 low which is actually slightly more than what the inflation-adjusted Dow gained from its 1966 peak to today.
Source: http://www.chartoftheday.com/20100226.htm?T
Copyright © Schogt Market Timing, The Netherlands, 2010 15
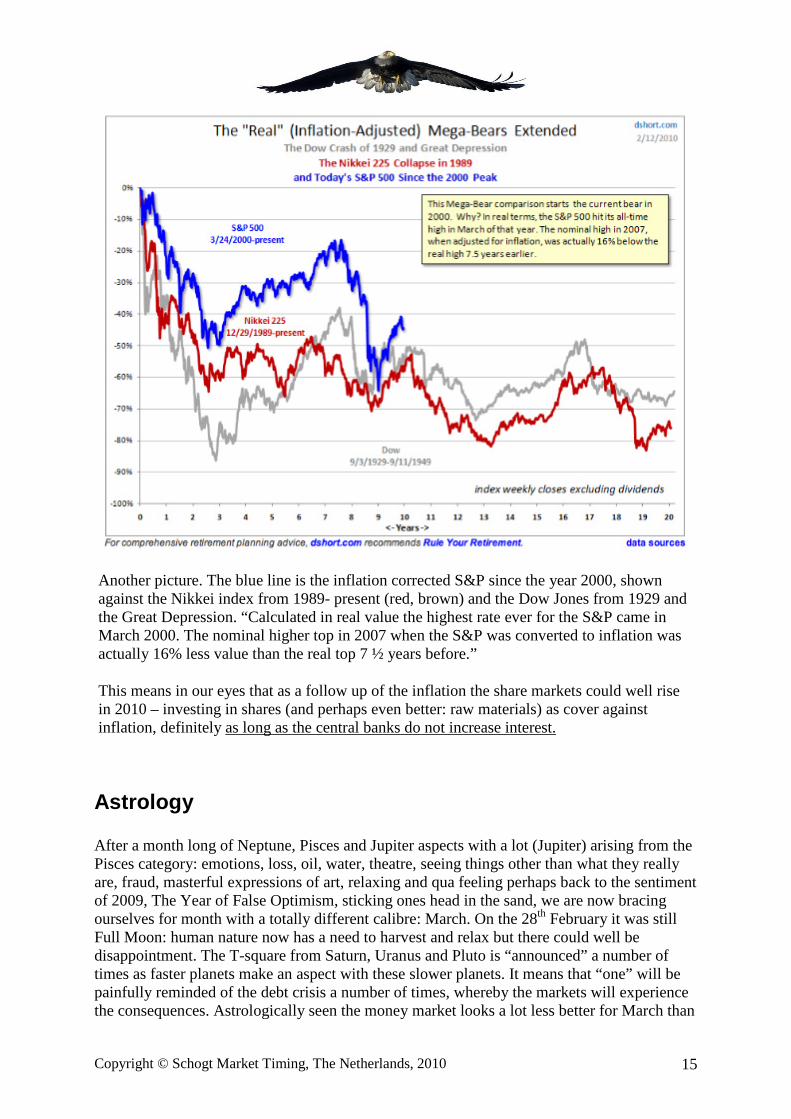
Another picture. The blue line is the inflation corrected S&P since the year 2000, shown against the Nikkei index from 1989- present (red, brown) and the Dow Jones from 1929 and the Great Depression. “Calculated in real value the highest rate ever for the S&P came in March 2000. The nominal higher top in 2007 when the S&P was converted to inflation was actually 16% less value than the real top 7 ½ years before.”
This means in our eyes that as a follow up of the inflation the share markets could well rise in 2010 – investing in shares (and perhaps even better: raw materials) as cover against inflation, definitely as long as the central banks do not increase interest.
Astrology After a month long of Neptune, Pisces and Jupiter aspects with a lot (Jupiter) arising from the Pisces category: emotions, loss, oil, water, theatre, seeing things other than what they really are, fraud, masterful expressions of art, relaxing and qua feeling perhaps back to the sentiment of 2009, The Year of False Optimism, sticking ones head in the sand, we are now bracing ourselves for month with a totally different calibre: March. On the 28th February it was still Full Moon: human nature now has a need to harvest and relax but there could well be disappointment. The T-square from Saturn, Uranus and Pluto is “announced” a number of times as faster planets make an aspect with these slower planets. It means that “one” will be painfully reminded of the debt crisis a number of times, whereby the markets will experience the consequences. Astrologically seen the money market looks a lot less better for March than
Copyright © Schogt Market Timing, The Netherlands, 2010 16
it did in February. April promises, with planets that make far less heavy aspects in Taurus, to be a much quieter month than March. Monday 1st March Mercury to Pisces Mercury the god of trade now chooses wider (Pisces) waters: one could think that it is the relation between Venus in Pisces that has strengthened volatility but that is not the case: the opposite is true. The trade and the thinking (Mercury) now run via feelings (Pisces). Tighten your seatbelt for the next powerful market aspect that is on its way in March. Thursday 4th March Venus conjunct Uranus The T-square of Saturn, Uranus and Pluto are touched upon. Watch out for water and electricity (no wet fingers in the electrical socket)! It is nearly one year since 6th March 2009 when the majority of the world’s indices reached their lowest point. Something could happen that could surprise everyone and set the markets on another leg. In combination with the aspects on the 9th and 10th March we again, in March 2010, come in contact with an especially powerful turning zone, which has the potential to end a trend or start a new one. Saturday 6th, Sunday 7th until and including 8th March 18.13 European time (12.13 hours Eastern time) Moon in Sagittarius. More exuberance on the markets and in the people than normal. Also Monday 8th March: Mercury conjunct Jupiter; thinking, talking and trading in a mix with hopefulness, wanting to grow and emphasizing Jupiter, can improve sentiment or wake it up. 7th March Venus goes out of Pisces (end of cycle) to Aries – a new beginning. For option traders and VIX traders, take note! The signature planet combination that during 2006-2009 in the Dow Jones (and in the AEX since 1984!) created at least 4% turnings is now again signing in until the 31st of March. 9th March Venus opposite Saturn The T-square from Saturn, Uranus and Pluto is touched upon. Everything of value (financial markets) now meets the teacher of pain (Saturn, governments, banks, old age, ‘limitation reveals the master’). As a cloudy day, everything is grey and there is a need to work hard for the future. A very powerful market aspect. . Wednesday 10th March Mars runs direct again A very powerful market aspect. Watch for more frequently occurring significant market turnings within 2 weeks of this date. In the time that Mars (action, progression, urge, war) went backwards an important player in the car industry also fell back. Toyota is now no longer the most trustworthy make of car in the world. When Mars runs direct again a new cycle will be created for the car industry, whereby another make of car will set the tone on another principle. Thursday 11th March Venus square Pluto The T-square from Saturn, Uranus and Pluto is touched upon. Aspects from Venus to Pluto often fall together with changes in the interest and currency market. Powerful aspect, it concerns the now not so important debt aspect (Pluto) in a struggle relationship (square) with money matters (Venus). Wednesday 17th March Mercury to Aries Communication and trading planet Mercury start a new zodiac cycle in Aries: thinking and talking from the intuitive come across with more fire and with a lot less patience. Fireworks on the market? FAR software indicates that from 2006 until
Copyright © Schogt Market Timing, The Netherlands, 2010 17
present the AEX Index, during Mercury in Aries, has experienced quieter times and was more likely to advance trends than to change direction, than which ever other Mercury position. Wednesday 17th March Sun conjunct Uranus Explosive aspect. The T-square from Saturn, Uranus and Pluto is touched upon. The general attention (Sun) goes together with, or stands bare with the urge to break up, explosions and impulses for change: Uranus. 20th March Sun at the spring point: 0 degrees Aries on the zodiac. 21st March Sun trine Mars This is the most favourable and friendliest aspect of the month. Fire planet Sun in fire sign Aries creates a harmonious and favourable trine with fire planet Mars in fire sign Leo. This can strengthen ruling tendencies. 22nd March Sun opposite Saturn Pain aspect. The T-square of Saturn, Uranus and Pluto is touched upon. The general attention versus banks and the issuing of rules, there is enough to do there, that is known but around the beginning of the spring that could be the talk of the day. 26th March Sun square Pluto Debt aspect. Square: accusations, struggle. The T-square of Saturn, Uranus and Pluto is touched upon, the question of debt plays a role again. 31st March Venus to Taurus Money and pleasure planet Venus is in the quiet and friendly sign of Taurus. “Easy does it.” After the 31st March Venus goes back three gears in Taurus with regards to movement (based on AEX research with FAR software. Information about FAR can be found at http://www.markettiming.nl/nl_products/so_far.php). 2nd April Mercury to Taurus Trade, communication and thinking are now quieter and more inwardly turned. One now looks more for security, values and such like in the markets. 3rd April Venus decreasing square Mars Money versus action 6th April Pluto turns retrograde Normally a less heavy effect on the markets but now it is about the indicator of Debt that until today had laid a heavy stamp on sentiment. Today there hangs a very tense, everything or nothing feeling, not a relaxing day. 7th April Saturn in Virgo opposite Uranus in Pisces The T-square is getting heftier: Saturn and Uranus both stand right opposite each other today. Both are square to debt planet Pluto. This is the forth aspect in a series of five, 26th July 2010 is the last. The T-square wrenches through until 2015 when Uranus and Pluto make the last square. The structurally reforming series began with Pluto’s entry in Capricorn on 26th January 2008, the first year that the crisis really began and that the world became aware of it. 17th April Mercury retrograde Again a time that is better for the old and not so for new matters concerning communication, trade and appointments. Everything that you now think and that was not thought of before do not act upon but let it rest until after 11th May (Mercury then runs direct again) because chances are absurdly great that you will think completely different and have other information at your disposal which will in turn require a completely different approach or inset.
Copyright © Schogt Market Timing, The Netherlands, 2010 18
GOLD – a window of opportunities
Looking back and to the future Looking back
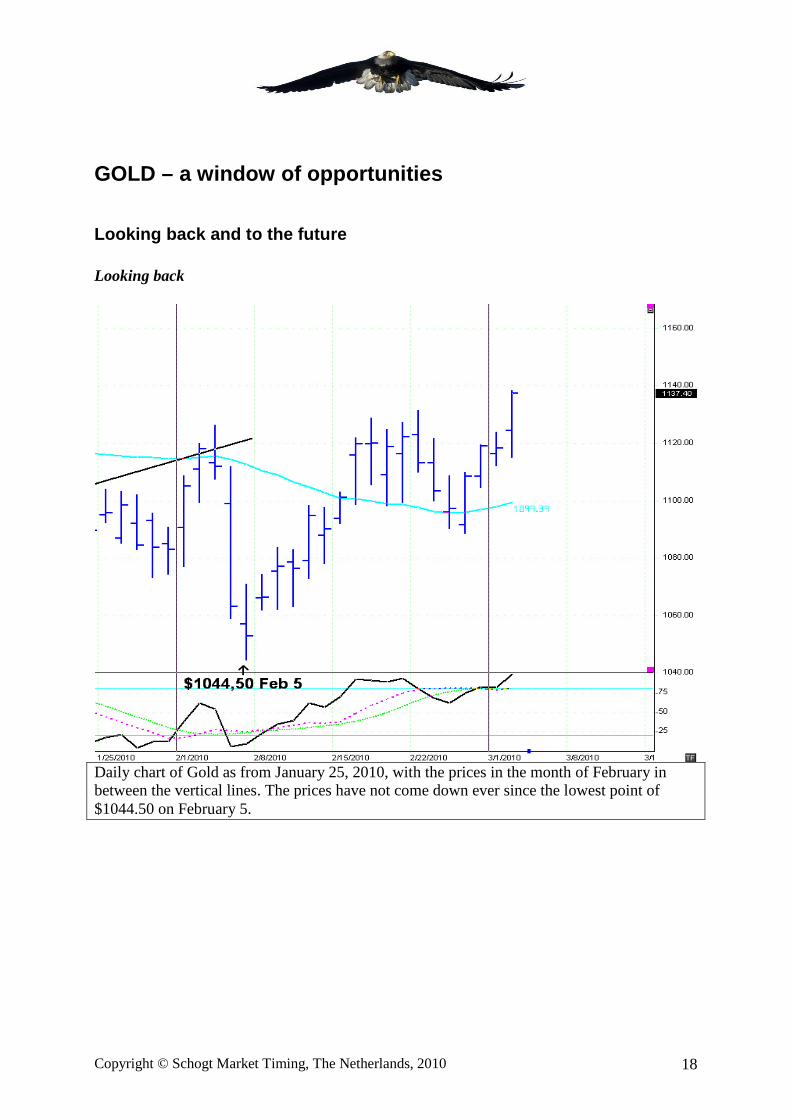
Daily chart of Gold as from January 25, 2010, with the prices in the month of February in between the vertical lines. The prices have not come down ever since the lowest point of $1044.50 on February 5.
Copyright © Schogt Market Timing, The Netherlands, 2010 19
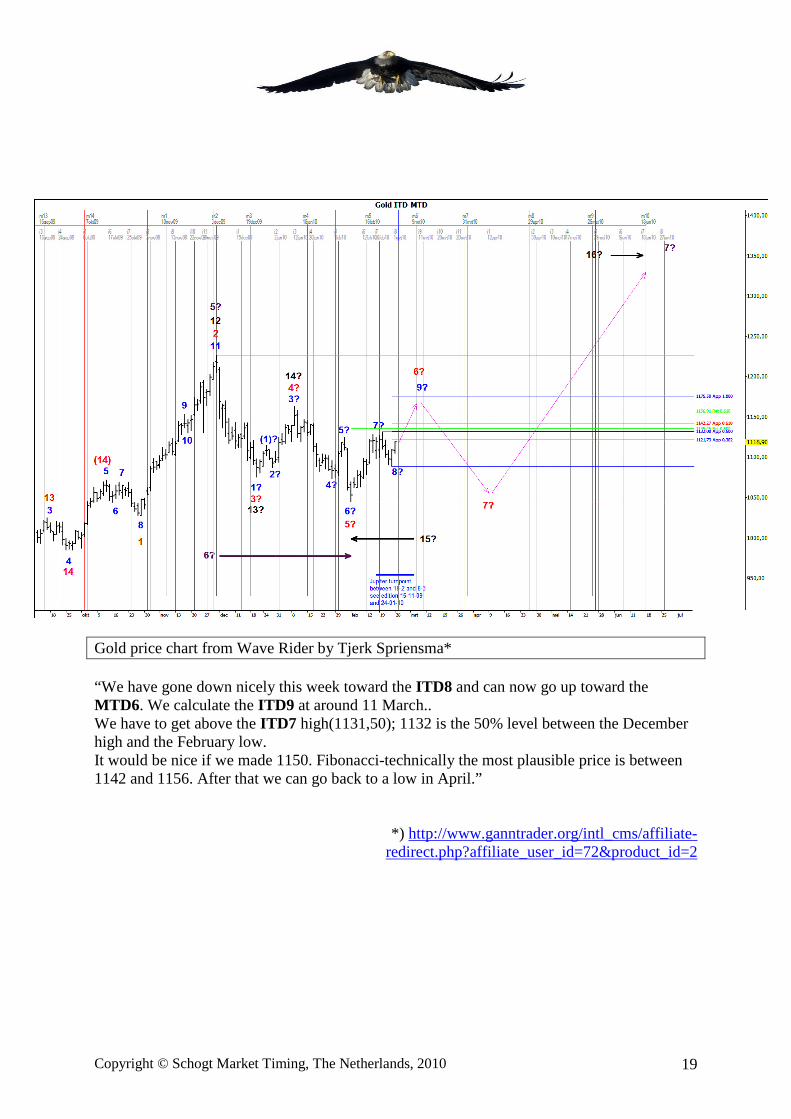
Gold price chart from Wave Rider by Tjerk Spriensma* “We have gone down nicely this week toward the ITD8 and can now go up toward the MTD6 . We calculate the ITD9 at around 11 March.. We have to get above the ITD7 high(1131,50); 1132 is the 50% level between the December high and the February low. It would be nice if we made 1150. Fibonacci-technically the most plausible price is between 1142 and 1156. After that we can go back to a low in April.”
*) http://www.ganntrader.org/intl_cms/affiliate-redirect.php?affiliate_user_id=72&product_id=2
Copyright © Schogt Market Timing, The Netherlands, 2010 20
Gold daily chart by Gaby Mittelman1
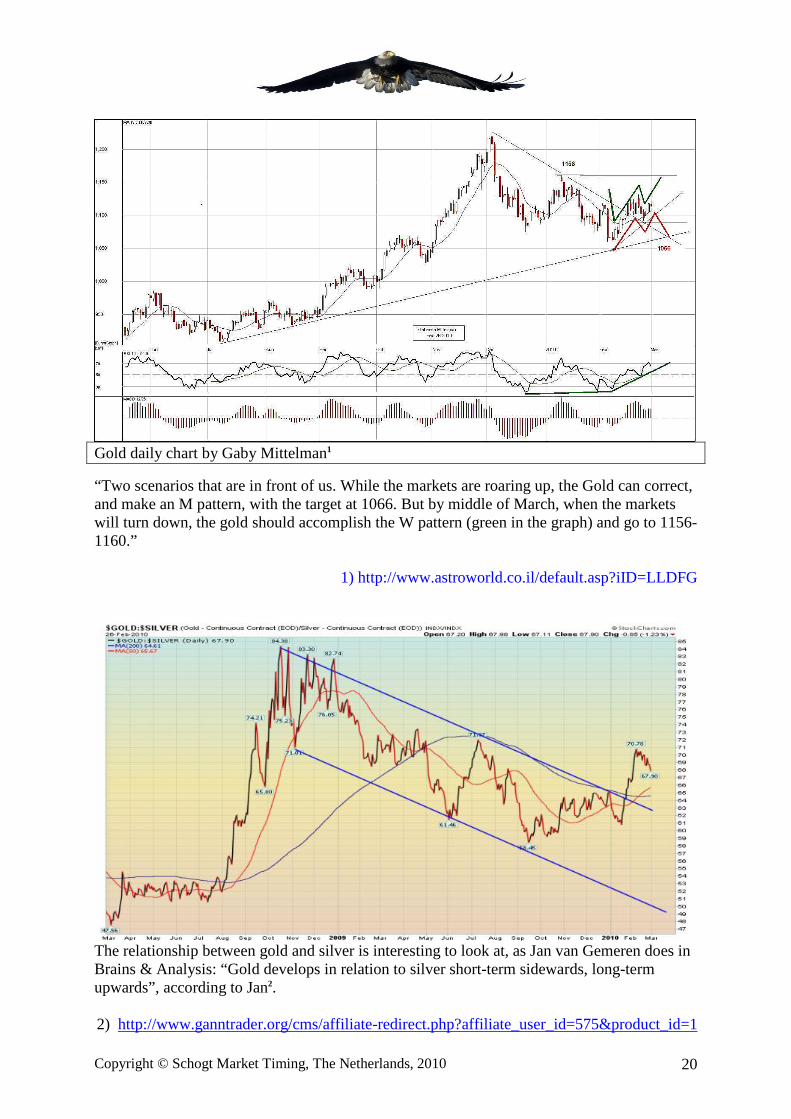
“Two scenarios that are in front of us. While the markets are roaring up, the Gold can correct, and make an M pattern, with the target at 1066. But by middle of March, when the markets will turn down, the gold should accomplish the W pattern (green in the graph) and go to 1156-1160.”
1) http://www.astroworld.co.il/default.asp?iID=LLDFG
The relationship between gold and silver is interesting to look at, as Jan van Gemeren does in Brains & Analysis: “Gold develops in relation to silver short-term sidewards, long-term upwards”, according to Jan2. 2) http://www.ganntrader.org/cms/affiliate-redirect.php?affiliate_user_id=575&product_id=1
Copyright © Schogt Market Timing, The Netherlands, 2010 21
…Think of this: The price of silver could, in relation to gold, make a greater increase. Also realise that there is less physical silver on earth available than there is gold, and that the silver supply declines as soon as it is used on the market and can no longer return to the market.
Gold price expressed in Euros Found on www.Rtl.nl:
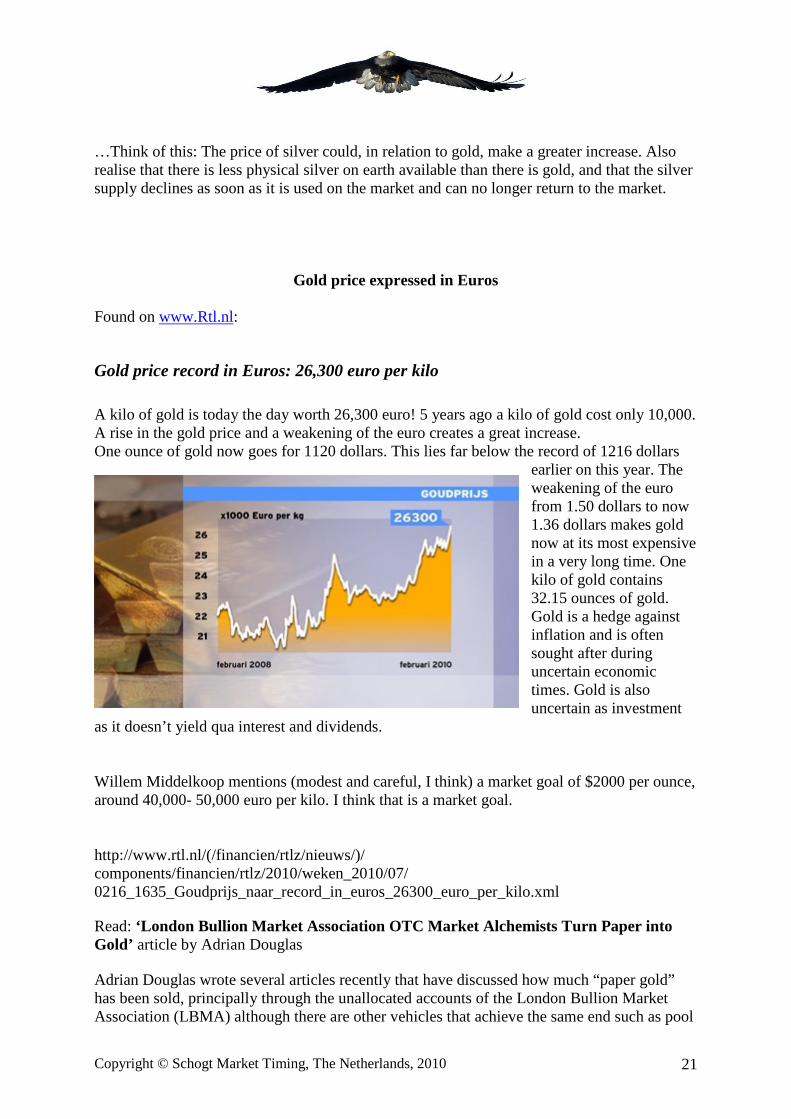
Gold price record in Euros: 26,300 euro per kilo
A kilo of gold is today the day worth 26,300 euro! 5 years ago a kilo of gold cost only 10,000. A rise in the gold price and a weakening of the euro creates a great increase. One ounce of gold now goes for 1120 dollars. This lies far below the record of 1216 dollars
earlier on this year. The weakening of the euro from 1.50 dollars to now 1.36 dollars makes gold now at its most expensive in a very long time. One kilo of gold contains 32.15 ounces of gold. Gold is a hedge against inflation and is often sought after during uncertain economic times. Gold is also uncertain as investment
as it doesn’t yield qua interest and dividends. Willem Middelkoop mentions (modest and careful, I think) a market goal of $2000 per ounce, around 40,000- 50,000 euro per kilo. I think that is a market goal. http://www.rtl.nl/(/financien/rtlz/nieuws/)/ components/financien/rtlz/2010/weken_2010/07/ 0216_1635_Goudprijs_naar_record_in_euros_26300_euro_per_kilo.xml
Read: ‘London Bullion Market Association OTC Market Alche mists Turn Paper into Gold’ article by Adrian Douglas Adrian Douglas wrote several articles recently that have discussed how much “paper gold” has been sold, principally through the unallocated accounts of the London Bullion Market Association (LBMA) although there are other vehicles that achieve the same end such as pool
Copyright © Schogt Market Timing, The Netherlands, 2010 22
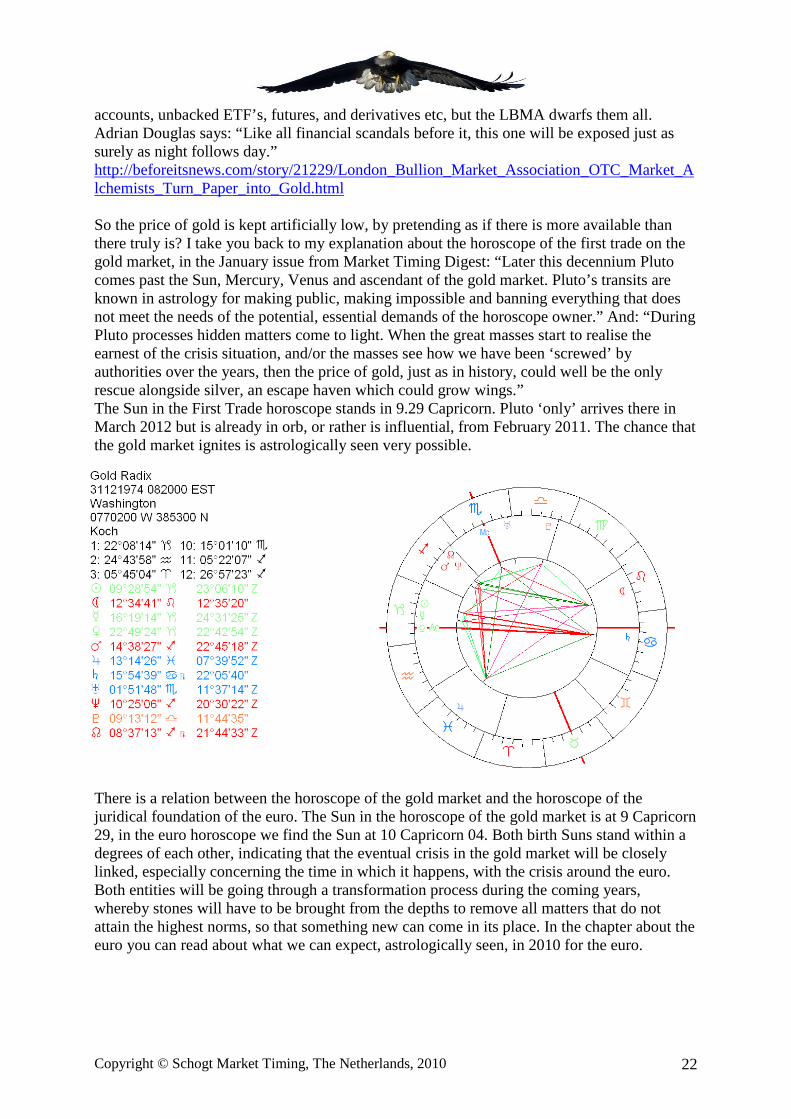
accounts, unbacked ETF’s, futures, and derivatives etc, but the LBMA dwarfs them all. Adrian Douglas says: “Like all financial scandals before it, this one will be exposed just as surely as night follows day.” http://beforeitsnews.com/story/21229/London_Bullion_Market_Association_OTC_Market_Alchemists_Turn_Paper_into_Gold.html So the price of gold is kept artificially low, by pretending as if there is more available than there truly is? I take you back to my explanation about the horoscope of the first trade on the gold market, in the January issue from Market Timing Digest: “Later this decennium Pluto comes past the Sun, Mercury, Venus and ascendant of the gold market. Pluto’s transits are known in astrology for making public, making impossible and banning everything that does not meet the needs of the potential, essential demands of the horoscope owner.” And: “During Pluto processes hidden matters come to light. When the great masses start to realise the earnest of the crisis situation, and/or the masses see how we have been ‘screwed’ by authorities over the years, then the price of gold, just as in history, could well be the only rescue alongside silver, an escape haven which could grow wings.” The Sun in the First Trade horoscope stands in 9.29 Capricorn. Pluto ‘only’ arrives there in March 2012 but is already in orb, or rather is influential, from February 2011. The chance that the gold market ignites is astrologically seen very possible.
There is a relation between the horoscope of the gold market and the horoscope of the juridical foundation of the euro. The Sun in the horoscope of the gold market is at 9 Capricorn 29, in the euro horoscope we find the Sun at 10 Capricorn 04. Both birth Suns stand within a degrees of each other, indicating that the eventual crisis in the gold market will be closely linked, especially concerning the time in which it happens, with the crisis around the euro. Both entities will be going through a transformation process during the coming years, whereby stones will have to be brought from the depths to remove all matters that do not attain the highest norms, so that something new can come in its place. In the chapter about the euro you can read about what we can expect, astrologically seen, in 2010 for the euro.
Copyright © Schogt Market Timing, The Netherlands, 2010 23
Summary of analysts’ views Dharmik Team “GOLD is in an upward market now. More upward moves to 1.200 can be expected.” http://www.futureanalyzer.com/ Gann Trader Jan: “Trend 6 months is up. Price target zone 1150 support 1060 resistance 1150. The price is moving neutrally between 1040 and 1130 and is currently closer to the upper level of this range. Our analysis incline towards a decline.” http://www.ganntrader.org/cms/affiliate-redirect.php?affiliate_user_id=575&product_id=1
Raymond Merriman: “Our concern is that February 5 was a contracted primary cycle trough, and the “excessive speculation bubble” in Gold is now starting as we get closer to the Jupiter-Uranus in Aries minefield where many financial and commodity markets could double in price rather quickly. Gold would not exempt from this. To the contrary, it would probably be the leader. … We hit our first buy point at 1050. It is possible that’s all we will get. Still, like stocks, we may get another pullback in March Ideally March 9-21). Whether it is a new low or not, traders would be advised to buy it.”
http://www.markettiming.nl/nl_products/se_cycnbnl.php
Gaby Mittelman: “Two scenarios that are in front of us. While the markets are roaring up, the Gold can correct, and make an M pattern, with the target at 1066. But by middle of March, when the markets will turn down, the gold should accomplish the W pattern (green in the graph) and go to 1156-1160.” http://www.astroworld.co.il/default.asp?iID=LLDFG\
Ted Phillips: “Gold most likely completed a bottom almost at the same level as the S & P at 1044 on Feb. 5th. I am more bullish on gold again if it can remain above the 1080 level. The strongest planetary resistance levels for March are at 1152, 1188, and 1224..”
http://www.astroadvisor.com/
Barry Rosen: “Gold suddenly became a flight to qulaity market and that could change a number of things. We do expect new lows into early April but the market may hold up and retrace more than we originally thought with 1135 a first target or higher to 1165 at the latest by March 1. Still looking for 1350 into the June high.”
http://www.fortucast.com
Markus Rose: “I am currently still a bear for Gold, but intend to shift to LONG on March 3 or 4. March 12 is going to be a high for Gold.” http://www.rosecast.com
Tjerk Spriensma: “ Gold this week: Up towards March 11, astrologically the 12th. We have to get above the ITD7 high(1131,50); 1132 is the 50% level between the December high and the February low. It would be nice if we made 1150. Fibonacci-technically the most plausible price is between 1142 and 1156. After that we can go back to a low in April.” http://www.ganntrader.org/intl_cms/affiliate-redirect.php?affiliate_user_id=72&product_id=2
Copyright © Schogt Market Timing, The Netherlands, 2010 24
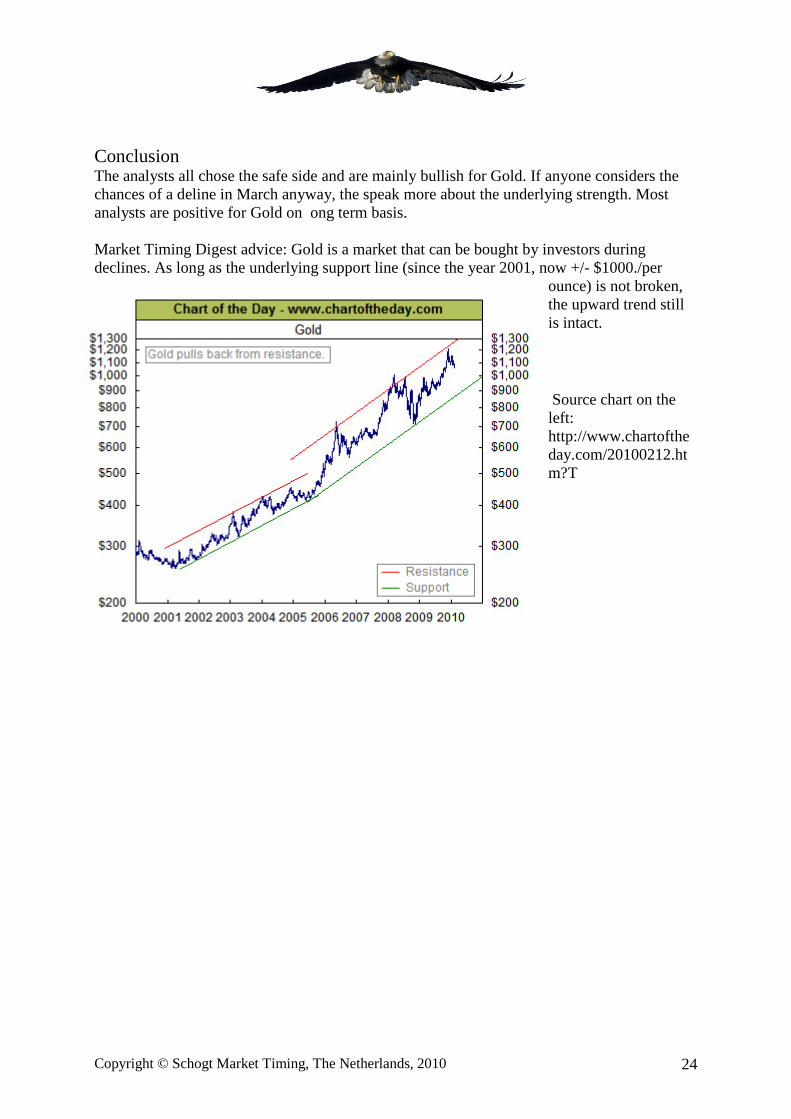
Conclusion The analysts all chose the safe side and are mainly bullish for Gold. If anyone considers the chances of a deline in March anyway, the speak more about the underlying strength. Most analysts are positive for Gold on ong term basis. Market Timing Digest advice: Gold is a market that can be bought by investors during declines. As long as the underlying support line (since the year 2001, now +/- $1000./per
ounce) is not broken, the upward trend still is intact.
Source chart on the left: http://www.chartoftheday.com/20100212.htm?T
Copyright © Schogt Market Timing, The Netherlands, 2010 25
Euro/ Dollar
Looking back and to the future
Looking back
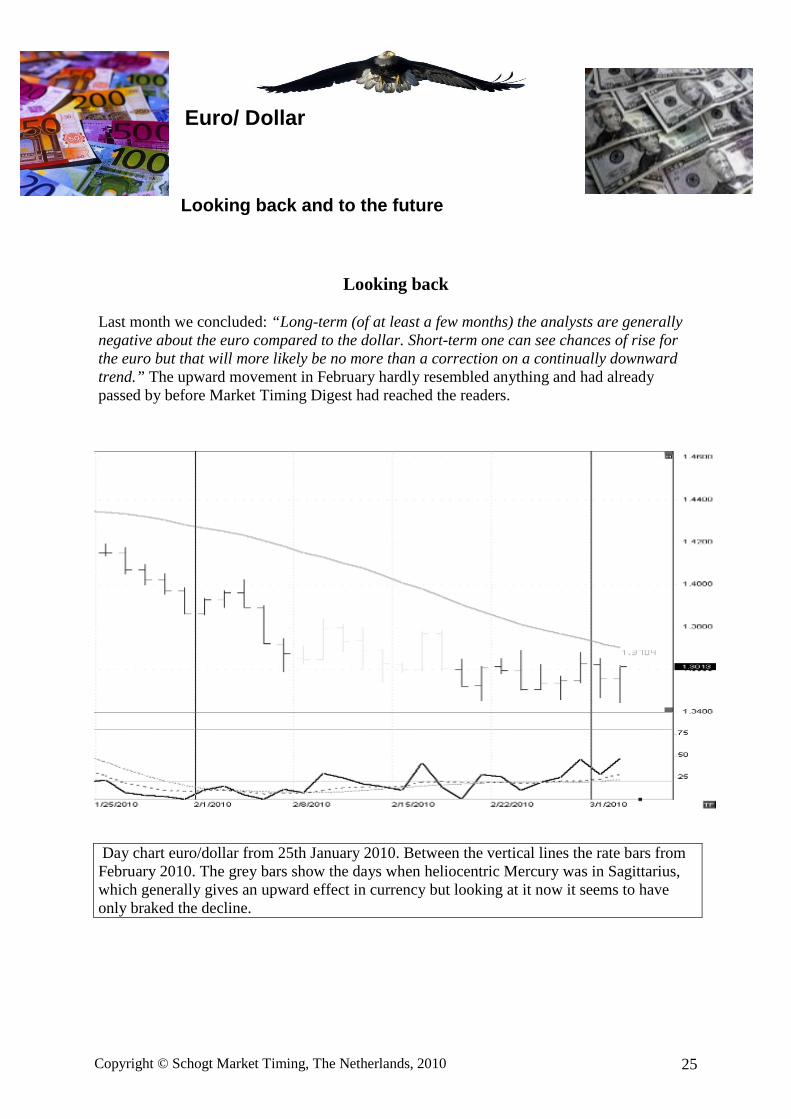
Last month we concluded: “Long-term (of at least a few months) the analysts are generally negative about the euro compared to the dollar. Short-term one can see chances of rise for the euro but that will more likely be no more than a correction on a continually downward trend.” The upward movement in February hardly resembled anything and had already passed by before Market Timing Digest had reached the readers.
Day chart euro/dollar from 25th January 2010. Between the vertical lines the rate bars from February 2010. The grey bars show the days when heliocentric Mercury was in Sagittarius, which generally gives an upward effect in currency but looking at it now it seems to have only braked the decline.
Copyright © Schogt Market Timing, The Netherlands, 2010 26
Summary of analysts’ views
Dharmik Team: “EURUSD went to 1.3400 and pullback after that... A recovery back to 1.4000 can be seen during this month but USD will recover after that again.” http://www.futureanalyzer.com/
GannTrader Jan van Gemeren: “$ Trend is up 6 months, market target DX 85, support 78 Dollar. The rate is starting to top around the earlier mentioned market target of 82. We remain positive for the dollar development for middle-long term but for the short-term we remain on the sideline.” http://www.ganntrader.org/cms/affiliate-redirect.php?affiliate_user_id=575&product_id=1
Raymond Merriman: “ Until the monetary euro closes above 1,4600, I still give preference to lower prices of 1,2500 or even 1,1000-1,1500 as the 4-year cycle heads for a bottom around the end of November and perhaps even at the end of the primary cycle. Traders are advised to sell at increases until they come out at above 1,4300 in monetary euro.” http://www.markettiming.nl/en_products/se_cyc.php
Barry Rosen: “ The 700-point bounce on the Euro may not come in until we hit 129.00. We need to stay short but we have to get a grip on where this bounce will start.” www.fortucast.com
Markus Rose: “March 22 is going to be a low for the Euro and stocks...” www.rosecast.com
Conclusion
The long-term trend for the dollar points up, the euro could correct up a bit before the currency pair declines again.
And: astrology and the horoscope of the euro suggest that the euro money presses will be turned on in April, if that really happens then it will be to the advantage of the dollar, rate disadvantage of the euro and the declining long-term trend of the euro/dollar will continue.
Below is an astrological actuality analysis of the euro in 2010 and 2011.
Copyright © Schogt Market Timing, The Netherlands, 2010 27
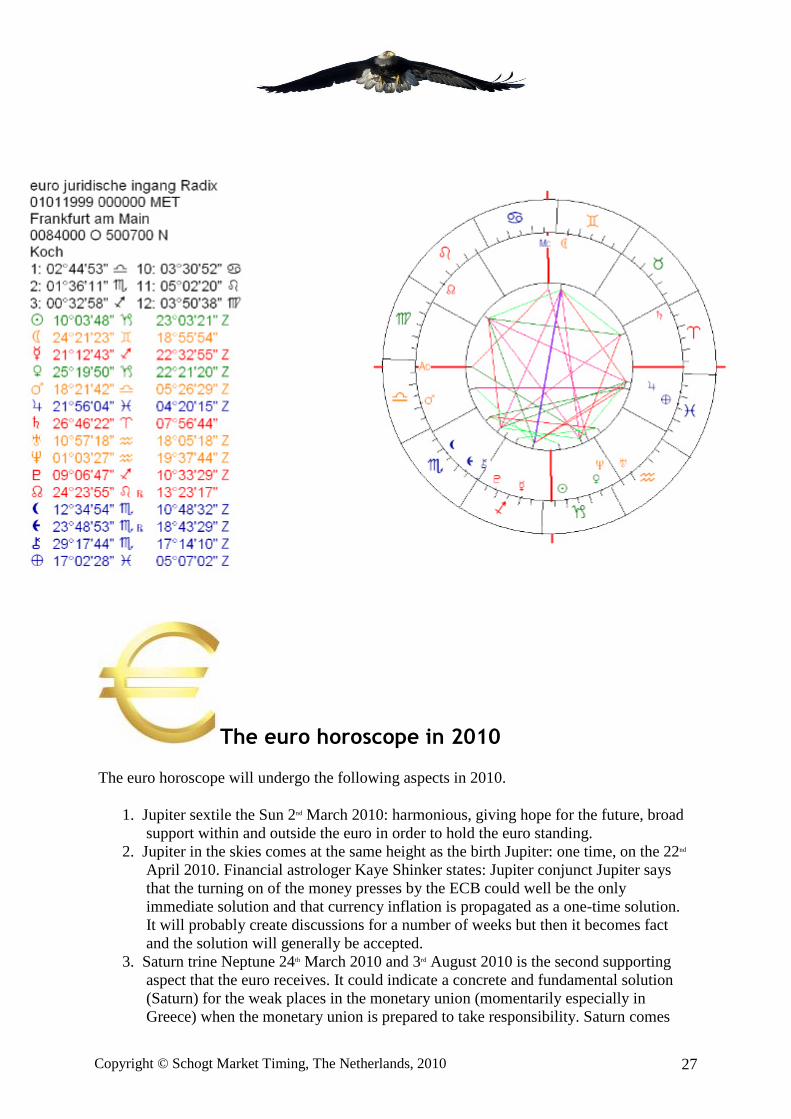
The euro horoscope in 2010
The euro horoscope will undergo the following aspects in 2010.
1. Jupiter sextile the Sun 2nd March 2010: harmonious, giving hope for the future, broad support within and outside the euro in order to hold the euro standing.
2. Jupiter in the skies comes at the same height as the birth Jupiter: one time, on the 22nd April 2010. Financial astrologer Kaye Shinker states: Jupiter conjunct Jupiter says that the turning on of the money presses by the ECB could well be the only immediate solution and that currency inflation is propagated as a one-time solution. It will probably create discussions for a number of weeks but then it becomes fact and the solution will generally be accepted.
3. Saturn trine Neptune 24th March 2010 and 3rd August 2010 is the second supporting aspect that the euro receives. It could indicate a concrete and fundamental solution (Saturn) for the weak places in the monetary union (momentarily especially in Greece) when the monetary union is prepared to take responsibility. Saturn comes
Copyright © Schogt Market Timing, The Netherlands, 2010 28
over the ascendant for the last time later on in August. This could be the time for the final accounting; the entity probably feels weak but can survive if responsibility is taken. Weak partners become bait.
4. Saturn over the ascendant on 3rd march and on the 19th August: see above: the aspect under 1) could bring possible enlightenment to the situation in March (the euro rises again against the dollar at the beginning of March, how fitting), the aspect 2) might give a disguised solution but the aspect named in 3) is more powerful and will definitely leave tracks. From 19th August the euro will face the world with its own power. The ascendant represents ‘the personality’ of the euro that is now experiencing the visit from the “Master of Pain”, Saturn. A new cycle begins, the monetary union now needs to take responsibility and show it.
5. Jupiter opposite the ascendant 3rd July 2010, 12th August 2010 and 6th February 2011: a lot of promises are offered by a party outside the euro, who come with the ultimate solution – it seems.
6. Pluto again (March 2009 was the last time) conjunct the IC 20th July 2010, when the roots, the foundations of the monetary union are again revisited by Pluto, the advocate of the devil, that returns once more for his last “task”, on the 6th November 2010. Pluto has the dynamics of Debt, but also the dynamics of death and re-birth. In mythology he is linked to Hades, whose name means “he who brings wealth”. In other words, when one (people and all entities that are aspected by Pluto) experiences terrible periods and eventually, later, looking back can say that it “was actually good that this change occurred”. But Pluto is also the collecting service, collector of debts, however possible. You cannot hide from Pluto. Pluto has a very long cycle around the Sun (248 years) and processes related to Pluto create a complete transformation, which may only be seen many years later. The core of the situation has been playing since March 2009 (when the first problems in the E.C. became visible), July 2010 and November 2010.
7. Uranus goes over the descendant beginning of May 2011, opposite the ascendant. Renewal, departure, shock, sudden freedom and pressurised teamwork?
8. The horoscope of the euro starts to look better when Jupiter makes a trine with the Sun in August 2011 and again in March 2012. Hopefully the authoritive E.C. countries have now tackled the greatest problems concerning the currency in order to keep ahead during the opposite of the transit Saturn to radix Saturn that will start to play from the beginning of 2012 (comparable to puberty and stubborn teenage phase with people).
Want to read more? Read for e.g. the article from Kaye Shinker about the euro horoscope, titled “Euro is stressed out” at http://astrologicalinvesting.blogspot.com/.
Translated by Nathalie Robertson-Porter
© Copyright by Schogt Market Timing. No part of this may be reproduced or copied without permission from Schogt Market Timing. Disclaimer: All information provided herein is based upon Schogt Market Timing’s technical, cyclical, and geocosmic analysis, and the integration of each of these factors. It is presented with reliable intent. However no claims for future accuracy are being made, no can projections be guaranteed. Reliance of information in this report is at the sole risk of the reader. Derivative strategies are for the aggressive trader.