marketing analytics technology: statistical analysis software & r market segmentation using r...
TRANSCRIPT
Marketing Analytics Technology: Statistical Analysis Software & R
Market Segmentation using R
Stephan Sorgerwww.stephansorger.com
© Stephan Sorger 2015: www.stephansorger.com; Marketing Analytics; Tech: R Segment: 1
Disclaimer:• All images such as logos, photos, etc. used in this presentation are the property of their respective copyright owners and are used here for educational purposes only• Some material adapted from: Sorger, “Marketing Analytics: Strategic Models and Metrics”
PREREQUISITE: R BASICS
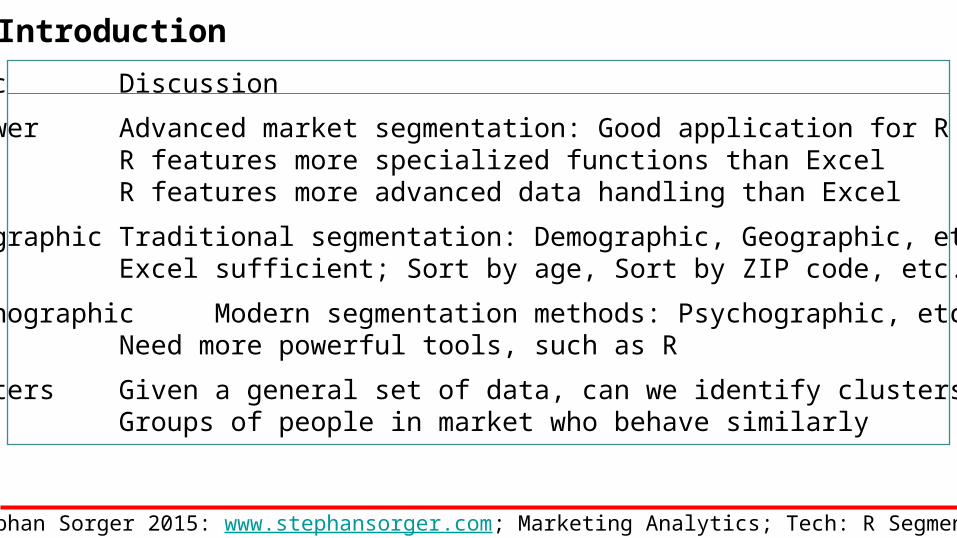
Introduction
Topic Discussion
R Power Advanced market segmentation: Good application for RR features more specialized functions than ExcelR features more advanced data handling than Excel
Demographic Traditional segmentation: Demographic, Geographic, etc.Excel sufficient; Sort by age, Sort by ZIP code, etc.
Psychographic Modern segmentation methods: Psychographic, etc.Need more powerful tools, such as R
Clusters Given a general set of data, can we identify clusters?Groups of people in market who behave similarly
© Stephan Sorger 2015: www.stephansorger.com; Marketing Analytics; Tech: R Segment: 2
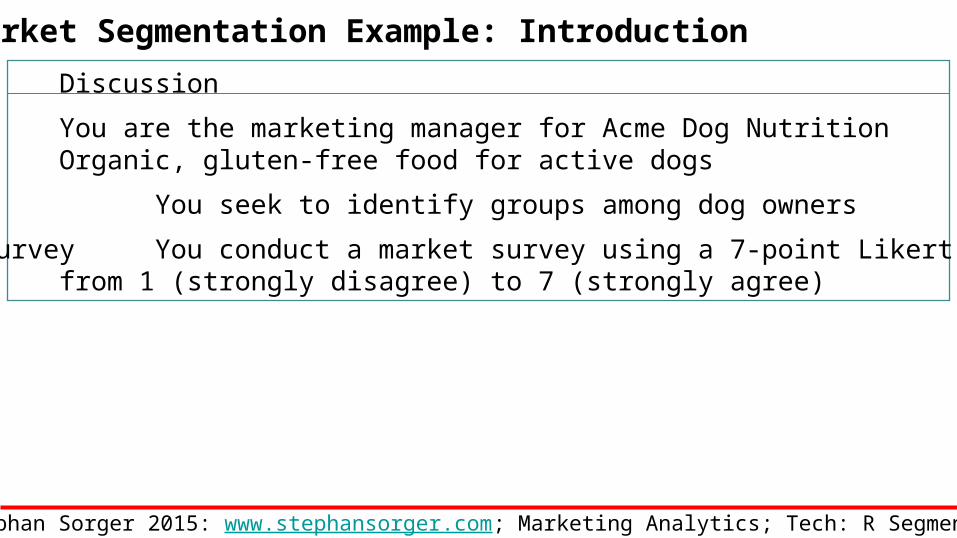
Market Segmentation Example: Introduction
Topic Discussion
Acme Dog You are the marketing manager for Acme Dog NutritionOrganic, gluten-free food for active dogs
Groups You seek to identify groups among dog owners
Market Survey You conduct a market survey using a 7-point Likert scalefrom 1 (strongly disagree) to 7 (strongly agree)
© Stephan Sorger 2015: www.stephansorger.com; Marketing Analytics; Tech: R Segment: 3
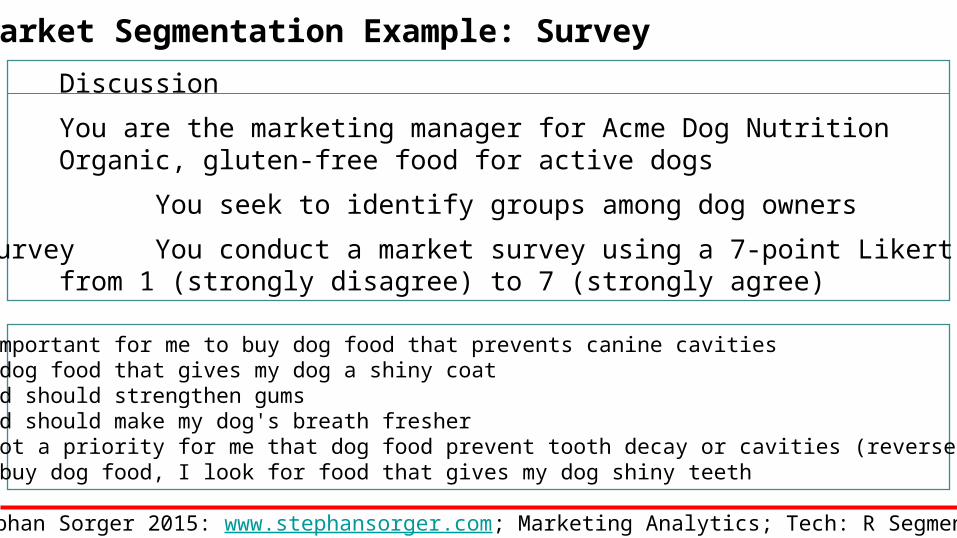
Market Segmentation Example: Survey
Topic Discussion
Acme Dog You are the marketing manager for Acme Dog NutritionOrganic, gluten-free food for active dogs
Groups You seek to identify groups among dog owners
Market Survey You conduct a market survey using a 7-point Likert scalefrom 1 (strongly disagree) to 7 (strongly agree)
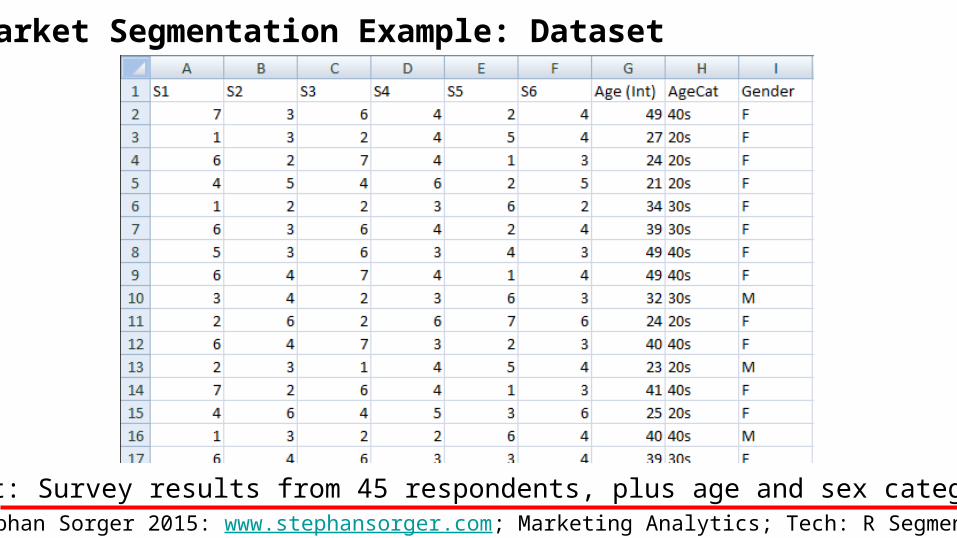
S1: It is important for me to buy dog food that prevents canine cavitiesS2: I like dog food that gives my dog a shiny coatS3: Dog food should strengthen gumsS4: Dog food should make my dog's breath fresherS5: It is not a priority for me that dog food prevent tooth decay or cavities (reverse coded)S6: When I buy dog food, I look for food that gives my dog shiny teeth
© Stephan Sorger 2015: www.stephansorger.com; Marketing Analytics; Tech: R Segment: 4
Market Segmentation Example: Dataset
Dataset: Survey results from 45 respondents, plus age and sex categories© Stephan Sorger 2015: www.stephansorger.com; Marketing Analytics; Tech: R Segment: 5
Market Segmentation Example: Exercise
Topic Discussion
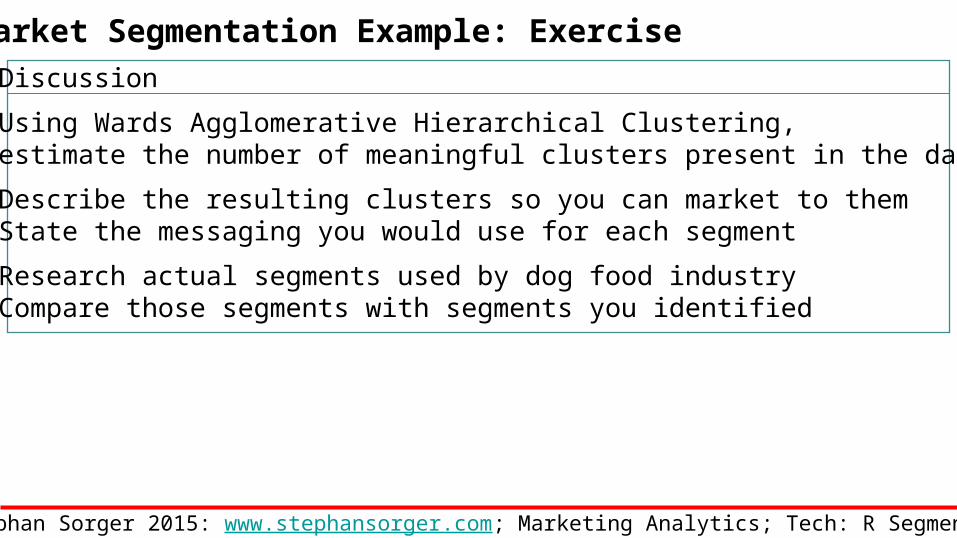
1. Using Wards Agglomerative Hierarchical Clustering,estimate the number of meaningful clusters present in the data
2. Describe the resulting clusters so you can market to themState the messaging you would use for each segment
3. Research actual segments used by dog food industryCompare those segments with segments you identified
© Stephan Sorger 2015: www.stephansorger.com; Marketing Analytics; Tech: R Segment: 6
Market Segmentation Example: Exercise
Topic Discussion
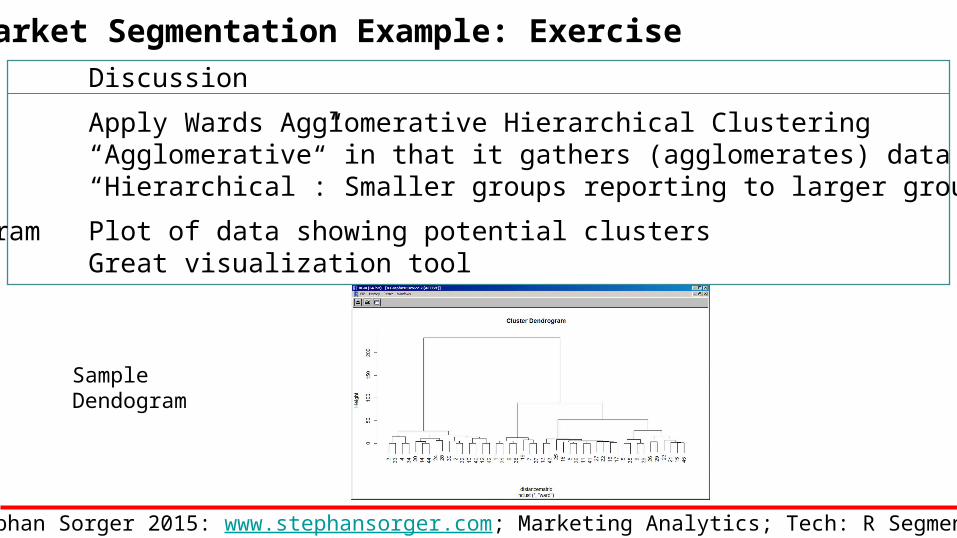
Wards Apply Wards Agglomerative Hierarchical Clustering “Agglomerative” in that it gathers (agglomerates) data points“Hierarchical”: Smaller groups reporting to larger groups
Dendogram Plot of data showing potential clustersGreat visualization tool
SampleDendogram
© Stephan Sorger 2015: www.stephansorger.com; Marketing Analytics; Tech: R Segment: 7
Market Segmentation Example: Download R
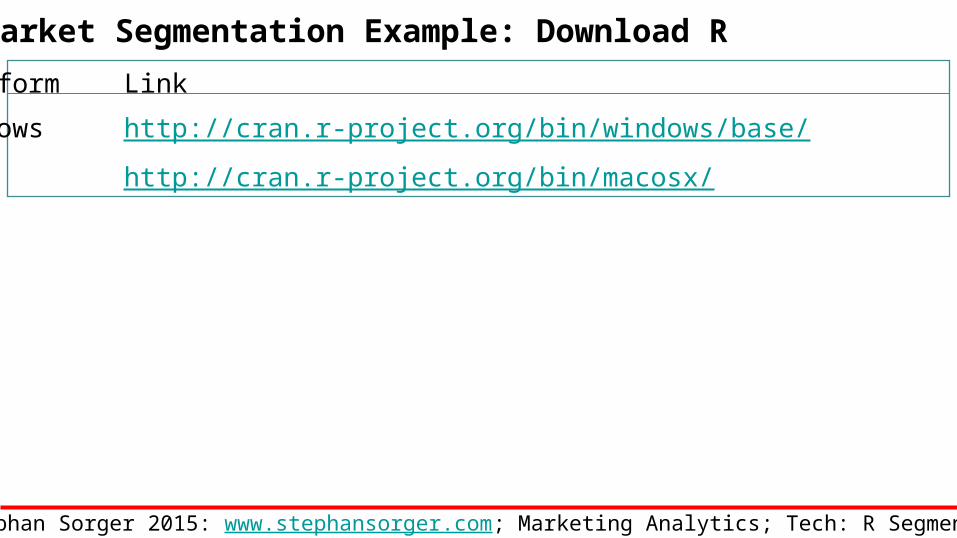
Platform Link
Windows http://cran.r-project.org/bin/windows/base/
Mac http://cran.r-project.org/bin/macosx/
© Stephan Sorger 2015: www.stephansorger.com; Marketing Analytics; Tech: R Segment: 8
Market Segmentation Example: Launch R
Topic Discussion
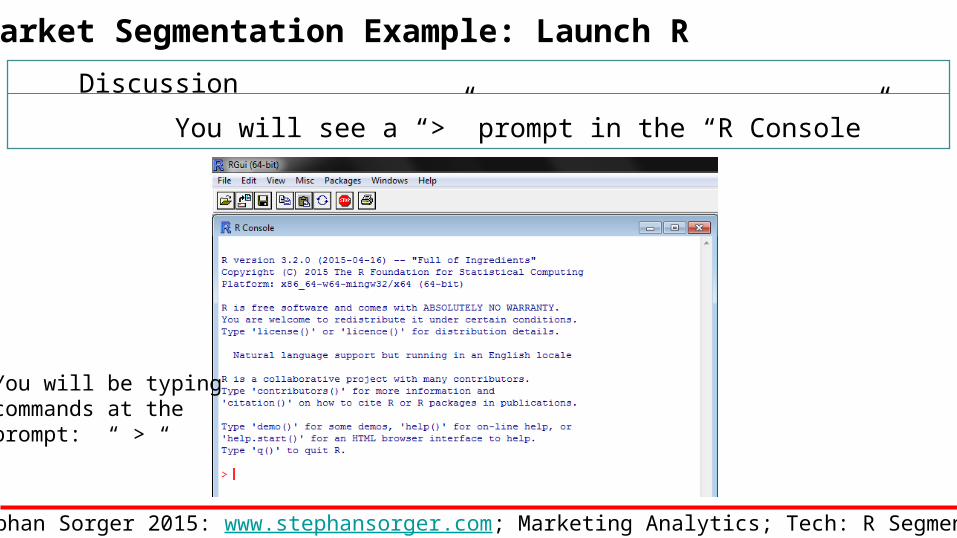
Prompt You will see a “>” prompt in the “R Console”
You will be typingcommands at theprompt: “ > “
© Stephan Sorger 2015: www.stephansorger.com; Marketing Analytics; Tech: R Segment: 9
Market Segmentation Example: Prepare Data File
Topic Discussion
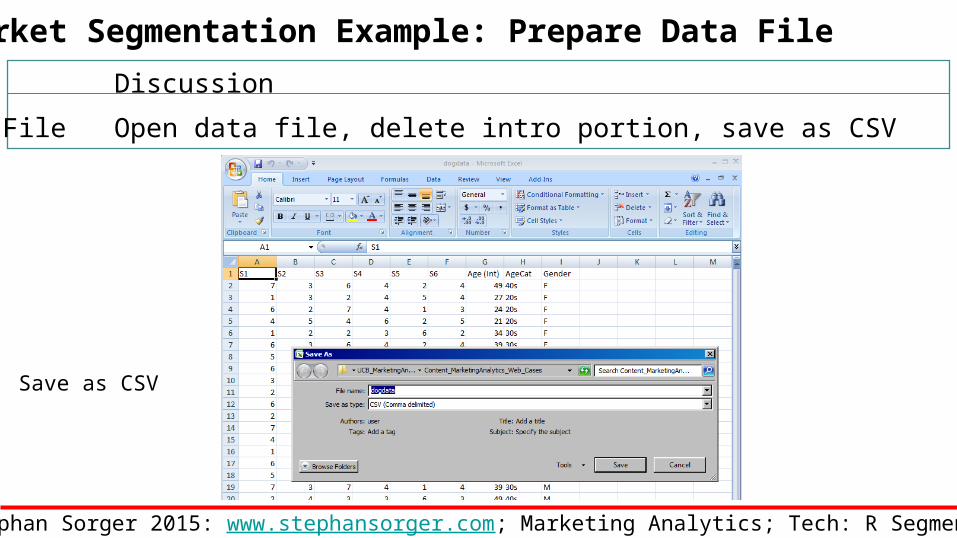
Data File Open data file, delete intro portion, save as CSV
Save as CSV
© Stephan Sorger 2015: www.stephansorger.com; Marketing Analytics; Tech: R Segment: 10
Market Segmentation Example: Read Data
Topic Discussion
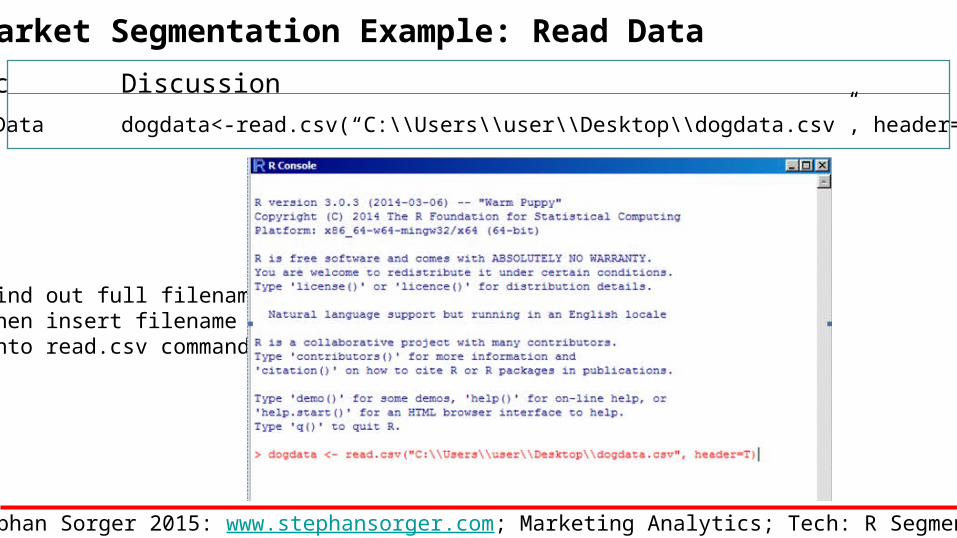
Read Data dogdata<-read.csv(“C:\\Users\\user\\Desktop\\dogdata.csv”, header=T)
Find out full filename,then insert filenameinto read.csv command
© Stephan Sorger 2015: www.stephansorger.com; Marketing Analytics; Tech: R Segment: 11
Market Segmentation Example: Confirm Reading Data
Topic Discussion
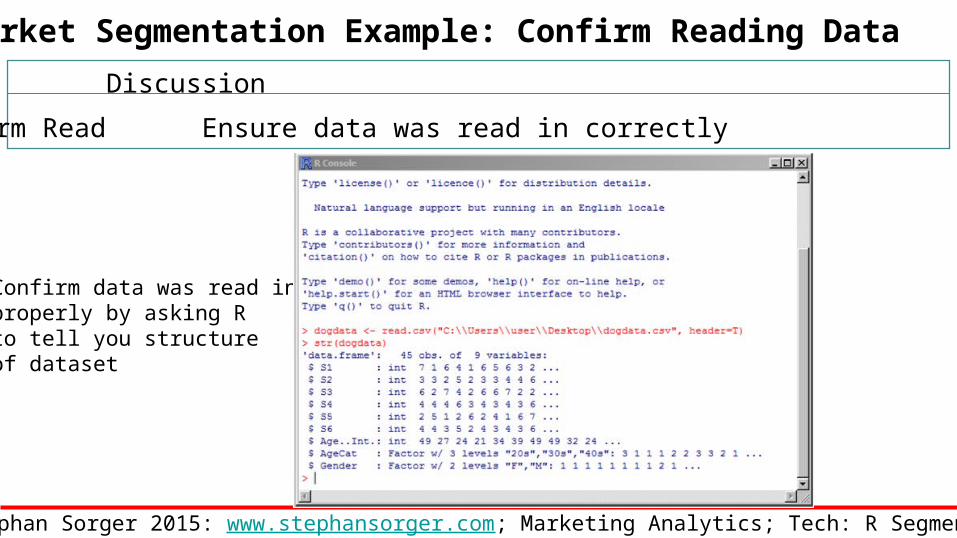
Confirm Read Ensure data was read in correctly
Confirm data was read inproperly by asking R to tell you structure of dataset
© Stephan Sorger 2015: www.stephansorger.com; Marketing Analytics; Tech: R Segment: 12
Market Segmentation Example: Distance Matrix for Wards
Topic Discussion
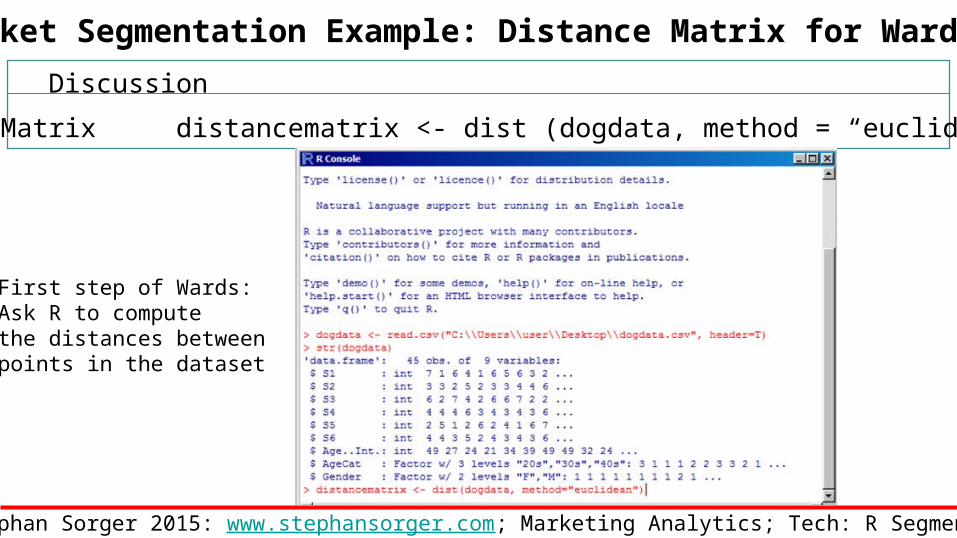
Distance Matrix distancematrix <- dist (dogdata, method = “euclidean” )
First step of Wards:Ask R to compute the distances betweenpoints in the dataset
© Stephan Sorger 2015: www.stephansorger.com; Marketing Analytics; Tech: R Segment: 13
Market Segmentation Example: Clusters for Wards
Topic Discussion
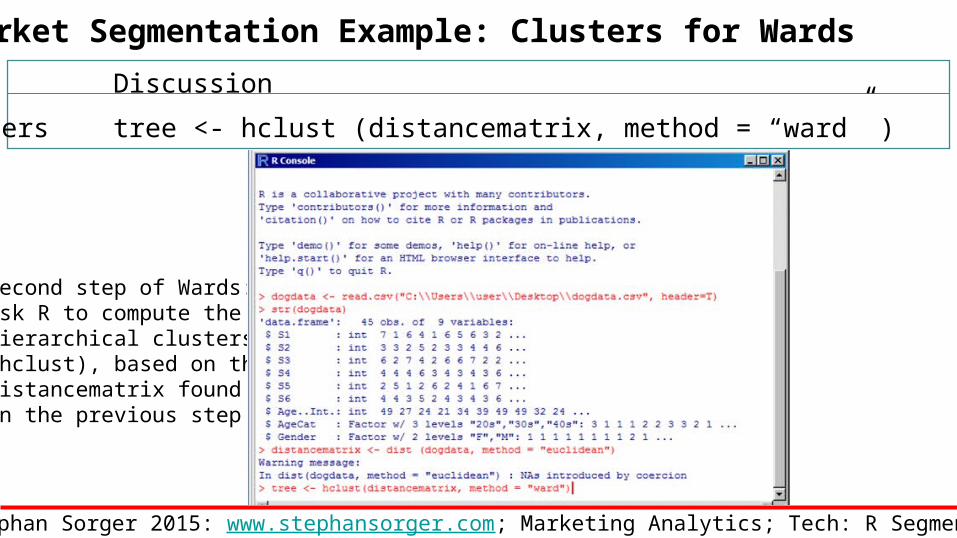
Clusters tree <- hclust (distancematrix, method = “ward” )
Second step of Wards:Ask R to compute thehierarchical clusters (hclust), based on the distancematrix found in the previous step
© Stephan Sorger 2015: www.stephansorger.com; Marketing Analytics; Tech: R Segment: 14
Market Segmentation Example: Dendograms for Wards
Topic Discussion
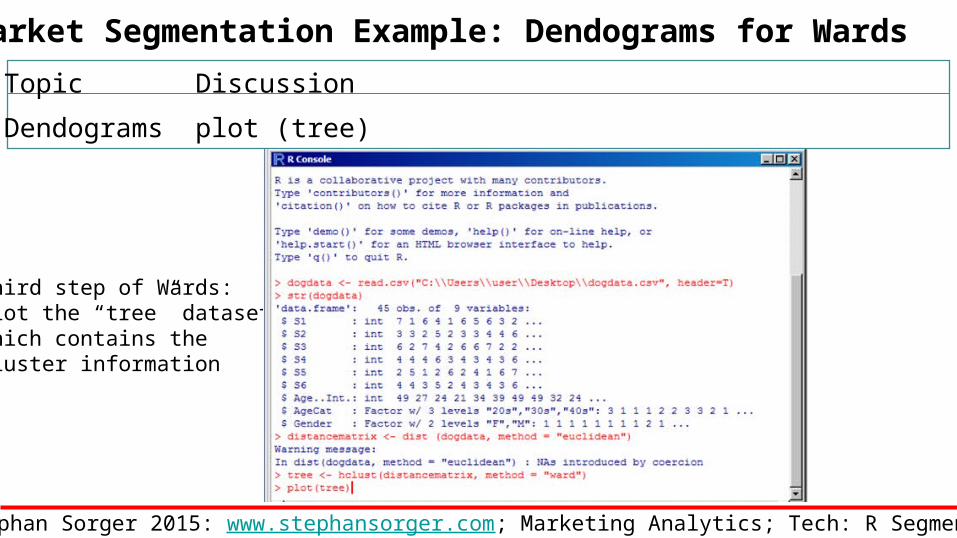
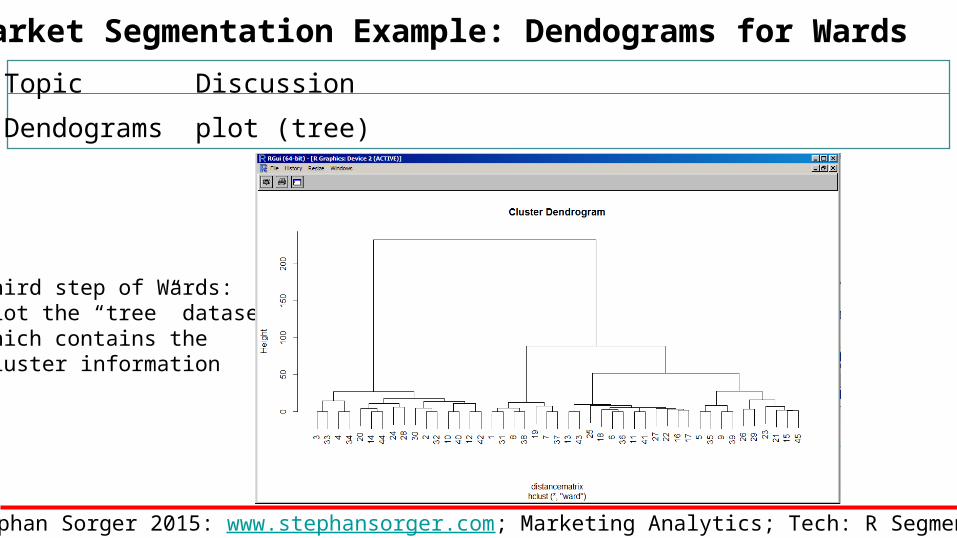
Dendograms plot (tree)
Third step of Wards:Plot the “tree” dataset,which contains the cluster information
© Stephan Sorger 2015: www.stephansorger.com; Marketing Analytics; Tech: R Segment: 15
Market Segmentation Example: Dendograms for Wards
Topic Discussion
Dendograms plot (tree)
Third step of Wards:Plot the “tree” dataset,which contains the cluster information
© Stephan Sorger 2015: www.stephansorger.com; Marketing Analytics; Tech: R Segment: 16
Market Segmentation Example: Interpret Dendograms
Topic Discussion
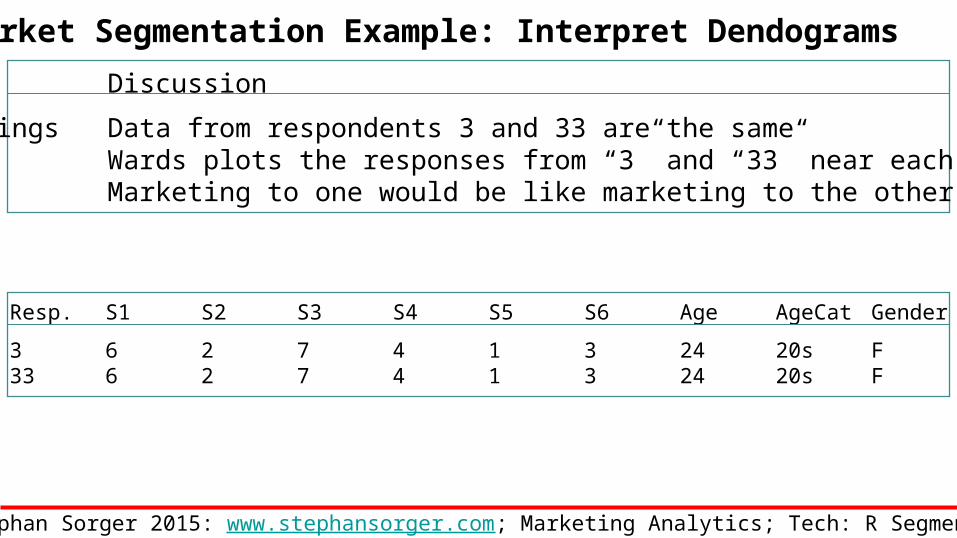
Groupings Data from respondents 3 and 33 are the sameWards plots the responses from “3” and “33” near each otherMarketing to one would be like marketing to the other
Resp. S1 S2 S3 S4 S5 S6 Age AgeCat Gender
3 6 2 7 4 1 3 24 20s F33 6 2 7 4 1 3 24 20s F
© Stephan Sorger 2015: www.stephansorger.com; Marketing Analytics; Tech: R Segment: 17
Market Segmentation Example: Membership in Clusters
Topic Discussion
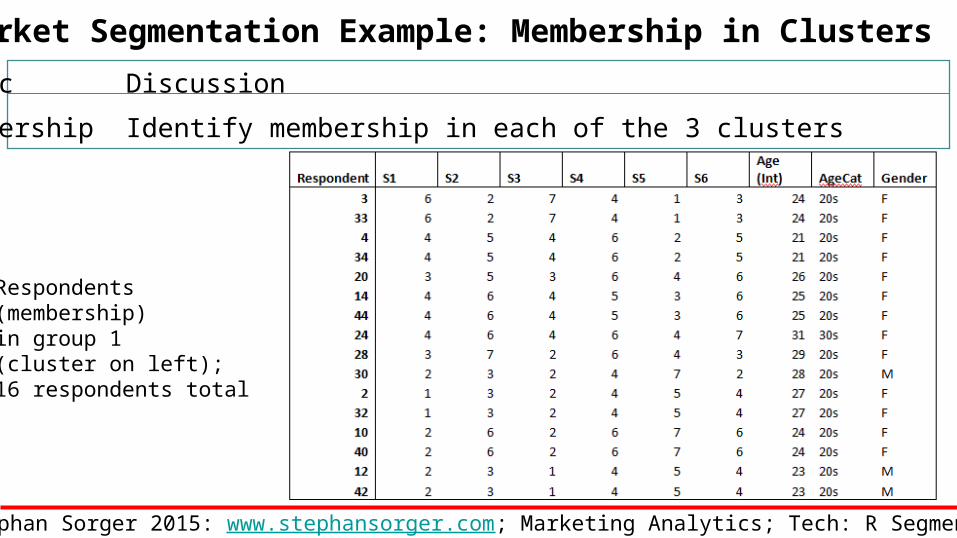
Membership Identify membership in each of the 3 clusters
Respondents (membership)in group 1(cluster on left); 16 respondents total
© Stephan Sorger 2015: www.stephansorger.com; Marketing Analytics; Tech: R Segment: 18
Market Segmentation Example: Cluster Mean: Group 1
Topic Discussion
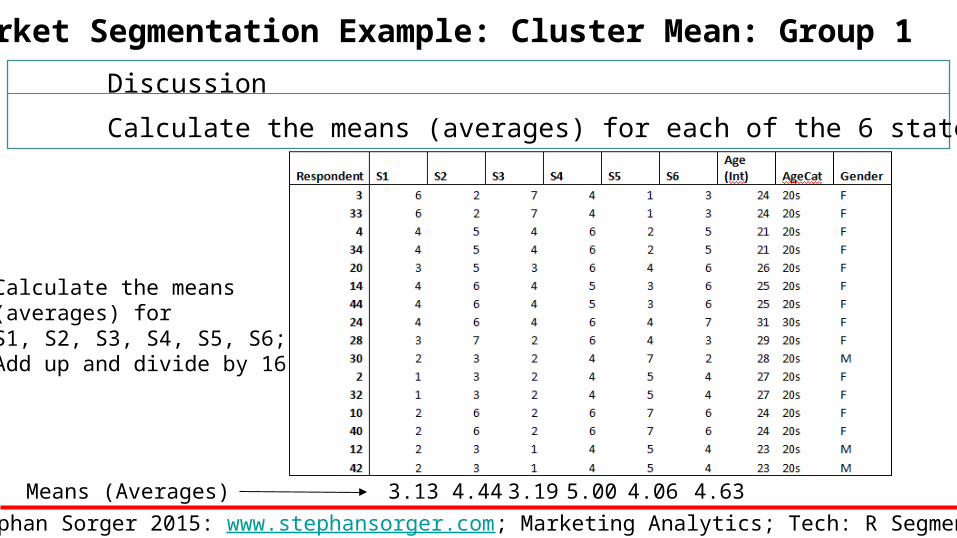
Means Calculate the means (averages) for each of the 6 statements
Calculate the means(averages) for S1, S2, S3, S4, S5, S6;Add up and divide by 16
3.13 4.634.065.003.194.44Means (Averages)
© Stephan Sorger 2015: www.stephansorger.com; Marketing Analytics; Tech: R Segment: 19
Market Segmentation Example: Cluster Mean: Groups 2 & 3
Topic Discussion
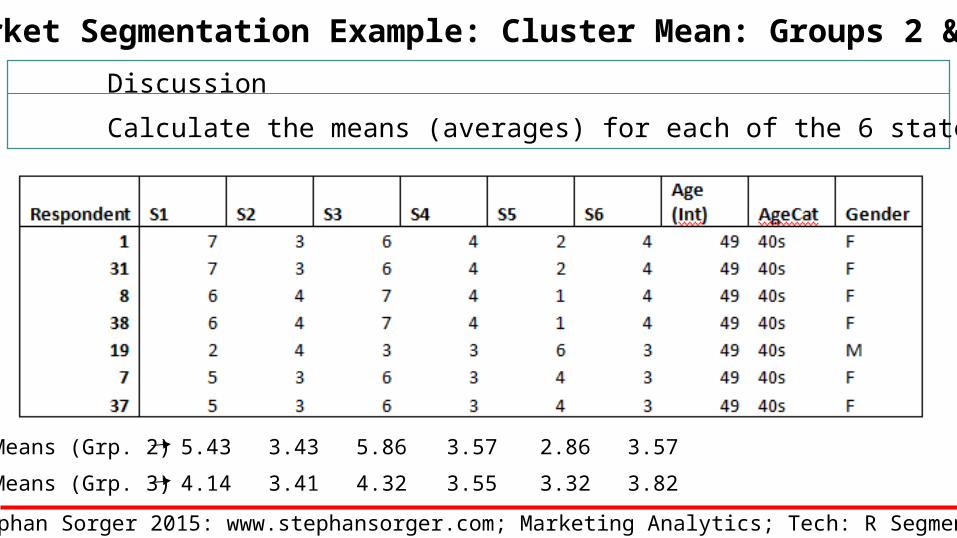
Means Calculate the means (averages) for each of the 6 statements
5.43 3.572.863.575.863.43Means (Grp. 2)
4.14 3.823.323.554.323.41Means (Grp. 3)
© Stephan Sorger 2015: www.stephansorger.com; Marketing Analytics; Tech: R Segment: 20

Market Segmentation Example: Cluster Mean: Summary
Topic Discussion
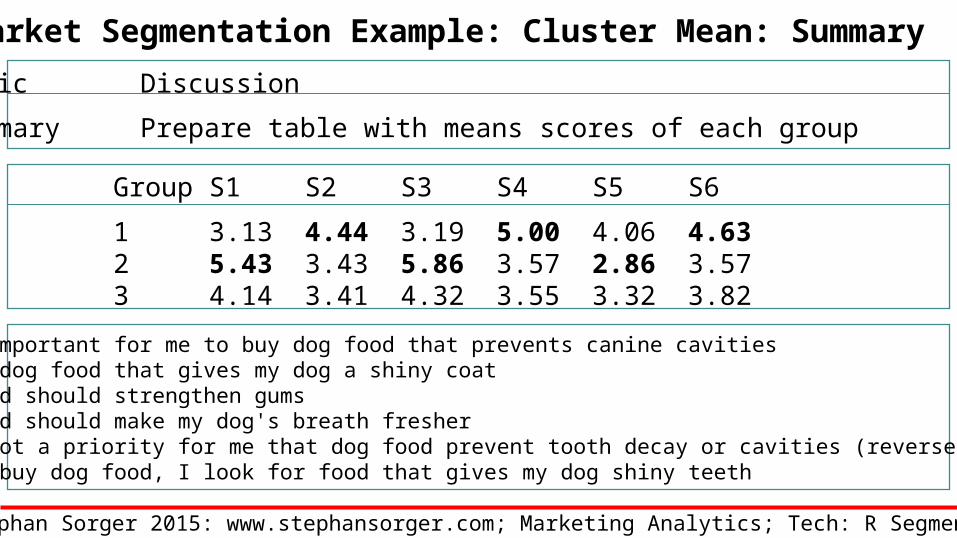
Summary Prepare table with means scores of each group
Group S1 S2 S3 S4 S5 S6
1 3.13 4.44 3.19 5.00 4.06 4.632 5.43 3.43 5.86 3.57 2.86 3.573 4.14 3.41 4.32 3.55 3.32 3.82
© Stephan Sorger 2015: www.stephansorger.com; Marketing Analytics; Tech: R Segment: 21
Market Segmentation Example: Cluster Mean: Summary
Topic Discussion
Summary Prepare table with means scores of each group
Group S1 S2 S3 S4 S5 S6
1 3.13 4.44 3.19 5.00 4.06 4.632 5.43 3.43 5.86 3.57 2.86 3.573 4.14 3.41 4.32 3.55 3.32 3.82
S1: It is important for me to buy dog food that prevents canine cavitiesS2: I like dog food that gives my dog a shiny coatS3: Dog food should strengthen gumsS4: Dog food should make my dog's breath fresherS5: It is not a priority for me that dog food prevent tooth decay or cavities (reverse coded)S6: When I buy dog food, I look for food that gives my dog shiny teeth
© Stephan Sorger 2015: www.stephansorger.com; Marketing Analytics; Tech: R Segment: 22
Market Segmentation Example: Cluster Interpretation
Topic Discussion
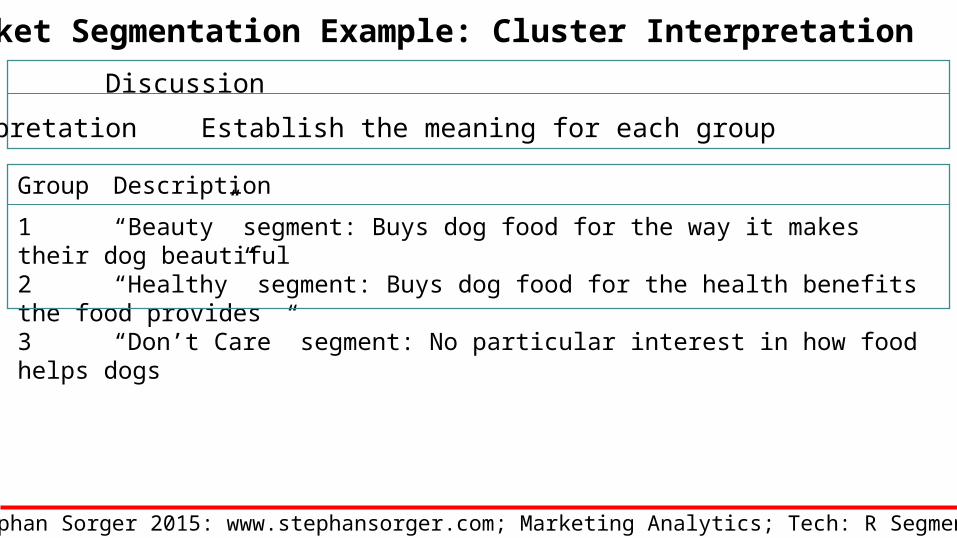
Interpretation Establish the meaning for each group
Group Description
1 “Beauty” segment: Buys dog food for the way it makes their dog beautiful2 “Healthy” segment: Buys dog food for the health benefits the food provides3 “Don’t Care” segment: No particular interest in how food helps dogs
© Stephan Sorger 2015: www.stephansorger.com; Marketing Analytics; Tech: R Segment: 23
Market Segmentation Example: Market Comparison
Topic Discussion
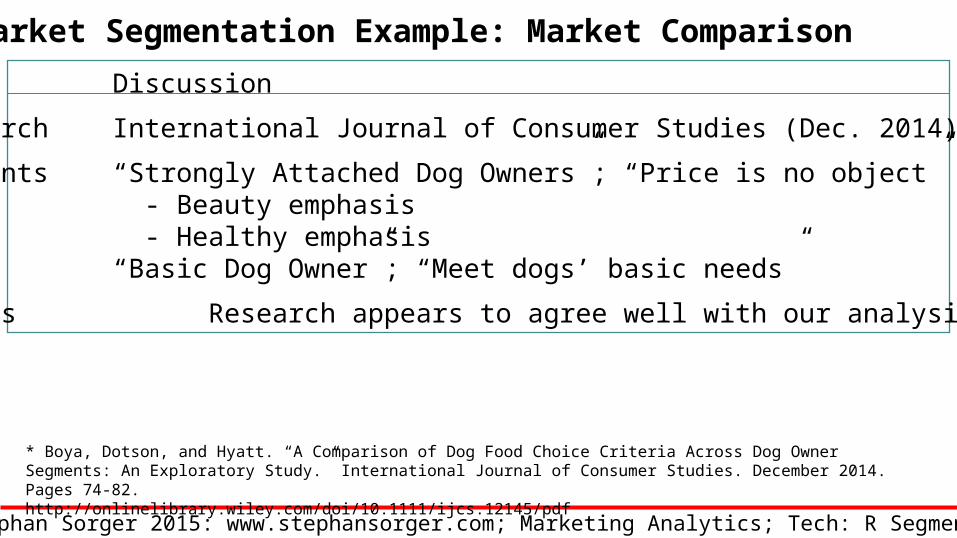
Research International Journal of Consumer Studies (Dec. 2014) *
Segments “Strongly Attached Dog Owners”; “Price is no object” - Beauty emphasis - Healthy emphasis“Basic Dog Owner”; “Meet dogs’ basic needs”
Agrees Research appears to agree well with our analysis
* Boya, Dotson, and Hyatt. “A Comparison of Dog Food Choice Criteria Across Dog Owner Segments: An Exploratory Study.” International Journal of Consumer Studies. December 2014. Pages 74-82.http://onlinelibrary.wiley.com/doi/10.1111/ijcs.12145/pdf
© Stephan Sorger 2015: www.stephansorger.com; Marketing Analytics; Tech: R Segment: 24