marketing fact all over the world 2014
DESCRIPTION
Marketing fact all over the world 2014TRANSCRIPT

PUBLISHED DECEMBER 30, 2013© COPYRIGHT 2013 CRAIN COMMUNICATIONS INC.
SPONSORED BY
2014 Edition
ANNUAL GUIDE TO MARKETERS, MEDIA AND AGENCIES
65%Percentage of adults who text on mobile
phone while watching TV
$22.7B2012 worldwide revenue
of soon-to-merge Publicis and
Omnicom24.6%Internet’s
projected share of U.S. ad spending in 2014
$505B2013 worldwide ad spending on
major media
1.5MU.S. ad industry employment, up 69,500 jobs from downturn nadir
4.4%Average 2014 growth
forecast for U.S. ad spending
annual2014 v38.qxp 12/17/2013 11:31 AM Page 1

ADVERTISING AGE DECEMBER 30, 2013 • 3
MARKETING FACT PACK 2014
MARKETERS:
P. 6IAdvertising spending growth ratesWorldwide and U.S. media spending trends
P. 8ILargest advertisersIn the U.S. and worldwide
MEDIA:
P. 16IShare of U.S. ad spending by mediumIncluding internet’s share of U.S. ad spending
P. 20ITime spent using mediaAverage minutes per day
P. 22ILargest TV networks and most-viewed programsMore: Ad Age’s prime-time TV price chart on Page 24
AGENCIES:
P. 26IWorld’s 10 largest agency companiesMore: World’s largest agency networks on Page 27
P. 28ILargest agency ventures by categoryCompanies, networks and agencies
Agency revenue growth2001 through 2012
CONSUMERS:
P. 30IPopulation and consumer sentimentDemographics and consumer confidence
P. 32IHow consumers interact with media technology Smartphones and tablets. Multitasking while watching TV
JOBS:
P. 34IU.S. ad industry employmentAdvertising/marketing services and media
This document, and information contained therein, is the copyrighted property of Crain Communications Inc. and The Ad Age Group (© Copyright 2013) and isfor your personal, non-commercial use only. You may not reproduce, display on a website, distribute, sell or republish this document, or the information con-tained therein, without prior written consent of The Ad Age Group.
ABOUT MARKETING FACT PACK 2014Advertising Age’s Marketing Fact Pack 2014 was producedby Ad Age DataCenter and published Dec. 30, 2013.
Email: [email protected]
Send mail to: Ad Age DataCenter150 N. Michigan Ave., Ste. 1737, Chicago, IL 60601
Additional copies: Digital edition accessible freeonline at AdAge.com/annual2014. Order print copiesat [email protected] or by calling1-877-320-1721; for readers outside the U.S., 1-313-446-0450
DataCenter staff: Directors: Kevin Brown, Bradley Johnson.Editors: Shawna Lent, Catherine Wolf. Research assistants:Amanda Murphy, Katie Robinson, Rachael Turski, Valerie Wojs
Ad sales: 1-212-210-0139
INSIDE
annual2014 v38.qxp 12/17/2013 11:31 AM Page 3
ADVERTISING AGE DECEMBER 30, 2013 • 5
MARKETING FACT PACK 2014
THE NUMBERS YOU NEED. STAT.Ad Age’s annual guide to marketers, media and agencies
Welcome to Ad Age’s2014 Marketing Fact Pack,our guide to marketers,media and agencies.
We’ll show you thebiggest players, who’srising and who’s falling,drawing on the Ad AgeDataCenter’s rankingsand analysis from thepast year. Want to digdeeper? Subscribe toAdAge.com/datacenterto get the numbers thatcount.
BRADLEY JOHNSONKEVIN BROWN
AD AGE DATACENTER
SUBSCRIBE TO AD AGEDATACENTERDataCenter subscribers getexclusive access toAdAge.com/datacentercontent.
Explore Ad Age’s marketersdatabase (profiles, agencyrosters, executives, brands,spending), updated inDecember 2013. AdAge.com/marketertrees2013update
Review agency rankings.AdAge.com/agencyreport2013
Get facts on the global market.AdAge.com/globalmarketers2013
Subscription info:AdAge.com/subscribe
WANT MORE?
THE BIG LIST1.
LARGEST ADVERTISER:PROCTER & GAMBLE CO.
$4.8 billion in 2012 totalU.S. ad spending (measuredmedia plus unmeasuredspending); $10.6 billion in2012 worldwide measured-media spending.
2. FASTEST-GROWING
MAJOR ADVERTISER:SAMSUNG
55% growth in 2012worldwide measured-mediaspending, highest growth onAd Age’s Global 100; 58%growth in 2012 total U.S. adspending, highest growth onAd Age’s 100 LeadingNational Advertisers.
3. BIGGEST AGENCY
COMPANY: PUBLICISOMNICOM GROUP
Assuming Publicis andOmnicom complete theirmerger. Combined 2012global revenue: $22.7 billion.
4. WORLD’S BIGGEST
AGENCY NETWORK:DENTSU (JAPAN)
2012 estimated globalrevenue for Dentsu Inc.’sagency network in Japan: $3.6 billion.
5. NATION’S LARGESTAGENCY NETWORK:
MCCANN WORLDGROUP2012 estimated revenue
from U.S. for Interpublic-owned network: $1.6 billion.
6. LARGEST AD MARKET:
U.S.33% of 2013 worldwide
ad spending (but just 4.4% ofworld population).
7. MOST-ADVERTISED U.S. BRAND: AT&T
$1.6 billion in 2012 U.S.measured-media spending.
8. BIGGEST
AD MEDIUM: TV39% of 2013 U.S. major-
media ad spending, aheadof internet.
9. FASTEST-GROWING
AD MEDIUM: INTERNET18.2% growth in 2013 U.S.
ad spending. Internet’s 2013share of ad spending: 21.7%.
10. BIGGEST MOBILE
AD SELLER: GOOGLE$4 billion in estimated
2013 U.S. mobile ad revenue.
annual2014 v38.qxp 12/17/2013 11:32 AM Page 5

ADVERTISING AGE DECEMBER 30, 2013 • 7
MARKETING FACT PACK 2014
10 biggest megabrandsMost-advertised brands by 2012 U.S. measured-media ad spending.
From 100 Leading National Advertisers 2013, Part 2 (July 8, 2013).See ranking of nation’s 200 most-advertised brands: AdAge.com/lna2013.
Source: Ad Age DataCenter analysis of U.S. measured-media spending data from WPP’s Kantar Media.Company’s measured spending for all products and services related to brand. More info: kantarmediana.com.
3. CHEVROLETGeneral Motors Co.-8.4%
4. MCDONALD’SMcDonald’s Corp.-0.8%
8. T-MOBILET-Mobile US
48.9%
1. AT&TAT&T2012 vs. 2011: -14.1%
5. GEICOBerkshire Hathaway19.1%
7. FORDFord Motor Co.
-2.3%
9. MACY’SMacy’s
0.1%
10. WALMARTWalmart Stores
10.8%
6. TOYOTAToyota Motor Corp.
4.9%
2. VERIZONVerizon Communications-13.6%
$1.59BILLION
$1.43BILLION
$958MILLION
$957MILLION
$921MILLION
$879MILLION
$857MILLION
$773MILLION
$762MILLION
$690MILLION
annual2014 v38.qxp 12/17/2013 11:32 AM Page 7
ADVERTISING AGE6 • DECEMBER 30, 2013
MARKETING FACT PACK 2014
U.S. and worldwide media advertising growth ratesPercent change in advertising dollars. The average of GroupM, Magna Global and ZenithOptimediaforecasts suggests U.S. ad growth of 4.4% in 2014, double 2013’s 2.2% growth; and worldwide adgrowth of 5.5% in 2014 vs. 3.4% in 2013.
’16’15’14’13’12’11’10’09’08’07
Worldwide, 2007-2016U.S., 2007-2016
AVERAGE OF GROUPM, MAGNA GLOBAL, ZENITHOPTIMEDIA
’16’15’14’13’12’11’10’09’08’07
’16
5.6
’15
3.5
’14
4.4
’13
2.2
’12
4.2
’11
2.5
’10
3.1
’09
-12.4
’08
-4.2
’07
0.8
’16’15’14’13’12’11’10’09’08’07
GROUPM (WPP) MAGNA GLOBAL (INTERPUBLIC) ZENITHOPTIMEDIA (PUBLICIS)
AVERAGE OF GROUPM, MAGNA GLOBAL, ZENITHOPTIMEDIA
-20
-10
0
10%
-20
-10
0
10%
-20
-10
0
10%
-20
-10
0
10% 6.45.95.53.43.94.4
7.3
-9.0
0.5
5.0
Source: December 2013 advertising forecasts of WPP’s GroupM (groupm.com), Interpublic Group of Cos.’ Magna Global (magnaglobal.com) andPublicis Groupe’s ZenithOptimedia (zenithoptimedia.com). U.S. averages for 2015 and 2016 based on average of Magna Global and ZenithOptimedia. Figures include TV, internet, newspaper, magazine, radio and out of home. ZenithOptimedia figures include cinema. GroupM includes cinema in35 markets (but not U.S.). GroupM 2015 and 2016 worldwide growth based on a separate GroupM long-term forecast model.
annual2014 v38.qxp 12/17/2013 11:32 AM Page 6

ADVERTISING AGE DECEMBER 30, 2013 • 9
MARKETING FACT PACK 2014
WORLDWIDE U.S. MEASURED-MEDIAMEASURED-MEDIA SPENDING AD SPENDING
RANK COMPANY 2012 2011 % CHG 2012 2011 % CHG
1 Procter & Gamble Co. Cincinnati $10,615 $11,252 -5.7 $3,143 $3,147 -0.1
2 Unilever Rotterdam, The Netherlands/London 7,413 7,317 1.3 858 678 26.5
3 L’Oréal Clichy, France 5,643 5,593 0.9 1,507 1,386 8.8
4 Toyota Motor Corp. Toyota City, Japan 3,310 2,881 14.9 1,245 1,102 13.0
5 General Motors Co. Detroit 3,206 3,346 -4.2 1,655 1,787 -7.4
6 Coca-Cola Co. Atlanta 3,029 2,913 4.0 385 391 -1.7
7 Nestlé Vevey, Switzerland 2,987 2,937 1.7 840 837 0.4
8 Volkswagen Wolfsburg, Germany 2,971 2,857 4.0 546 533 2.3
9 McDonald’s Corp. Oak Brook, Ill. 2,693 2,656 1.4 957 965 -0.8
10 PepsiCo Purchase, N.Y. 2,470 1,837 34.5 844 658 28.3
11 Reckitt Benckiser Group Slough, Berkshire, U.K. 2,417 2,615 -7.6 474 470 0.7
12 Mars Inc. McLean, Va. 2,181 2,075 5.1 591 572 3.3
13 Fiat (Chrysler Group) Turin, Italy/Auburn Hills, Mich. 2,089 2,455 -14.9 1,148 1,351 -15.0
14 Samsung Electronics Co. Seoul 2,053 1,324 55.1 597 266 124.8
15 Comcast Corp. Philadelphia 2,003 1,832 9.3 1,772 1,594 11.2
16 Ford Motor Co. Dearborn, Mich. 1,975 2,121 -6.9 1,065 1,069 -0.4
17 Honda Motor Co. Tokyo 1,927 1,649 16.8 851 709 20.0
18 Mondelez International Deerfield, Ill. 1,896 1,877 1.0 212 263 -19.4
19 Johnson & Johnson New Brunswick, N.J. 1,877 2,192 -14.4 887 1,043 -14.9
20 Nissan Motor Co. Yokohama, Japan 1,820 1,771 2.8 771 633 21.9
21 Deutsche Telekom (T-Mobile) Bonn, Germany 1,720 1,548 11.1 887 636 39.5
22 Sony Corp. Tokyo 1,692 1,857 -8.9 724 816 -11.2
23 Yum Brands Louisville, Ky. 1,657 1,507 10.0 786 673 16.7
24 Pfizer New York 1,572 1,747 -10.0 1,101 1,357 -18.9
25 PSA Peugeot Citroën Paris 1,498 1,619 -7.5 0 1 -68.0
Total for the 25 $72,712 $71,777 1.3 $23,846 $22,937 4.0From Global Marketers 2013 (Dec. 9, 2013). See 10 biggest advertisers for 95 countries and regions, report methodology and links to measured-mediatracking services by country: AdAge.com/globalmarketers2013.
Source: Ad Age DataCenter analysis of data from measured-media tracking services. Numbers rounded.
25 largest global advertisersBy 2012 worldwide measured-media ad spending. Dollars in millions.
annual2014 v38.qxp 12/17/2013 11:33 AM Page 9
ADVERTISING AGE8 • DECEMBER 30, 2013
MARKETING FACT PACK 2014
TOTAL U.S. AD SPENDING U.S. MEASURED-MEDIA(MEASURED MEDIA PLUS UNMEASURED) AD SPENDING
RANK COMPANY 2012 2011 % CHG 2012 2011 % CHG
1 Procter & Gamble Co. Cincinnati $4,830 $4,903 -1.5 $3,143 $3,147 -0.1
2 General Motors Co. Detroit 3,067 2,816 8.9 1,655 1,787 -7.4
3 Comcast Corp. Philadelphia 2,989 2,763 8.2 1,772 1,594 11.2
4 AT&T Dallas 2,910 3,135 -7.2 1,591 1,846 -13.8
5 Verizon Communications New York 2,381 2,523 -5.6 1,439 1,669 -13.8
6 Ford Motor Co. Dearborn, Mich. 2,277 2,141 6.3 1,065 1,069 -0.4
7 L’Oréal Clichy, France 2,240 2,125 5.4 1,507 1,386 8.8
8 JPMorgan Chase & Co. New York 2,087 2,352 -11.3 447 660 -32.3
9 American Express Co. New York 2,071 2,125 -2.6 349 406 -14.0
10 Toyota Motor Corp. Toyota City, Japan 2,008 1,749 14.8 1,245 1,102 13.0
11 Fiat (Chrysler Group) Turin, Italy/Auburn Hills, Mich. 1,947 1,768 10.1 1,148 1,351 -15.0
12 Walt Disney Co. Burbank, Calif. 1,879 2,112 -11.1 973 1,031 -5.7
13 Walmart Stores Bentonville, Ark. 1,820 1,820 0.0 762 674 13.1
14 Time Warner New York 1,715 2,051 -16.4 1,076 1,289 -16.5
15 Target Corp. Minneapolis 1,653 1,589 4.0 672 701 -4.1
16 Johnson & Johnson New Brunswick, N.J. 1,650 1,940 -14.9 887 1,043 -14.9
17 Pfizer New York 1,637 2,072 -21.0 1,101 1,357 -18.9
18 Bank of America Corp. Charlotte, N.C. 1,615 1,705 -5.3 422 413 2.2
19 Macy’s Cincinnati 1,603 1,507 6.4 842 840 0.3
20 Berkshire Hathaway Omaha, Neb. 1,576 1,394 13.1 1,167 1,032 13.1
21 Anheuser-Busch InBev Leuven, Belgium/St. Louis 1,514 1,423 6.4 584 519 12.5
22 Sears Holdings Corp. Hoffman Estates, Ill. 1,427 1,688 -15.5 642 666 -3.6
23 McDonald’s Corp. Oak Brook, Ill. 1,424 1,367 4.2 957 965 -0.8
24 Sprint Corp. 1 Overland Park, Kan. 1,400 1,400 0.0 810 886 -8.6
25 Unilever Rotterdam, The Netherlands/London 1,328 1,253 5.9 858 678 26.5
Total for the 25 $51,047 $51,720 -1.3 $27,116 $28,111 -3.5From 100 Leading National Advertisers 2013 (June 24, 2013). See expanded data and report methodology at AdAge.com/lna2013. See 100 Leading NationalAdvertisers database including profiles, agency rosters and executives, updated in December 2013: AdAge.com/marketertrees2013update.
Source: Ad Age DataCenter. Total U.S. ad spending is measured-media ad spending (from WPP’s Kantar Media) plus unmeasured spending (estimated byAd Age). Numbers rounded. Measured spending includes TV, newspaper, magazine, radio, outdoor and internet (display advertising; excludes paid search,video and other forms of internet advertising). More info: kantarmediana.com. Unmeasured spending figures are Ad Age DataCenter estimates includingdirect marketing, promotion, internet paid search, internet video, social media and other forms of spending not included in measured media. 1. Japan’sSoftBank Corp. in July 2013 bought a 78% stake in Sprint Nextel Corp. Coinciding with the closing, Sprint Nextel Corp. changed its name to Sprint Corp.
25 largest U.S. advertisersBy 2012 total U.S. ad spending (measured media plus unmeasured spending). Dollars in millions.
annual2014 v38.qxp 12/17/2013 11:32 AM Page 8

ADVERTISING AGE10 • DECEMBER 30, 2013
MARKETING FACT PACK 2014
U.S. market leaders by categoryWith U.S. measured-media ad spending from Kantar Media (dollars in millions).
AUTO MARKETERSMarket share of U.S. auto/light-truck market
RANK MARKET MEASURED2012 MARKETER SHARE 2012 MEDIA 2012
1 General Motors Co. 17.9% $1,655
2 Ford Motor Co. 15.5 1,065
3 Toyota Motor Corp. 14.4 1,245
4 Fiat (Chrysler Group) 11.4 1,148
5 Honda Motor Co. 9.8 851
6 Nissan Motor Co. 7.9 771
7 Hyundai Motor Co. 4.9 290
8 Volkswagen 4.2 546
9 Kia Motors Corp. 3.8 393
10 BMW 2.4 176
Industry total (2012 vehicles sold in millions) 14.5 $8,892
WIRELESSMarket share of wireless-service providers
RANK MARKET MEASURED2012 CARRIER, PARENT SHARE 2012 MEDIA 2012
1 Verizon Wireless 1 31.2% $1,193
2 AT&T 2 27.3 1,250
3 Sprint 3 15.7 810
4 T-Mobile US 11.6 887
5 Tracfone America Movil 7.6 136
6 U.S. Cellular TDS 1.9 57
7 Cricket Leap Wireless International 2 1.7 76
Top 7 97.1 4,409
All other 2.9 921
Industry total (2012 subscribers in millions) 326.5 $5,330
CREDIT CARDSMarket share based on card purchase volume
RANK MARKET MEASURED2012 MARKETER, PARENT SHARE 2012 MEDIA 2012
1 American Express Co. 25.4% $281
2 Chase JPMorgan Chase & Co. 18.7 277
3 Bank of America 11.4 142
4 Citigroup 8.8 292
5 Capital One Financial Corp. 6.6 317
6 Discover Financial Services 4.7 148
7 U.S. Bancorp 4.0 3
8 Wells Fargo & Co. 2.9 4
9 Barclays 1.7 3
10 USAA 1.5 NA
Industry total (purchase volume, $ in trillions) $2.2 $2,162
INSURANCEShare of insurance-industry ad spending
RANK SHARE OF AD MEASURED2012 MARKETER, PARENT SPENDING 2012 MEDIA 2012
1 Geico Berkshire Hathaway 18.3% $921
2 Allstate Corp. 11.9 602
3 State Farm Mutual Auto Ins. Co. 11.7 590
4 Progressive Corp. 9.8 493
5 Nationwide Mutual Ins. Co. 5.0 251
6 UnitedHealth Group 3.9 197
7 Zurich Financial Svcs. Group 3.8 194
8 American Family Mutual Ins. Co. 3.2 160
9 Liberty Mutual Insurance 3.1 158
10 Aflac 2.1 106
Total insurance-industry ad spending 100.0 $5,039
From Ad Age’s 100 Leading National Advertisers 2013, Part 2 (July 8, 2013). Numbers rounded. Expanded footnotes and source information: AdAge.com/lna2013.Source: Measured-media spending from WPP’s Kantar Media. Dollars in millions. More info: kantarmediana.com. Other sources: Auto marketers: Automotive NewsData Center (sales). More info: autonews.com. Wireless: ComScore MobiLens (market share); CTIA (subscribers). More info: comscore.com; ctia.org. 1. VerizonCommunications in first-quarter 2014 expects to complete purchase of Vodafone Group’s 45% stake in Verizon Wireless. 2. AT&T in July 2013 signed deal to buyLeap Wireless. 3. Japan’s SoftBank Corp. in July 2013 bought 78% stake in Sprint Corp. (formerly Sprint Nextel Corp.). Credit cards: The Nilson Report. More info:nilsonreport.com. Market share of general-purpose credit cards based on 2012 total purchase volume in dollars for U.S. credit-card issuers.
annual2014 v38.qxp 12/17/2013 11:33 AM Page 10

ADVERTISING AGE12 • DECEMBER 30, 2013
MARKETING FACT PACK 2014
U.S. market leaders by categoryWith U.S. measured-media ad spending from Kantar Media (dollars in millions).
RETAILRanking based on measured spending
SHARE OF MEASUREDRANK U.S. RETAIL MEDIA2012 MARKETER SALES 2012 2012
1 Macy’s 1.0% $842
2 Walmart Stores 11.5 762
3 Target Corp. 2.5 672
4 Sears Holdings Corp. 1.2 642
5 J.C. Penney Co. 0.5 506
6 Home Depot 2.3 471
7 Lowe’s Cos. 1.7 360
8 Kohl’s Corp. 0.7 356
9 Best Buy Co. 1.3 342
10 Gap Inc. 0.4 340
Industry total (2012 U.S. sales, $ in trillions) $2.9 $16,468
PERSONAL-CARE BRANDSShare of personal-care ad spending
SHARE OF MEASUREDRANK AD SPENDING MEDIA 2012 BRAND, PARENT 2012 2012
1 L’Oréal Paris L’Oréal 7.6% $525
2 Maybelline New York L’Oréal 4.7 325
3 Garnier L’Oréal 3.8 266
4 CoverGirl Procter & Gamble Co. 3.8 261
5 Olay Procter & Gamble Co. 3.6 252
6 Dove Unilever 2.9 199
7 Crest Procter & Gamble Co. 2.8 192
8 Gillette Procter & Gamble Co. 2.6 179
9 Clinique Estée Lauder Cos. 2.0 135
10 Estée Lauder Estée Lauder Cos. 1.9 133
Total personal-care ad spending 100.0 $6,930
RESTAURANTSMarket share based on U.S. systemwide sales
MARKET MEASUREDRANK SHARE MEDIA 2012 CHAIN, PARENT 2012 2012
1 McDonald’s McDonald’s Corp. 8.18% $957
2 Subway Doctor’s Associates 2.78 516
3 Starbucks 1 Starbucks Corp. 2.44 70
4 Wendy’s 1 Wendy’s Co. 1.98 280
5 Burger King 1 Burger King Worldwide 1.97 256
6 Taco Bell 1 Yum Brands 1.74 280
7 Dunkin’ Donuts Dunkin’ Brands Group 1.44 119
8 Pizza Hut 1 Yum Brands 1.32 239
9 KFC 1 Yum Brands 1.07 263
10 Chick-fil-A Chick-fil-A 1.06 32
Industry total (U.S. sales, $ in billions) $434.9 $6,111
BEVERAGE BRANDSMarket share based on U.S. sales volume
MARKET MEASUREDRANK SHARE MEDIA 2012 BRAND, PARENT 2012 2012
1 Coke Coca-Cola Co. 14.37% $243
2 Pepsi PepsiCo 7.46 274
3 Mountain Dew PepsiCo 4.52 44
4 Dr Pepper Dr Pepper Snapple Group 4.08 96
5 Gatorade PepsiCo 3.42 101
6 Nestlé Pure Life Nestlé 3.00 21
7 Sprite Coca-Cola Co. 2.84 10
8 Poland Spring Nestlé 2.25 4
9 Dasani Coca-Cola Co. 1.98 5
10 Tropicana PepsiCo 1.77 63
Industry total (2012 gallons in billions) 29.8 $1,766
From Ad Age’s 100 Leading National Advertisers 2013, Part 2 (July 8, 2013). Numbers rounded. Expanded footnotes and source information: AdAge.com/lna2013.Source: Measured-media spending from WPP’s Kantar Media. Dollars in millions. More info: kantarmediana.com. Other sources: Retail: company filings;Census Bureau (U.S. retail sales). More info: census.gov. Restaurants: 2013 Technomic Top 500 Chain Restaurant Report (report’s 2012 sales figures used tocalculate market share). More info: technomic.com. Systemwide sales is franchised plus company-owned restaurants. 1. Share based on estimated sales.Beverage brands: Beverage Marketing Corp. More info: beveragemarketing.com.
annual2014 v38.qxp 12/17/2013 11:34 AM Page 12

ADVERTISING AGE DECEMBER 30, 2013 • 15
MARKETING FACT PACK 2014
Worldwide major-media adspending by region 2013 major-media ad spending worldwide andpercent change vs. 2012 from ZenithOptimedia.
Numbers rounded. Major media: TV, internet, newspaper, magazine, radio,outdoor and cinema. Source: ZenithOptimedia (Advertising ExpenditureForecasts, December 2013). More info: zenithoptimedia.com.
North America$178.5B+3.3%
Rest of world$10.3B, +10.0%
Middle East and North Africa
$4.4B, +4.7%
Worldwidetotal
$505.4B+3.6%
Latin America$38.8B+8.1%
AsiaPacific
$148.6B+5.6%
Western Europe$98.1B
-1.4%
Central andEasternEurope$26.7B
+5.8%
MAJOR-MEDIA SPENDINGRANK MARKET 2013 2012 % CHG
1 U.S. $166.90 $161.24 3.5
2 Japan 52.84 51.74 2.1
3 China 40.95 37.20 10.1
4 Germany 23.18 23.43 -1.1
5 United Kingdom 20.34 19.38 5.0
6 Brazil 15.86 15.30 3.7
7 Australia 13.07 12.81 2.0
8 France 12.15 12.49 -2.8
9 Canada 11.59 11.63 -0.4
10 South Korea 10.61 10.74 -1.2
11 Russia 10.34 9.21 12.3
12 Indonesia 7.40 6.15 20.4
13 Italy 6.28 7.28 -13.8
14 India 5.86 5.43 8.0
15 Switzerland 5.72 5.66 1.0
16 Argentina 5.67 4.49 26.3
17 Mexico 5.50 5.20 5.8
18 Spain 5.33 5.95 -10.4
19 Netherlands 4.82 4.84 -0.5
20 Belgium 4.64 4.63 0.2
21 South Africa 4.39 4.02 9.2
22 Thailand 4.37 3.85 13.6
23 Austria 4.23 4.18 1.2
24 Sweden 3.42 3.52 -2.8
25 Turkey 3.18 2.82 12.5
Total worldwide $505.42 $487.82 3.6
Source: Publicis Groupe’s ZenithOptimedia (Advertising ExpenditureForecasts, December 2013). More info: zenithoptimedia.com.
25 largest global advertising marketsMajor-media ad spending by market fromZenithOptimedia. Dollars in billions. The U.S.accounted for 33.0% of 2013 worldwide adspending but just 4.4% of world population.
MAJOR-MEDIA SPENDING PER CAPITA RANK MARKET 2014 2013 % CHG
1 Switzerland $741 $734 1.0
2 Australia 559 556 0.4
3 U.S. 552 529 4.4
4 Austria 507 500 1.4
5 Belgium 430 427 0.7
21 Mexico 51 46 9.5
22 Turkey 47 43 8.7
23 China 33 30 10.0
24 Indonesia 35 29 19.1
25 India 5 5 9.7
Source: Publicis Groupe’s ZenithOptimedia (Advertising ExpenditureForecasts, December 2013). Numbers rounded.More info: zenithoptimedia.com.
Ad spending per personPer capita spending by market for five highestand five lowest among 25 largest markets,according to ZenithOptimedia. The bottom fiveare growing near or above double-digit rates.
annual2014 v38.qxp 12/17/2013 11:34 AM Page 15
KANTAR MEASURED-MEDIA 100 LNA MEASURED-MEDIA;FOR TOTAL U.S. AND UNMEASURED SPENDING
MEDIUM 2012 2011 % CHG 2012 2011 % CHG
Consumer, Sunday, B-to-B and local magazine $23,825 $24,395 -2.3 $8,199 $8,443 -2.9
National and local newspaper; free-standing insert 18,878 19,369 -2.5 4,160 4,372 -4.8
Network TV 27,434 24,846 10.4 18,471 17,174 7.5
Spot TV 17,091 15,565 9.8 4,085 4,288 -4.7
National syndicated TV 5,133 4,746 8.1 3,214 2,829 13.6
Cable TV network 24,373 23,582 3.4 11,813 11,502 2.7
Network, national spot and local radio 8,361 8,135 2.8 2,439 2,423 0.6
Outdoor 4,221 4,015 5.1 1,171 1,100 6.5
Internet display 10,279 10,590 -2.9 4,485 4,668 -3.9
Subtotal: measured media 139,594 135,243 3.2 58,036 56,799 2.2
Subtotal: unmeasured spending 2 NA NA NA 46,446 44,882 3.5
Total U.S. spending NA NA NA $104,482 $101,681 2.8
From 100 Leading National Advertisers (June 24, 2013). See full report and methodology at AdAge.com/lna2013. See 100 Leading National Advertisersdatabase including profiles, agency rosters and executives, updated in December 2013: AdAge.com/marketertrees2013update.
Source: Ad Age DataCenter. Measured-media spending by medium from WPP’s Kantar Media. More info: kantarmediana.com. Network TV includesSpanish-language networks. Local newspaper includes Spanish-language newspapers. Consumer magazine includes Spanish-language magazines. 1. 100 Leading National Advertisers. 2. Unmeasured spending figures are Ad Age DataCenter estimates including direct marketing, promotion,internet paid search, internet video, social media and other forms of spending not included in measured media.
ADVERTISING AGE14 • DECEMBER 30, 2013
MARKETING FACT PACK 2014
U.S. ad spending totals by medium from Kantar MediaMeasured-media spending. 100 LNA1 totals. Dollars in millions.
U.S. ad spending forecast from ZenithOptimediaEstimated spending in major media and marketing services. Total in 2014: $390 billion, up 3.2%.
2014 2014 VS. 2013 VS.SPENDING 2013 2012
SECTOR ($ BILLIONS) % CHG % CHG
MAJOR MEDIA
TV $67.0 4.1% 2.9%
Radio 17.4 1.9 2.1
Magazines 17.1 -2.7 -2.4
Newspapers 21.1 -8.0 -8.0
Internet 43.0 18.4 18.2
Outdoor and cinema 9.1 5.0 4.5
Subtotal: major media $174.7 4.7% 3.5%
2014 2014 VS. 2013 VS.SPENDING 2013 2012
SECTOR ($ BILLIONS) % CHG % CHG
MARKETING SERVICES
Direct mail $47.4 -1.7% -3.0%
Telemarketing 52.9 1.0 2.0
Sales promotion 72.5 3.1 3.3
Public relations 4.4 7.1 5.6
Event sponsorship 30.2 8.4 8.1
Directories 8.2 -3.0 -5.2
Subtotal: marketing services $215.6 2.0% 1.7%
Total: media and mktg. svcs. $390.3 3.2% 2.5%
Source: Publicis Groupe’s ZenithOptimedia (Advertising Expenditure Forecasts, December 2013). More info: zenithoptimedia.com.
annual2014 v38.qxp 12/17/2013 11:34 AM Page 14

ADVERTISING AGE16 • DECEMBER 30, 2013
MARKETING FACT PACK 2014
Source: ZenithOptimedia (Advertising Expenditure Forecasts, December 2013). Numbers rounded. More info: zenithoptimedia.com.
Source: ZenithOptimedia (Advertising Expenditure Forecasts, December 2013). Numbers rounded. More info: zenithoptimedia.com.
OUTDOORAND CINEMARADIOMAGAZINENEWSPAPERINTERNETTV
0% 100%80%60%40%20%
2016
2015
2014
2013
2012 38.8%
38.6%
38.3%
37.5%
36.9%
19.0%
21.7%
24.6%
27.9%
30.7%
15.5%
13.8%
12.1%
10.6%
9.4%
11.2% 10.4% 5.2%
10.5%
9.8%
9.1%
8.5%
10.2%
10.0%
9.6%
9.2%
5.2%
5.2%
5.2%
5.3%
Share of U.S. ad spending by mediumThe internet in 2012 passed newspapers to become the nation’s second-biggest ad medium,behind TV, according to ZenithOptimedia.
Internet’s share of U.S. ad spendingZenithOptimedia expects the internet to account for nearly one-fourth (24.6%)of U.S. ad spending in 2014 and 30.7% in 2016, up from 6.0% in 2005.
0
10
20
30%
201620152014201320122011201020092008200720062005
30.7%
annual2014 v38.qxp 12/17/2013 12:32 PM Page 16


ADVERTISING AGE DECEMBER 30, 2013 • 21
MARKETING FACT PACK 2014
Source: ComScore, September 2013. More info: comscore.com.
15 largest U.S. multiplatform web propertiesBy September 2013 unique visitors in thousands.
ESTIMATED REVENUE FROM MOBILE COMPANY 2013 2012 % CHG
Apple (iAd) $258 $124 108.1
Facebook 1,532 391 291.8
Google 3,984 2,171 83.5
Millennial Media 109 61 78.7
Pandora 372 238 56.3
Twitter 312 114 173.7
YP 378 252 50.0
Others 2,654 1,012 162.3
Total $9,599 $4,363 120.0
Source: eMarketer, December 2013. More info: emarketer.com.
U.S. net mobile ad revenueFor selected companies. Dollars in millions.
TOTAL UNIQUE VIDEOSRANK PROPERTY VIEWERS (000) VIEWED (000)
1 Google sites 164,819 16,595,857
2 Facebook 70,055 1,365,771
3 AOL 62,273 1,276,425
4 NDN 50,555 603,047
5 Vevo 49,608 650,227
6 Amazon sites 44,287 191,849
7 Yahoo sites 42,334 357,063
8 Microsoft sites 38,895 697,377
9 Vimeo 32,851 131,600
10 Maker Studios 30,475 517,104
Source: ComScore, October 2013. More info: comscore.com.
Largest U.S. onlinevideo properties
DESKTOP/TOTAL DIGITAL MOBILE DESKTOP MOBILE
RANK PROPERTY POPULATION DESKTOP MOBILE ONLY ONLY OVERLAP
1 Google sites 228,196 204,098 119,803 24,098 108,393 95,705
2 Yahoo sites 222,584 198,051 111,408 24,533 111,176 86,875
3 Microsoft sites 192,014 175,896 66,285 16,118 125,729 50,167
4 Facebook 182,144 144,454 110,451 37,691 71,693 72,761
5 Amazon sites 162,579 119,681 90,366 42,898 72,213 47,468
6 AOL sites 156,144 132,766 71,038 23,378 85,105 47,661
7 Apple sites 130,515 77,760 75,768 52,755 54,747 23,014
8 CBS Interactive 118,027 91,645 57,022 26,382 61,004 30,640
9 Wikimedia Foundation sites 116,835 84,666 60,396 32,169 56,439 28,227
10 Glam Media 116,146 90,297 49,627 25,850 66,519 23,778
11 Turner Digital 109,537 83,324 53,995 26,213 55,542 27,782
12 eBay 93,884 68,971 50,783 24,913 43,101 25,870
13 Ask Network 90,092 70,943 31,429 19,149 58,662 12,281
14 About 84,169 59,327 36,044 24,842 48,126 11,202
15 Weather Co. 83,447 52,322 46,226 31,125 37,221 15,101
Total digital audience 241,759 225,271 146,807 16,487 94,952 130,320
annual2014 v38.qxp 12/17/2013 11:40 AM Page 21
ADVERTISING AGE20 • DECEMBER 30, 2013
MARKETING FACT PACK 2014
Time spent using mediaIn 2013, time spent using digital media overtook time spent watching TV.
AVERAGE MINUTES PER DAY
MEDIUM 2008 2009 2010 2011 2012 2013
TV 254 267 264 274 278 271
Print 63 55 50 44 38 32
Newspaper 38 33 30 26 22 18
Magazine 25 22 20 18 16 14
Radio 102 98 96 94 92 86
Other media 37 35 45 37 18 7
Video game (excluding game-console internet) 8 11 12 13 11 8
Digital 164 177 191 229 273 316
Online 131 140 142 153 147 139
Online video 3 3 6 13 24 25
Online social network 8 16 25 35 39 40
Other online 120 121 111 105 84 74
Mobile 19 20 24 48 95 141
Feature phone 17 15 13 14 11 11
Mobile internet 5 5 5 6 5 5
Smartphone 3 5 10 22 43 67
Mobile internet 1 3 6 17 35 54
Mobile social network 0 0 1 4 10 19
Mobile video 0 0 0 2 4 8
Tablet 0 0 1 12 40 63
Mobile internet 0 0 1 6 24 43
Mobile social network 0 0 0 1 5 12
Mobile video 0 0 0 1 4 12
Other digital (including game-console internet 14 17 26 28 31 36and connected set-top boxes)
Total media minutes 620 632 646 678 699 712
Source: eMarketer, July 2013. More info: emarketer.com. Time spent with each medium includes all time spent with that medium, regardless of multitasking.For example, one hour of multitasking online while watching TV is counted as one hour of TV and one hour of online. See more time-use data on Pages 31-33.
annual2014 v38.qxp 12/17/2013 11:35 AM Page 20

ADVERTISING AGE DECEMBER 30, 2013 • 23
MARKETING FACT PACK 2014
TOTAL MEASURED TOTAL MEASUREDADVERTISING PAGES AD SPENDING
RANK MAGAZINE, COMPANY 2012 2011 % CHG 2012 2011 % CHG
1 People Time Warner (Time Inc.) 1 3,155.50 3,356.93 -6.0 $993.3 $996.8 -0.4
2 InStyle Time Warner (Time Inc.) 1 2,683.26 2,544.92 5.4 435.2 389.8 11.6
3 Vogue Advance Publications (Condé Nast) 2,602.08 2,509.66 3.7 422.6 389.6 8.5
4 Elle Hearst Corp. 2,454.76 2,314.75 6.0 367.0 331.1 10.9
5 New York Magazine New York Media 2,441.25 2,607.95 -6.4 198.0 203.6 -2.7
6 Brides Advance Publications (Condé Nast) 2,335.82 2,603.44 -10.3 207.6 222.4 -6.7
7 Flex American Media 2,283.01 2,050.75 11.3 32.4 29.4 10.5
8 New York Times Magazine The New York Times Co. 2,132.17 2,203.76 -3.2 249.3 258.8 -3.7
9 Texas Monthly Emmis Communications Corp. 1,943.15 1,813.15 7.2 75.0 69.9 7.4
10 Harper’s Bazaar Hearst Corp. 1,840.19 1,656.31 11.1 234.6 201.4 16.5
Source: MPA - The Association of Magazine Media; Publishers Information Bureau. More info: magazine.org.1. Time Warner plans to spin off Time Inc. as separate public company in 2014.
10 largest U.S. magazinesBy 2012 total U.S. ad pages from Publishers Information Bureau.Measured magazine ad spending in millions of dollars from PIB.
Paper trail: Newspaper sales and spinoffsAs the embattled newspaper industry continues to grapple with competition from digital-mediarivals, major-media companies are selling or spinning off papers. Selected deals involving majornewspapers in 2013:
Source: company filings and disclosures, Ad Age DataCenter research.
NEWS CORP.21st Century Fox (formerly oldNews Corp.) in June 2013spun off publishing and someother operations into newNews Corp. The company’snewspaper holdings includeThe Wall Street Journaland the New York Post.21st Century Fox is focusedon global entertainment andmedia including cable TV,broadcast TV and movies.
TRIBUNE CO.Tribune Co. in July 2013announced its intent to spinoff its newspaper business,Tribune Publishing, as astandalone public company.Tribune Publishing’s propertiesinclude the Chicago Tribuneand the Los Angeles Times.Tribune Co., which emergedfrom Chapter 11 bankruptcyreorganization in December2012, will focus on a growingportfolio of local TV stationsand other holdings.
WASHINGTON POSTAmazon CEO Jeff Bezos inOctober 2013 paid $250 millionto acquire The WashingtonPost from Graham HoldingsCo. (formerly The WashingtonPost Co.) Graham Holdings’businesses include educationservices (Kaplan), local TVstations, cable systems andonline magazine Slate.The Post is part of Mr. Bezos’private investment firm,Nash Holdings.
BOSTON GLOBE The New York Times Co.in October 2013 sold itsNew England Media Group,including The Boston Globe,for about $70 million toJohn Henry, principal ownerof the Boston Red Sox. The New York Times Co.bought the Globe andaffiliated properties in 1993for $1.1 billion.
annual2014 v38.qxp 12/17/2013 11:40 AM Page 23
ADVERTISING AGE22 • DECEMBER 30, 2013
MARKETING FACT PACK 2014
Largest U.S. TV networksBy 2012 measured ad spending. Dollars in millions.
BROADCAST TVMEASURED AD SPENDING ON EACH NETWORK
RANK NETWORK, COMPANY 2012 2011 % CHG
1 CBS CBS Corp. $6,448 $6,260 3.0
2 NBC Comcast Corp. (NBC Universal) 6,157 4,198 46.7
3 Fox 21st Century Fox 4,944 5,166 -4.3
4 ABC Walt Disney Co. 4,927 4,923 0.1
5 Univision Broadcasting Media Partners (Univision Communications) 2,877 2,181 31.9
6 Telemundo Comcast Corp. (NBC Universal) 973 915 6.3
7 CW CBS Corp. 50%/Time Warner 50% 497 542 -8.3
8 UniMas (formerly TeleFutura) Broadcasting Media Partners (Univision Communications) 447 512 -12.6
CABLE TVMEASURED AD SPENDING ON EACH NETWORK
RANK NETWORK, COMPANY 2012 2011 % CHG
1 ESPN Walt Disney Co. $2,290 $2,063 11.0
2 TNT Time Warner (Turner Broadcasting System) 1,428 1,345 6.2
3 TBS Time Warner (Turner Broadcasting System) 1,165 1,050 11.0
4 USA Comcast Corp. (NBC Universal) 1,015 1,174 -13.6
5 MTV Viacom 866 900 -3.7
6 Comedy Central Viacom 813 746 8.9
7 Nickelodeon 1 Viacom 769 959 -19.7
8 Bravo Comcast Corp. (NBC Universal) 742 693 7.0
9 Discovery Channel Discovery Communications 662 640 3.5
10 HGTV Scripps Networks Interactive 660 637 3.6
Source: Kantar Media. More info: kantarmediana.com. 1. Excludes Nick at Nite.
Top TV programs by average number of viewers age 2+
Super Bowl on CBS: Top individual telecast, 2013 todate (108.7 million viewers)
NBC Sunday NightFootball:Top prime-time broadcast program watched live plussame-day viewing: (21.7 million viewers) 1
NCIS on CBS: Top prime-time broadcast regularly scheduled program(non-sports) watched live plussame-day viewing (14.7 millionviewers) 1
Source: Nielsen. More info: nielsen.com. Photos via CBS, NBC and FX.1. Dec. 31, 2012, to Dec. 8, 2013. Broadcast prime. Ranked on persons 2+ rating.2. Dec. 31, 2012, to Nov. 24, 2013. Among all prime-time broadcast and cable programs.
The Bridge on FX:Top time-shifted program of 2013(164.3% lift in viewership whenfactoring in time-shifted viewing) 2
annual2014 v38.qxp 12/17/2013 11:40 AM Page 22
ADVERTISING AGE24 • DECEMBER 30, 2013
MARKETING FACT PACK 2014
7 PM
8 PM
9 PM
SUND
AY
10 PM
8 PM
9 PM
10 PM
MON
DAY
8 PM
9 PM
10 PM
TUES
DAY
8 PM
9 PM
10 PMWED
NESD
AY
AMERICA’S FUNNIEST HOME VIDEOS $63,129
ONCE UPON A TIME $173,062
REVENGE $114,002
BETRAYAL $105,447RESURRECTION $138,022
DANCING WITH THE STARS $106,342
LUCKY 7, $82,746CANCELED
THE GOLDBERGS $108,180
TROPHY WIFE $80,634
THE MIDDLE $120,983
NASHVILLE $107,591
MODERN FAMILY $281,951
60 MINUTES $104,190
THE AMAZING RACE $101,522
THE GOOD WIFE $70,446
THE MENTALIST $74,330
NCIS $160,264
PERSON OF INTEREST $136,710
NCIS LA $121,699
SURVIVOR $120,822
CSI $113,628
CRIMINAL MINDS $119,052
FOOTBALL NIGHT IN AMERICA NA
SUNDAY NIGHT FOOTBALL $593,694
9 PM BELIEVE $77,678
9:30 PM CRISIS $90,433
THE VOICE $294,038
THE BLACKLIST $201,650
THE BIGGEST LOSER $91,672
CHICAGO FIRE $130,963
REVOLUTION $87,188
IRONSIDE, $78,097CANCELED
LAW & ORDER: SVU $73,477
THE SIMPSONS $231,532
FAMILY GUY $206,551
AMERICAN DAD $144,642
BONES $159,932ALMOST HUMANLF $145,613
SLEEPY HOLLOW $137,610THE FOLLOWING $211,832
DADS $148,188
NEW GIRL $236,857
THE MINDY PROJECT $117,987
THE X FACTOR $179,034AMERICAN IDOL $355,943
HART OF DIXIE $27,691
THE ORIGINALS $39,406
SUPERNATURAL $39,410
ARROW $47,859
THE TOMORROW PEOPLE $40,807
HIMYM1 $165,999
HOSTAGES $133,185INTELLIGENCE $129,422
MIKE & MOLLY NA
MOM $139,070
BEAUTY & THE BEAST $21,817
THE VOICE $278,9879 PM ABOUT A BOY $146,2039:30 PM THE FAMILY GUIDE $125,900
MARVEL’S AGENTSOF S.H.I.E.L.D. $151,305
BLANK SPACEINDICATES
NO NETWORKPROGRAMMING
CASTLE $124,050
2 BROKE GIRLS $175,506
BACK IN THE GAME $94,213
SUPER FUN NIGHT $127,848
BROOKLYN NINE-NINE $146,697
BOB’S BURGERS $135,733
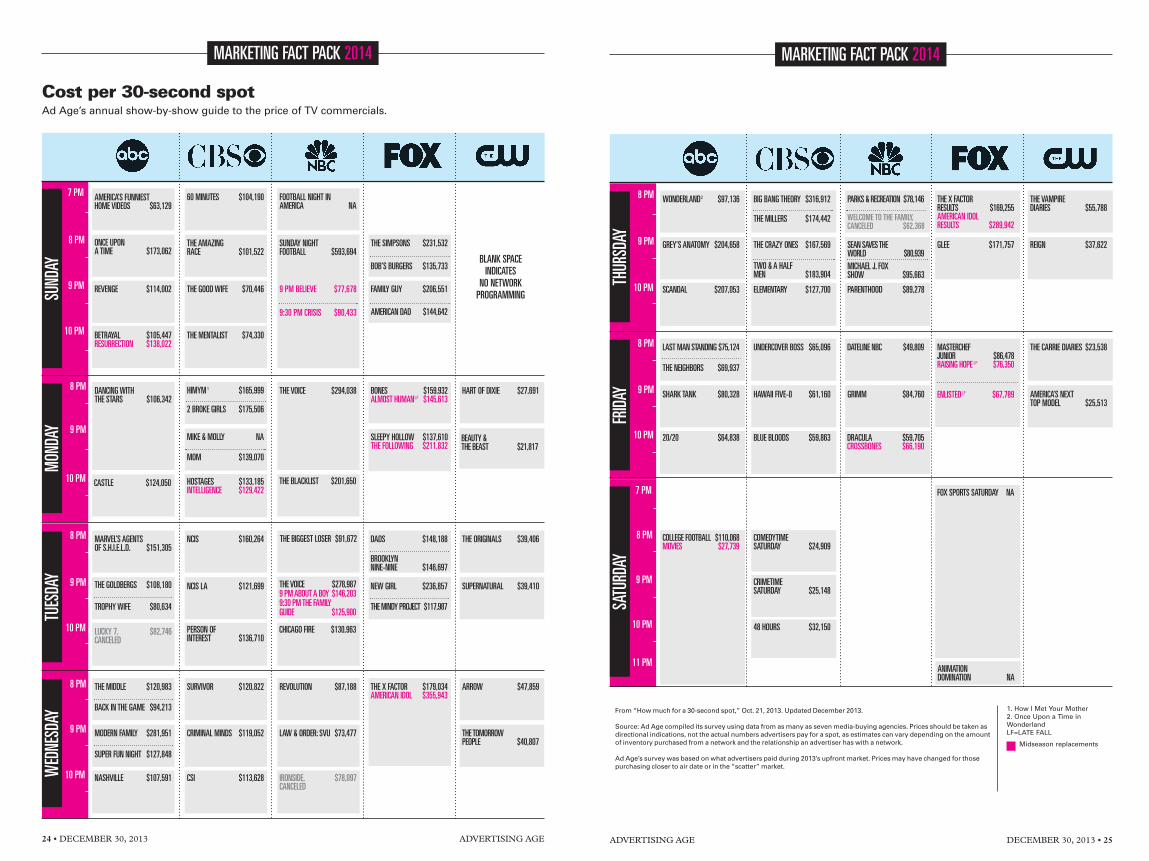
Cost per 30-second spotAd Age’s annual show-by-show guide to the price of TV commercials.
annual2014 v38.qxp 12/17/2013 11:41 AM Page 24
ADVERTISING AGE DECEMBER 30, 2013 • 25
MARKETING FACT PACK 2014
From “How much for a 30-second spot,” Oct. 21, 2013. Updated December 2013.
Source: Ad Age compiled its survey using data from as many as seven media-buying agencies. Prices should be taken asdirectional indications, not the actual numbers advertisers pay for a spot, as estimates can vary depending on the amountof inventory purchased from a network and the relationship an advertiser has with a network.
Ad Age’s survey was based on what advertisers paid during 2013’s upfront market. Prices may have changed for thosepurchasing closer to air date or in the “scatter” market.
1. How I Met Your Mother2. Once Upon a Time inWonderlandLF=LATE FALL
8 PM
9 PM
10 PMTHUR
SDAY
8 PM
9 PM
10 PM
FRIDA
Y
WONDERLAND2 $97,136
SCANDAL $207,053
GREY’S ANATOMY $204,658
20/20 $64,838
SHARK TANK $80,328
COLLEGE FOOTBALL $110,068MOVIES $27,739
BIG BANG THEORY $316,912
ELEMENTARY $127,700
THE CRAZY ONES $167,569
TWO & A HALF MEN $183,904
UNDERCOVER BOSS $65,096
BLUE BLOODS $59,863
HAWAII FIVE-0 $61,160
COMEDYTIME SATURDAY $24,909
48 HOURS $32,150
CRIMETIME SATURDAY $25,148
PARKS & RECREATION $78,146
PARENTHOOD $89,278
SEAN SAVES THE WORLD $80,939MICHAEL J. FOX SHOW $95,663
DATELINE NBC $49,809
DRACULA $59,705CROSSBONES $66,190
GRIMM $84,760
THE X FACTOR RESULTS $169,255AMERICAN IDOL RESULTS $289,942
GLEE $171,757
MASTERCHEFJUNIOR $86,478RAISING HOPE LF $76,350
ENLISTEDLF $67,789
FOX SPORTS SATURDAY NA
ANIMATION DOMINATION NA
THE VAMPIRE DIARIES $55,788
REIGN $37,622
THE CARRIE DIARIES $23,538
AMERICA’S NEXT TOP MODEL $25,513
LAST MAN STANDING $75,124
THE NEIGHBORS $69,937
7 PM
8 PM
9 PM
SATU
RDAY
10 PM
11 PM
THE MILLERS $174,442 WELCOME TO THE FAMILY,CANCELED $62,368
Midseason replacements
annual2014 v38.qxp 12/17/2013 11:41 AM Page 25
ADVERTISING AGE DECEMBER 30, 2013 • 27
MARKETING FACT PACK 2014
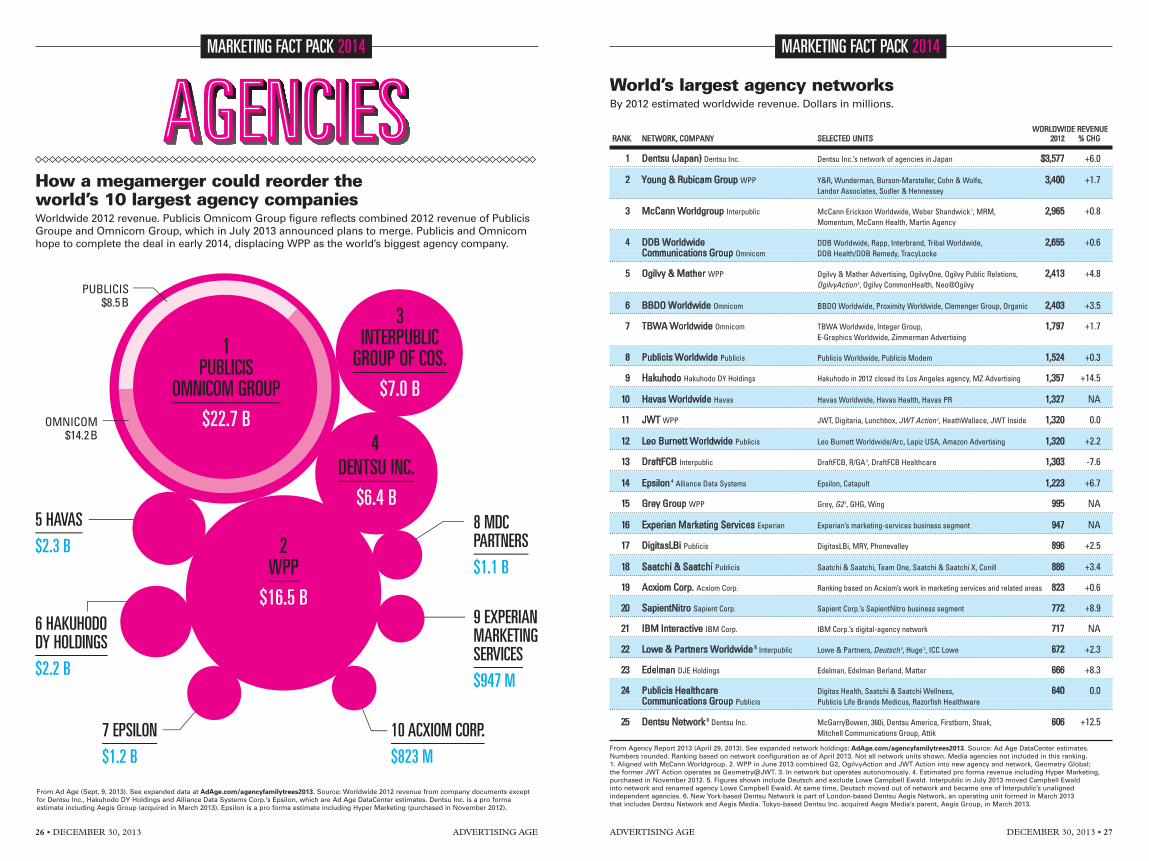
World’s largest agency networksBy 2012 estimated worldwide revenue. Dollars in millions.
WORLDWIDE REVENUERANK NETWORK, COMPANY SELECTED UNITS 2012 % CHG
1 Dentsu (Japan) Dentsu Inc. Dentsu Inc.’s network of agencies in Japan $3,577 +6.0
2 Young & Rubicam Group WPP Y&R, Wunderman, Burson-Marsteller, Cohn & Wolfe, 3,400 +1.7Landor Associates, Sudler & Hennessey
3 McCann Worldgroup Interpublic McCann Erickson Worldwide, Weber Shandwick 1, MRM, 2,965 +0.8Momentum, McCann Health, Martin Agency
4 DDB Worldwide DDB Worldwide, Rapp, Interbrand, Tribal Worldwide, 2,655 +0.6Communications Group Omnicom DDB Health/DDB Remedy, TracyLocke
5 Ogilvy & Mather WPP Ogilvy & Mather Advertising, OgilvyOne, Ogilvy Public Relations, 2,413 +4.8OgilvyAction 2, Ogilvy CommonHealth, Neo@Ogilvy
6 BBDO Worldwide Omnicom BBDO Worldwide, Proximity Worldwide, Clemenger Group, Organic 2,403 +3.5
7 TBWA Worldwide Omnicom TBWA Worldwide, Integer Group, 1,797 +1.7E-Graphics Worldwide, Zimmerman Advertising
8 Publicis Worldwide Publicis Publicis Worldwide, Publicis Modem 1,524 +0.3
9 Hakuhodo Hakuhodo DY Holdings Hakuhodo in 2012 closed its Los Angeles agency, MZ Advertising 1,357 +14.5
10 Havas Worldwide Havas Havas Worldwide, Havas Health, Havas PR 1,327 NA
11 JWT WPP JWT, Digitaria, Lunchbox, JWT Action 2, HeathWallace, JWT Inside 1,320 0.0
12 Leo Burnett Worldwide Publicis Leo Burnett Worldwide/Arc, Lapiz USA, Amazon Advertising 1,320 +2.2
13 DraftFCB Interpublic DraftFCB, R/GA 3, DraftFCB Healthcare 1,303 -7.6
14 Epsilon 4 Alliance Data Systems Epsilon, Catapult 1,223 +6.7
15 Grey Group WPP Grey, G2 2, GHG, Wing 995 NA
16 Experian Marketing Services Experian Experian’s marketing-services business segment 947 NA
17 DigitasLBi Publicis DigitasLBi, MRY, Phonevalley 896 +2.5
18 Saatchi & Saatchi Publicis Saatchi & Saatchi, Team One, Saatchi & Saatchi X, Conill 886 +3.4
19 Acxiom Corp. Acxiom Corp. Ranking based on Acxiom’s work in marketing services and related areas 823 +0.6
20 SapientNitro Sapient Corp. Sapient Corp.’s SapientNitro business segment 772 +8.9
21 IBM Interactive IBM Corp. IBM Corp.’s digital-agency network 717 NA
22 Lowe & Partners Worldwide 5 Interpublic Lowe & Partners, Deutsch 5, Huge 3, ICC Lowe 672 +2.3
23 Edelman DJE Holdings Edelman, Edelman Berland, Matter 666 +8.3
24 Publicis Healthcare Digitas Health, Saatchi & Saatchi Wellness, 640 0.0Communications Group Publicis Publicis Life Brands Medicus, Razorfish Healthware
25 Dentsu Network 6 Dentsu Inc. McGarryBowen, 360i, Dentsu America, Firstborn, Steak, 606 +12.5Mitchell Communications Group, Attik
From Agency Report 2013 (April 29, 2013). See expanded network holdings: AdAge.com/agencyfamilytrees2013. Source: Ad Age DataCenter estimates.Numbers rounded. Ranking based on network configuration as of April 2013. Not all network units shown. Media agencies not included in this ranking.1. Aligned with McCann Worldgroup. 2. WPP in June 2013 combined G2, OgilvyAction and JWT Action into new agency and network, Geometry Global;the former JWT Action operates as Geometry@JWT. 3. In network but operates autonomously. 4. Estimated pro forma revenue including Hyper Marketing,purchased in November 2012. 5. Figures shown include Deutsch and exclude Lowe Campbell Ewald. Interpublic in July 2013 moved Campbell Ewaldinto network and renamed agency Lowe Campbell Ewald. At same time, Deutsch moved out of network and became one of Interpublic’s unalignedindependent agencies. 6. New York-based Dentsu Network is part of London-based Dentsu Aegis Network, an operating unit formed in March 2013that includes Dentsu Network and Aegis Media. Tokyo-based Dentsu Inc. acquired Aegis Media’s parent, Aegis Group, in March 2013.
annual2014 v38.qxp 12/17/2013 11:41 AM Page 27
1PUBLICIS
OMNICOM GROUP
$22.7 B
2WPP
$16.5 B
3INTERPUBLIC
GROUP OF COS.
$7.0 B
4DENTSU INC.
$6.4 B5 HAVAS
$2.3 B
6 HAKUHODODY HOLDINGS
$2.2 B
7 EPSILON
$1.2 B
8 MDCPARTNERS
$1.1 B
9 EXPERIANMARKETINGSERVICES
$947 M
10 ACXIOM CORP.
$823 M
PUBLICIS$8.5B
OMNICOM$14.2B
ADVERTISING AGE26 • DECEMBER 30, 2013
MARKETING FACT PACK 2014
From Ad Age (Sept. 9, 2013). See expanded data at AdAge.com/agencyfamilytrees2013. Source: Worldwide 2012 revenue from company documents exceptfor Dentsu Inc., Hakuhodo DY Holdings and Alliance Data Systems Corp.’s Epsilon, which are Ad Age DataCenter estimates. Dentsu Inc. is a pro formaestimate including Aegis Group (acquired in March 2013). Epsilon is a pro forma estimate including Hyper Marketing (purchased in November 2012).
How a megamerger could reorder the world’s 10 largest agency companiesWorldwide 2012 revenue. Publicis Omnicom Group figure reflects combined 2012 revenue of PublicisGroupe and Omnicom Group, which in July 2013 announced plans to merge. Publicis and Omnicomhope to complete the deal in early 2014, displacing WPP as the world’s biggest agency company.
annual2014 v38.qxp 12/17/2013 11:41 AM Page 26

ADVERTISING AGE DECEMBER 30, 2013 • 29
MARKETING FACT PACK 2014
Largest U.S. agency ventures by categoryBy 2012 estimated U.S. revenue.
U.S. 2012 REVENUE U.S. 2012 REVENUE TOTALCATEGORY / LARGEST VENTURE, PARENT IN CATEGORY % CHG FOR CATEGORY 1 % CHG
AGENCY COMPANY 50 LARGEST AGENCY COMPANIES
Omnicom Group $7.4 billion +4.5% $29.9 billion +5.3%
AGENCY NETWORK 25 LARGEST AGENCY NETWORKS
McCann Worldgroup Interpublic Group of Cos. $1.6 billion +0.5 $15.3 billion +3.4
AGENCIES FROM ALL DISCIPLINES 2 926 AGENCIES FROM ALL DISCIPLINES 2
Epsilon 3 Alliance Data Systems Corp. $1.1 billion +7.3 $35.6 billion +5.6
ADVERTISING AGENCY 538 UNITS WITH AD-AGENCY REVENUE
BBDO Worldwide Omnicom $541 million +9.3 $11.0 billion +4.8
MEDIA AGENCY 270 UNITS WITH MEDIA-SERVICES REVENUE
Starcom USA Publicis $358 million +2.5 $3.3 billion +7.4
DIGITAL-AGENCY NETWORK UNITS IN REPORT WITH DIGITAL REVENUE
SapientNitro Sapient Corp. $497 million +10.3 $11.6 billion +6.9
SEARCH MARKETING 233 UNITS WITH SEARCH-MARKETING REVENUE
iCrossing Hearst Corp. $110 million +4.8 $1.0 billion +7.8
MOBILE MARKETING 231 UNITS WITH MOBILE-MARKETING REVENUE
Wunderman WPP (Y&R) $52 million +121.3 $855 million +34.8
CRM/DIRECT AGENCY NETWORK 222 UNITS WITH CRM/DIRECT-MARKETING REVENUE
Epsilon 4 Alliance Data Systems Corp. $1.2 billion +7.3 $6.6 billion +3.6
PUBLIC-RELATIONS AGENCY NETWORK 241 UNITS WITH PUBLIC-RELATIONS REVENUE
Edelman DJE Holdings $406 million +6.0 $3.9 billion +5.6
HEALTH-CARE AGENCY NETWORK 202 UNITS WITH HEALTH-CARE REVENUE
Publicis Healthcare Comms. Group Publicis $505 million 0.0 $3.6 billion +2.1
PROMOTION AGENCY 236 UNITS WITH PROMOTION REVENUE
Integer Group Omnicom (TBWA) $166 million +11.0 $2.9 billion +9.2
EXPERIENTIAL/EVENT-MARKETING AGENCY 163 UNITS WITH EXPERIENTAL/EVENT REVENUE
George P. Johnson Project WorldWide $149 million +1.9 $1.2 billion +11.5
HISPANIC-AMERICAN 107 UNITS WITH HISPANIC-AMERICAN REVENUE
GlobalHue $33 million -3.1 $598 million +6.6
AFRICAN-AMERICAN 48 UNITS WITH AFRICAN-AMERICAN REVENUE
GlobalHue $31 million +1.0 $184 million +6.4
ASIAN-AMERICAN 35 UNITS WITH ASIAN-AMERICAN REVENUE
AdAsia Communications $17 million NA $126 million +7.5
From Agency Report 2013 (April 29, 2013). See expanded rankings: AdAge.com/agencyreport2013. Source: Ad Age DataCenter estimates.
1. Unit count in this column shows number of units (agencies) with U.S. revenue in this discipline in Agency Report 2013.2. All Disciplines ranking of 926 agencies from all disciplines in Agency Report 2013.3. Epsilon U.S. agency revenue. 4. Epsilon U.S. network CRM/direct revenue.
annual2014 v38.qxp 12/17/2013 11:42 AM Page 29
ADVERTISING AGE28 • DECEMBER 30, 2013
MARKETING FACT PACK 2014
Largest worldwide agency ventures by categoryBy 2012 estimated worldwide revenue.
WORLDWIDE 2012 REVENUE WORLDWIDE 2012 REVENUE TOTALCATEGORY / LARGEST VENTURE, PARENT IN CATEGORY % CHG FOR CATEGORY % CHG
AGENCY COMPANY 50 LARGEST AGENCY COMPANIES
WPP $16.5 billion +2.5% $72.1 billion +4.5%
AGENCY NETWORK 25 LARGEST AGENCY NETWORKS
Dentsu (Japan) Dentsu Inc. $3.6 billion +6.0 $37.2 billion +3.0
DIGITAL-AGENCY NETWORK 15 LARGEST DIGITAL-AGENCY NETWORKS
Wunderman WPP (Y&R) $1.1 billion +3.4 $9.0 billion +6.2
ADVERTISING AGENCY 10 LARGEST ADVERTISING AGENCIES
Dentsu Dentsu Inc. $2.7 billion +6.0 $13.8 billion +3.0
MEDIA-AGENCY NETWORK 10 LARGEST MEDIA-AGENCY NETWORKS
Starcom MediaVest Group Publicis $1.1 billion +4.1 $8.1 billion +6.2
CRM/DIRECT AGENCY NETWORK 10 LARGEST CRM/DIRECT AGENCY NETWORKS
Epsilon Alliance Data Systems Corp. $1.2 billion +6.7 $7.4 billion +4.2
PUBLIC-RELATIONS AGENCY NETWORK 10 LARGEST PUBLIC-RELATIONS AGENCY NETWORKS
Edelman DJE Holdings $666 million +8.3 $4.2 billion +3.9
From Agency Report 2013 (April 29, 2013). See expanded rankings: AdAge.com/agencyreport2013. Source: Ad Age DataCenter estimates.
U.S. agency revenue growth, 2001-2012Annual growth rates from Agency Reports.
-10
0
10%
201220112010200920082007200620052004200320022001
5.6%
7.9%7.7%
-7.5%
3.7%
8.6%8.8%7.2%
8.6%
4.8%
-0.6%-3.3%
Source: Ad Age Agency Reports. See more: AdAge.com/agencyreport2013.
Agency Reports' annual growth rates based on U.S. agencies from all disciplines. 2001, 2008 and 2009 were recession years.
annual2014 v38.qxp 12/17/2013 11:42 AM Page 28

ADVERTISING AGE DECEMBER 30, 2013 • 31
MARKETING FACT PACK 2014
How Americans use leisure timeAmericans age 15+ on average had 5.4 hours of leisure time per day in 2012. Watching TV is by farthe nation’s No. 1 leisure activity.
1. Including travel related to leisure and sports activities. Source: Bureau of Labor Statistics’ 2012 American Time Use Survey. More info: bls.gov/tus.
AVERAGE LEISURE HOURS AVERAGE WEEKDAY LEISURE HOURS SPENT ON...
Playing games Participating in Other leisureWeekends, Socializing and and computer sports, exercise Relaxing/ and sports
Age All days Weekdays holidays Watching TV communicating use for leisure Reading and recreation thinking activities 1
15-19 5.9 5.3 7.3 2.0 0.8 0.8 0.1 0.7 0.2 0.720-24 5.6 5.2 6.4 2.1 1.0 0.9 0.2 0.3 0.2 0.525-34 4.4 3.8 5.8 2.1 0.5 0.4 0.1 0.3 0.2 0.335-44 4.3 3.6 5.9 2.0 0.5 0.3 0.2 0.2 0.2 0.245-54 4.8 4.2 6.3 2.4 0.5 0.3 0.3 0.2 0.3 0.355-64 5.6 5.0 6.9 2.9 0.5 0.3 0.4 0.2 0.3 0.465-74 7.1 6.9 7.5 3.9 0.8 0.4 0.6 0.4 0.4 0.475+ 7.7 7.5 8.0 4.3 0.7 0.4 0.9 0.3 0.6 0.415+ 5.4 4.9 6.6 2.6 0.6 0.4 0.3 0.3 0.3 0.4Men 5.8 5.2 7.3 2.7 0.6 0.5 0.3 0.4 0.3 0.4Women 5.0 4.6 5.9 2.5 0.6 0.3 0.4 0.3 0.2 0.3
40,000
$60,000
50,000
20122011201020092008200720062005200420032002200120001999
RECESSION YEAR RECESSION YEARS
-0.2%
2.5%
-0.7%-3.6%-2.2%
LOWEST 20% SECOND THIRD FOURTH TOP 20%
1970
1980
1990
2000
2007
2012
43.3%
44.1%
46.6%
49.8%
49.7%
51.0%
10.8%
10.2%
9.6%
8.9%
8.7%
8.3%
24.5%
24.7%
24.0%
23.0%
23.4%
23.0%
17.4%
16.8%
15.9%
14.8%
14.8%
14.4%
-12
0%
TOP 20%FOURTHTHIRDSECONDLOWEST
20%ALL
HOUSEHOLDS
$71,274
$11,490$29,696
$51,179$82,098
$181,905
Income distribution amonghouseholds rich to poor Share of aggregate income received by differenthousehold-income quintiles. The richest 20% ofhouseholds collected 51.0% of income in 2012.
Median household incomeMedian household income in inflation-adjusted 2012 dollars. Real household income has fallen for thepast five years. It peaked in 1999. Circles show percent change vs. previous year.
Mean (average) income forhouseholds rich to poorMean income for household-income quintilesin 2012 and percent change vs. pre-recession 2007.The poorer the household, the sharper the drop.
Source: Census Bureau’s Current Population Survey (Annual Social and Economic Supplements). More info: census.gov.
annual2014 v38.qxp 12/17/2013 11:42 AM Page 31
ADVERTISING AGE30 • DECEMBER 30, 2013
MARKETING FACT PACK 2014
Two or moreraces 7.8
Native Hawaiian/Pacific Islander0.7
Asian 16.3
American Indian/Alaska Native3.9
Black41.6
White246.1
Totalpopulation
316.4
0
10
20
30%
Total70+60-6950-5940-4930-3920-2910-190-9
54.5 M
9.4 M
10.5 M
9.2 M 8.5 M
7.1 M
5.0 M2.8 M
2.1 M
Age:
Circles show number of Hispanics.U.S. total: 54.5 million
20
0
40
60
80
100
2013201220112010200920082007
RECESSION
82.585.1
Source: Thomson Reuters/University of Michigan Index of Consumer Sentiment. December 2013 (82.5) is preliminary reading.More info: http://www.sca.isr.umich.edu.
Source: Census Bureau. Projections for July 2013 from national projections released in December 2012. Numbers rounded. More info: census.gov.
2013 U.S. population by racePopulation in millions.
Hispanic population by ageHispanics as percentage of U.S. population.Hispanics account for more than one-fifth ofthe U.S. population for every age up to 39.
Index of consumer sentimentThe Thomson Reuters/University of Michigan index rebounded in December 2013 as consumers voicedmore confidence about the economic outlook. Consumer confidence had slumped in fall 2013 amid thefederal government’s shutdown. The index (82.5) is close to the six-year high hit in July 2013 (85.1).
annual2014 v38.qxp 12/17/2013 11:42 AM Page 30

ADVERTISING AGE DECEMBER 30, 2013 • 33
MARKETING FACT PACK 2014
Time consumers spend with various devices and mediaWhat adults do when they’re left to their devices. Average time spent by users over seven days.
Source: Experian Marketing Services’ Simmons Connect. Results based onadult survey participants who answered question (and so results excludenon-responses), spring 2013. More info: experian.com/simmons-connect.
Source: Experian Marketing Services’ Simmons Connect. Adult tabletowners who did these activities over a seven-day period, spring 2013.More info: experian.com/simmons-connect.
Most popular activities on tabletsSurfing the web is the most common activityamong adult tablet owners.
Hours:Minutes
MAGAZINES
2:24
NEWS-PAPERS
2:26
MP3
5:23
RADIO
6:38
E-READER
6:38
GAMECONSOLE
6:51
TABLET
7:44
MOBILEPHONE
7:50
PCAT HOME
8:53
PCAT WORK
11:40
TV
27:08 Nearly one in six adult viewers watch more than 40 hours of TV a week Adult tablet owners on
average use their tablets a little more than one hour a day
0% 20 40 60 80 100
Play games
Listen to radio
Watch videos on computer
IM/chat on computer
Visit websiteson mobile phone
Read magazine/comic book
Email on computer
Text on mobile phone
Visit websites on computer
Talk on mobile phone
VERYOFTEN
OFTEN SOMEWHATOFTEN
NOT VERYOFTEN
NOTAT ALL
How TV viewers are multitaskingPercentage of adults who do these activities whilewatching TV. About two-thirds of TV viewers talkor text on a mobile phone or surf the web on acomputer.
Source: Experian Marketing Services’ Simmons Connect. Amount of time spent over a seven-day period, spring 2013, for adults who own this deviceor use this medium. More info: experian.com/simmons-connect.
% of tablet Activity owners doing this
Visit websites 84.3%
Email 71.5%
Download app 64.1%
Play games 56.3%
Social network/blog 54.6%
Watch downloaded/streamed video 36.4%
Text/picture/video message 18.9%
Camera 17.1%
Listen to music 16.3%
GPS 12.4%
Read newspapers 10.3%
IM/chat 5.4%
annual2014 v38.qxp 12/17/2013 12:33 PM Page 33
ADVERTISING AGE32 • DECEMBER 30, 2013
MARKETING FACT PACK 2014
Most popular activities on smartphonesTalk barely tops messaging as the most common activity among adult smartphone owners.
12
6
9 3
1
5
11
7
2
48
10
Email: 57.2%Any use: 95.9%
Talk: 75.3%Listen to music: 9.5%
Social network/blog: 44.9%Play games: 30.5%
Messaging: 76.2%
IM/chat: 8.5%
Download apps: 16.6%
GPS: 12.6%Watch downloaded/ streamed video: 11%
Visit websites: 48.4%Camera: 19.7%
Source: Experian Marketing Services’ Simmons Connect. Adult smartphone owners who did these activities over a seven-day period, spring 2013.More info: experian.com/simmons-connect.
Source: Experian Marketing Services’ Simmons Connect. Adult smartphone users, spring 2013. More info: experian.com/simmons-connect.1. Percentages indicate unduplicated aggregate percentage of smartphone owners who engage in the activity in that hour at least once during a typical week.For example, 57% of smartphone owners email at 2 p.m. at least once in a week; looking at specific days, 20% of smartphone owners email at 2 p.m. on atypical Monday, Tuesday and Friday, 21% at 2 p.m. Wednesday and Friday, 16% at 2 p.m. Saturday and 15% at 2 p.m. Sunday.
Read newspapersIM/chat
Listen to musicWatch downloaded/streamed video
17.2%18.1%
31.7%39.2%
GPSPlay games
Camera
41.8%52.6%
56.9%Download app
Social network/blogEmail
65.0%66.7%
83.0%Visit websites 89.1%
Text/picture/video message 92.7%Talk 93.2%
When and how smartphone owners use their devicesMore than three-fourths of adultsmartphone owners message around5 p.m. at least once during a typicalweek. Clock shows peak time (all p.m.)for each activity and percentage ofsmartphone users who do the activityin that hour. 1 Low point for allsmartphone activities: 3 a.m.
annual2014 v38.qxp 12/17/2013 11:43 AM Page 32
0
0.5
1.0
1.5 M
INTERNET MEDIA1
MEDIA JOBS (TV, RADIO, NEWSPAPER, MAGAZINE)2
ADVERTISING/MARKETING-SERVICES JOBS3
AD-AGENCY JOBS
MEDIA (INCLUDINGINTERNET MEDIA)
744,400
ADVERTISING/MARKETING SERVICES
(INCLUDING AD AGENCIES)757,200
2013201220112010200920082007
RECESSION
ADVERTISING AGE34 • DECEMBER 30, 2013
MARKETING FACT PACK 2014
2
4
6
8
10%
2013201220112010200920082007
RECESSION
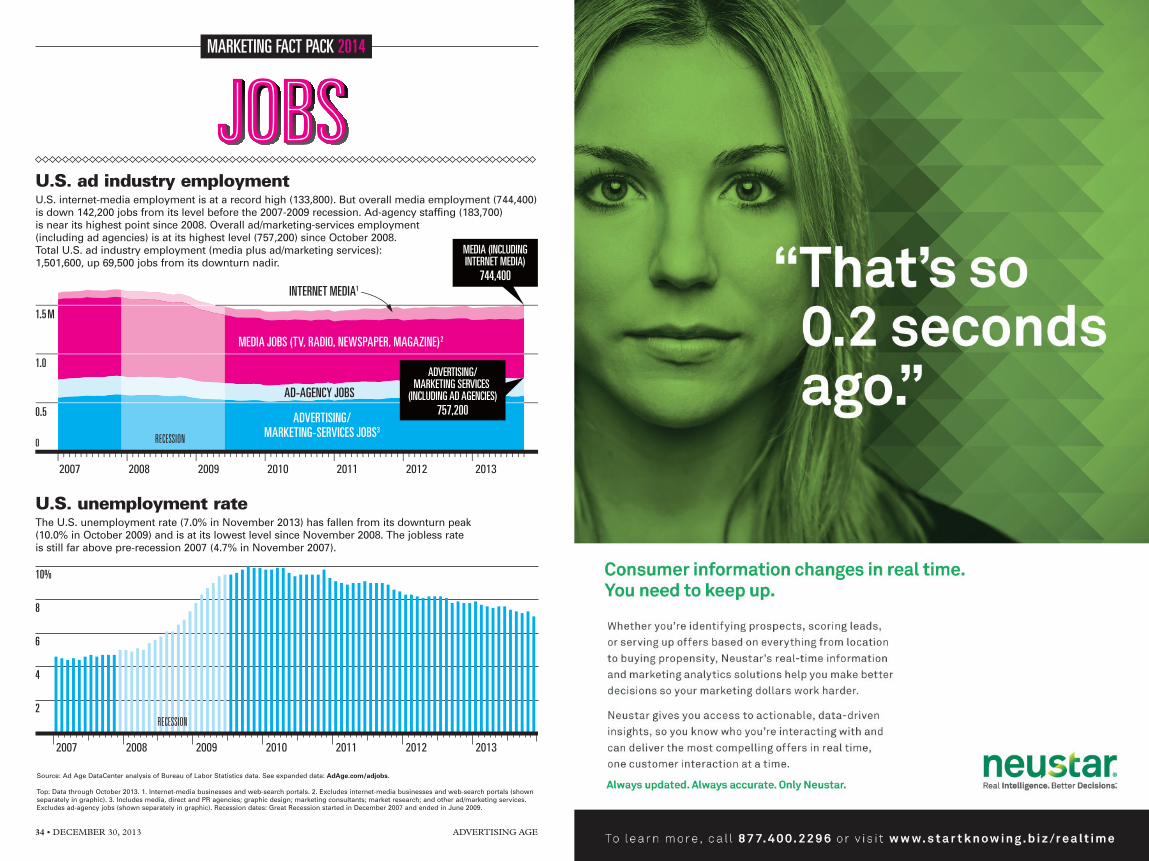
Source: Ad Age DataCenter analysis of Bureau of Labor Statistics data. See expanded data: AdAge.com/adjobs.
Top: Data through October 2013. 1. Internet-media businesses and web-search portals. 2. Excludes internet-media businesses and web-search portals (shownseparately in graphic). 3. Includes media, direct and PR agencies; graphic design; marketing consultants; market research; and other ad/marketing services.Excludes ad-agency jobs (shown separately in graphic). Recession dates: Great Recession started in December 2007 and ended in June 2009.
U.S. unemployment rateThe U.S. unemployment rate (7.0% in November 2013) has fallen from its downturn peak(10.0% in October 2009) and is at its lowest level since November 2008. The jobless rateis still far above pre-recession 2007 (4.7% in November 2007).
U.S. ad industry employmentU.S. internet-media employment is at a record high (133,800). But overall media employment (744,400)is down 142,200 jobs from its level before the 2007-2009 recession. Ad-agency staffing (183,700)is near its highest point since 2008. Overall ad/marketing-services employment(including ad agencies) is at its highest level (757,200) since October 2008.Total U.S. ad industry employment (media plus ad/marketing services):1,501,600, up 69,500 jobs from its downturn nadir.
annual2014 v38.qxp 12/17/2013 11:44 AM Page 34
