marketing math help
TRANSCRIPT

8/12/2019 Marketing Math Help
http://slidepdf.com/reader/full/marketing-math-help 1/30
This document is a revision by Professors David Bell, Jagmohan Raju, Christophe Van den Bulte, and Gal Zauberman, The
Wharton School, University of Pennsylvania, of previous notes developed by MKTG 621 Instructors at The Wharton School,
University of Pennsylvania.
Marketing Math Essentials
1. Introduction ............................................................................................................ 2
2. When to Use Which Calculations and Why .......................................................... 5
3. Margin Analysis ..................................................................................................... 9
4. Break-Even Analysis............................................................................................10
5. Chain Models of Segment Value .........................................................................19
6. Customer Lifetime Value (CLV) .........................................................................21
7. Economic Value to the Customer (EVC) ............................................................26
8. Weighted Cost-Per-Thousand (wCPM) ...............................................................29
8/12/2019 Marketing Math Help
http://slidepdf.com/reader/full/marketing-math-help 2/30
Marketing Math Essentials – 08/11/09
THE WHARTON SCHOOL OF THE U NIVER SITY OF PENNSYLVANIA 2
SECTION 1: INTRODUCTION
This note provides definitions, formulas, and examples for some key quantitative analyses inmarketing planning. These analyses are widely used in business, and, as a result, there isconsiderable variety in the terminology and equations being used. This note provides a common
core of materials that we can all rely on in the marketing core course and beyond. Your goalshould not be to memorize this material, but to understand the logic and concepts behind thecalculations. With practice, many of these analyses will become common sense to you.
Although quantitative analysis and modeling in marketing can be very sophisticated, in their day-to-day work, managers mainly use simple arithmetic. So, the ideas and techniques that follow areessentials, both in the sense of being foundational and of being simple. Yet, actually applyingthese ideas is not always straightforward because of three challenges: (i) gathering relevant andreliable data, (ii) knowing when to use which calculation and why, and (iii) knowing what toconclude from the results.
Inputs for Calculations
Mindful of the Garbage In, Garbage Out (GIGO) problem, good analysts and managers arealways mindful of the quality of the inputs in their quantitative calculations analyses. When itcomes to issues of validity and reliability, one can distinguish four types of inputs:
Hard numbers
Company/Industry averages
Educated guesses
Wishful thinking
When analyzing a marketing situation, you should look for data inputs in the order given above.
Hard Numbers
These inputs are costs, margins, market shares, size of customer bases, and other data that arereliably measured. Other hard numbers can result from a combination of marketing research,econometric modeling, and managerial judgment. An example is an estimate of price elasticityobtained from a well-crafted test market that has been validated by other methods, and isconsistent with industry and the firm’s experience.
Even hard data must be carefully scrutinized. Cost and margin data, for instance, are affected by
how indirect costs are allocated across products and business lines. Market research must beapproached with a critical eye as well. For example, market resear ch may report that ―40 percent
of our consumers are satisfied.‖ That information can be considered hard in that it comes fromquantitative market research based on a representative sample. But what does that numberactually mean? Satisfied compared to what? Satisfied with what? Did the researchers and thecustomers define satisfaction in the same way? As an example, 40 percent of the customers maysay they were satisfied with their last US Airways flight, but what they were really indicatingwas that the flight was miserable —just no more or less so than flights on other airlines. ―I’m
8/12/2019 Marketing Math Help
http://slidepdf.com/reader/full/marketing-math-help 3/30
Marketing Math Essentials – 08/11/09
THE WHARTON SCHOOL OF THE U NIVER SITY OF PENNSYLVANIA 3
satisfied because my expectations are so low, and nobody’s any better.‖ A very different
percentage would have been obtained if the question was asked differently, and satisfaction wasdefined in terms of what customers desired to have on an ideal flight. As another example, amarket research report may tabulate survey results showing ―50 percent loyalty for our brand of
shampoo.‖ We don’t know how the term loyalty was defined and measured, or who was in the
sample used in the survey. In such cases, the data should be taken at face value but with somecaution. It is useful to think about whether the ―50 percent loyalty‖ passes the sniff test— does itseem reasonable in your experience? For instance, if a store was out of stock for the brand ofshampoo, would people you know and who you think are somewhat representative spend one-half hour searching for that brand or just buy another brand that was in stock?
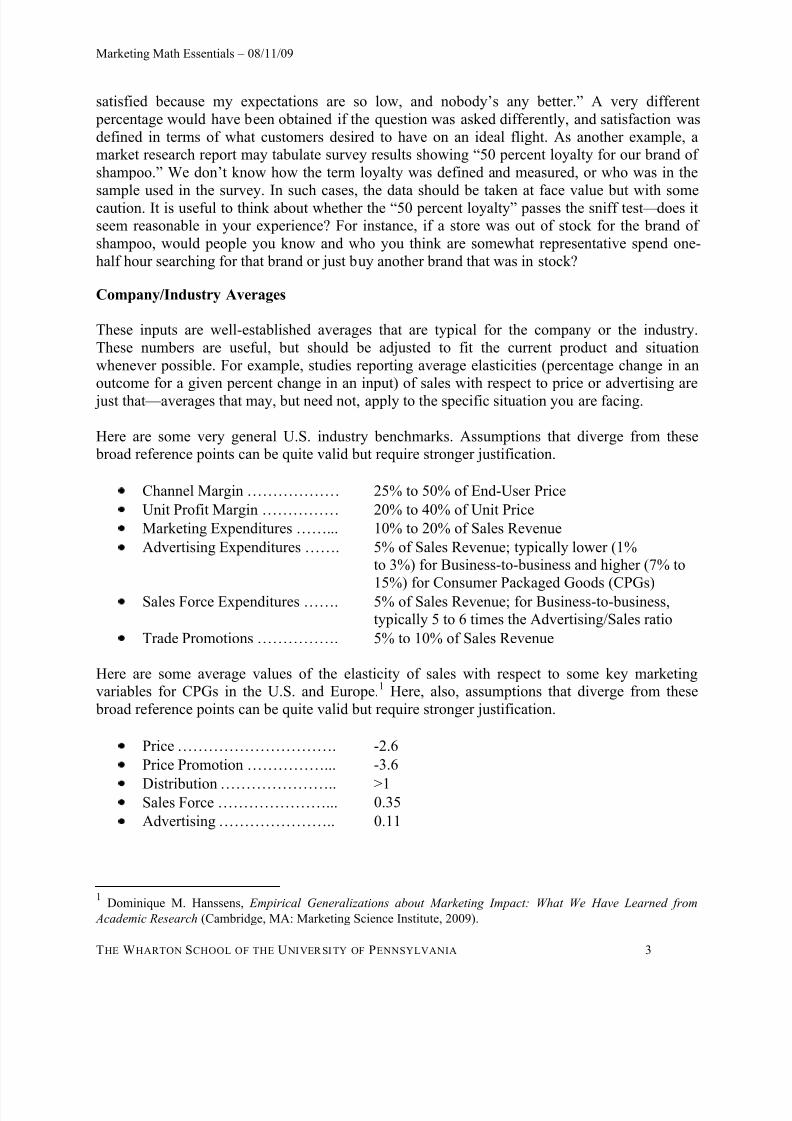
Company/Industry Averages
These inputs are well-established averages that are typical for the company or the industry.These numbers are useful, but should be adjusted to fit the current product and situationwhenever possible. For example, studies reporting average elasticities (percentage change in anoutcome for a given percent change in an input) of sales with respect to price or advertising are just that — averages that may, but need not, apply to the specific situation you are facing.
Here are some very general U.S. industry benchmarks. Assumptions that diverge from these broad reference points can be quite valid but require stronger justification.
Channel Margin ……………… 25% to 50% of End-User Price
Unit Profit Margin …………… 20% to 40% of Unit Price
Marketing Expenditures ……... 10% to 20% of Sales Revenue
Advertising Expenditures ……. 5% of Sales Revenue; typically lower (1%to 3%) for Business-to-business and higher (7% to
15%) for Consumer Packaged Goods (CPGs)Sales Force Expenditures ……. 5% of Sales Revenue; for Business-to-business,typically 5 to 6 times the Advertising/Sales ratio
Trade Promotions ……………. 5% to 10% of Sales Revenue
Here are some average values of the elasticity of sales with respect to some key marketingvariables for CPGs in the U.S. and Europe.1 Here, also, assumptions that diverge from these broad reference points can be quite valid but require stronger justification.
Price …………………………. -2.6
Price Promotion ……………... -3.6
Distribution ………………….. >1Sales Force …………………... 0.35
Advertising ………………….. 0.11
1 Dominique M. Hanssens, Empirical Generalizations about Marketing Impact: What We Have Learned from
Academic Research (Cambridge, MA: Marketing Science Institute, 2009).
8/12/2019 Marketing Math Help
http://slidepdf.com/reader/full/marketing-math-help 4/30
Marketing Math Essentials – 08/11/09
THE WHARTON SCHOOL OF THE U NIVER SITY OF PENNSYLVANIA 4
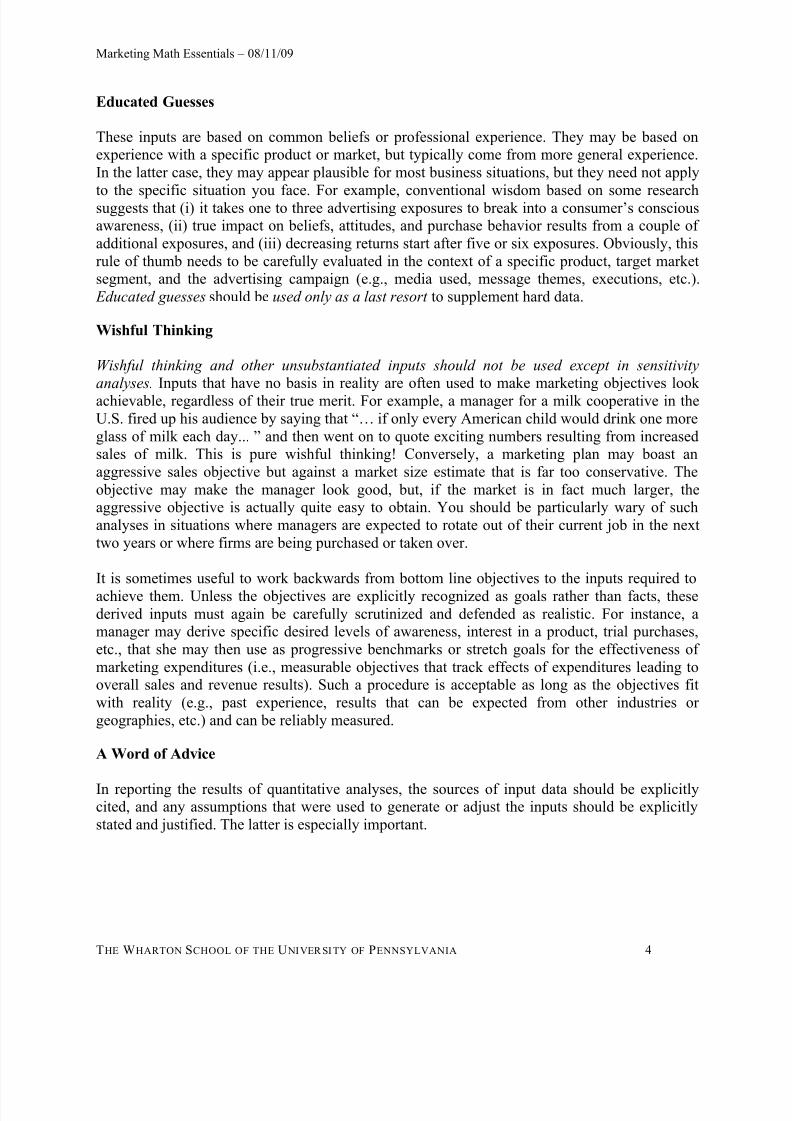
Educated Guesses
These inputs are based on common beliefs or professional experience. They may be based onexperience with a specific product or market, but typically come from more general experience.In the latter case, they may appear plausible for most business situations, but they need not apply
to the specific situation you face. For example, conventional wisdom based on some researchsuggests that (i) it takes one to three advertising exposures to break into a consumer’s consciousawareness, (ii) true impact on beliefs, attitudes, and purchase behavior results from a couple ofadditional exposures, and (iii) decreasing returns start after five or six exposures. Obviously, thisrule of thumb needs to be carefully evaluated in the context of a specific product, target marketsegment, and the advertising campaign (e.g., media used, message themes, executions, etc.). Educated guesses should be used only as a last resort to supplement hard data.
Wishful Thinking
Wishful thinking and other unsubstantiated inputs should not be used except in sensitivity
analyses. Inputs that have no basis in reality are often used to make marketing objectives lookachievable, regardless of their true merit. For example, a manager for a milk cooperative in theU.S. fired u p his audience by saying that ―… if only every American child would drink one moreglass of milk each day... ‖ and then went on to quote exciting numbers resulting from increasedsales of milk. This is pure wishful thinking! Conversely, a marketing plan may boast anaggressive sales objective but against a market size estimate that is far too conservative. Theobjective may make the manager look good, but, if the market is in fact much larger, theaggressive objective is actually quite easy to obtain. You should be particularly wary of suchanalyses in situations where managers are expected to rotate out of their current job in the nexttwo years or where firms are being purchased or taken over.
It is sometimes useful to work backwards from bottom line objectives to the inputs required toachieve them. Unless the objectives are explicitly recognized as goals rather than facts, thesederived inputs must again be carefully scrutinized and defended as realistic. For instance, amanager may derive specific desired levels of awareness, interest in a product, trial purchases,etc., that she may then use as progressive benchmarks or stretch goals for the effectiveness ofmarketing expenditures (i.e., measurable objectives that track effects of expenditures leading tooverall sales and revenue results). Such a procedure is acceptable as long as the objectives fitwith reality (e.g., past experience, results that can be expected from other industries orgeographies, etc.) and can be reliably measured.
A Word of Advice
In reporting the results of quantitative analyses, the sources of input data should be explicitlycited, and any assumptions that were used to generate or adjust the inputs should be explicitlystated and justified. The latter is especially important.

8/12/2019 Marketing Math Help
http://slidepdf.com/reader/full/marketing-math-help 5/30
Marketing Math Essentials – 08/11/09
THE WHARTON SCHOOL OF THE U NIVER SITY OF PENNSYLVANIA 5
SECTION 2: WHEN TO USE WHICH CALCULATIONS AND WHY
This note describes six types of calculations: margin analysis, break-even analysis, chain modelsof segment value, customer lifetime value, economic value to the customer, and weighted cost-
per-thousand. This section describes briefly when each type of calculation is useful.
Margin Analysis
When?
Always.
Why?
To locate the profit pools in the product line and understand the incentives of competitors andcollaborators.
A margin analysis simply tracks prices, variable costs, and profit margins through the valuechain for every relevant product within the firm's product line and across competitors. Knowingyour own margins provides inputs for break-even analyses, calculations of segment value,Customer Lifetime Value (CLV), and Economic Value to the Customer (EVC). Knowing profitmargins for channel members and competitors helps predict their responses to actions the firmmay take. For example, channel partners often provide a great deal of marketing effort in supportof high margin products. When channel margins are not aligned with the firm’s margins across
the product line, conflict can arise because the products that are most profitable for the firm arenot the same as the most profitable products for the reseller. Similarly, knowing the profitmargins of competing products helps predict how much marketing support they will receive andhow much room there is for their price to be cut.
Total Break-Even Unit Volume (TBEV)
When?
When proposing or evaluating a marketing plan.
Why?
To assess whether a plan is profitable given its expected sales volume.
Total break-even analysis is most useful when good estimates of sales volume are not available, but managers feel comfortable assessing whether a particular sales volume is attainable or not. Itis especially valued by entrepreneurs and new venture managers facing great uncertainty aboutdemand.
8/12/2019 Marketing Math Help
http://slidepdf.com/reader/full/marketing-math-help 6/30
Marketing Math Essentials – 08/11/09
THE WHARTON SCHOOL OF THE U NIVER SITY OF PENNSYLVANIA 6
Incremental Break-Even Unit Volume (IBEV)
When?
When considering a marketing action or change in policy.
Why?
To show that the action will generate sales and margins that are sufficient to cover the cost of theaction.
The objective is to calculate the number of units that must be sold for a new marketing action ora change in policy to be profitable. The logic is identical to that of a total break-even analysis.The only difference is that the focus is on the change in sales that is required for the action to be profit-neutral if that action entails a change in the margin and/or the fixed costs.
Break-Even Cannibalization Rate (BECR)When?
When introducing a new product into an existing product line.
Cannibalization occurs when a new product added to the product line steals sales away fromexisting products in the line.
Why?
To show that the profitability of the product line as a whole will not suffer as a result of the
proposed action.
It is necessary to know how many units of the new product must be sold by stealing market sharefrom competitors or by expanding the market in order to compensate for the cannibalization ofexisting products. The BECR is the highest acceptable cannibalization rate. Introducing the new product is supported to the extent that there is evidence that the actual cannibalization rate will be lower than the BECR.
Chain Models of Segment Value
When?
When making decisions about which market to target.
Why?
To understand the size and financial value of market segments.
8/12/2019 Marketing Math Help
http://slidepdf.com/reader/full/marketing-math-help 7/30
Marketing Math Essentials – 08/11/09
THE WHARTON SCHOOL OF THE U NIVER SITY OF PENNSYLVANIA 7
Marketers must decide what market segments to target (i.e., what customers to provide productsor services for), and how to price, promote, and distribute the offerings. Evaluating and selectingsegments is an important input for other analyses, such as planning media strategies, evaluatingchannels of distribution, and estimating the required size of a sales force.
Customer Lifetime Value (CLV)
When?
Whenever single transactions do not represent the value of customers to the firm (e.g., whenthere is a possibility for repeat business from an individual customer).
Standard analyses assume that single transactions are the unit of analysis and that eachtransaction is more or less independent of the next. However, customers often buy the same products repeatedly over time, make multiple interrelated purchases (e.g., razors and blades), andgenerate customer support and other costs that are not specifically related to any specifictransaction. CLV analysis is valuable when one or more of the following factors are present:
An initial purchase often leads to subsequent purchases with less selling effort (e.g.,repeat purchases or purchases of complementary products offered by the same firm).
The cost of acquiring a customer (generating a first purchase) is larger than the profit provided by the initial purchase.
There are customer costs that are relatively unaffected by purchase activity (i.e., retentioncosts such as billing, customer service, and salesperson contacts).
There is evidence of customer attrition (i.e., churn due to dissatisfaction, competitiveactivity, changes in customer needs, etc.).
Why?
To estimate the present value of a customer who will generate a stream of revenue and costs overa relatively long period of time.
A positive CLV means that marketing actions will more than break-even over the lifetime of thecustomer. For instance, CLV analysis answers the question: ―How much can we spend to acquire
this type of customer and remain profitable?‖ CLV analysis provides a basis for deciding whichsegments to target based on long-term rather than short-term profitability. It can also helpdetermine whether it is more profitable to acquire new customers or to better serve currentcustomers. Finally, CLV forces the manager to think about how sales are generated as well asmaintained.
Economic Value to the Customer (EVC)
When?
Whenever a major benefit of the product is to save the customer money in the long-run eventhough the initial price of the product may be higher than that of a competitor.

8/12/2019 Marketing Math Help
http://slidepdf.com/reader/full/marketing-math-help 8/30
Marketing Math Essentials – 08/11/09
THE WHARTON SCHOOL OF THE U NIVER SITY OF PENNSYLVANIA 8
The basic idea is to capture how much value the product provides to the buyer over its lifetimecompared to the value provided by competitive offerings. For example, a firm’s offering may provide cost savings in installation, personnel training, fuel consumption, maintenance andrepairs, disposal fees, etc. Like CLV, EVC requires an understanding of customer behavior overa relatively long time period.
Why?
EVC is used to determine a given customer’s willingness to pay, and to quantify economic orfinancial reasons for that customer to buy the product. The former sets a ceiling for the price, andthe latter is useful for developing messages in sales pitches, advertisements, and other marketingcommunications.
The EVC is the price at which the value of a firm’s product to the customer is exactly equal tothe value of a specific competitive product. Thus, to get the customer's business, the actual pricemust be lower than the EVC.
Weighted Cost-Per-Thousand (wCPM)
When?
Whenever different media options deliver audiences that differ in their composition (be itgeographically, demographically, or psychographically).
wCPM is particularly useful when the media are similar in format and advertising persuasiveness, but reach somewhat different audiences (e.g., the Wall Street Journal versus the Financial Times), and segmentation data is available for each media option.
Why?
To determine the cost effectiveness of each option given the firm’s market segmentation
strategy.
The simple Cost-per-Thousand (CPM) calculation reveals the costs of a media vehicle perthousand people reached with the vehicle. It adjusts the media cost for the differences inaudience size across media options. However, one needs to use the weighted Cost-per-Thousand(wCPM) to adjust the cost for reaching customer segments actually targeted by the firm.
If the media options are very similar, then the option with the lowest wCPM is usually chosen. If
the media options have significant qualitative differences that affect how customers will respond(e.g., television versus radio or news magazines versus fashion magazines), then the differencesin wCPM quantify the price premium that is being paid for those qualitative differences.

8/12/2019 Marketing Math Help
http://slidepdf.com/reader/full/marketing-math-help 9/30
Marketing Math Essentials – 08/11/09
THE WHARTON SCHOOL OF THE U NIVER SITY OF PENNSYLVANIA 9
SECTION 3: MARGIN ANALYSIS
A margin analysis is a table that tracks prices, variable costs, and profit margins through thevalue chain for every relevant product within the firm's product line and across competitors.
These margins are inputs for break-even, segment value, CLV, and EVC analyses. Knowing profit margins for channel members and competitors helps predict their response to actions thefirm may take. Definitions for the components of a margin analyses are:
Retail Price or End-User Price is the price paid by the end-user to the channel memberfrom which the product is purchased.
Wholesale Price or Manufacturer’s Unit Price is the price paid to the firm.
Channel Margin is the difference between the Retail Price that the reseller gets from theend-user and the Wholesale Price that it pays to the manufacturer.
Unit Variable Cost is the sum of all variable costs incurred by the firm that can bedirectly assigned to the product on a per unit basis.
Unit Contribution is the difference between the Unit Price and the Unit Variable Cost. Itis also called Unit Margin or Unit Profit Margin.
Example
The ZYX Company makes a product that costs $3 to produce, is sold to retailers for $5, and hasa Manufacturer's Suggested Retail Price (MSRP) of $10. The PQR Company makes a productthat costs $2.50 to produce, is sold to retailers for $4, and has a MSRP of $8. The ZYX Companyis considering the introduction of a second product. This product will have a Unit Price of $4.50,will cost $2.50 to produce, and will have a MSRP of $8.25.
ZYXProduct 1
ZYXProduct 2
PQRProduct
Retail Price (i.e., End-User Price) $10.00 $8.25 $8.00
Retailer's Unit Contribution (i.e., Channel Margin) 5.00 3.75 4.00
Manufacturer's Unit Price 5.00 4.50 4.00
Manufacturer's Unit Variable Cost 3.00 2.50 2.50
Manufacturer's Unit Contribution 2.00 2.00 1.50
Note the implications from this table. ZYX will not care whether end-users buy Product 1 orProduct 2 (in the short-run) because they make $2 per unit either way. However, the retailer willnot be excited about Product 2 because it would rather sell the PQR product than Product 2 to
customers who find Product 1 too expensive.
8/12/2019 Marketing Math Help
http://slidepdf.com/reader/full/marketing-math-help 10/30
Marketing Math Essentials – 08/11/09
THE WHARTON SCHOOL OF THE U NIVER SITY OF PENNSYLVANIA 10
SECTION 4: BREAK -EVEN ANALYSIS
Break-even analysis is probably the most commonly used quantitative concept for supportingmarketing decisions. The idea is to identify what level of sales is necessary for you to just
recover your costs and break-even profitwise. This is quite useful when good estimates of salesvolume are not available, but managers feel comfortable assessing whether a particular salesvolume is attainable or not. Hence, break-even analysis is a very simple tool to separate the potential winners from the definite losers and manage risk when developing marketing plans.
Break-even analysis is a first step in the evaluation of an action or plan — not the sole criterionfor a decision. Sometimes there are good, long-run reasons to take an action that is likely to losemoney in the short-term (e.g., to learn about customers or competitors, to signal information tocustomers and competitors, or because of social or ethical considerations). However, most of thetime a marketing plan or action should pay its own way. Ideally, of course, it should do betterthan simply break-even and generate profits.
We distinguish between two main types of break-even analysis. A total break-even analysis of amarketing plan helps you identify what minimum level of sales is necessary for the plan to be profit-neutral. An incremental break-even analysis is used when considering changing anexisting marketing strategy. It identifies the change (increment or decrement) in sales that isrequired for the action to be profit-neutral if that action entails a change in the margin and/or thefixed costs. In addition to these two main types of break-even analysis, we also consider the break-even cannibalization rate (BECR), which is an application of the general break-even logicwhen considering adding a new product into an existing product line.
Before proceeding, remember that the costs of marketing actions can be fixed (e.g., advertising
expenditures, investments in production capacity, and training and salaries for the sales force) orvariable (e.g., price cuts or changes in variable costs, such as sales commissions orimprovements in product quality).
8/12/2019 Marketing Math Help
http://slidepdf.com/reader/full/marketing-math-help 11/30
Marketing Math Essentials – 08/11/09
THE WHARTON SCHOOL OF THE U NIVER SITY OF PENNSYLVANIA 11
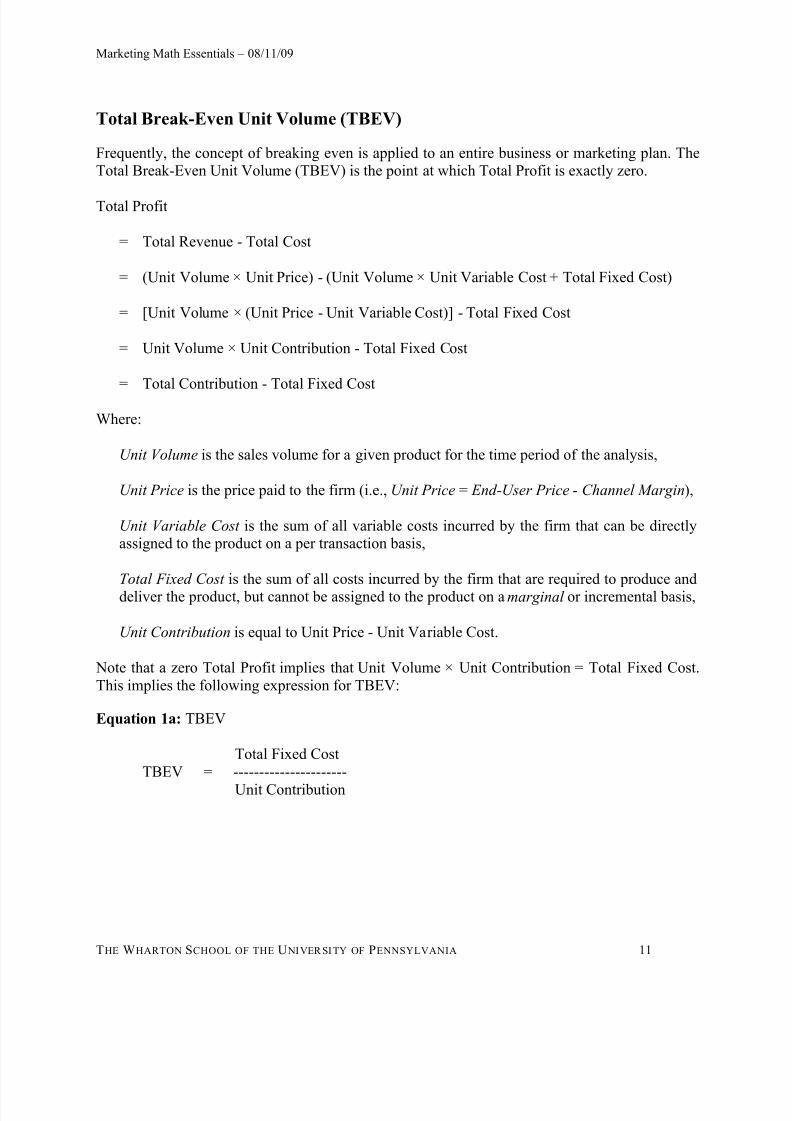
Total Break-Even Unit Volume (TBEV)
Frequently, the concept of breaking even is applied to an entire business or marketing plan. TheTotal Break-Even Unit Volume (TBEV) is the point at which Total Profit is exactly zero.
Total Profit
= Total Revenue - Total Cost
= (Unit Volume × Unit Price) - (Unit Volume × Unit Variable Cost + Total Fixed Cost)
= [Unit Volume × (Unit Price - Unit Variable Cost)] - Total Fixed Cost
= Unit Volume × Unit Contribution - Total Fixed Cost
= Total Contribution - Total Fixed Cost
Where:
Unit Volume is the sales volume for a given product for the time period of the analysis,
Unit Price is the price paid to the firm (i.e., Unit Price = End-User Price - Channel Margin),
Unit Variable Cost is the sum of all variable costs incurred by the firm that can be directlyassigned to the product on a per transaction basis,
Total Fixed Cost is the sum of all costs incurred by the firm that are required to produce anddeliver the product, but cannot be assigned to the product on a marginal or incremental basis,
Unit Contribution is equal to Unit Price - Unit Variable Cost.
Note that a zero Total Profit implies that Unit Volume × Unit Contribution = Total Fixed Cost.This implies the following expression for TBEV:
Equation 1a: TBEV
Total Fixed CostTBEV = ----------------------
Unit Contribution

8/12/2019 Marketing Math Help
http://slidepdf.com/reader/full/marketing-math-help 12/30
Marketing Math Essentials – 08/11/09
THE WHARTON SCHOOL OF THE U NIVER SITY OF PENNSYLVANIA 12
Application 1a
The ZYX Company makes a product that has a MSRP of $10. The actual street price, however,is $9 and gives retailers a $4 profit margin. The unit variable cost is $3. Fixed costs include$17,000,000 for consumer advertising, $5,000,000 for consumer promotion, $12,000,000 fortrade promotion, a $20,000,000 sales force budget, and $6,000,000 for general andadministrative expenses.
Total Fixed Cost $60,000,000TBEV = ---------------------- = --------------- = 30,000,000 units
Unit Contribution $2
Where:
Total Fixed Cost is:Advertising $17,000,000Consumer & Trade Promotion 17,000,000Sales Force 20,000,000General & Administrative 6,000,000Total Fixed Marketing Cost for Film $60,000,000,
Unit Price = End-User Price - Channel Margin = $9 - $4 = $5 and
Unit Contribution = Unit Price - Unit Variable Cost = $5 - $3 = $2.
Comment
In some cases, the fixed costs affect several products and are not allocated to each of themseparately. You then have to compute an Average Unit Price and an Average Unit Variable Cost for the entire set of products. In computing these values, it is important to use weighted averagesrather than simple averages because different products will achieve different levels of sales. Onestraightforward approach to compute the weighted average unit price is to divide total revenuefrom all products by the total number of units sold (i.e., summing across all products). Similarly,to compute the weighted average unit variable cost, total variable costs for all products can bedivided by total unit volume.
Incremental Break-Even Unit Volume (IBEV)
The incremental break-even unit volume (IBEV) is a workhorse concept in marketing analyses because it can be applied to many decisions. We present separate formulas for cases where thechange in policy generates changes in the fixed costs (e.g., advertising or sales force sizing) andfor cases where it generates a change in margins (e.g., a price decrease or an increase in salescommissions).
8/12/2019 Marketing Math Help
http://slidepdf.com/reader/full/marketing-math-help 13/30
Marketing Math Essentials – 08/11/09
THE WHARTON SCHOOL OF THE U NIVER SITY OF PENNSYLVANIA 13
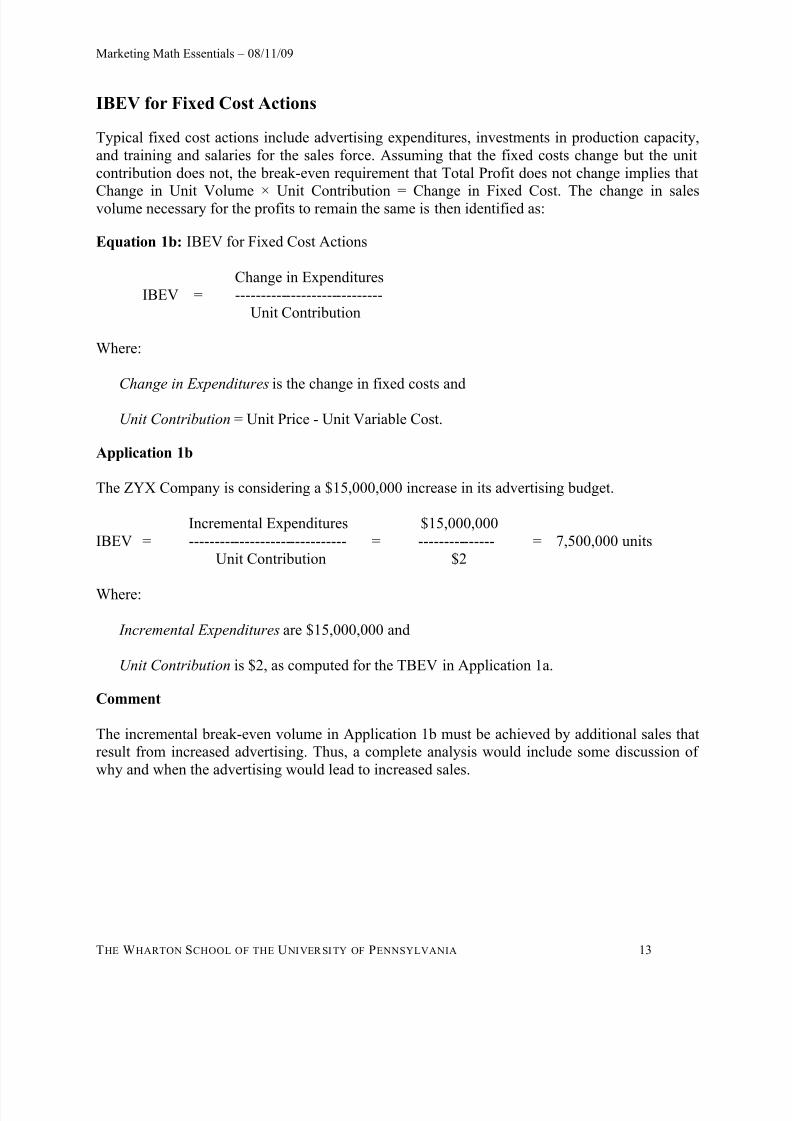
IBEV for Fixed Cost Actions
Typical fixed cost actions include advertising expenditures, investments in production capacity,and training and salaries for the sales force. Assuming that the fixed costs change but the unitcontribution does not, the break-even requirement that Total Profit does not change implies that
Change in Unit Volume × Unit Contribution = Change in Fixed Cost. The change in salesvolume necessary for the profits to remain the same is then identified as:
Equation 1b: IBEV for Fixed Cost Actions
Change in ExpendituresIBEV = -----------------------------
Unit Contribution
Where:
Change in Expenditures is the change in fixed costs and
Unit Contribution = Unit Price - Unit Variable Cost.
Application 1b
The ZYX Company is considering a $15,000,000 increase in its advertising budget.
Incremental Expenditures $15,000,000IBEV = ------------------------------- = --------------- = 7,500,000 units
Unit Contribution $2
Where:
Incremental Expenditures are $15,000,000 and
Unit Contribution is $2, as computed for the TBEV in Application 1a.
Comment
The incremental break-even volume in Application 1b must be achieved by additional sales thatresult from increased advertising. Thus, a complete analysis would include some discussion ofwhy and when the advertising would lead to increased sales.
8/12/2019 Marketing Math Help
http://slidepdf.com/reader/full/marketing-math-help 14/30
Marketing Math Essentials – 08/11/09
THE WHARTON SCHOOL OF THE U NIVER SITY OF PENNSYLVANIA 14
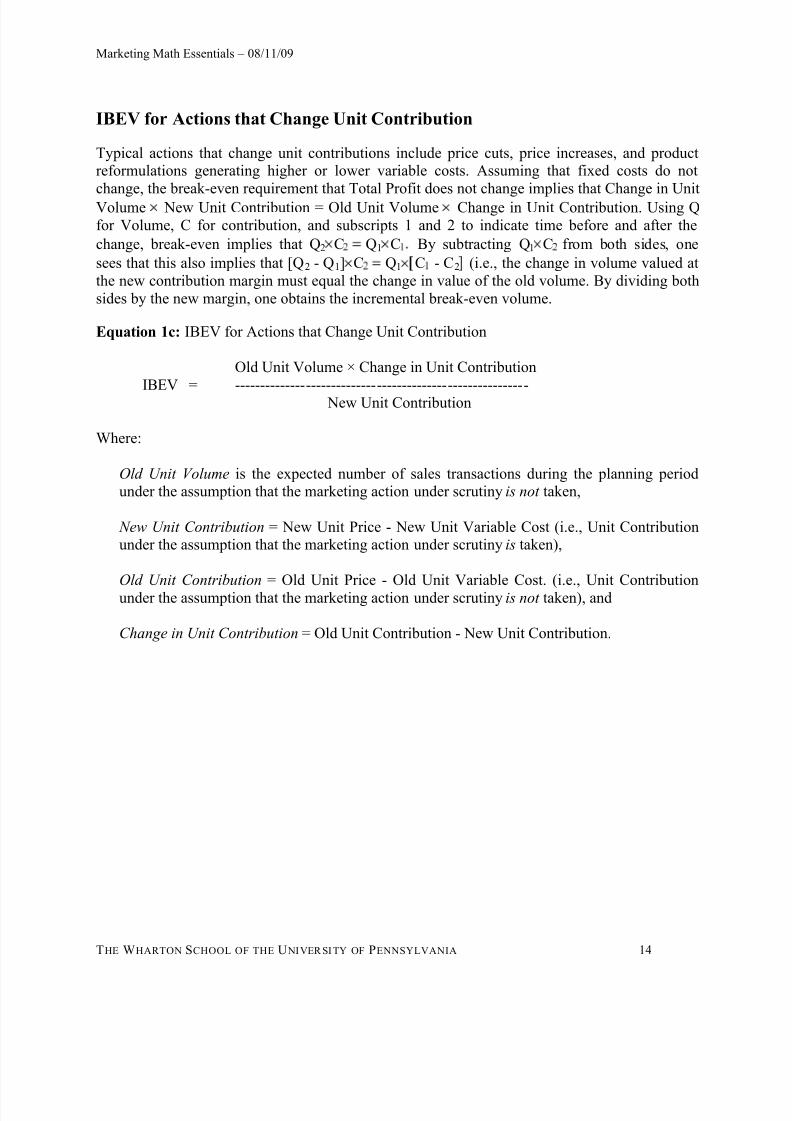
IBEV for Actions that Change Unit Contribution
Typical actions that change unit contributions include price cuts, price increases, and productreformulations generating higher or lower variable costs. Assuming that fixed costs do not
change, the break-even requirement that Total Profit does not change implies that Change in UnitVolume New Unit Contribution = Old Unit Volume Change in Unit Contribution. Using Qfor Volume, C for contribution, and subscripts 1 and 2 to indicate time before and after the
change, break-even implies that Q2 C Q1 C By subtracting Q1 C from both sides, one
sees that this also implies that [Q2 - Q1] C Q1 C - C2 (i.e., the change in volume valued atthe new contribution margin must equal the change in value of the old volume. By dividing bothsides by the new margin, one obtains the incremental break-even volume.
Equation 1c: IBEV for Actions that Change Unit Contribution
Old Unit Volume × Change in Unit Contribution
IBEV = ---------------------------------------------------------- New Unit Contribution
Where:
Old Unit Volume is the expected number of sales transactions during the planning periodunder the assumption that the marketing action under scrutiny is not taken,
New Unit Contribution = New Unit Price - New Unit Variable Cost (i.e., Unit Contributionunder the assumption that the marketing action under scrutiny is taken),
Old Unit Contribution = Old Unit Price - Old Unit Variable Cost. (i.e., Unit Contributionunder the assumption that the marketing action under scrutiny is not taken), and
Change in Unit Contribution = Old Unit Contribution - New Unit Contribution.
8/12/2019 Marketing Math Help
http://slidepdf.com/reader/full/marketing-math-help 15/30
Marketing Math Essentials – 08/11/09
THE WHARTON SCHOOL OF THE U NIVER SITY OF PENNSYLVANIA 15
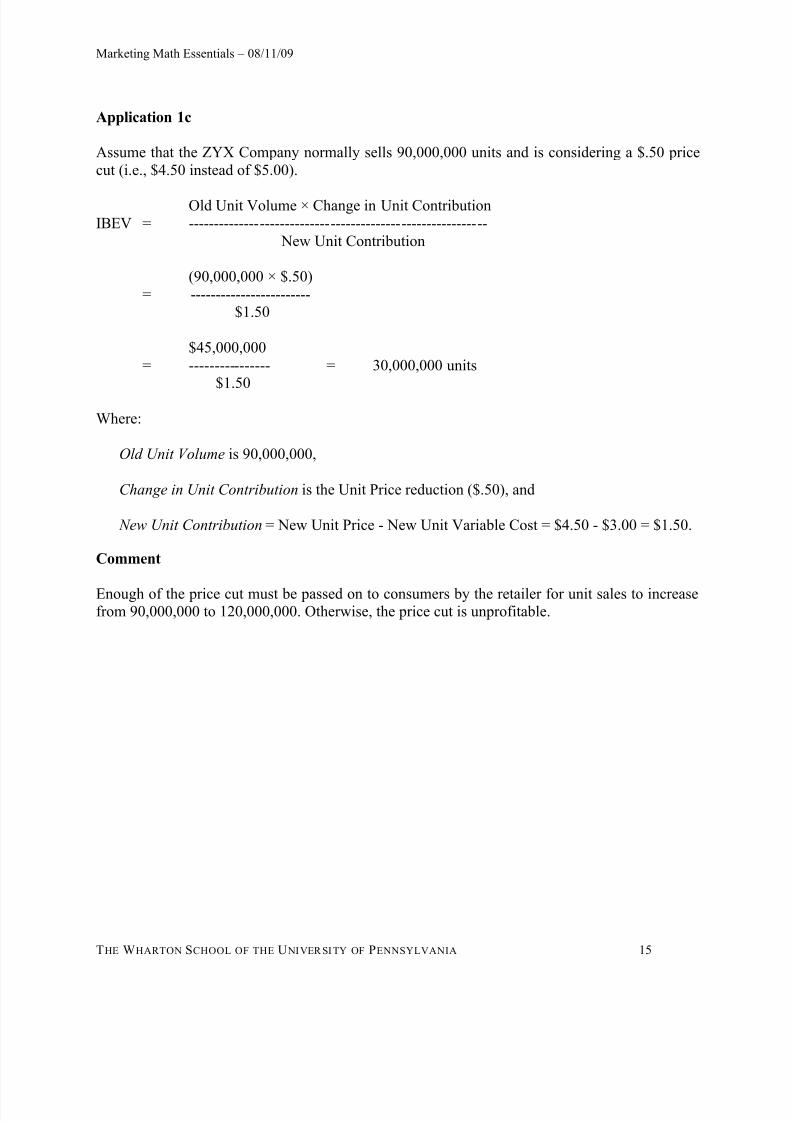
Application 1c
Assume that the ZYX Company normally sells 90,000,000 units and is considering a $.50 pricecut (i.e., $4.50 instead of $5.00).
Old Unit Volume × Change in Unit ContributionIBEV = -----------------------------------------------------------
New Unit Contribution
(90,000,000 × $.50)= ------------------------
$1.50
$45,000,000= ---------------- = 30,000,000 units
$1.50
Where:
Old Unit Volume is 90,000,000,
Change in Unit Contribution is the Unit Price reduction ($.50), and
New Unit Contribution = New Unit Price - New Unit Variable Cost = $4.50 - $3.00 = $1.50.
Comment
Enough of the price cut must be passed on to consumers by the retailer for unit sales to increasefrom 90,000,000 to 120,000,000. Otherwise, the price cut is unprofitable.
8/12/2019 Marketing Math Help
http://slidepdf.com/reader/full/marketing-math-help 16/30
Marketing Math Essentials – 08/11/09
THE WHARTON SCHOOL OF THE U NIVER SITY OF PENNSYLVANIA 16
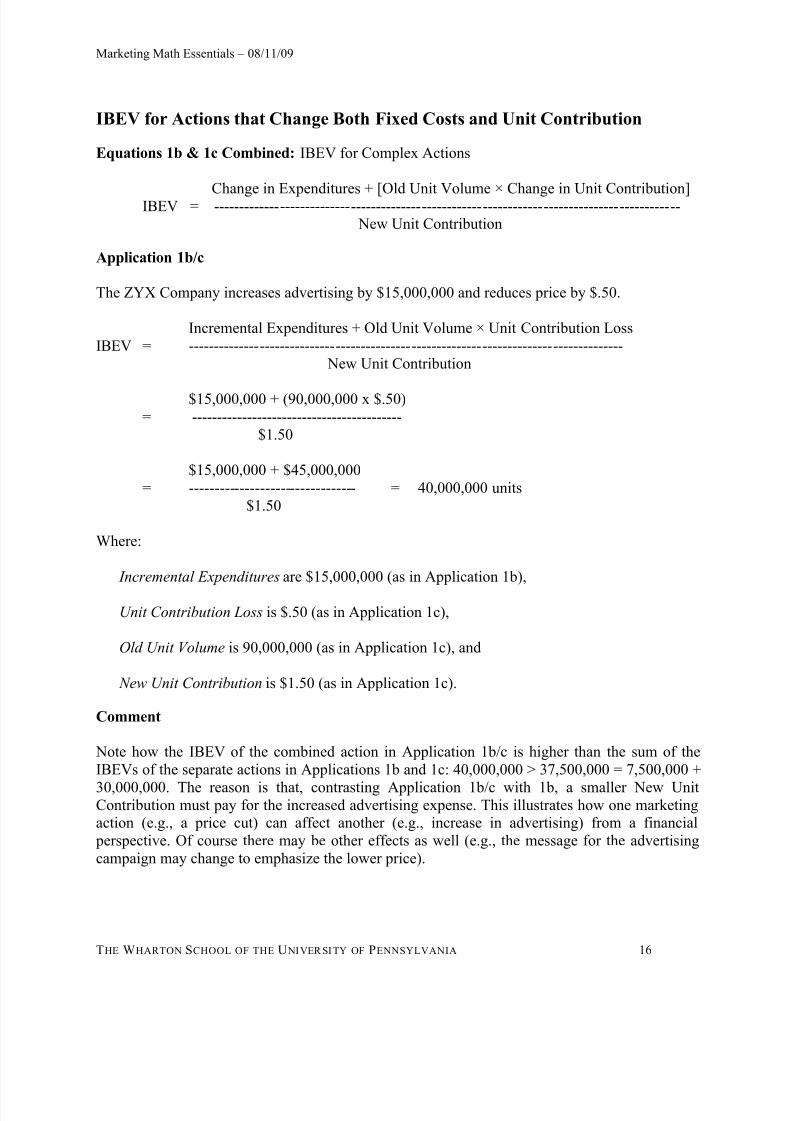
IBEV for Actions that Change Both Fixed Costs and Unit Contribution
Equations 1b & 1c Combined: IBEV for Complex Actions
Change in Expenditures + [Old Unit Volume × Change in Unit Contribution]IBEV = -------------------------------------------------------------------------------------------- New Unit Contribution
Application 1b/c
The ZYX Company increases advertising by $15,000,000 and reduces price by $.50.
Incremental Expenditures + Old Unit Volume × Unit Contribution LossIBEV = --------------------------------------------------------------------------------------
New Unit Contribution
$15,000,000 + (90,000,000 x $.50)= ------------------------------------------
$1.50
$15,000,000 + $45,000,000= --------------------------------- = 40,000,000 units
$1.50
Where:
Incremental Expenditures are $15,000,000 (as in Application 1b),
Unit Contribution Loss is $.50 (as in Application 1c),
Old Unit Volume is 90,000,000 (as in Application 1c), and
New Unit Contribution is $1.50 (as in Application 1c).
Comment
Note how the IBEV of the combined action in Application 1b/c is higher than the sum of theIBEVs of the separate actions in Applications 1b and 1c: 40,000,000 > 37,500,000 = 7,500,000 +
30,000,000. The reason is that, contrasting Application 1b/c with 1b, a smaller New UnitContribution must pay for the increased advertising expense. This illustrates how one marketingaction (e.g., a price cut) can affect another (e.g., increase in advertising) from a financial perspective. Of course there may be other effects as well (e.g., the message for the advertisingcampaign may change to emphasize the lower price).

8/12/2019 Marketing Math Help
http://slidepdf.com/reader/full/marketing-math-help 17/30
Marketing Math Essentials – 08/11/09
THE WHARTON SCHOOL OF THE U NIVER SITY OF PENNSYLVANIA 17
Break-Even Cannibalization Rate (BECR)
Whenever a marketing action for one product in the product line may steal sales away from other products in the line (rather than only from competitors' products) such cannibalization must beconsidered. The cannibalization rate is the fraction of sales of the new product that is stolen from
the old product. The equation below calculates the BECR for a new product given that theexisting product line consists of a single old product. The same logic can be applied to otheractions and to larger product lines.2
Equation 1d: BECR
New Product Unit ContributionBECR = ---------------------------------------
Old Product Unit Contribution
Where:
New Product refers to a planned addition to the product line,
Old Product refers to the product that will lose sales to the New Product (if several old products are affected then an average profit margin can be used as an approximation), and
Cannibalization Rate refers to the percentage of New Product Unit Volume which are salesthat would have gone to the Old Product had the New Product not been introduced.
Note that a large BECR is good. The actual cannibalization rate must be lower than the BECR inorder for the new product introduction to be profitable. When the new unit contribution is largerthan the old unit contribution, the BECR is greater than 100 percent, so there is no problem.
Comment
For the new product introduction to be profitable, the new product must have a positive unitcontribution after adjusting for cannibalization. If the cannibalization rate can be estimatedempirically, then Adjusted Unit Contribution = New Product Unit Contribution - ( Estimated
Cannibalization Rate Old Product Unit Contribution). This unit contribution can then be useddirectly in Equations 1a, 1b, and 1c to evaluate the new product.
2 This formula assumes that the total fixed costs do not change and is derived from the fact that, at break-even, New
Unit Volume New Unit Contribution = Old Unit Volume Cannibalized Old Unit Contribution (i.e., at break-even, profit from sales of the new product is equal to the profits stolen from the old product). For other variable actions,like a price cut, the old product should be an average across the entire product line including the product underconsideration.
8/12/2019 Marketing Math Help
http://slidepdf.com/reader/full/marketing-math-help 18/30
Marketing Math Essentials – 08/11/09
THE WHARTON SCHOOL OF THE U NIVER SITY OF PENNSYLVANIA 18
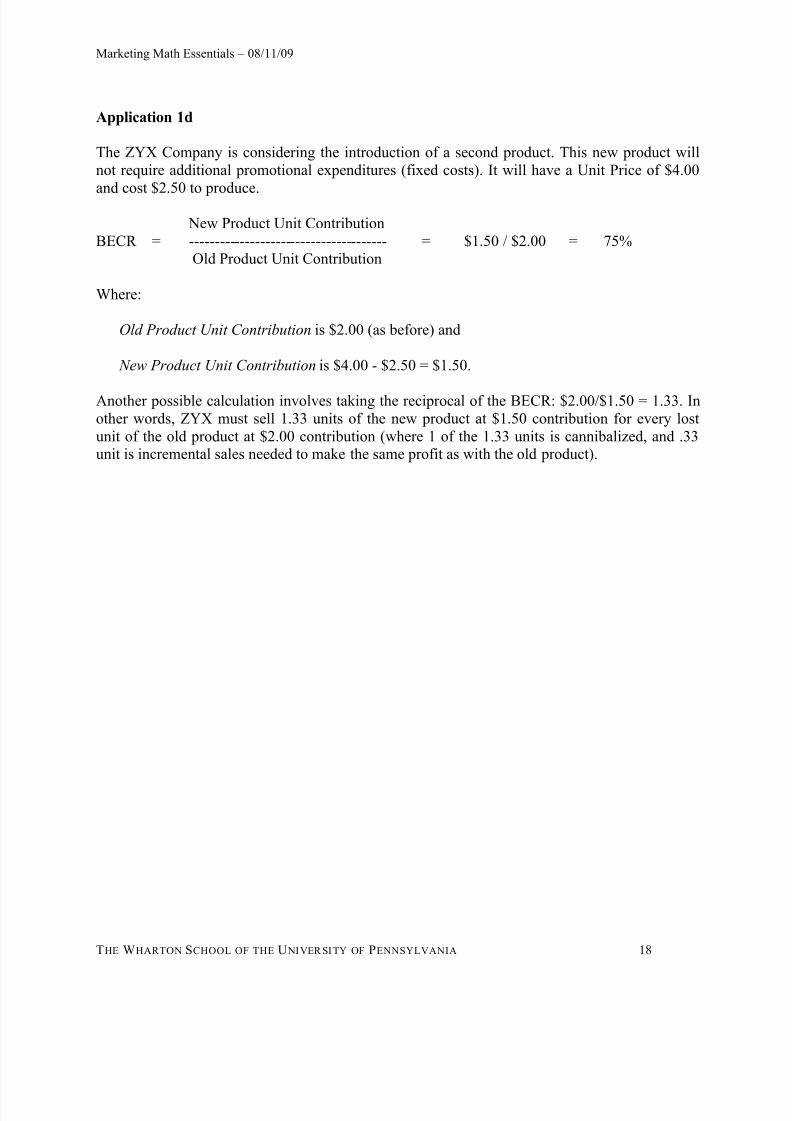
Application 1d
The ZYX Company is considering the introduction of a second product. This new product willnot require additional promotional expenditures (fixed costs). It will have a Unit Price of $4.00and cost $2.50 to produce.
New Product Unit ContributionBECR = --------------------------------------- = $1.50 / $2.00 = 75%
Old Product Unit Contribution
Where:
Old Product Unit Contribution is $2.00 (as before) and
New Product Unit Contribution is $4.00 - $2.50 = $1.50.
Another possible calculation involves taking the reciprocal of the BECR: $2.00/$1.50 = 1.33. Inother words, ZYX must sell 1.33 units of the new product at $1.50 contribution for every lostunit of the old product at $2.00 contribution (where 1 of the 1.33 units is cannibalized, and .33unit is incremental sales needed to make the same profit as with the old product).
8/12/2019 Marketing Math Help
http://slidepdf.com/reader/full/marketing-math-help 19/30
Marketing Math Essentials – 08/11/09
THE WHARTON SCHOOL OF THE U NIVER SITY OF PENNSYLVANIA 19
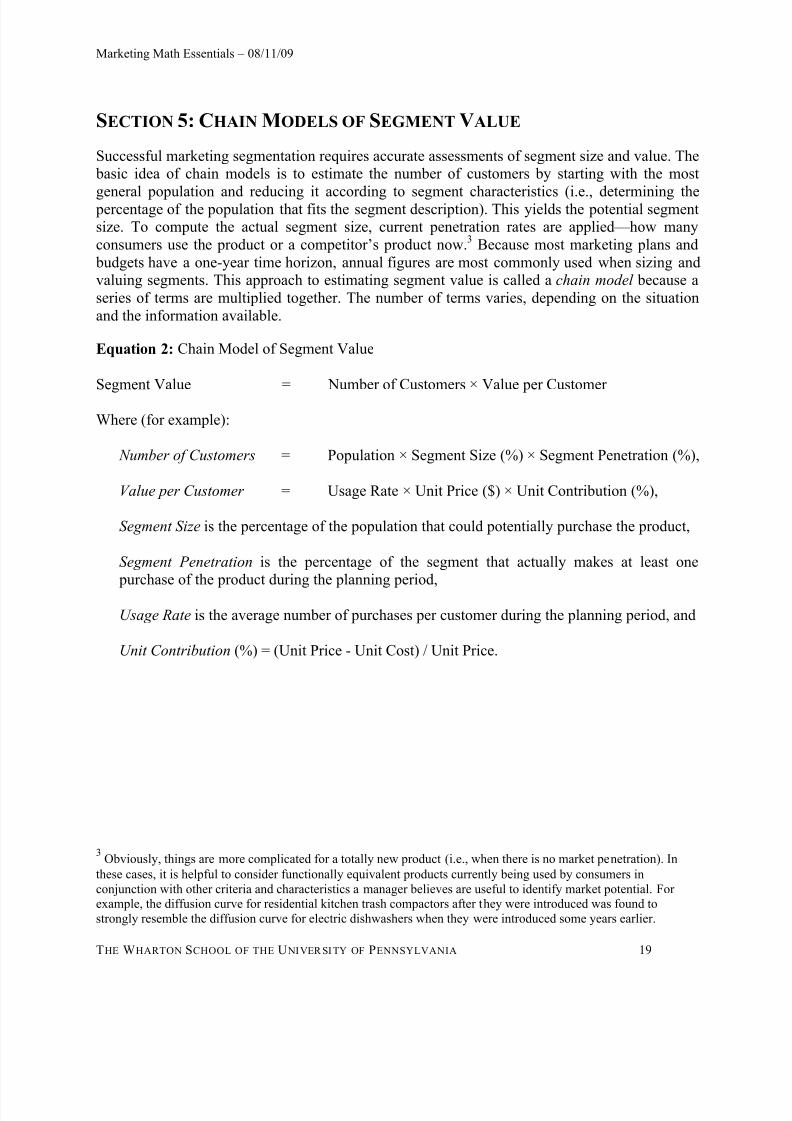
SECTION 5: CHAIN MODELS OF SEGMENT VALUE
Successful marketing segmentation requires accurate assessments of segment size and value. The basic idea of chain models is to estimate the number of customers by starting with the most
general population and reducing it according to segment characteristics (i.e., determining the percentage of the population that fits the segment description). This yields the potential segmentsize. To compute the actual segment size, current penetration rates are applied — how manyconsumers use the product or a competitor’s product now.
3 Because most marketing plans and budgets have a one-year time horizon, annual figures are most commonly used when sizing andvaluing segments. This approach to estimating segment value is called a chain model because aseries of terms are multiplied together. The number of terms varies, depending on the situationand the information available.
Equation 2: Chain Model of Segment Value
Segment Value = Number of Customers × Value per Customer
Where (for example):
Number of Customers = Population × Segment Size (%) × Segment Penetration (%),
Value per Customer = Usage Rate × Unit Price ($) × Unit Contribution (%),
Segment Size is the percentage of the population that could potentially purchase the product,
Segment Penetration is the percentage of the segment that actually makes at least one purchase of the product during the planning period,
Usage Rate is the average number of purchases per customer during the planning period, and
Unit Contribution (%) = (Unit Price - Unit Cost) / Unit Price.
3 Obviously, things are more complicated for a totally new product (i.e., when there is no market penetration). In
these cases, it is helpful to consider functionally equivalent products currently being used by consumers inconjunction with other criteria and characteristics a manager believes are useful to identify market potential. Forexample, the diffusion curve for residential kitchen trash compactors after they were introduced was found tostrongly resemble the diffusion curve for electric dishwashers when they were introduced some years earlier.
8/12/2019 Marketing Math Help
http://slidepdf.com/reader/full/marketing-math-help 20/30
Marketing Math Essentials – 08/11/09
THE WHARTON SCHOOL OF THE U NIVER SITY OF PENNSYLVANIA 20
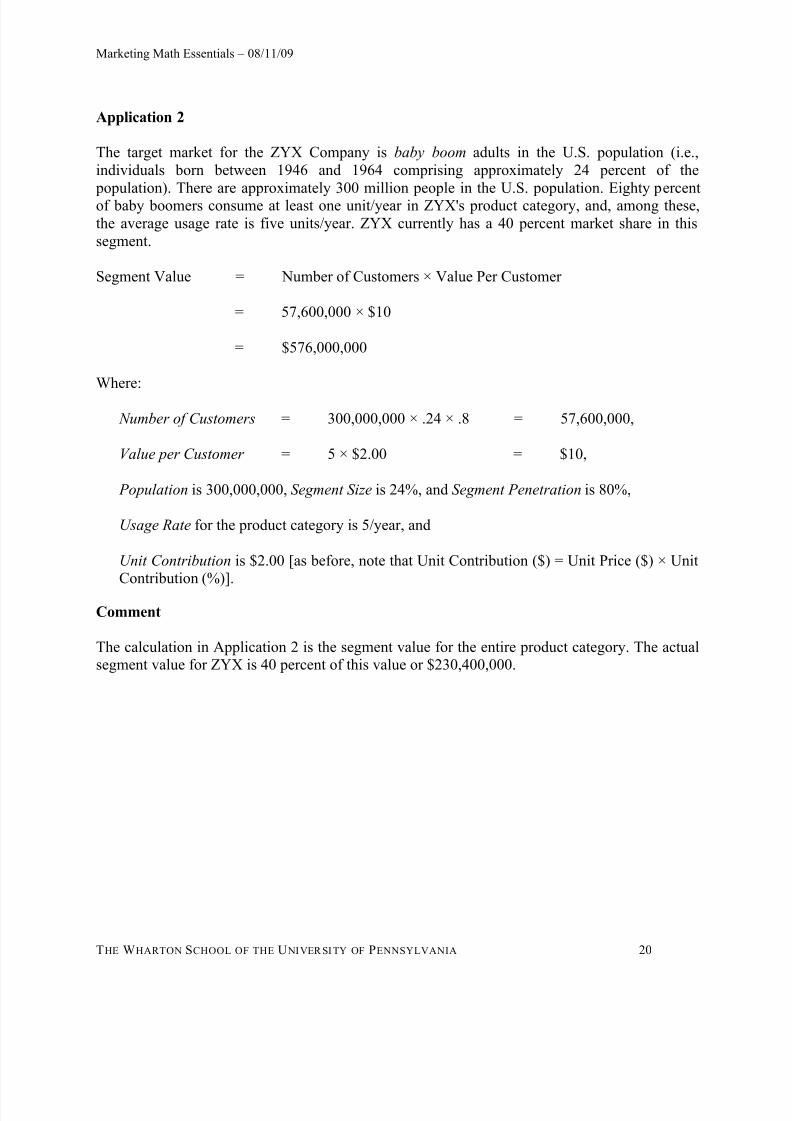
Application 2
The target market for the ZYX Company is baby boom adults in the U.S. population (i.e.,individuals born between 1946 and 1964 comprising approximately 24 percent of the population). There are approximately 300 million people in the U.S. population. Eighty percentof baby boomers consume at least one unit/year in ZYX's product category, and, among these,the average usage rate is five units/year. ZYX currently has a 40 percent market share in thissegment.
Segment Value = Number of Customers × Value Per Customer
= 57,600,000 × $10
= $576,000,000
Where:
Number of Customers = 300,000,000 × .24 × .8 = 57,600,000,
Value per Customer = 5 × $2.00 = $10,
Population is 300,000,000, Segment Size is 24%, and Segment Penetration is 80%,
Usage Rate for the product category is 5/year, and
Unit Contribution is $2.00 [as before, note that Unit Contribution ($) = Unit Price ($) × UnitContribution (%)].
Comment
The calculation in Application 2 is the segment value for the entire product category. The actualsegment value for ZYX is 40 percent of this value or $230,400,000.

8/12/2019 Marketing Math Help
http://slidepdf.com/reader/full/marketing-math-help 21/30
Marketing Math Essentials – 08/11/09
THE WHARTON SCHOOL OF THE U NIVER SITY OF PENNSYLVANIA 21
SECTION 6: CUSTOMER LIFETIME VALUE (CLV)
While some purchases occur only once in a lifetime or very infrequently, customers often purchase repeatedly at various time intervals. In many markets, from consulting services to razor
blades to mp3 music files, customers vary in their repeat purchase rate, and in the extent towhich they buy from the same vendor or from competitors. Increasingly, marketing strategiesfocus on the financial value that customers provide over time for three important reasons. First,the increasing focus on customer-oriented, market-driven business strategies demands a longerterm perspective. Second, advances in marketing research and information technology haveallowed managers to micro-market and data mine at the level of very small segments or evenindividual customers. Third, increasing emphasis on making marketing more accountable hasstimulated marketers to justify investments of the value of customers over time in order todemonstrate their contribution to profitability.
Experience with CLV calculations is most advanced in industries where purchases are
reasonably frequent, input data is readily available, and important marketing decisions are basedon individual customer ’s expenditures over time. In some financial service industries, such ascredit card services and car insurance, extensive customer level models have been developed.Analyses of the differences between the cost of acquiring new customers and the cost of keeping(and/or selling more to) current customers can drive strategies that lose money in the first year, but are very profitable in subsequent years. Internet start-ups, in particular, rely on this logic indeveloping business plans and attracting investors, albeit with inconsistent results becauseforecasts of revenues in years subsequent to launch are often exaggerated (the eyeballs are not assticky or monetized as easily as assumed). Much more reliable CLV projections are possiblewhen a product or service has been on the market for several years.
Calculating the CLV enables a marketer to predict the profitability of a customer over time. Thecalculation can be used to:
1. Devise marketing programs that are tailored to preferences and behaviors of targetcustomers. For example, Harrah’s Entertainment Inc. uses a loyalty card to track play preferences, betting patterns, lodging and restaurant preferences, and other data to devisetargeted promotions for customers at the firm’s casinos. These efforts were reputed to drive100 percent growth rate in the stock price and profits, and revenue growth of 50 percent — faroutpacing the industry.
2. Assess the present value of a customer over some time frame. This is a financial metric thatmeasures the value of a customer based on revenues generated over time, discounting thoserevenues to take into account the cost of capital — the fact that the value of money todaydeclines over time due to inflation or because funds could be invested in some vehicle togenerate capital. For example, if a customer gives us $100 in revenue one year from now, wecould apply a discount rate of say 10 percent so that the present value of that $100 is$100/1.1.
3. Assess costs to generate revenues from customers over time. This is because calculating CLVrequires the marketer to specify costs to acquire and retain customers. The CLV calculationmight signal that either or both of these costs are too high. Alternatively, the marketer could

8/12/2019 Marketing Math Help
http://slidepdf.com/reader/full/marketing-math-help 22/30
Marketing Math Essentials – 08/11/09
THE WHARTON SCHOOL OF THE U NIVER SITY OF PENNSYLVANIA 22
conclude that the CLV is high enough to warrant even more expenditures to acquire and/orretain customers.
4. Assess brand loyalty, since another measure required to calculate CLV is the retention rate — that is, what proportion of our customers continue to buy our product from year to year. Ofcourse, at least some customers will cease buying — they move, change their habits, prefer
another brand, or pass away. New customers enter the market, but the CLV calculationfollows a cohort of buyers over time.
Equation 3a: CLV
CLV =t
Cumulative Retention Ratet × Net Customer Contributiont
Where:
t indexes the time periods in the customer's lifetime,
Cumulative Retention Ratet is the probability that the average customer will still be active at
time t . This is called the cumulative retention rate because it represents the cumulative effectsof the single period retention rates over time [e.g., if the percentage of customers retained ineach period is r , then, after t time periods, the Cumulative Retention Rate is r
t -1 (assumingthat retention in the first time period is 100%)],
Net Customer Contributiont is the gross contribution of the average customer at time t lessany direct costs associated with the customer. These are typically separated into acquisitionand retention costs. Acquisition costs typically occur only in the first time period; for products with long sales cycles, such as complex technologies and large IT consulting projects, they may also occur well before the first period of revenue generation. Retentioncosts typically occur only in subsequent time periods. That is,
Net Customer Contributiont = (Usage Ratet × Unit Contributiont) – Customer Costt and
Customer Cost t = Acquisition Costt + Retention Costt.
Equation 3a ignores the opportunity cost of money and assumes a discount rate of zero. If adiscount rate of d is applied beginning in period 2, then
Net Present CLV =t
Cumulative Retention Ratet × Net Customer Contributiont / (1+d )t -1.
If one assumes that the rate of retention r , and, hence, the rate of attrition a = 1 – r remainsconstant over time, it is possible to mathematically combine the customer attrition rate a with thediscount rate d to form a net discount rate which can then be used in the traditional computationof the Present Value of the Net Customer Contributions only. The formula for this net discountrate (d net ) is (d + a)/(1 – a), where d is the discount rate and a is the attrition rate.

8/12/2019 Marketing Math Help
http://slidepdf.com/reader/full/marketing-math-help 23/30
Marketing Math Essentials – 08/11/09
THE WHARTON SCHOOL OF THE U NIVER SITY OF PENNSYLVANIA 23
Application 3a
Marketing research revealed that direct mailing of a product sample is very effective in creatingloyal ZYX customers. In addition to the unit cost of the sample (i.e., $3, see Application 1a),there is a $1 shipping and handling cost associated with the mail-out. One in four recipients ofthe sample is expected to become a loyal ZYX customer. ZYX plans to send a $1 coupon tothese customers each year to maintain loyalty (postage and handling for the coupon is $.50).Research further revealed that these customers purchase 6 units of ZYX product each year anddo not buy competing products. However, each year 10 percent switch to a competitor's productand then purchase only that competitor's product.
CLV for a 5-year time horizon (no discounting):
=t
Cumulative Retention Ratet × Net Customer Contributiont,
= 1.0 × (-$4) + .9 × $10.50 + .81 × $10.50 + .729 × $10.50 + .656 × $10.50,
= $28.50
Where:
t indexes years (for a 5-year planning horizon),
Cumulative Retention Ratet is computed assuming that the percentage of customers retainedin each period is 90%, and, after t time periods, the Cumulative Retention Rate is .9t -1,
Net Customer Contributiont in the first year is -$4, assuming that each new customer purchases 6 units, which provides a $12 gross contribution (i.e., 6 × $2) at an acquisition costof $16 (i.e., it takes 4 mail-outs to get 1 new customer at a cost of $4 per mail-out), and
Net Customer Contributiont in subsequent years is $10.50 (i.e., $12 gross contribution from 6 purchases minus a retention cost of $1.50).
Finally, when assuming that both the Customer Contribution Margin and the retention rateremain constant, one can apply the following quick formula that does not require any summationover time.

8/12/2019 Marketing Math Help
http://slidepdf.com/reader/full/marketing-math-help 24/30
Marketing Math Essentials – 08/11/09
THE WHARTON SCHOOL OF THE U NIVER SITY OF PENNSYLVANIA 24
Equation 3b: Quick CLV
Quick CLV = (Multiplier × Average Customer Contribution)
– Customer Acquisition Cost + Customer Retention Cost
Where:
the Average Customer Contribution is the annual profit contribution per customer less annualretention cost per customer. For the Quick CLV, these values are assumed to be constant overtime,
the Multiplier is a constant value (given in the tables below) that is determined by theretention rate, the discount rate, and the time horizon, and
the Customer Retention Cost is the annual cost incurred to keep the customer.4
Multiplier Table for a Quick CLV with a Five-Year Time Horizon
Discount Rate
Customer Retention Rate
99% 90% 80% 70% 60% 50% 40% 30% 20% 10%
0% 4.90 4.10 3.36 2.77 2.31 1.94 1.65 1.43 1.25 1.11
5% 4.46 3.76 3.12 2.60 2.19 1.86 1.60 1.40 1.23 1.11
10% 4.10 3.48 2.92 2.46 2.09 1.80 1.56 1.37 1.22 1.10
15% 3.79 3.25 2.75 2.34 2.01 1.74 1.53 1.35 1.21 1.10
25% 3.31 2.88 2.48 2.15 1.87 1.65 1.47 1.31 1.19 1.09
Multiplier Table for a Quick CLV with an Infinite Time Horizon
Discount Rate
Customer Retention Rate
99% 90% 80% 70% 60% 50% 40% 30% 20% 10%
0% 100.00 10.00 5.00 3.33 2.50 2.00 1.67 1.43 1.25 1.11
5% 17.50 7.00 4.20 3.00 2.33 1.91 1.62 1.40 1.24 1.11
10% 10.00 5.50 3.67 2.75 2.20 1.83 1.57 1.38 1.22 1.10
15% 7.19 4.60 3.29 2.56 2.09 1.77 1.53 1.35 1.21 1.10
25% 4.81 3.57 2.78 2.27 1.92 1.67 1.47 1.32 1.19 1.09
Note that the entries in the two tables differ from each other mainly when retention rates are highand the discount rate is low. In all other cases, ignoring cash flows generated further than fiveyears into the future does not affect the Net Present Value (NPV) calculations used to computethe CLV much.
4 Note how one must add the annual retention cost to obtain the correct Quick CLV. The reason is that the company
does not incur any retention cost at the beginning of the first year, so the average customer contributionunderrepresents the true customer contribution in the first year by exactly the retention cost.

8/12/2019 Marketing Math Help
http://slidepdf.com/reader/full/marketing-math-help 25/30
Marketing Math Essentials – 08/11/09
THE WHARTON SCHOOL OF THE U NIVER SITY OF PENNSYLVANIA 25
This quick method requires assumptions that may only be a rough approximation, neglectingmany of the details of both customer behavior and discounted cash flow. Most importantly, itassumes that both the contribution margin and retention rate are constant over time. Also, themultiplier values in the tables assume that the customer's first purchase occurs soon afteracquisition expenses are incurred. If there is a substantial delay between paying the acquisition
costs and receiving the first payment from the customer (e.g., more than six months), thensubtract one from each multiplier in the tables.
Application 3b
Given the same information as in Application 3a and ignoring a discount rate (i.e., 0%),
Quick CLV
= (Multiplier × Average Customer Contribution)
– Customer Acquisition Cost + Customer Retention Cost
= 4.10 × $10.50 – $16 + $1.50 = $28.50.
The quick and regular methods give the same estimate because, in this example, the customercontributions and retention costs are the same in every year (and a five-year horizon is used in both calculations). The regular method should be used when customer behavior changes overtime (e.g., contribution increases and retention costs decrease), and the quick method should beused only when customer behavior is relatively constant.
8/12/2019 Marketing Math Help
http://slidepdf.com/reader/full/marketing-math-help 26/30
Marketing Math Essentials – 08/11/09
THE WHARTON SCHOOL OF THE U NIVER SITY OF PENNSYLVANIA 26
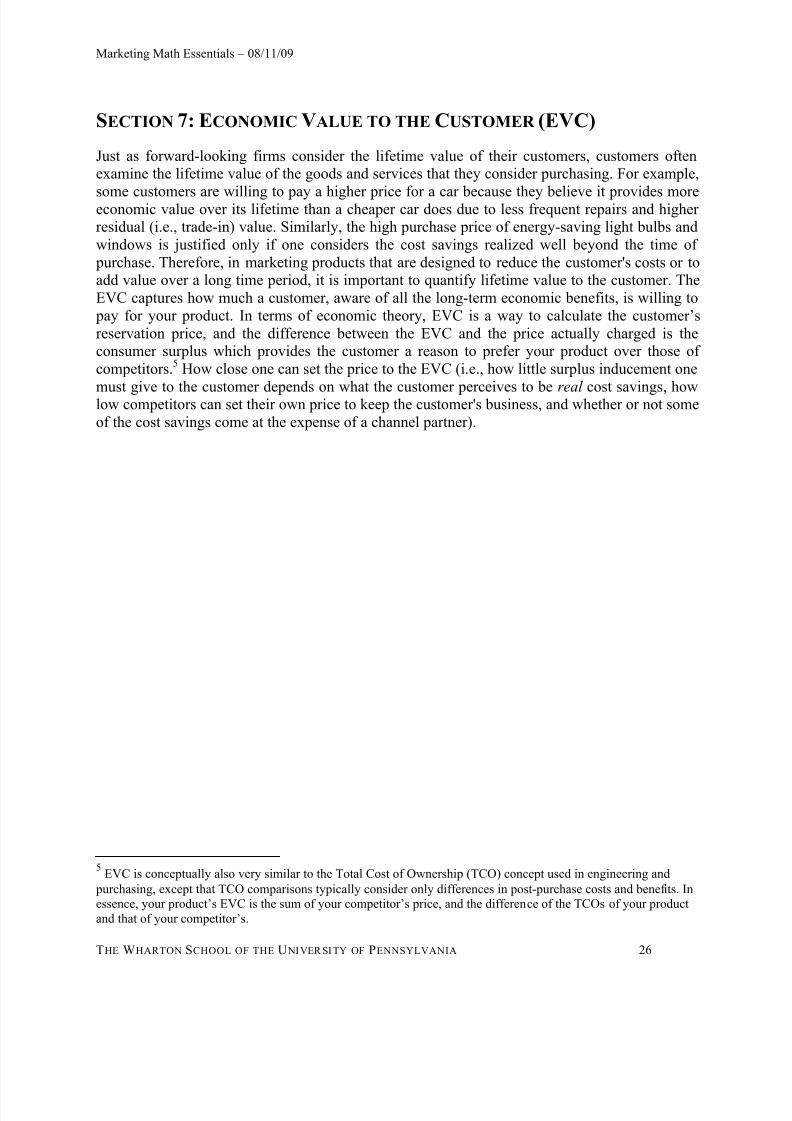
SECTION 7: ECONOMIC VALUE TO THE CUSTOMER (EVC)
Just as forward-looking firms consider the lifetime value of their customers, customers oftenexamine the lifetime value of the goods and services that they consider purchasing. For example,
some customers are willing to pay a higher price for a car because they believe it provides moreeconomic value over its lifetime than a cheaper car does due to less frequent repairs and higherresidual (i.e., trade-in) value. Similarly, the high purchase price of energy-saving light bulbs andwindows is justified only if one considers the cost savings realized well beyond the time of purchase. Therefore, in marketing products that are designed to reduce the customer's costs or toadd value over a long time period, it is important to quantify lifetime value to the customer. TheEVC captures how much a customer, aware of all the long-term economic benefits, is willing to pay for your product. In terms of economic theory, EVC is a way to calculate the customer’s
reservation price, and the difference between the EVC and the price actually charged is theconsumer surplus which provides the customer a reason to prefer your product over those ofcompetitors.5 How close one can set the price to the EVC (i.e., how little surplus inducement one
must give to the customer depends on what the customer perceives to be real cost savings, howlow competitors can set their own price to keep the customer's business, and whether or not someof the cost savings come at the expense of a channel partner).
5 EVC is conceptually also very similar to the Total Cost of Ownership (TCO) concept used in engineering and
purchasing, except that TCO comparisons typically consider only differences in post-purchase costs and benefits. Inessence, your product’s EVC is the sum of your competitor’s price, and the difference of the TCOs of your productand that of your competitor’s.

8/12/2019 Marketing Math Help
http://slidepdf.com/reader/full/marketing-math-help 27/30
Marketing Math Essentials – 08/11/09
THE WHARTON SCHOOL OF THE U NIVER SITY OF PENNSYLVANIA 27
Equation 4
EVC = Competitor's Lifecycle Cost
– Our Start-up Cost
– Our Post-Purchase Cost
+ Our Incremental Value
Where:
Competitor's Lifecycle Cost is the total lifecycle cost to the customer of the benchmarkcompetitor's product, including price, start-up cost, post-purchase cost, and reduced by thecompetitor's incremental value,
Our Start-up Cost is the customer's immediate, one-time cost of switching from thecompetitor's product to the firm's product,
Our Post-Purchase Cost is the customer's total cost of using and maintaining the firm's product until it is replaced, and
Our Incremental Value is estimated as the dollar value to the customer of any benefits provided by the firm's product that are not provided by the competitor's product.
8/12/2019 Marketing Math Help
http://slidepdf.com/reader/full/marketing-math-help 28/30
Marketing Math Essentials – 08/11/09
THE WHARTON SCHOOL OF THE U NIVER SITY OF PENNSYLVANIA 28
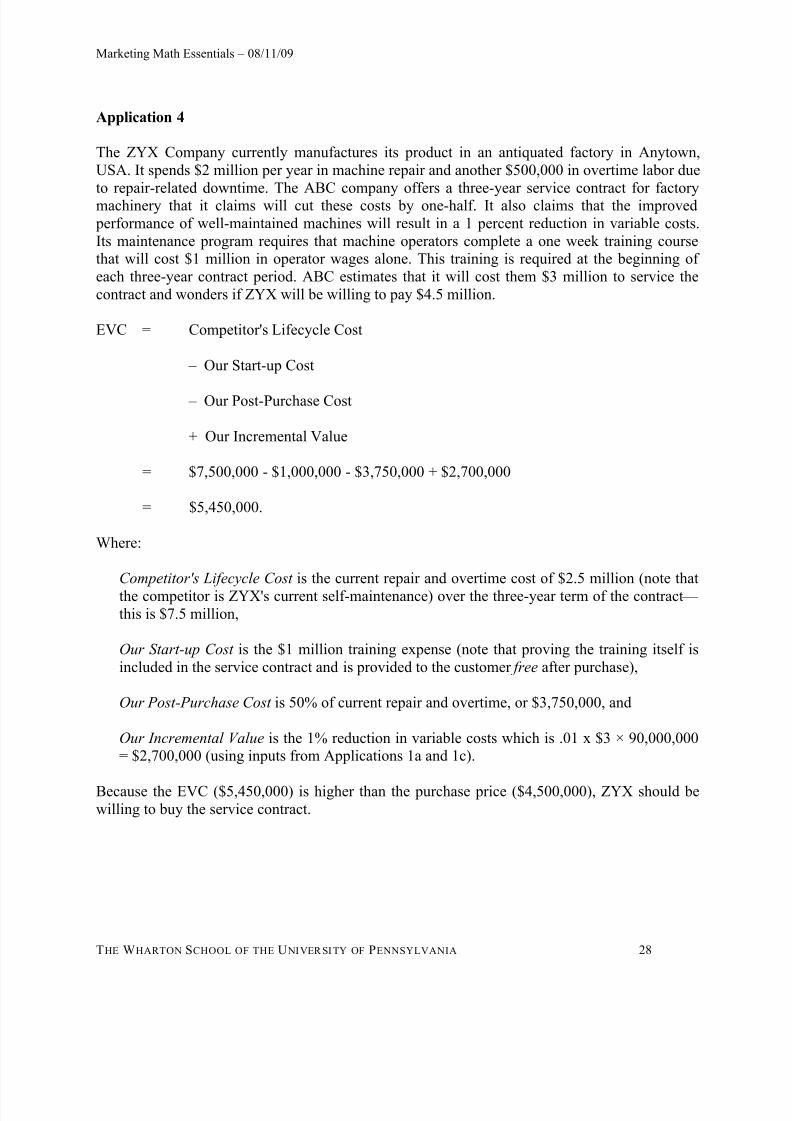
Application 4
The ZYX Company currently manufactures its product in an antiquated factory in Anytown,USA. It spends $2 million per year in machine repair and another $500,000 in overtime labor dueto repair-related downtime. The ABC company offers a three-year service contract for factorymachinery that it claims will cut these costs by one-half. It also claims that the improved performance of well-maintained machines will result in a 1 percent reduction in variable costs.Its maintenance program requires that machine operators complete a one week training coursethat will cost $1 million in operator wages alone. This training is required at the beginning ofeach three-year contract period. ABC estimates that it will cost them $3 million to service thecontract and wonders if ZYX will be willing to pay $4.5 million.
EVC = Competitor's Lifecycle Cost
– Our Start-up Cost
– Our Post-Purchase Cost
+ Our Incremental Value
= $7,500,000 - $1,000,000 - $3,750,000 + $2,700,000
= $5,450,000.
Where:
Competitor's Lifecycle Cost is the current repair and overtime cost of $2.5 million (note thatthe competitor is ZYX's current self-maintenance) over the three-year term of the contract —
this is $7.5 million,
Our Start-up Cost is the $1 million training expense (note that proving the training itself isincluded in the service contract and is provided to the customer free after purchase),
Our Post-Purchase Cost is 50% of current repair and overtime, or $3,750,000, and
Our Incremental Value is the 1% reduction in variable costs which is .01 x $3 × 90,000,000= $2,700,000 (using inputs from Applications 1a and 1c).
Because the EVC ($5,450,000) is higher than the purchase price ($4,500,000), ZYX should bewilling to buy the service contract.
8/12/2019 Marketing Math Help
http://slidepdf.com/reader/full/marketing-math-help 29/30
Marketing Math Essentials – 08/11/09
THE WHARTON SCHOOL OF THE U NIVER SITY OF PENNSYLVANIA 29
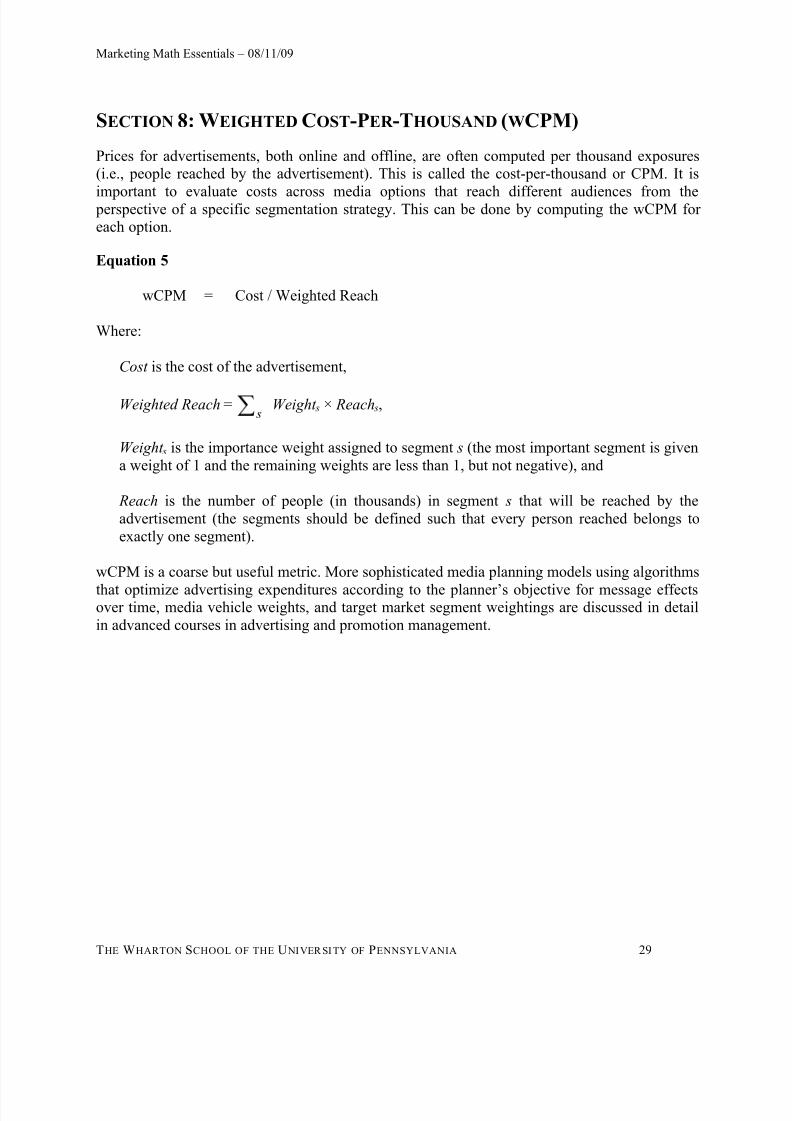
SECTION 8: WEIGHTED COST-PER -THOUSAND (WCPM)
Prices for advertisements, both online and offline, are often computed per thousand exposures(i.e., people reached by the advertisement). This is called the cost-per-thousand or CPM. It is
important to evaluate costs across media options that reach different audiences from the perspective of a specific segmentation strategy. This can be done by computing the wCPM foreach option.
Equation 5
wCPM = Cost / Weighted Reach
Where:
Cost is the cost of the advertisement,
Weighted Reach = s
Weight s × Reach s,
Weight s is the importance weight assigned to segment s (the most important segment is givena weight of 1 and the remaining weights are less than 1, but not negative), and
Reach is the number of people (in thousands) in segment s that will be reached by theadvertisement (the segments should be defined such that every person reached belongs toexactly one segment).
wCPM is a coarse but useful metric. More sophisticated media planning models using algorithms
that optimize advertising expenditures according to the planner’s objective for message effectsover time, media vehicle weights, and target market segment weightings are discussed in detailin advanced courses in advertising and promotion management.
8/12/2019 Marketing Math Help
http://slidepdf.com/reader/full/marketing-math-help 30/30
Marketing Math Essentials – 08/11/09
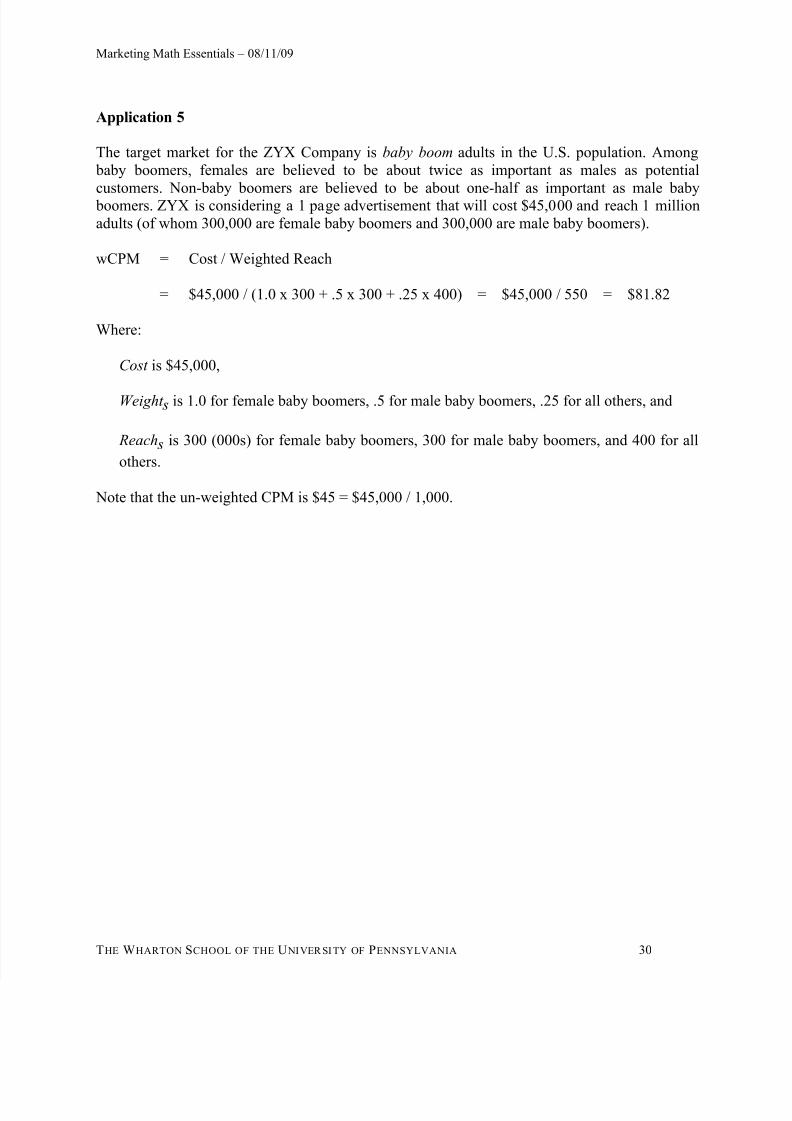
Application 5
The target market for the ZYX Company is baby boom adults in the U.S. population. Among baby boomers, females are believed to be about twice as important as males as potentialcustomers. Non-baby boomers are believed to be about one-half as important as male baby boomers. ZYX is considering a 1 page advertisement that will cost $45,000 and reach 1 millionadults (of whom 300,000 are female baby boomers and 300,000 are male baby boomers).
wCPM = Cost / Weighted Reach
= $45,000 / (1.0 x 300 + .5 x 300 + .25 x 400) = $45,000 / 550 = $81.82
Where:
Cost is $45,000,
Weight s is 1.0 for female baby boomers, .5 for male baby boomers, .25 for all others, and
Reach s is 300 (000s) for female baby boomers, 300 for male baby boomers, and 400 for all
others.
Note that the un-weighted CPM is $45 = $45,000 / 1,000.