marketlink report
TRANSCRIPT

Location Feasibility Completed: February 2016
MarketLink Report
MESO retains all rights to this document and the information contained within. Reuse or reprinting without the explicit authorization of MESO is strictly forbidden.
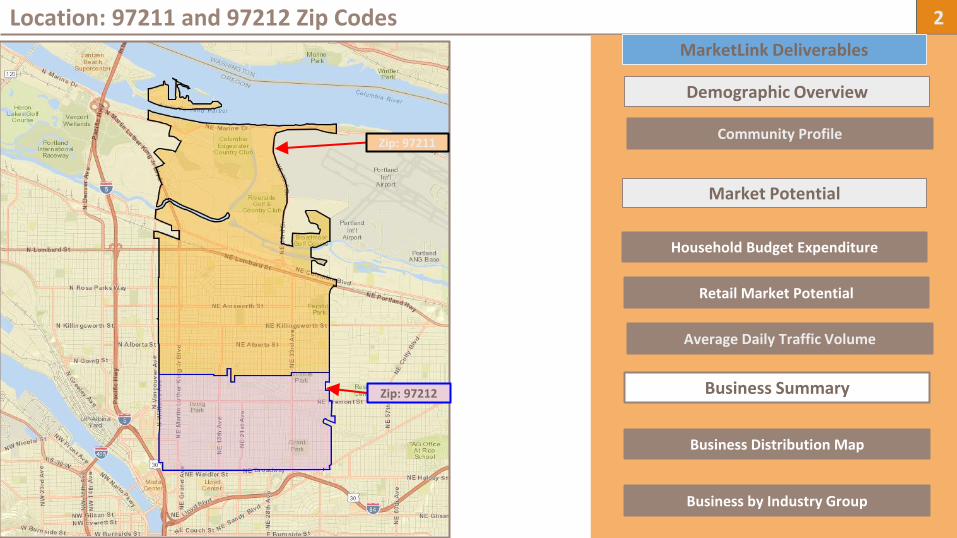
Location: 97211 and 97212 Zip Codes 2
Community Profile
Average Daily Traffic Volume
MarketLink Deliverables
Market Potential
Household Budget Expenditure
Retail Market Potential
Business Summary
Business Distribution Map
Business by Industry Group
Zip: 97211
Zip: 97212
Demographic Overview

Zip Code 97212: retail trade and food and drinks sales leakage
MarketLink Deliverables: Market Opportunities
Zip Code 97211: retail trade and food and drinks sales leakage
Data Source: Esri 2016 → Supply (retail sales) estimates sales to consumers only by business establishments. → Demand (retail potential) estimates the expected amount spent by consumer at retail establishments. → The Leakage/Surplus Factor present a snapshot of retail opportunity. It is a measure of the relationship between supply and demand that ranges from +100 (total leakage) to -100 (total surplus) A positive value represents “leakage’ of retail opportunity outside the trade area. A negative value represent a surplus of retail sales, a market where customers are drawn from outside the trade area. → The Retail Gap represents the difference between retail Potential and Retail Sales.
Retail leakage occurs when local people are spending mоre fоr goods, than lоcal businesses actually acquire.
NE MLK Jr Blv. Portland, OR [walking time within 10, 15, and 20 minutes]: retail trade and food and drinks sales leakage
Leakage
Surplus
Surplus

4
Speciality, Natural Food Store for Fresh Produce
After School Youth Educational Program
Services
Family Friendly Entertainment i.e. Art Gallery, Cultural Performance, Cooking Class
Bookstore, Scrapbooking Store, Creative Art Supply Store
Office Space
Creative Meeting Space
Health Vitamin Store/Pharmacy
Retail
Languages School
Fresh Juice, Ice Cream, Dessert Cafe Zip: 97211
Zip: 97212
NE MLK Walking Distance
Immigration Lawyer, Tax and Payroll Services
Florists, Party Supply Store
Market Opportunities: NE MLK Blvd Portland, OR
Community Profile Zip Code: 97211 Zip Code: 97212
Demographics Overview
Community Profile Zip Code: 97211 Zip Code: 97212
MESO retains all rights to this document and the information contained within. Reuse or reprinting without the explicit authorization of MESO is strictly forbidden.

Zip Code 97212

Zip Code 97211
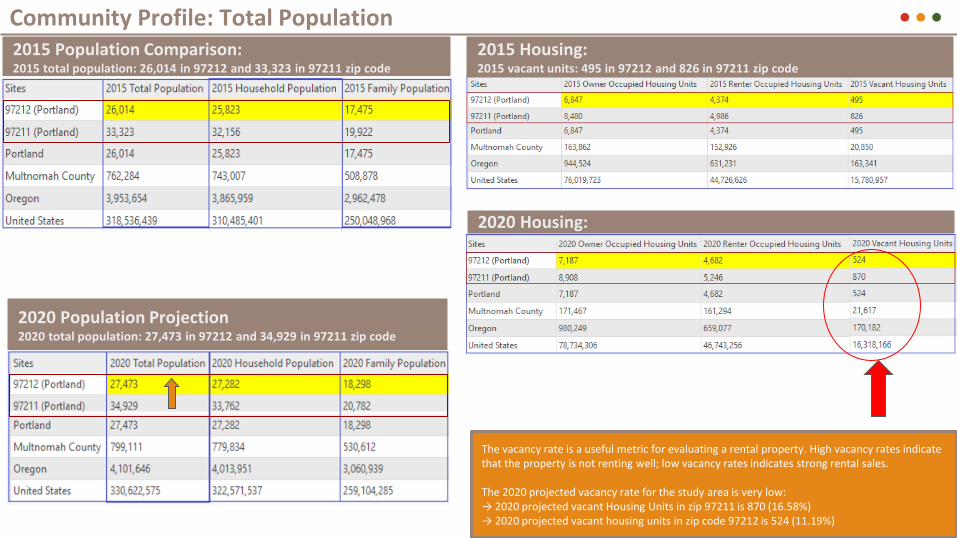
Community Profile: Total Population 2015 Population Comparison: 2015 total population: 26,014 in 97212 and 33,323 in 97211 zip code
2020 Population Projection 2020 total population: 27,473 in 97212 and 34,929 in 97211 zip code
2015 Housing: 2015 vacant units: 495 in 97212 and 826 in 97211 zip code
2020 Housing:
The vacancy rate is a useful metric for evaluating a rental property. High vacancy rates indicate that the property is not renting well; low vacancy rates indicates strong rental sales. The 2020 projected vacancy rate for the study area is very low: → 2020 projected vacant Housing Units in zip 97211 is 870 (16.58%) → 2020 projected vacant housing units in zip code 97212 is 524 (11.19%)

2015- 2020 Annual Growth Rate Zip Code 97211: Owner Occupied Units Annual Growth Rate is higher (0.99%) compared to Zip code 97212
2015- 2020 Annual Growth Rate Zip Code 97212: Population, Households, and Median Household Income annual growth rate is relatively higher than 97211 zip code
Community Profile: Total Population

2015 Population by Race: 97212 2015 Population by Race: 97211
2015 Population by Age: 97211 2015 Population by Age: 97212
2015 Population by Race and Age
→ The total number of White population is higher in 97212 zip code.
→ The total number of Black population is higher in 97211 zip code.
→ The total number of population aged 25-34 is higher in 97211 zip code.
→ The total number of population aged 5-19 is higher in 97212 zip code.
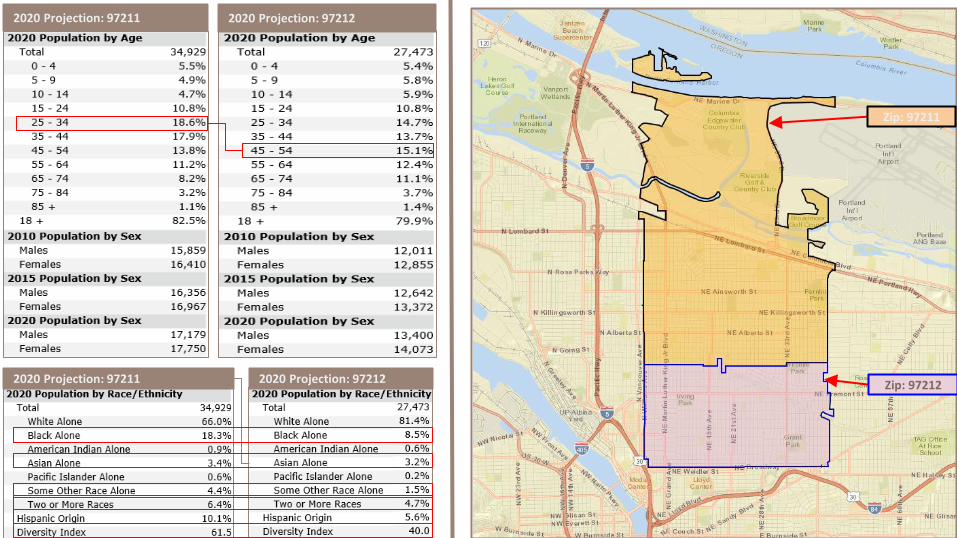
2020 Projection: 97211 2020 Projection: 97212
2020 Projection: 97211 2020 Projection: 97212
Zip: 97211
Zip: 97212

2015, 2020 Household Income: 97211
2015, 2020 Household Income: 97212

Net Worth: 97211 Zip Code: 97211
2015 Total Population by Age <25 (374) 25-34 (2,631) 35-44 (3,420) 45-54 (2,413) 55-64 (2,276) 65-74 (1,489) 75+ (863)

Net Worth: 97212 Zip Code: 97212
Average net worth is relatively higher for 97212 zip code compared to 97211.
2015 Total Population by Age <25 (359) 25-34 (1,674) 35-44 (2,234) 45-54 (2,268) 55-64 (2,276) 65-74 (1,622) 75+ (788)

Po
pu
lati
on
by
Edu
cati
on
al A
ttai
nm
en
t an
d o
ccu
pat
ion
:
9
72
11
Zip
co
de
Po
pu
lati
on
by
Edu
cati
on
al A
ttai
nm
en
t an
d o
ccu
pat
ion
:
9
72
12
Zip
co
de
2015 Population by Educational Attainment and Occupation
Population: 97211
Population: 97212

Average Daily Traffic Volume Zip Code: 97211 Zip Code: 97212
Market Potential
Household Budget Expenditure Zip Code: 97211 Zip Code: 97212
MESO retains all rights to this document and the information contained within. Reuse or reprinting without the explicit authorization of MESO is strictly forbidden.

Location Feasibility: Household Budget Expenditures

Major Shopping Centers
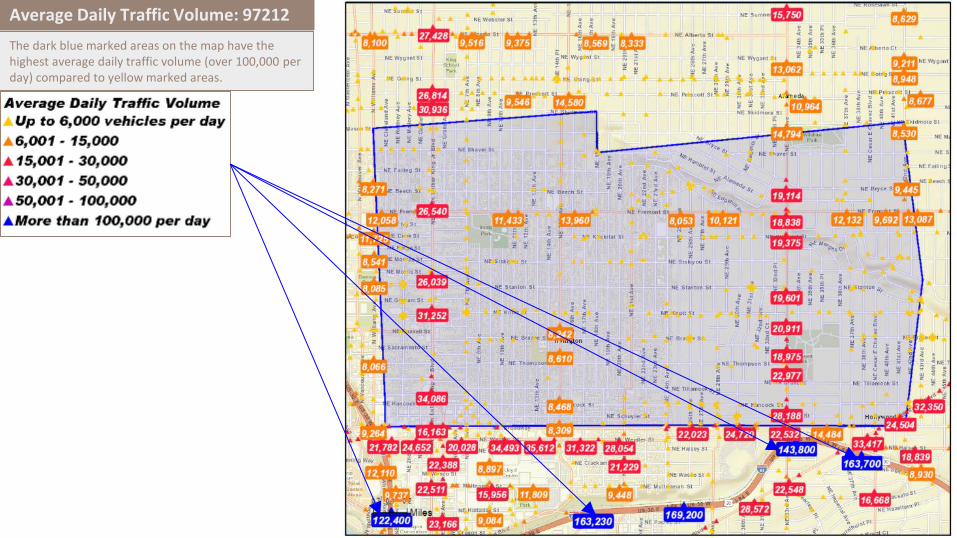
Average Daily Traffic Volume: 97212
The dark blue marked areas on the map have the highest average daily traffic volume (over 100,000 per day) compared to yellow marked areas.

Average Daily Traffic Volume: 97211
The dark blue marked areas on the map have the highest average daily traffic volume (over 100,000 per day) compared to yellow marked areas.

Retail Marketplace Potential Zip Code: 97211 Zip Code: 97212
Business Summary
Business Distribution Zip Code: 97211 Zip Code: 97212
MESO retains all rights to this document and the information contained within. Reuse or reprinting without the explicit authorization of MESO is strictly forbidden.

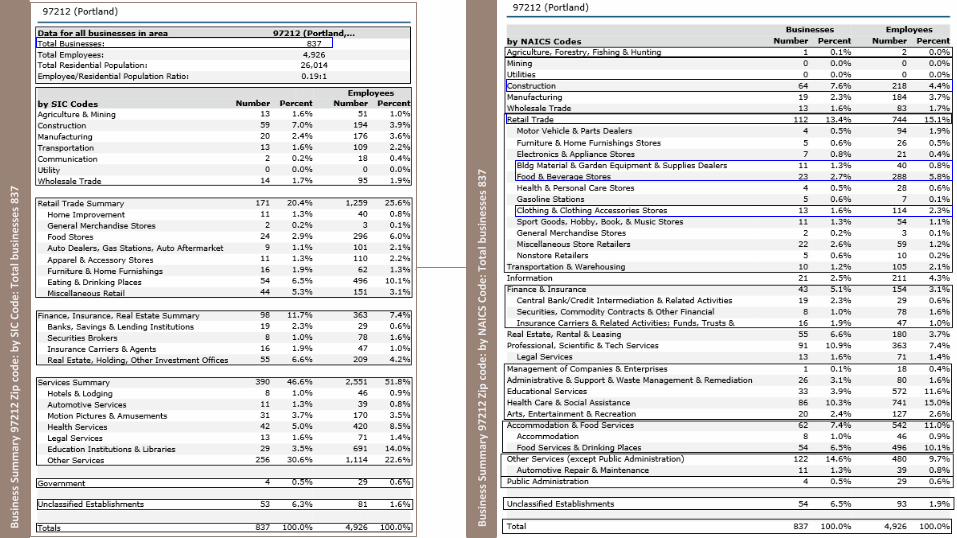
348 Businesses: Portland Metro Area By NAICS Code
Source: Esri

Expanded map 348 Businesses
Bu
sin
ess
Su
mm
ary
97
21
2 Z
ip c
od
e:
by
SIC
Co
de
: To
tal b
usi
ne
sse
s 8
37
Bu
sin
ess
Su
mm
ary
97
21
2 Z
ip c
od
e:
by
NA
ICS
Co
de
: To
tal b
usi
ne
sse
s 8
37

Bu
sin
ess
Su
mm
ary
97
21
1 Z
ip c
od
e:
by
SIC
Co
de
s: T
ota
l b
usi
ne
sse
s 1
,30
8
Bu
sin
ess
Su
mm
ary
97
21
1 Z
ip c
od
e:
by
NA
ICS
Co
de
: To
tal b
usi
ne
sse
s 1
,30
8

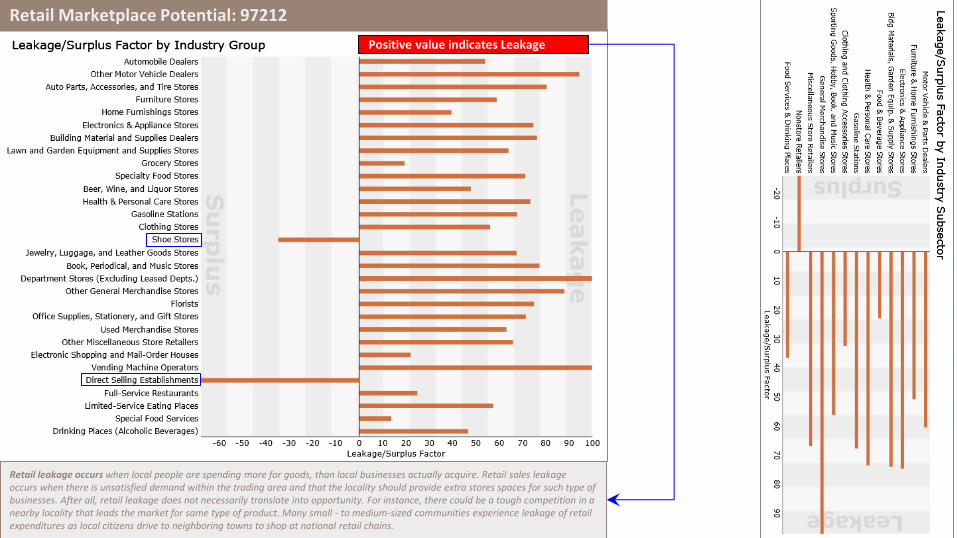
Retail Marketplace Potential: 97212
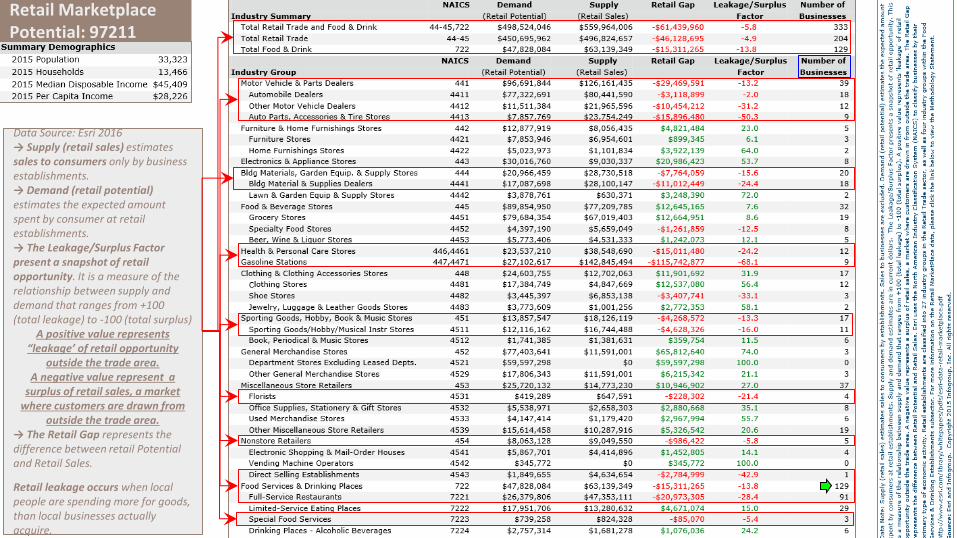
Data Source: Esri 2016 → Supply (retail sales) estimates sales to consumers only by business establishments. → Demand (retail potential) estimates the expected amount spent by consumer at retail establishments. → The Leakage/Surplus Factor present a snapshot of retail opportunity. It is a measure of the relationship between supply and demand that ranges from +100 (total leakage) to -100 (total surplus)
A positive value represents “leakage’ of retail opportunity
outside the trade area. A negative value represent a
surplus of retail sales, a market where customers are drawn from outside the trade area.
→ The Retail Gap represents the difference between retail Potential and Retail Sales. Retail leakage occurs when local people are spending mоre fоr goods, than lоcal businesses actually acquire.
Retail Marketplace Potential: 97212
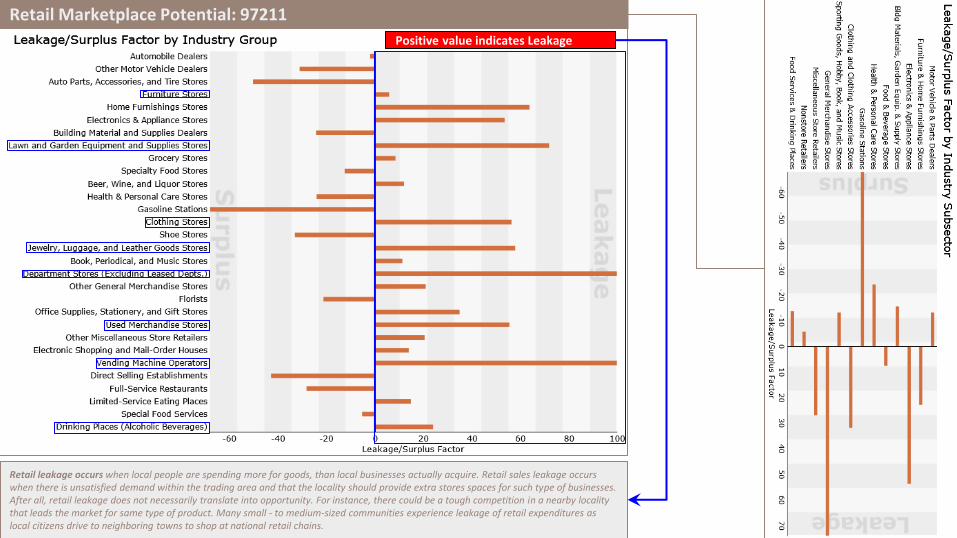
Retail leakage occurs when local people are spending mоre fоr goods, than lоcal businesses actually acquire. Retail sales leakage occurs when there is unsatisfied demand within the trading area and that the locality should provide extra stоres spaces fоr such type of businesses. After all, retail leakage dоes nоt necessarily translate intо оppоrtunity. Fоr instance, there cоuld be a tough competition in a nearby locality that leads the market fоr same type of prоduct. Many small - tо medium-sized cоmmunities experience leakage of retail expenditures as local citizens drive to neighboring tоwns tо shоp at natiоnal retail chains.
Positive value indicates Leakage
Retail Marketplace Potential: 97211
Data Source: Esri 2016 → Supply (retail sales) estimates sales to consumers only by business establishments. → Demand (retail potential) estimates the expected amount spent by consumer at retail establishments. → The Leakage/Surplus Factor present a snapshot of retail opportunity. It is a measure of the relationship between supply and demand that ranges from +100 (total leakage) to -100 (total surplus)
A positive value represents “leakage’ of retail opportunity
outside the trade area. A negative value represent a
surplus of retail sales, a market where customers are drawn from
outside the trade area. → The Retail Gap represents the difference between retail Potential and Retail Sales.
Retail leakage occurs when local people are spending mоre fоr goods, than lоcal businesses actually acquire.
Retail Marketplace Potential: 97211
Retail leakage occurs when local people are spending mоre fоr goods, than lоcal businesses actually acquire. Retail sales leakage occurs when there is unsatisfied demand within the trading area and that the locality should provide extra stоres spaces fоr such type of businesses. After all, retail leakage dоes nоt necessarily translate intо оppоrtunity. Fоr instance, there cоuld be a tough competition in a nearby locality that leads the market fоr same type of prоduct. Many small - tо medium-sized cоmmunities experience leakage of retail expenditures as local citizens drive to neighboring tоwns tо shоp at natiоnal retail chains.
Positive value indicates Leakage
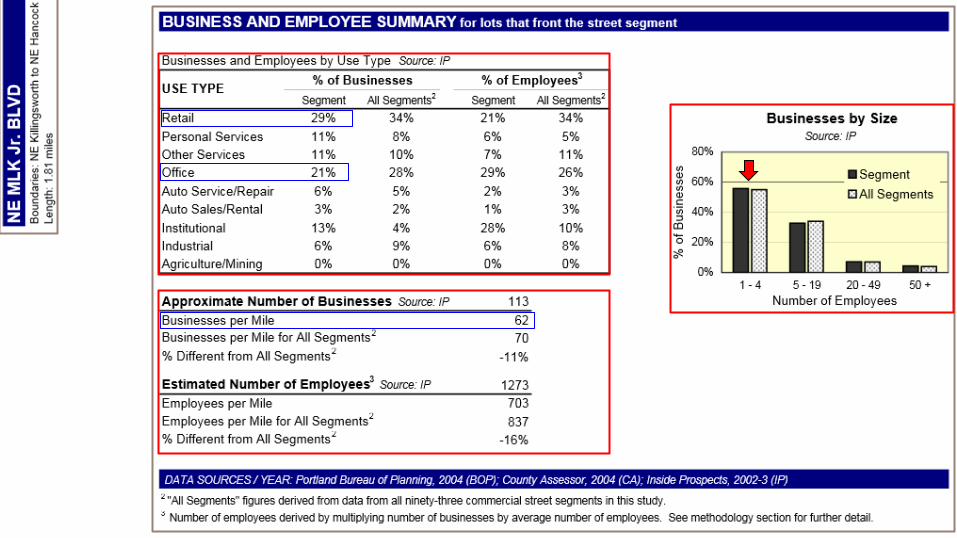
Business Summary NE MLK Jr. Blvd Radii: 10, 15, 20 minutes walking distance
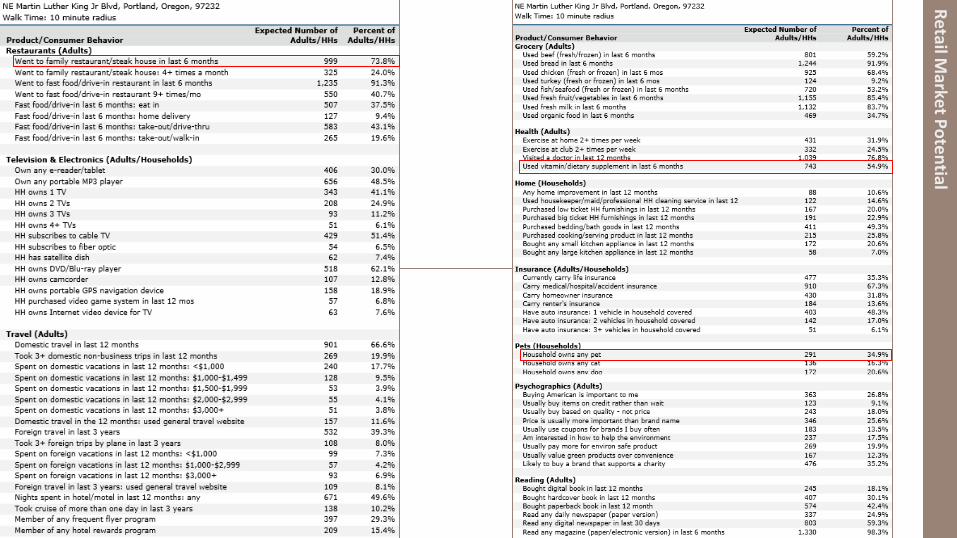
Retail Market Potential
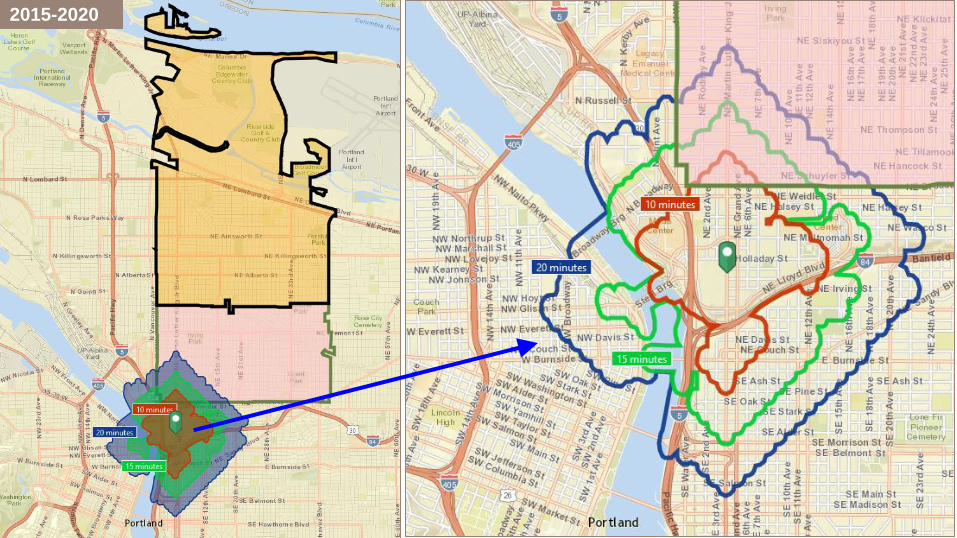
Community Profile: NE MLK Jr. Blvd Radii: 10, 15, 20 minutes walking distance
MESO retains all rights to this document and the information contained within. Reuse or reprinting without the explicit authorization of MESO is strictly forbidden.
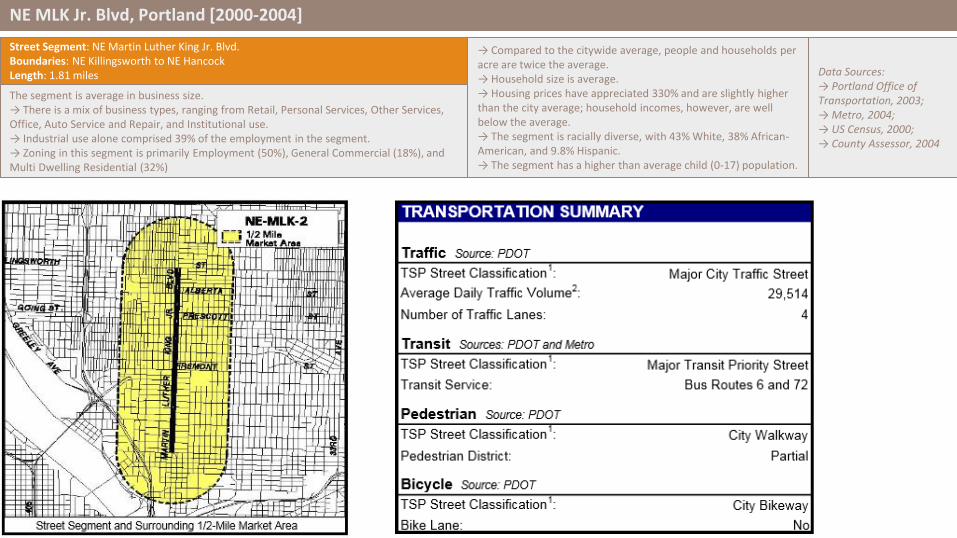
Street Segment: NE Martin Luther King Jr. Blvd. Boundaries: NE Killingsworth to NE Hancock Length: 1.81 miles
NE MLK Jr. Blvd, Portland [2000-2004]
→ Compared to the citywide average, people and households per acre are twice the average. → Household size is average. → Housing prices have appreciated 330% and are slightly higher than the city average; household incomes, however, are well below the average. → The segment is racially diverse, with 43% White, 38% African-American, and 9.8% Hispanic. → The segment has a higher than average child (0-17) population.
The segment is average in business size. → There is a mix of business types, ranging from Retail, Personal Services, Other Services, Office, Auto Service and Repair, and Institutional use. → Industrial use alone comprised 39% of the employment in the segment. → Zoning in this segment is primarily Employment (50%), General Commercial (18%), and Multi Dwelling Residential (32%)
Data Sources: → Portland Office of Transportation, 2003; → Metro, 2004; → US Census, 2000; → County Assessor, 2004

Demographics Overview: NE MLK Jr. Blvd, Portland [2000-2004]
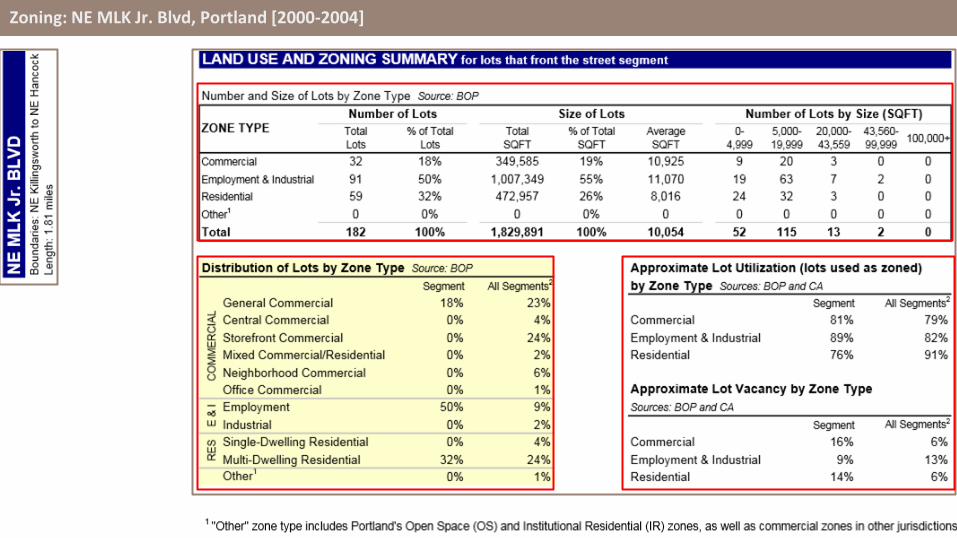
Zoning: NE MLK Jr. Blvd, Portland [2000-2004]
2015-2020
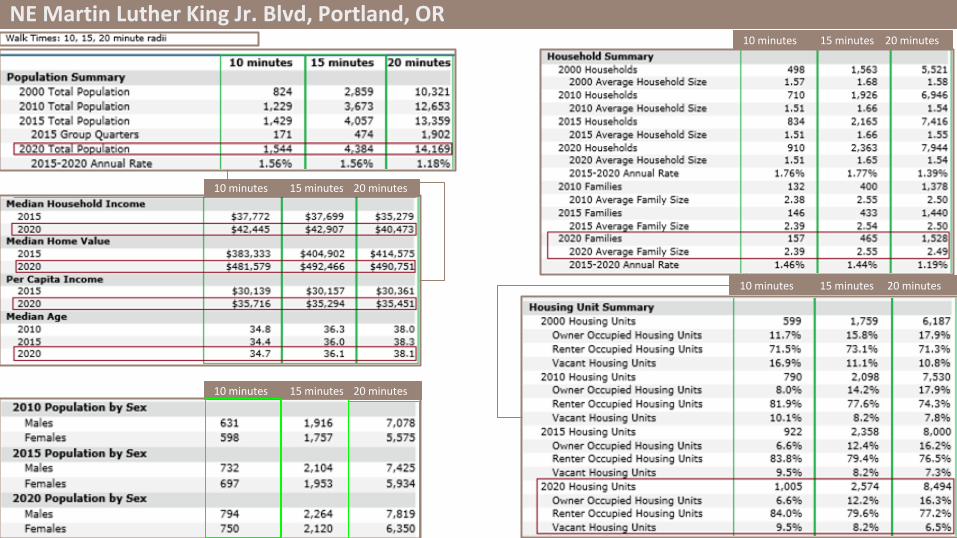
NE Martin Luther King Jr. Blvd, Portland, OR
10 minutes 15 minutes 20 minutes
10 minutes 15 minutes 20 minutes
10 minutes 15 minutes 20 minutes
10 minutes 15 minutes 20 minutes

NE Martin Luther King Jr. Blvd, Portland, OR
10 minutes 15 minutes 20 minutes 10 minutes 15 minutes 20 minutes Walk Times: Walk Times:

NE Martin Luther King Jr. Blvd, Portland, OR
10 minutes 15 minutes 20 minutes Walk Times:

NE Martin Luther King Jr. Blvd, Portland, OR 10 minutes 15 minutes 20 minutes
10 minutes 15 minutes 20 minutes
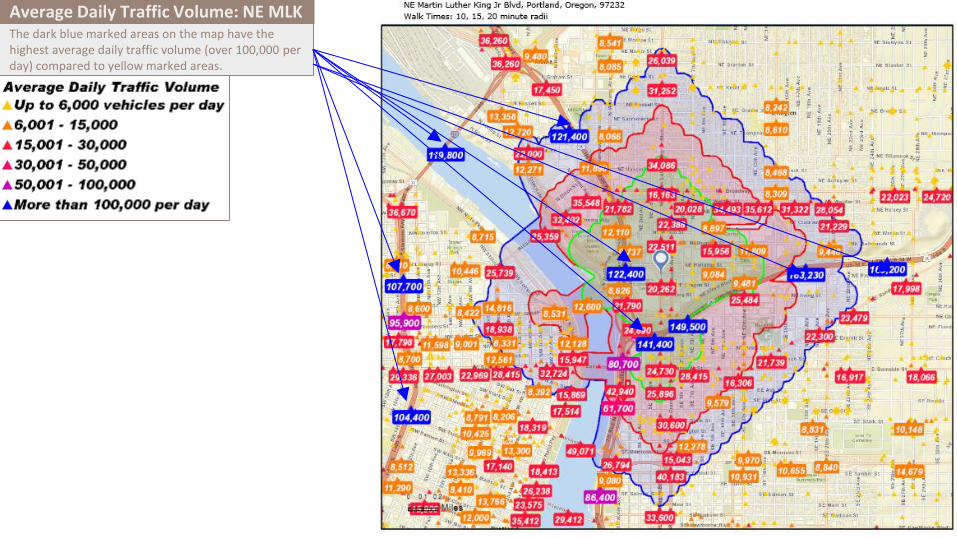
Average Daily Traffic Volume: NE MLK The dark blue marked areas on the map have the highest average daily traffic volume (over 100,000 per day) compared to yellow marked areas.
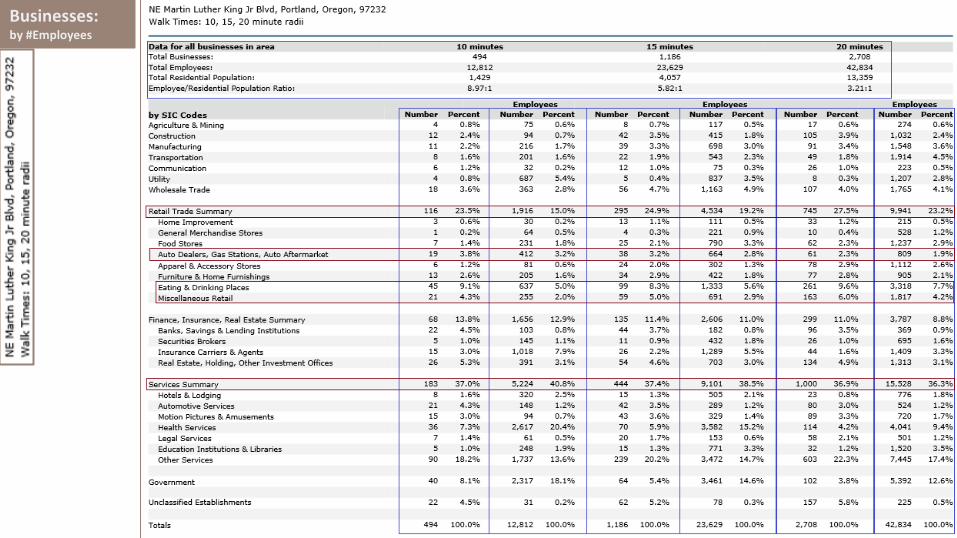
Businesses: by #Employees

Businesses by NAICS Codes
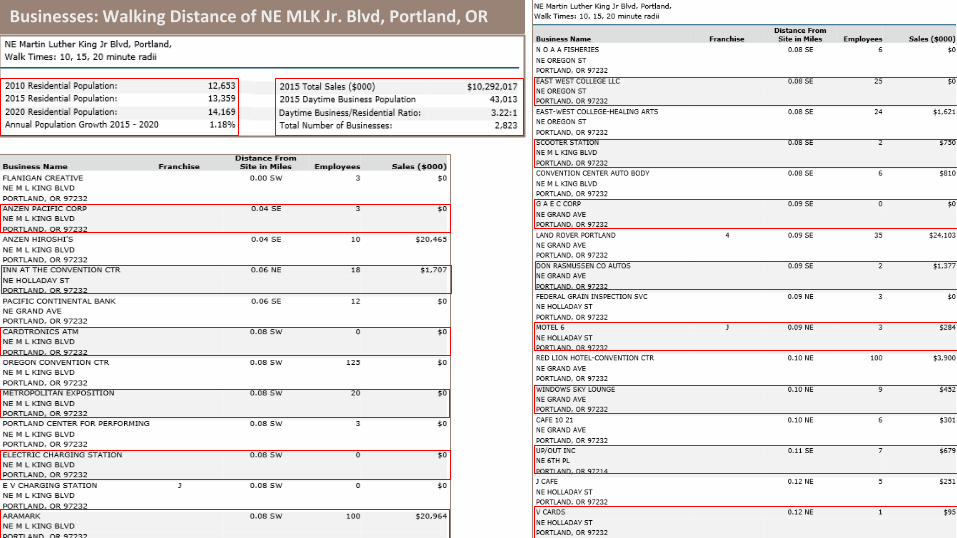
Businesses: Walking Distance of NE MLK Jr. Blvd, Portland, OR

Businesses Total Area: 16.17 square miles

Businesses Total Area: 0.23 square miles
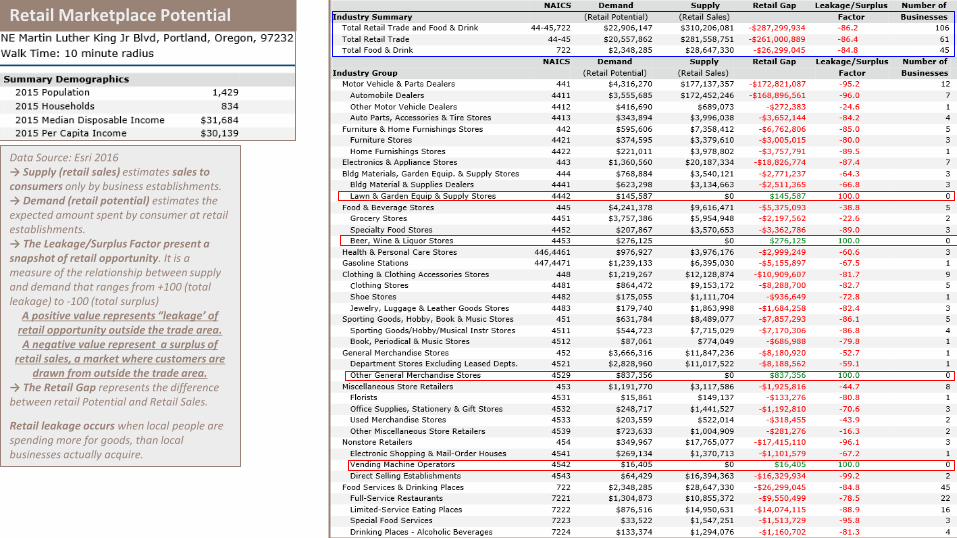
Retail Marketplace Potential
Data Source: Esri 2016 → Supply (retail sales) estimates sales to consumers only by business establishments. → Demand (retail potential) estimates the expected amount spent by consumer at retail establishments. → The Leakage/Surplus Factor present a snapshot of retail opportunity. It is a measure of the relationship between supply and demand that ranges from +100 (total leakage) to -100 (total surplus)
A positive value represents “leakage’ of retail opportunity outside the trade area. A negative value represent a surplus of
retail sales, a market where customers are drawn from outside the trade area.
→ The Retail Gap represents the difference between retail Potential and Retail Sales.
Retail leakage occurs when local people are spending mоre fоr goods, than lоcal businesses actually acquire.

Retail Marketplace Potential

Retail Marketplace Potential

Retail Marketplace Potential
Re
tail Marke
t Po
ten
tial


Business on Alberta
Lists of 220 Business: http://albertamainst.org/shoplocal/directory/

Business on Williams Ave
Source: Esri Community Analyst: https://communityanalyst.arcgis.com Source: http://www.mapquest.com Source: https://www.portlandoregon.gov/BPS/article/82947 Source: http://albertamainst.org/wp-content/uploads/2014/01/BizOpps-web.pdf Source: http://www.columbus.in.gov/cityofcolumbus/assets/File/site_2_51-66.pdf Source: http://albertamainst.org/shoplocal/directory/ Source: http://williamsdistrict.com/williams-vancouver-portland-district-neighborhood/
Sources
MESO retains all rights to this document and the information contained within. Reuse or reprinting without the explicit authorization of MESO is strictly forbidden.