marquette university comprehensive enrollment management ... · marquette university comprehensive...
TRANSCRIPT
Marquette University Comprehensive Enrollment Management Plan for 2016 to 2021December 2, 2015
Marquette University Comprehensive Enrollment Plan 2016-2021
December 2, 2015
Table of Contents
I. Executive Summary ................................................................................................................1
II. Process for Developing the Plan .............................................................................................2
III. Assumptions ............................................................................................................................2
a. Mission, Vision, and Guiding Values ...............................................................................2
b. Commitment to Access, Diversity, and Inclusion ............................................................3
c. Value of a Marquette Education .......................................................................................4
IV. National and Regional Trends ................................................................................................5
V. Enrollment Progress Update ...................................................................................................6
VI. Enrollment History, Trends, and Projections ..........................................................................8
a. Enrollment History and Trends .........................................................................................8
b. Diversity Profile ..............................................................................................................12
c. Summer Session ..............................................................................................................13
d. Enrollment Projections for 2016-2017............................................................................14
VII. Enrollment Goals and Strategies ...........................................................................................14
a. University Enrollment Management Goals ....................................................................15
b. Undergraduate Student Enrollment Goals ......................................................................17
c. Graduate, Professional, and Non-Traditional Learner Enrollment Goals .......................19
d. Summer Session and Online Delivery of Programs .......................................................20
VIII. Investment Strategies ............................................................................................................20
a. Investment in the Plan .....................................................................................................20
b. Financial Aid and Fundraising ........................................................................................21
IX. Next Steps .............................................................................................................................22

1
I. Executive Summary
Developing a mission-driven, campus-wide, and forward-looking Enrollment Plan was identified as
a key strategic initiative to advance the goal of academic excellence in the 2013 University Strategic
Plan Beyond Boundaries. Informed by an inclusive and collaborative enrollment planning process,
the plan is inspired by Marquette University’s mission, vision and values and is responsive to
dynamic demographic, socio-cultural, economic and educational trends and forces. The five year
plan for the academic years 2016 to 2021 is intended to be a living document for the University
community that will be reviewed and updated annually. The plan is a roadmap for developing long
term, university-wide enrollment goals and strategies, determining potential areas of growth and
program innovation, and identifying the support and resources needed to achieve enrollment and
student outcomes goals. The plan presents a set of overarching, university-wide goals, objectives,
and strategies and specific goals, objectives, and strategies for major enrollment groups including
undergraduate, graduate, professional and summer students.
The goals and strategies include organizational and cultural changes designed to result in a more
comprehensive and strategic approach to enrollment management. Specific student enrollment goals
are to: maintain undergraduate enrollment in the short term while building the resources needed for
future growth; aggressively grow professional masters’ programs; focus diversity goals on growing
populations, especially Hispanic and Latino students; and replace current degree programs for adult
learners with programs that are more competitive and responsive to the market.
Key enrollment priorities are:
Create an organizational structure, processes, and environment that integrate enrollment
management across the campus supported by a culture of shared responsibility and
accountability for enrollment
Grow undergraduate enrollment strategically by building capacity in high demand programs,
increasing funded financial aid, and investing in student support services, with the long term
goal of increasing quality and diversity
Align enrollment diversity goals with the priorities of the new Diversity Plan, achieve
established diversity goals for faculty, students, and staff, and build a more inclusive and
supportive environment and climate to maximize student success
Revitalize graduate education by investing in marketing and recruitment to expand enrollment
in existing programs and developing new innovative programs that meet market needs
Assess opportunities for adult and non-traditional audiences and identify and develop a small
number of niche programs that appeal to students and employers in the regional market
2
II. Process for Developing the Plan
In fall 2013, nine committees that included more than 200 faculty and administrators were
established by the Provost to conduct a SWOT analysis and develop recommendations on current
recruitment and enrollment strategies for the following student groups – traditional freshmen,
graduate and professional, non-traditional adult students, transfer students, summer session, and
international students. Strategic support areas such as student retention and support, online courses
and programming, and pricing and financial aid strategies were addressed by three additional
committees.
In summer 2014, a consulting firm was engaged to conduct primary and secondary research and
develop a set of recommendations to address future challenges for traditional undergraduate student
recruitment and enrollment. Meetings were held with more than 150 faculty and administrators and
senior leadership to understand Marquette’s mission and vision as well as challenges and
opportunities. The recommendations for undergraduate enrollment provided by the consultant were
vetted and approved by senior leadership and have been incorporated as goals in the plan.
To better understand both the challenges and opportunities in a declining graduate education market,
the consultant who worked on undergraduate enrollment strategies was engaged to do the same for
graduate programs, particularly professional masters’ programs. Their analysis and
recommendations, completed in fall 2015, have been reviewed and an implementation plan will be
developed under the leadership of the incoming Dean of the Graduate School. New strategies to
reach the non-traditional adult learner are under development, recognizing that the current approach
focused on degree completion was not sustainable given the increasing competitiveness of the
regional market. International students and summer session programs are also addressed in the plan.
Online undergraduate summer session courses have been growing and online delivery of courses and
programs has been adopted for a variety of graduate and professional programs, but a more
comprehensive online strategy is needed. Appendix I contains the timeline for the development of
the plan.
III. Assumptions
a. Mission, Vision, and Guiding Values
The Strategic Plan Beyond Boundaries serves as the foundation for the Enrollment Plan as embodied
by its defining statements of Marquette’s university mission and identity as a Jesuit Catholic
university. As a destination university, Marquette continues, and must continue, to be a beacon of
3
Jesuit Catholic higher education above and beyond not only peer institutions, but also universities
within that same tradition.
Historically and currently, a Marquette education transforms students and society. The Enrollment
Plan is designed not merely to be reactive to socio-cultural demographics, economic deviations, and
student demands, but to be educationally responsive to the needs of others. It exudes who we are
and should be as a Jesuit Catholic university. Authentic and aspirational, the Enrollment Plan is an
expression of the difference we demand and the Guiding Values recently adopted by the University
community.
b. Commitment to Access, Diversity and Inclusion
As a Jesuit Catholic university, Marquette strives to educate the whole person and thus, an integral
part of the Enrollment Plan will be to strengthen university support of access, diversity, and
inclusion. The commitment to recruit, enroll, and graduate diverse students will require that we
expand our current efforts to reach qualified underrepresented students, evaluate our financial aid
strategies to assure that we are providing the aid needed to attract the diverse students we desire, and
offer the student support services essential to continuing to improve the minority student outcomes.
It also requires increasing our support for both curricular and co-curricular opportunities for all
students as well as providing a welcoming environment with a diverse faculty, staff and leadership
team.
To advance its long-standing commitment to diversity and inclusion, Marquette is finalizing a
comprehensive, campus-wide Diversity Plan. Common goals and objectives in the Enrollment Plan
“Just as the earliest Jesuits embraced the values of humanism, the Marquette community is
committed to developing each individual’s full potential across the entire range of human
experience. In an increasingly diverse environment, we will continue to draw on our special gift for
intellectual, emotional and spiritual transformation.”
“Marquette students, faculty, staff and alumni live out a deep commitment to serving others and
promoting solidarity and the common good. As a Catholic and Jesuit university, Marquette has a
special responsibility to contribute to needed solutions for urgent problems.”
Marquette is further distinguished by offering a professional education informed by the humanities
and the sciences.”
Beyond Boundaries, Marquette University Strategic Plan 2013
4
and the Diversity Plan will reinforce and strengthen our stated
value to “nurture an inclusive, diversity community that fosters
new opportunities, partnerships, collaboration and vigorous yet
respectful debate.”
Diversity goals include both increasing our student diversity
and providing critical student support service for all students.
Specifically, our diversity recruitment strategy is designed to
reach all minorities, with a special focus on the growing Latino
and Hispanic population of students who are seeking a Catholic
education. We have made great progress in recruiting and
admitting underrepresented student groups, increasing overall
diversity from 24% to 29% over the past 5 years. To build on
this progress and achieve even greater diversity will require that
we first assure that we have critical resources such as financial
aid and student support systems in place.
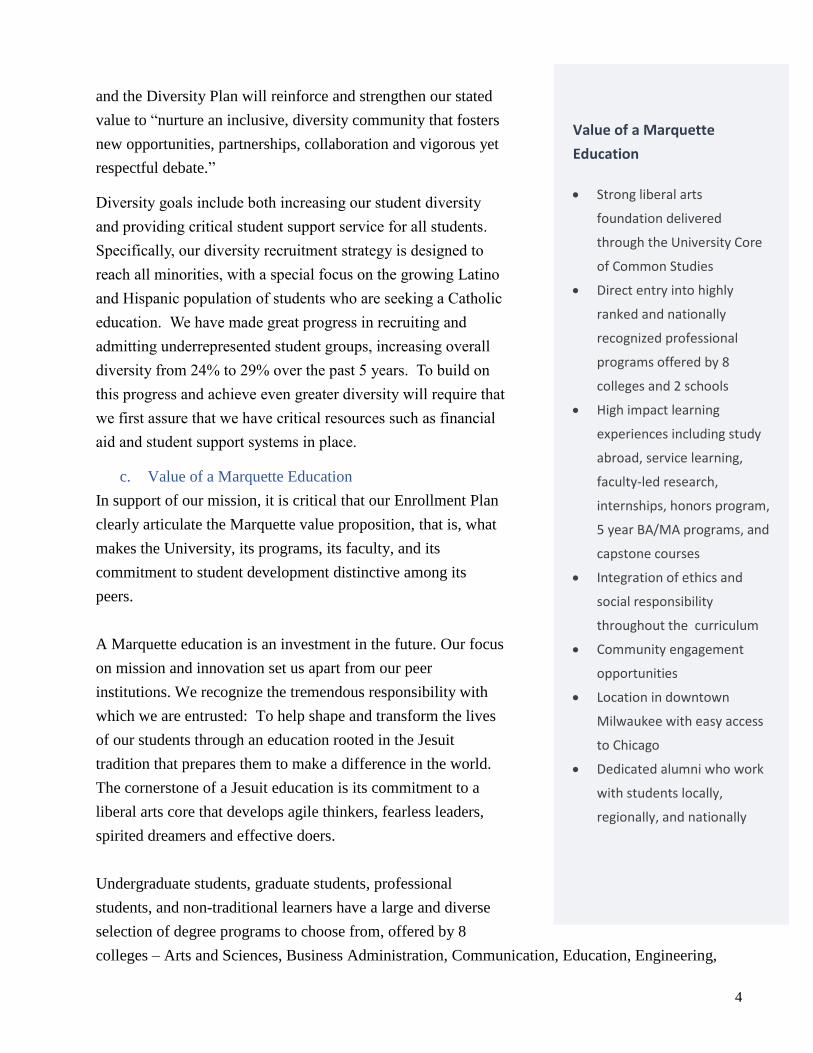
c. Value of a Marquette Education
In support of our mission, it is critical that our Enrollment Plan
clearly articulate the Marquette value proposition, that is, what
makes the University, its programs, its faculty, and its
commitment to student development distinctive among its
peers.
A Marquette education is an investment in the future. Our focus
on mission and innovation set us apart from our peer
institutions. We recognize the tremendous responsibility with
which we are entrusted: To help shape and transform the lives
of our students through an education rooted in the Jesuit
tradition that prepares them to make a difference in the world.
The cornerstone of a Jesuit education is its commitment to a
liberal arts core that develops agile thinkers, fearless leaders,
spirited dreamers and effective doers.
Undergraduate students, graduate students, professional
students, and non-traditional learners have a large and diverse
selection of degree programs to choose from, offered by 8
colleges – Arts and Sciences, Business Administration, Communication, Education, Engineering,
Value of a Marquette
Education
Strong liberal arts
foundation delivered
through the University Core
of Common Studies
Direct entry into highly
ranked and nationally
recognized professional
programs offered by 8
colleges and 2 schools
High impact learning
experiences including study
abroad, service learning,
faculty-led research,
internships, honors program,
5 year BA/MA programs, and
capstone courses
Integration of ethics and
social responsibility
throughout the curriculum
Community engagement
opportunities
Location in downtown
Milwaukee with easy access
to Chicago
Dedicated alumni who work
with students locally,
regionally, and nationally
5
Health Sciences, Nursing and Professional Studies, and the schools of Dentistry and Law. With the
underpinning of a strong liberal arts foundation, these programs prepare students for meaningful
careers and for a life of service.
Our on-going commitment to high impact learning experiences is implemented in and outside the
classroom. A strength of Marquette is its numerous opportunities for co-curricular experiences
including first year seminars, study abroad, community service, internships, faculty-led research
programs, 5 year degree programs, and capstone courses.
Our students gain experience with ethical challenges related to their profession through exploring
real world scenarios, discussing human behavior and practices and reflecting upon their
responsibility as a graduate from a Jesuit Catholic university. With our applied learning experiences,
students have the opportunity to put principles of ethics and social responsibility into action.
Marquette students are deeply engaged in the university and local community as a whole. Marquette
provides challenging and transformative opportunities for students to develop not only in the
classroom but also in their daily lives.
Marquette's downtown Milwaukee location provides students with an abundance of "real world"
experience through jobs, internships and clinical placements. The university's commitment to our
city is evident through scholarship, service and a focus on providing expertise to make Milwaukee a
leader in innovation and ideas.
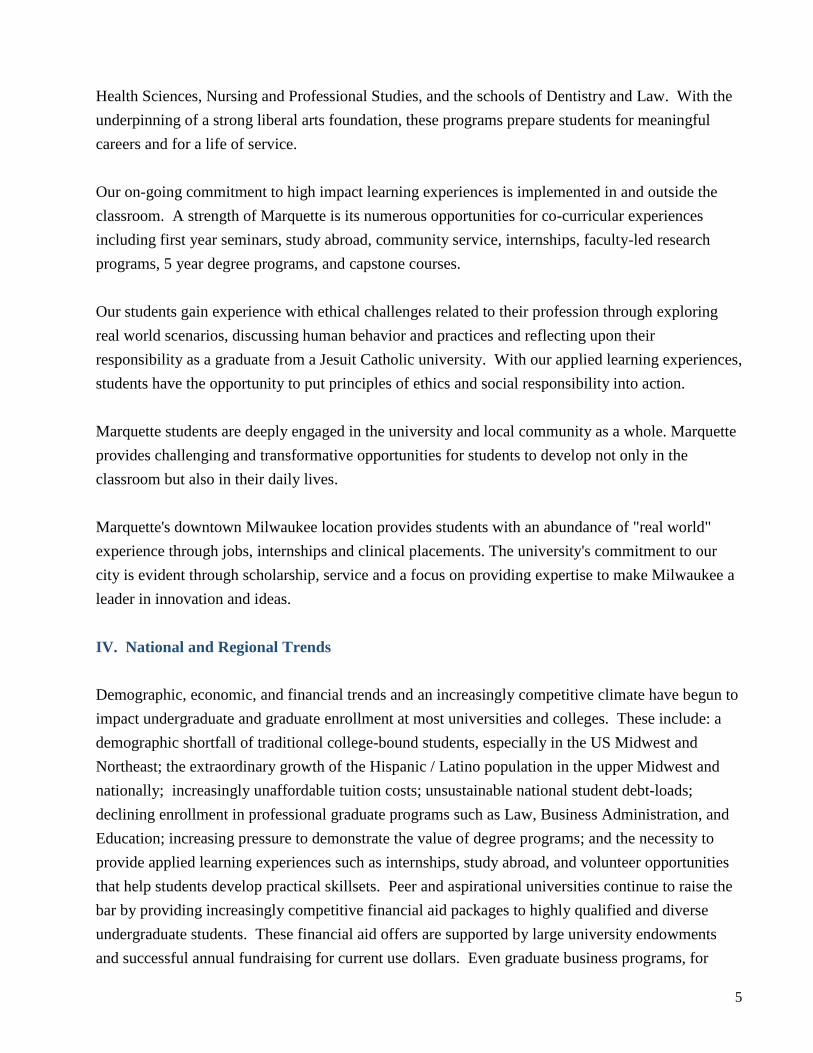
IV. National and Regional Trends
Demographic, economic, and financial trends and an increasingly competitive climate have begun to
impact undergraduate and graduate enrollment at most universities and colleges. These include: a
demographic shortfall of traditional college-bound students, especially in the US Midwest and
Northeast; the extraordinary growth of the Hispanic / Latino population in the upper Midwest and
nationally; increasingly unaffordable tuition costs; unsustainable national student debt-loads;
declining enrollment in professional graduate programs such as Law, Business Administration, and
Education; increasing pressure to demonstrate the value of degree programs; and the necessity to
provide applied learning experiences such as internships, study abroad, and volunteer opportunities
that help students develop practical skillsets. Peer and aspirational universities continue to raise the
bar by providing increasingly competitive financial aid packages to highly qualified and diverse
undergraduate students. These financial aid offers are supported by large university endowments
and successful annual fundraising for current use dollars. Even graduate business programs, for
6
which tuition was typically subsidized by employers, are
beginning to offer significant donor and university-funded
graduate scholarships to attract the best students. This has
resulted in an arms race of financial aid that has lowered
net tuition revenue despite rising tuition. Dramatic changes
are also taking place in the adult learner market as the
number of adult learners is projected to grow over the next
decade. Here, there is potential for program growth, but
other trends such as flexible degree options, credit for prior
learning, online learning, and increasing price competition
are changing this competitive market.
Globalization is also changing the higher education
landscape with the growth of on-ground and online
universities and colleges across the globe, especially in
emerging economies. More alternative pathways for
learning and obtaining academic credentials are currently
available and accessible at a lower cost. These include
online classes, massive open online courses (MOOCs) and
other open access courses and degree programs offered by
prestigious universities and taught by world-renowned
experts across all disciplines. Finally, Moody’s and other
industry observers are carefully monitoring the financial
performance of universities and colleges, especially in view
of increasing costs and decreasing margins.
V. Enrollment Progress Update
The SWOT analysis and recommendations of the enrollment committees, national and regional
trends and the data and recommendations provided by the consultant in fall 2014, have motivated
Marquette to begin to chart a new course in enrollment management. In particular, the following
strategies have been initiated in fall 2015.
Freshman and Transfer Students
Freshmen enrollment goals have historically been met and exceeded and Marquette has repeatedly
overachieved its projected retention rate as reported by US News and World Report. However, the
predicted decline in undergraduate applications occurred with the class of 2015 and freshman
Responding to the Environment
Strategically expand
recruitment area
Build stronger relationships
with the Latino / Hispanic
community to increase
diversity
Award more competitive
scholarships to highly
qualified students
Engage the campus in yield
activities
Establish an “incubator” to
support new graduate and
professional masters’
program development
Expand graduate and
professional program
marketing and recruitment
efforts, especially in Business
Administration
7
enrollment goals for fall 2015, set higher than the previous year, were not achieved. This is the first
time in at least 15 years that the number of new freshman applications has declined at Marquette.
Much has been invested in achieving transfer student goals and while critical changes have been
made, goals for transfer students for fall 2015 were not achieved, but the downward trend was
reversed.
In response to changing demographics and an increasingly competitive environment, Marquette is
investing additional resources in undergraduate recruitment. Recognizing the opportunity in
Minnesota, a regional representative will be based in the Twin Cities in fall 2016. Opportunities in
other regions will be explored after careful assessment. Additional recruitment efforts will be
focused on growing student groups such as Latino students and other ethnic minorities. The campus
will be engaged in strengthening yield efforts.
Graduate Programs
Following a national trend, enrollment and, consequently, financial contribution from net tuition
revenue, in Business Administration, Education and Law, is experiencing a decline. It is unclear
whether Graduate Business and Law School enrollments will reach a turning point, that is, begin to
return to their previous level or if the current trend is moving toward a lower steady state.
Enrollment in Marquette’s specialized master’s programs in business are declining while reports
from the Graduate Management Admission Council (GMAC) show there has been a consistent
increase in these types of programs over the past 5 years, thus presenting an opportunity for growth.
Changes are underway at the College of Business Administration to address these challenges.
Additional recruitment support (e.g., personnel and operating budget) will be provided for the MBA
program, as well as more investment of time and resources into increasing applications and yield for
specialized masters’ programs. Recruiting, admitting and serving international students will
continue to be critical to achieve enrollment goals. Identifying and developing innovative, market-
driven programs and delivery methods will need to become part of the long term strategy to
revitalize graduate business education at Marquette. The Graduate School of Management (GSM)
will undergo a focused program review to explore options for growth in spring 2016.
Additional Growth Opportunities
Marquette’s broad array of graduate programs – doctoral, masters’ and professional programs – offer
a range of options for future growth, especially 5 year programs and interdisciplinary programs. In
fall 2015, the new STEM / MBA was launched. A professional masters’ in Corporate
Communication, a joint endeavor between Business Administration and the College of
Communication, is scheduled to be offered in 2016.
8
While diversity and internationalization has increased for all programs at Marquette, continuing to
make strides in these areas is aligned with our mission as a Jesuit Catholic university and is a high
priority. As part of its enrollment strategy, Marquette will increase its global diversity, as it has been
heavily dependent on China. Discussions are underway with Jesuit partners in countries in South
America and Latin America to expand enrollment in existing undergraduate and graduate programs.
Online program development has been mainly focused on summer session courses and individual
programs (e.g., hybrid Executive MBA, Nursing graduate programs). Marquette does not have a
comprehensive approach to online learning. As the adult learner market is explored, hybrid or fully
online programs will be considered.
Summer session is currently stewarded by the members of the Summer Session Enrollment
Committee and there is an opportunity to expand summer offerings, especially certificate,
enrichment, and resume-enhancing programs for current students.
Financial aid for graduate programs is administered separately from undergraduate financial aid.
Strategies guiding the distribution of graduate financial aid have not been reviewed for many years
and graduate financial aid will be evaluated for effectiveness in achieving graduate enrollment goals
and impact on net tuition revenue.
VI. Enrollment History, Trends, and Projections
In this section, we provide a brief analysis of enrollment history and trends for undergraduate,
graduate, professional, and non-traditional learners and present campus-wide diversity trends. We
examine a five year history of summer enrollment and projections for the coming year. Appendices
II – V contain the enrollment history that supports the following trend analysis.
a. Enrollment History and Trends
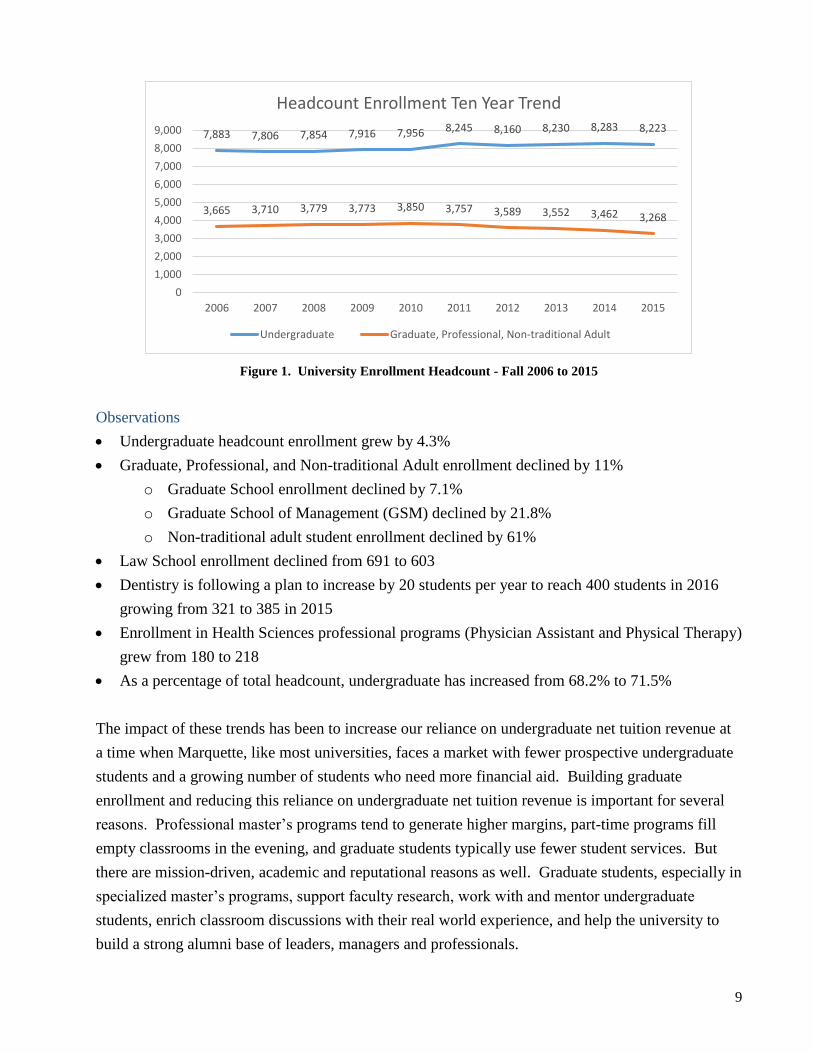
We first review the overall enrollment for the University by headcount for fall semester over the past
10 years, comparing undergraduate with the totality of graduate, professional (Law, Dental, and
Health Sciences), and non-traditional adult (College of Professional Studies) enrollment.
9
Figure 1. University Enrollment Headcount - Fall 2006 to 2015
Observations
Undergraduate headcount enrollment grew by 4.3%
Graduate, Professional, and Non-traditional Adult enrollment declined by 11%
o Graduate School enrollment declined by 7.1%
o Graduate School of Management (GSM) declined by 21.8%
o Non-traditional adult student enrollment declined by 61%
Law School enrollment declined from 691 to 603
Dentistry is following a plan to increase by 20 students per year to reach 400 students in 2016
growing from 321 to 385 in 2015
Enrollment in Health Sciences professional programs (Physician Assistant and Physical Therapy)
grew from 180 to 218
As a percentage of total headcount, undergraduate has increased from 68.2% to 71.5%
The impact of these trends has been to increase our reliance on undergraduate net tuition revenue at
a time when Marquette, like most universities, faces a market with fewer prospective undergraduate
students and a growing number of students who need more financial aid. Building graduate
enrollment and reducing this reliance on undergraduate net tuition revenue is important for several
reasons. Professional master’s programs tend to generate higher margins, part-time programs fill
empty classrooms in the evening, and graduate students typically use fewer student services. But
there are mission-driven, academic and reputational reasons as well. Graduate students, especially in
specialized master’s programs, support faculty research, work with and mentor undergraduate
students, enrich classroom discussions with their real world experience, and help the university to
build a strong alumni base of leaders, managers and professionals.
7,883 7,806 7,854 7,916 7,956 8,245 8,160 8,230 8,283 8,223
3,665 3,710 3,779 3,773 3,850 3,757 3,589 3,552 3,462 3,268
0
1,000
2,000
3,000
4,000
5,000
6,000
7,000
8,000
9,000
2006 2007 2008 2009 2010 2011 2012 2013 2014 2015
Headcount Enrollment Ten Year Trend
Undergraduate Graduate, Professional, Non-traditional Adult
10
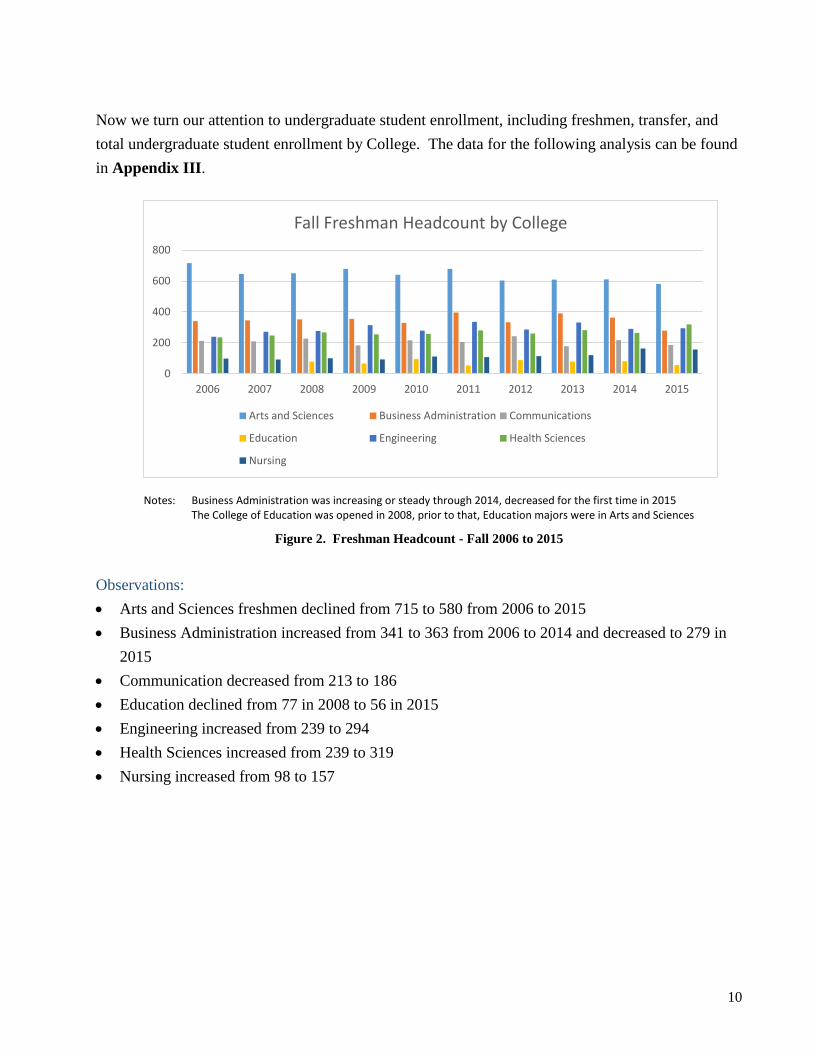
Now we turn our attention to undergraduate student enrollment, including freshmen, transfer, and
total undergraduate student enrollment by College. The data for the following analysis can be found
in Appendix III.
Notes: Business Administration was increasing or steady through 2014, decreased for the first time in 2015 The College of Education was opened in 2008, prior to that, Education majors were in Arts and Sciences
Figure 2. Freshman Headcount - Fall 2006 to 2015
Observations:
Arts and Sciences freshmen declined from 715 to 580 from 2006 to 2015
Business Administration increased from 341 to 363 from 2006 to 2014 and decreased to 279 in
2015
Communication decreased from 213 to 186
Education declined from 77 in 2008 to 56 in 2015
Engineering increased from 239 to 294
Health Sciences increased from 239 to 319
Nursing increased from 98 to 157
0
200
400
600
800
2006 2007 2008 2009 2010 2011 2012 2013 2014 2015
Fall Freshman Headcount by College
Arts and Sciences Business Administration Communications
Education Engineering Health Sciences
Nursing
11
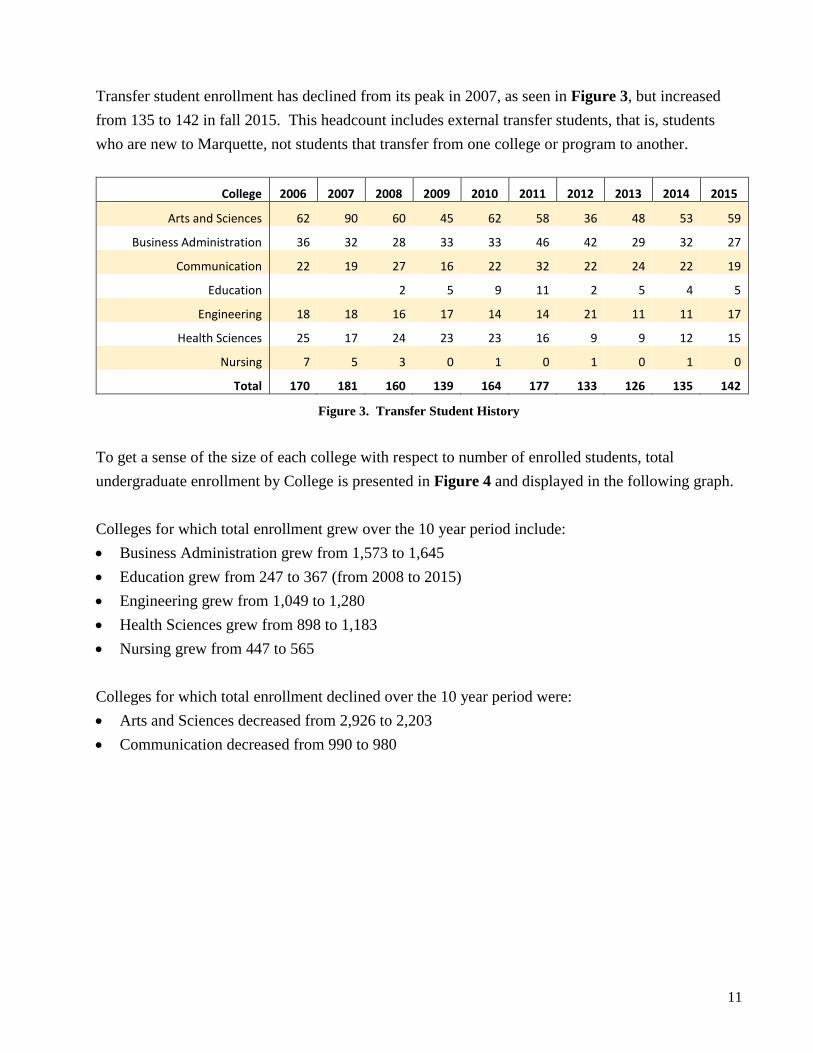
Transfer student enrollment has declined from its peak in 2007, as seen in Figure 3, but increased
from 135 to 142 in fall 2015. This headcount includes external transfer students, that is, students
who are new to Marquette, not students that transfer from one college or program to another.
College 2006 2007 2008 2009 2010 2011 2012 2013 2014 2015
Arts and Sciences 62 90 60 45 62 58 36 48 53 59
Business Administration 36 32 28 33 33 46 42 29 32 27
Communication 22 19 27 16 22 32 22 24 22 19
Education 2 5 9 11 2 5 4 5
Engineering 18 18 16 17 14 14 21 11 11 17
Health Sciences 25 17 24 23 23 16 9 9 12 15
Nursing 7 5 3 0 1 0 1 0 1 0
Total 170 181 160 139 164 177 133 126 135 142
Figure 3. Transfer Student History
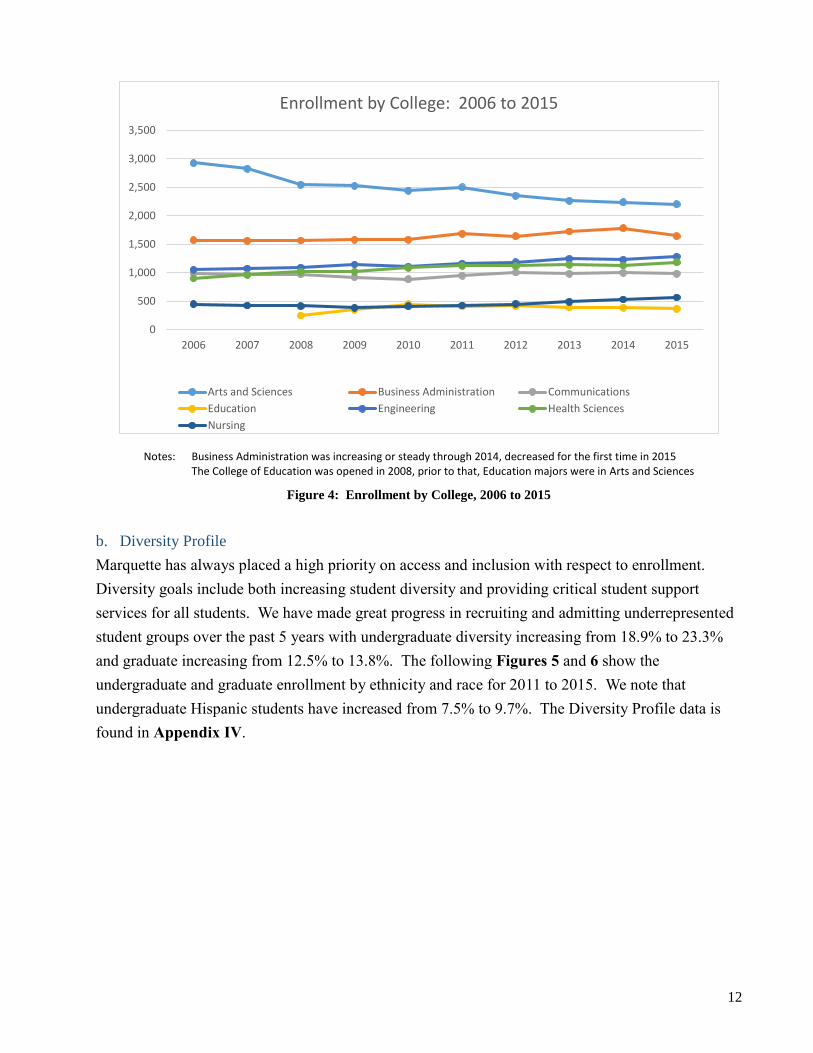
To get a sense of the size of each college with respect to number of enrolled students, total
undergraduate enrollment by College is presented in Figure 4 and displayed in the following graph.
Colleges for which total enrollment grew over the 10 year period include:
Business Administration grew from 1,573 to 1,645
Education grew from 247 to 367 (from 2008 to 2015)
Engineering grew from 1,049 to 1,280
Health Sciences grew from 898 to 1,183
Nursing grew from 447 to 565
Colleges for which total enrollment declined over the 10 year period were:
Arts and Sciences decreased from 2,926 to 2,203
Communication decreased from 990 to 980
12
Notes: Business Administration was increasing or steady through 2014, decreased for the first time in 2015 The College of Education was opened in 2008, prior to that, Education majors were in Arts and Sciences
Figure 4: Enrollment by College, 2006 to 2015
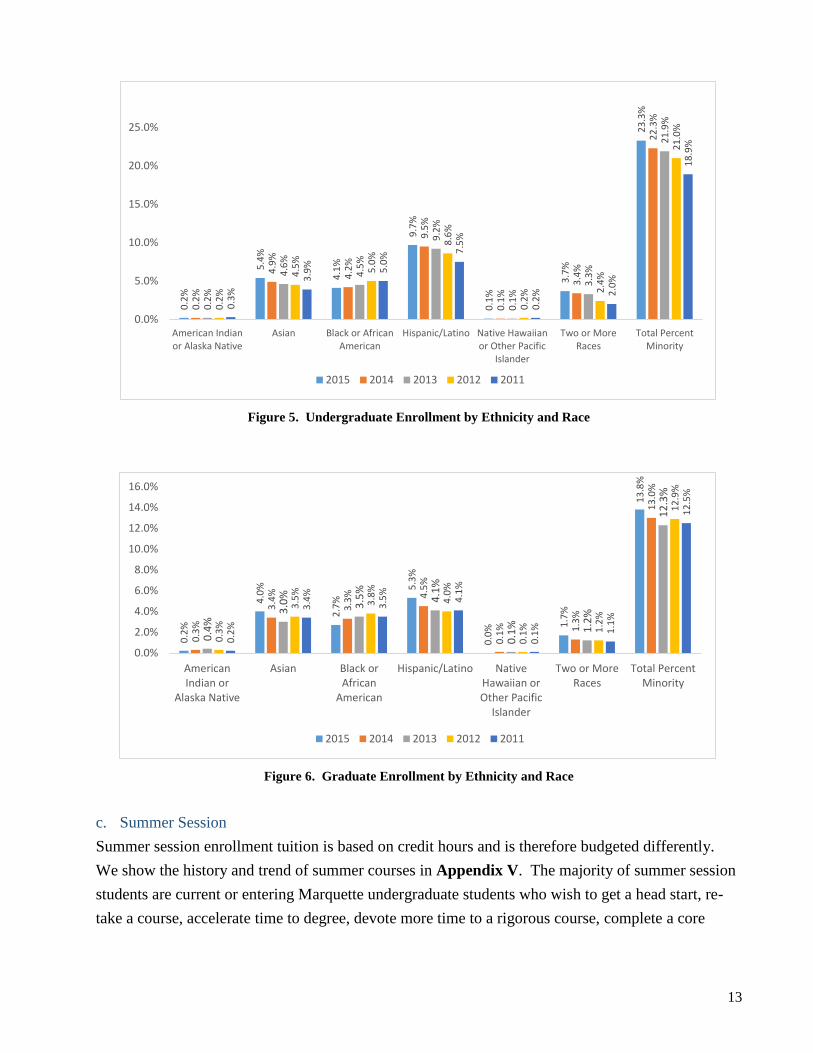
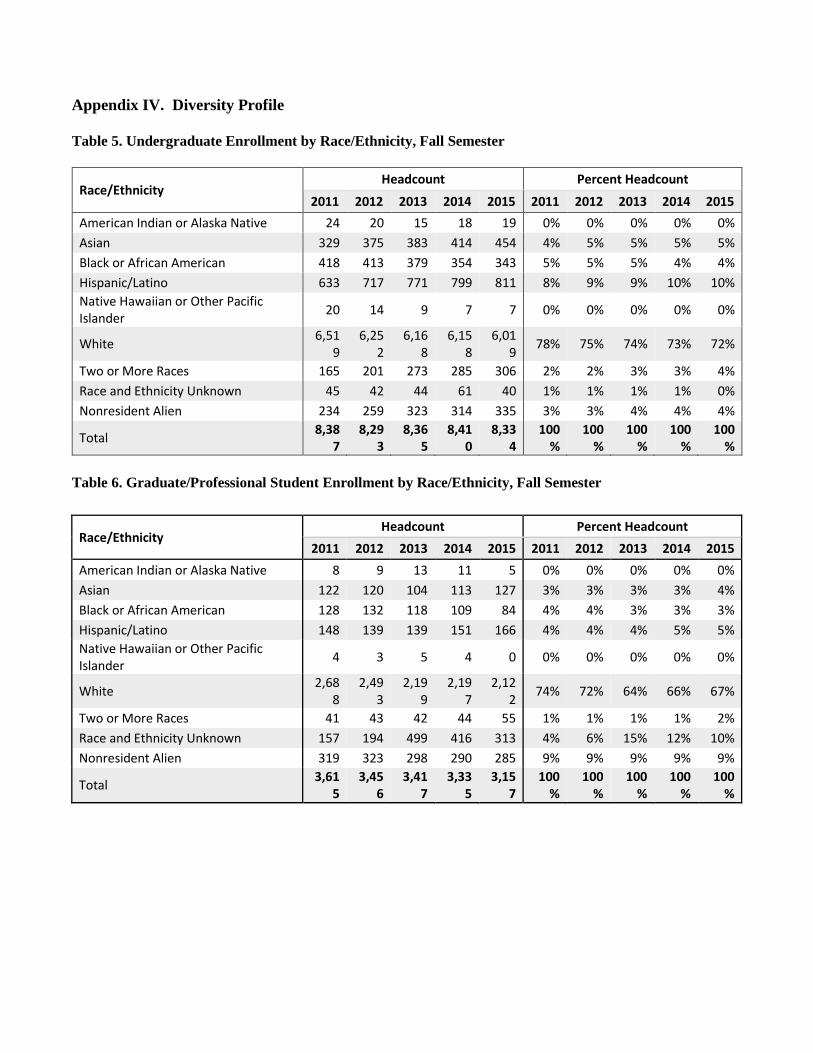
b. Diversity Profile
Marquette has always placed a high priority on access and inclusion with respect to enrollment.
Diversity goals include both increasing student diversity and providing critical student support
services for all students. We have made great progress in recruiting and admitting underrepresented
student groups over the past 5 years with undergraduate diversity increasing from 18.9% to 23.3%
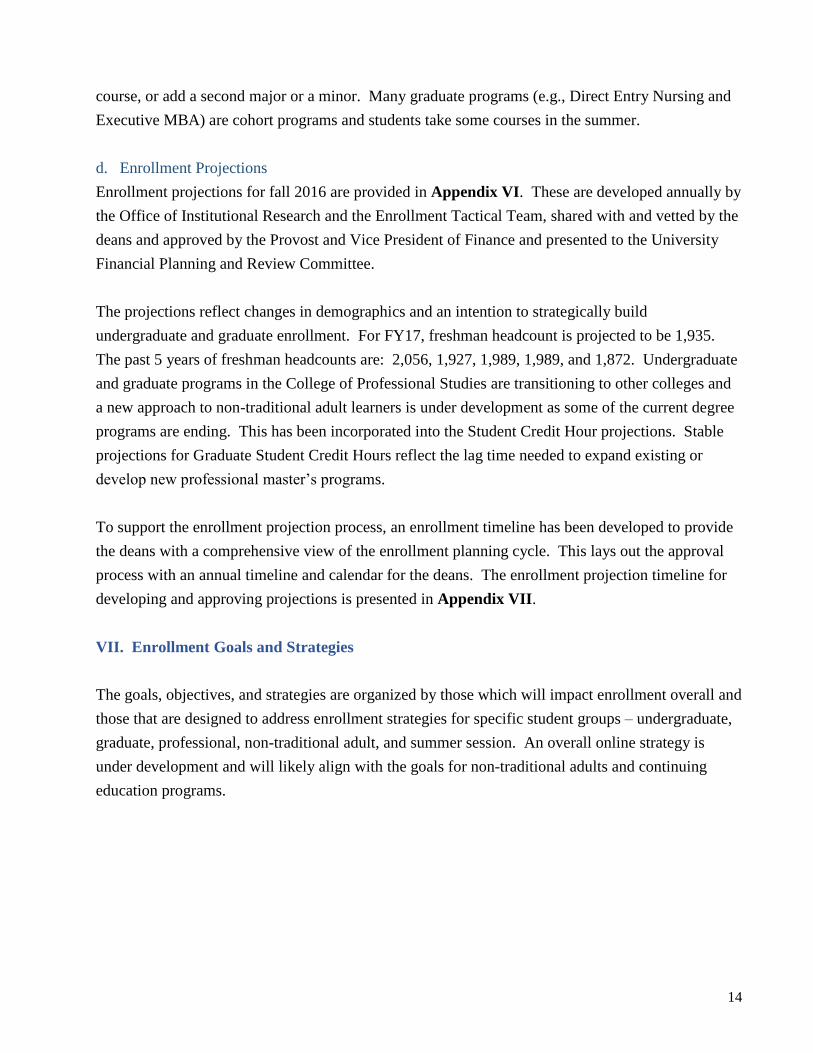
and graduate increasing from 12.5% to 13.8%. The following Figures 5 and 6 show the
undergraduate and graduate enrollment by ethnicity and race for 2011 to 2015. We note that
undergraduate Hispanic students have increased from 7.5% to 9.7%. The Diversity Profile data is
found in Appendix IV.
0
500
1,000
1,500
2,000
2,500
3,000
3,500
2006 2007 2008 2009 2010 2011 2012 2013 2014 2015
Enrollment by College: 2006 to 2015
Arts and Sciences Business Administration Communications
Education Engineering Health Sciences
Nursing
13
Figure 5. Undergraduate Enrollment by Ethnicity and Race
Figure 6. Graduate Enrollment by Ethnicity and Race
c. Summer Session
Summer session enrollment tuition is based on credit hours and is therefore budgeted differently.
We show the history and trend of summer courses in Appendix V. The majority of summer session
students are current or entering Marquette undergraduate students who wish to get a head start, re-
take a course, accelerate time to degree, devote more time to a rigorous course, complete a core
0.2
%
5.4
%
4.1
%
9.7
%
0.1
%
3.7
%
23
.3%
0.2
%
4.9
%
4.2
%
9.5
%
0.1
%
3.4
%
22
.3%
0.2
%
4.6
%
4.5
%
9.2
%
0.1
%
3.3
%
21
.9%
0.2
%
4.5
%
5.0
%
8.6
%
0.2
% 2.4
%
21
.0%
0.3
%
3.9
% 5.0
%
7.5
%
0.2
% 2.0
%
18
.9%
0.0%
5.0%
10.0%
15.0%
20.0%
25.0%
American Indianor Alaska Native
Asian Black or AfricanAmerican
Hispanic/Latino Native Hawaiianor Other Pacific
Islander
Two or MoreRaces
Total PercentMinority
2015 2014 2013 2012 2011
0.2
%
4.0
%
2.7
%
5.3
%
0.0
% 1.7
%
13
.8%
0.3
%
3.4
%
3.3
% 4.5
%
0.1
% 1.3
%
13
.0%
0.4
%
3.0
%
3.5
%
4.1
%
0.1
% 1.2
%
12
.3%
0.3
%
3.5
%
3.8
%
4.0
%
0.1
% 1.2
%
12
.9%
0.2
%
3.4
%
3.5
%
4.1
%
0.1
% 1.1
%
12
.5%
0.0%
2.0%
4.0%
6.0%
8.0%
10.0%
12.0%
14.0%
16.0%
AmericanIndian or
Alaska Native
Asian Black orAfrican
American
Hispanic/Latino NativeHawaiian orOther Pacific
Islander
Two or MoreRaces
Total PercentMinority
2015 2014 2013 2012 2011
14
course, or add a second major or a minor. Many graduate programs (e.g., Direct Entry Nursing and
Executive MBA) are cohort programs and students take some courses in the summer.
d. Enrollment Projections
Enrollment projections for fall 2016 are provided in Appendix VI. These are developed annually by
the Office of Institutional Research and the Enrollment Tactical Team, shared with and vetted by the
deans and approved by the Provost and Vice President of Finance and presented to the University
Financial Planning and Review Committee.
The projections reflect changes in demographics and an intention to strategically build
undergraduate and graduate enrollment. For FY17, freshman headcount is projected to be 1,935.
The past 5 years of freshman headcounts are: 2,056, 1,927, 1,989, 1,989, and 1,872. Undergraduate
and graduate programs in the College of Professional Studies are transitioning to other colleges and
a new approach to non-traditional adult learners is under development as some of the current degree
programs are ending. This has been incorporated into the Student Credit Hour projections. Stable
projections for Graduate Student Credit Hours reflect the lag time needed to expand existing or
develop new professional master’s programs.
To support the enrollment projection process, an enrollment timeline has been developed to provide
the deans with a comprehensive view of the enrollment planning cycle. This lays out the approval
process with an annual timeline and calendar for the deans. The enrollment projection timeline for
developing and approving projections is presented in Appendix VII.
VII. Enrollment Goals and Strategies
The goals, objectives, and strategies are organized by those which will impact enrollment overall and
those that are designed to address enrollment strategies for specific student groups – undergraduate,
graduate, professional, non-traditional adult, and summer session. An overall online strategy is
under development and will likely align with the goals for non-traditional adults and continuing
education programs.
15
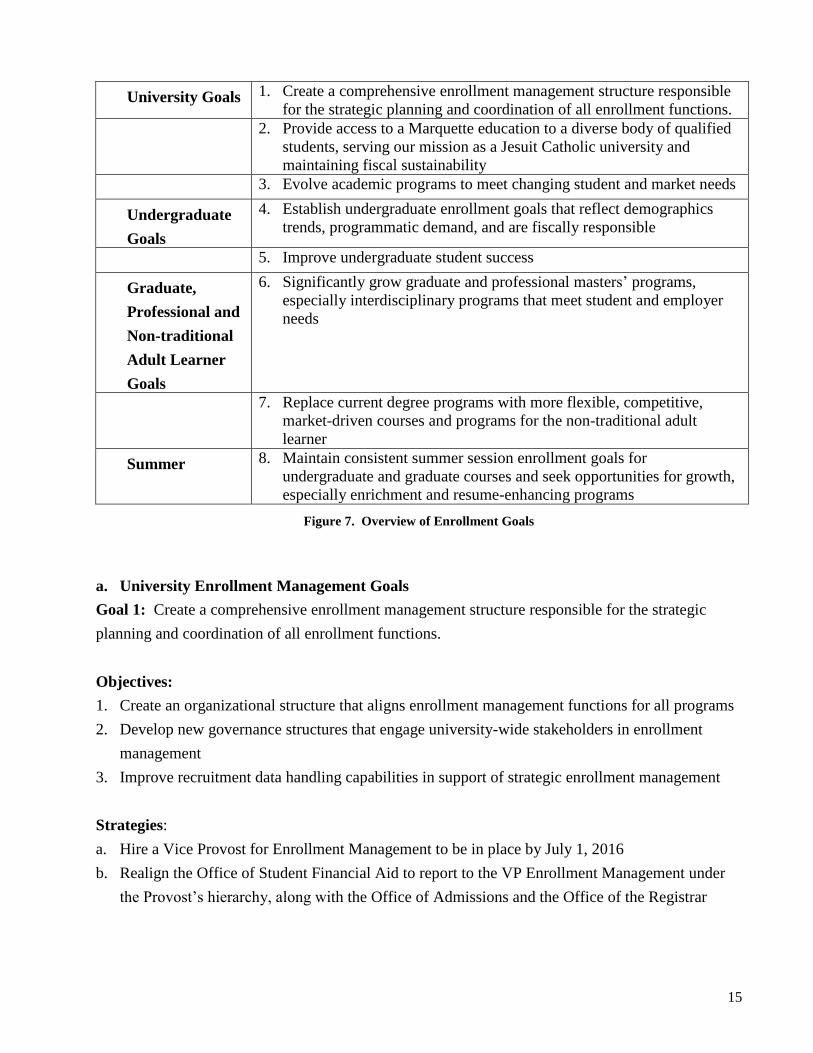
University Goals 1. Create a comprehensive enrollment management structure responsible
for the strategic planning and coordination of all enrollment functions.
2. Provide access to a Marquette education to a diverse body of qualified
students, serving our mission as a Jesuit Catholic university and
maintaining fiscal sustainability
3. Evolve academic programs to meet changing student and market needs
Undergraduate
Goals
4. Establish undergraduate enrollment goals that reflect demographics
trends, programmatic demand, and are fiscally responsible
5. Improve undergraduate student success
Graduate,
Professional and
Non-traditional
Adult Learner
Goals
6. Significantly grow graduate and professional masters’ programs,
especially interdisciplinary programs that meet student and employer
needs
7. Replace current degree programs with more flexible, competitive,
market-driven courses and programs for the non-traditional adult
learner
Summer 8. Maintain consistent summer session enrollment goals for
undergraduate and graduate courses and seek opportunities for growth,
especially enrichment and resume-enhancing programs
Figure 7. Overview of Enrollment Goals
a. University Enrollment Management Goals
Goal 1: Create a comprehensive enrollment management structure responsible for the strategic
planning and coordination of all enrollment functions.
Objectives:
1. Create an organizational structure that aligns enrollment management functions for all programs
2. Develop new governance structures that engage university-wide stakeholders in enrollment
management
3. Improve recruitment data handling capabilities in support of strategic enrollment management
Strategies:
a. Hire a Vice Provost for Enrollment Management to be in place by July 1, 2016
b. Realign the Office of Student Financial Aid to report to the VP Enrollment Management under
the Provost’s hierarchy, along with the Office of Admissions and the Office of the Registrar
16
c. Establish alignment and dotted line reporting between the VP Enrollment Management and the
Dean of the Graduate School, Office of International Education, and the VP for Strategic and
Academic Planning
d. Establish a university-wide Enrollment Strategy Committee
e. Acquire and implement a Customer Relationship Management (CRM) system for use in
recruitment by all admitting units
Goal 2: Provide access to a Marquette education to a diverse body of qualified students, serving our
mission as a Jesuit Catholic university and maintaining fiscal sustainability
Objectives:
1. Recruit, support, and retain academically qualified and diverse students to achieve annual
undergraduate and graduate enrollment goals
2. Reduce Marquette’s dependence upon unfunded financial aid to free up resources to invest in
faculty, programs and student support services
Strategies:
a. Establish scholarships and student financial support as a fundraising priority to increase
diversity, provide merit aid for top students, and meet the increasing financial demands of low
income and first generation students
b. Increase yield (undergraduate and graduate) through the collective efforts of deans and colleges,
the Office of Admissions, and the Graduate School and engagement of the campus
c. Expand recruitment areas first within the Midwest and then nationally, informed by
demographics and the competition, for undergraduate, graduate / professional masters’ students
d. Administer all (undergraduate) scholarships through the Offices of Financial Aid and
Admissions, in accordance with university and college goals and priorities
e. Review and revise graduate and professional masters’ financial aid funding and strategies,
relying less on history and past allocations and more on market demand for programs
Goal 3: Evolve academic programs to meet changing student and market needs
Objectives:
1. Offer mission-driven academic programs that prepare students for meaningful careers
2. Invest in competitive programs that meet market and society’s needs
3. Align university resources with areas of program growth and innovation
17
Strategies:
a. Invest in programs with high student demand for which we have a competitive advantage (e.g.,
recognized programs in Business Administration, Engineering, Health Sciences, Nursing and the
Sciences)
b. Right-size faculty in existing programs by reallocating existing lines and hiring new faculty in
areas of strategic growth
c. Review and revise current University Core of Common Studies in alignment with our Jesuit
tradition, providing students with high impact learning experiences and a competitive skillset
d. Develop a process to assess program demand and capacity to right-size colleges and programs
and encourage new program development, especially interdisciplinary programs
e. Establish a new program incubator, especially to support and encourage innovation in
developing new professional masters’ programs
b. Undergraduate Enrollment Goals
Goal 4: Establish undergraduate enrollment goals that reflect demographic trends, programmatic
demand, and are fiscally responsible
Objectives:
1. Establish freshmen enrollment goal of 1,935 for fall 2016 and assess this goal annually, seeking
opportunities for future growth and using the articulated process that includes the VP Enrollment
Management, the Office of Admissions, the Provost, the Deans and the Office of Finance
2. Increase the number of transfer students, beginning with a baseline goal of 150 for the fall 2016
semester and then strategically grow to 200 over the next 5 years
3. Maintain the current percentage of undergraduate international students for the next three years
Strategies for freshmen:
a. Utilizing new Customer Relationship Management (CRM) system and search technologies,
develop a more targeted communication stream with prospective students to increase yield
b. Better qualify our prospect pool to result in fewer but more committed applications and increase
yield
c. Expand our undergraduate recruitment area strategically, beginning with Minnesota and
assessing additional opportunities in subsequent years moving toward a more national presence
d. Increase the number of Latino students via regional targeting
e. Utilize financial aid awards to reach specific annual university enrollment goals, especially
quality and diversity, with a new focus on Latino students
18
f. Develop summer programming in strategic areas of growth (Business Administration,
Engineering, Health Sciences) for middle and high school students to develop a deeper
prospective student pipeline
g. Engage deans in goal-setting, scholarship fundraising, and recruitment and yield activities
Strategies for transfer students:
a. Continue implementing the goals of the transfer enrollment committee and accelerate marketing
efforts to position Marquette as a transfer friendly school
b. Enhance online resources for transfer credit equivalency for prospective students
c. Implement software (Transferology) to enhance internal transfer credit evaluation process
d. Streamline timing of transfer application review process
e. Implement on-site admission decisions at community colleges and UW system 2-year schools
Strategies for international students:
a. Diversify our recruitment and enrollment of international students beyond China, our major
source of international undergraduate students, with an initial focus on Latin and South America
b. Continue expansion of international partnerships which involve exchange students
c. Build and leverage relationships with Jesuit schools in India, Latin American and South
American countries
Goal 5: Improve undergraduate student success
Objectives:
1. Maintain a consistent first year retention rate of 90% or higher
2. Maintain a consistent six year graduation rate at 80% or higher
3. Reduce disparity in graduation rates among identified student groups
4. Enhance the student experience by building capacity for increased participation in high impact
experiential learning opportunities
Strategies:
a. Provide sufficient financial aid funding to allow for timely degree completion by undergraduate
students, especially high need students
b. Assure that sufficient staffing is in place in the Career Services Center to meet current needs
c. Incorporate career development programming beginning with freshman year
d. Develop a holistic first year experience which includes a freshman seminar, additional
living/learning communities and other aspects to be determined
19
e. Evaluate the need for resources and re-allocate funds given anticipated changes in the student
services needs of future classes
f. Continue to assess and enhance academic advising
c. Graduate, Professional and Non-Traditional Learner Enrollment Goals
Building graduate enrollment and reducing the reliance on undergraduate net tuition revenue is
important for several reasons. Professional masters’ programs tend to generate higher margins, part-
time programs fill empty classrooms in the evening, and graduate students typically use fewer
student services. But there are mission-driven, academic and reputational reasons as well. Graduate
students, especially in specialized master’s programs, support faculty research, work with and
mentor undergraduate students, enrich classroom discussions with their real world experience, and
help the university to build a strong alumni base of leaders, managers and professionals.
Goal 6: Significantly grow graduate professional masters’ programs, especially interdisciplinary
programs that meet student and employer needs
Objectives:
1. Ensure that current graduate and professional masters’ programs are meeting student and market
needs
2. Identify new student audiences for existing programs and new ways to deliver existing programs
to reach additional students (e.g., hybrid or online)
3. Grow portfolio of graduate / professional programs to meet the needs of students and employers
and reduce our reliance on undergraduate net tuition revenue
Strategies:
a. Review marketing and recruitment strategies for existing programs, seeking ways to reach new
audiences
b. Create a culture and an environment that supports program innovation by developing a new
program incubator
c. Identify and invest in areas for new master’s programs that meet work force demands
d. Review graduate and professional financial aid to meet market needs and optimize return on
investment in professional master’s programs; develop and implement a plan for FY18
Goal 7: Replace current degree programs with more flexible, competitive, market-driven courses
and programs for the non-traditional adult learner
20
Objectives:
1. Increase non-credit and professional development courses, programs and offerings that appeal to
new audiences of adult learners
Strategies:
a. Experiment with a small number of programs that meet niche market needs, building on existing
strengths
b. Create an advisory board of alumni and local business and nonprofit leaders to recommend and
support professional development programs
d. Summer Session Enrollment and Online Delivery of Programs
Goal 8: Maintain consistent summer session enrollment goals for undergraduate and graduate
courses and seek opportunities for growth, especially enrichment and resume-enhancing
programs
Objectives:
1. Continue to integrate summer into the academic experience for undergraduate and graduate
students
2. Ensure that summer course offerings meet student needs and provide financial benefit to the
University
Strategies
a. Given recent changes in the College Curriculum for the College of Arts and Sciences, offer
courses that accelerate time to degree and provide opportunities to double major
b. Determine the demand for online summer courses and develop a plan for strategic growth
c. Develop a resource plan for summer that provides predictable support for marketing, course
development and student activities
d. Identify enrichment programs for current undergraduate students that build skills needed in
today’s workplace and professional development programs for working professionals
VIII. Investment Strategies
a. Investment in the Plan
Including a discussion of infrastructure and investment strategies as part of the Enrollment Plan
sends a strong signal that, to achieve its goals, Marquette will need to commit to a well-defined set
of support strategies that require financial and other resources. These include providing resources to
21
support marketing and recruitment in all programs and investing in student success to meet current
and future needs. Investment is needed to provide students with a well-rounded Jesuit education
with a clearly articulated value proposition and demonstration of the desired student outcomes.
As mentioned earlier, we are at capacity with respect to student services such as advising, tutorial,
career, and disability services. While recognizing that additional tuition revenue is needed to cover
all university expenses, it is critical to identify a strategic investment strategy to attract and retain
future classes. This may also be accomplished through reallocation of current operating dollars.
To expand existing and build new revenue-generating graduate and professional programs,
investment will be needed for start-up as well as for innovative program delivery. The proposed
new program incubator will require financial support for market analysis, marketing and recruitment,
faculty release time, graduate student assistance, course development and program management.
b. Financial Aid and Fundraising
Investing in the Enrollment Plan in the current competitive environment will require a re-energized
commitment to fundraising for scholarships and other types of externally-funded financial aid as a
university-wide priority. Currently, Marquette funds student financial aid primarily through
unfunded discount.
Establishing and achieving fundraising goals that reverse the current trend is critical, at this juncture,
if Marquette is to reach its enrollment goals and improve diversity and quality. Providing access to a
Marquette education to students, regardless of their financial means, is crucial to our mission and
identity.
22
IX. Next Steps
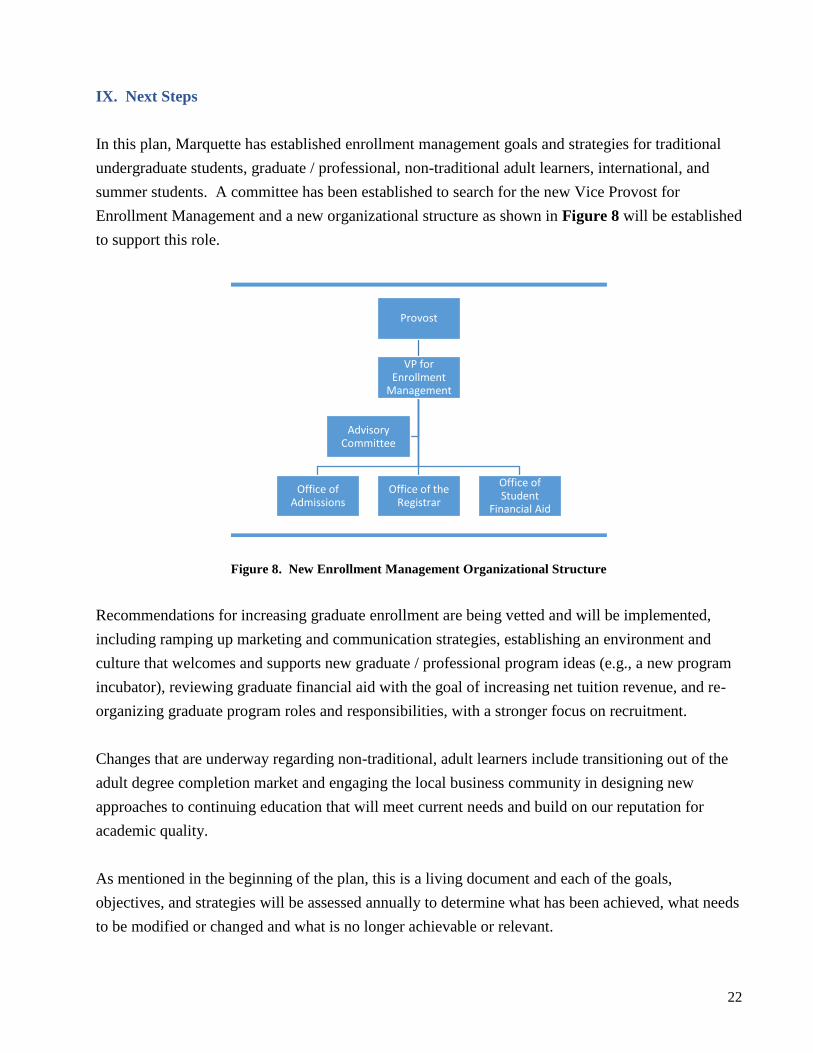
In this plan, Marquette has established enrollment management goals and strategies for traditional
undergraduate students, graduate / professional, non-traditional adult learners, international, and
summer students. A committee has been established to search for the new Vice Provost for
Enrollment Management and a new organizational structure as shown in Figure 8 will be established
to support this role.
Figure 8. New Enrollment Management Organizational Structure
Recommendations for increasing graduate enrollment are being vetted and will be implemented,
including ramping up marketing and communication strategies, establishing an environment and
culture that welcomes and supports new graduate / professional program ideas (e.g., a new program
incubator), reviewing graduate financial aid with the goal of increasing net tuition revenue, and re-
organizing graduate program roles and responsibilities, with a stronger focus on recruitment.
Changes that are underway regarding non-traditional, adult learners include transitioning out of the
adult degree completion market and engaging the local business community in designing new
approaches to continuing education that will meet current needs and build on our reputation for
academic quality.
As mentioned in the beginning of the plan, this is a living document and each of the goals,
objectives, and strategies will be assessed annually to determine what has been achieved, what needs
to be modified or changed and what is no longer achievable or relevant.
Provost
VP for Enrollment
Management
Office of Admissions
Office of the Registrar
Office of Student
Financial Aid
Advisory Committee
23
Appendices
I. Timeline for Enrollment Plan Development
II. University Headcount Enrollment History
III. Undergraduate Enrollment History by Colleges
IV. Diversity Profile
V. Summer Enrollment History 2009 to 2015 and Projections for 2016
VI. Enrollment Actuals and Projections
VII. Enrollment Projection Timeline
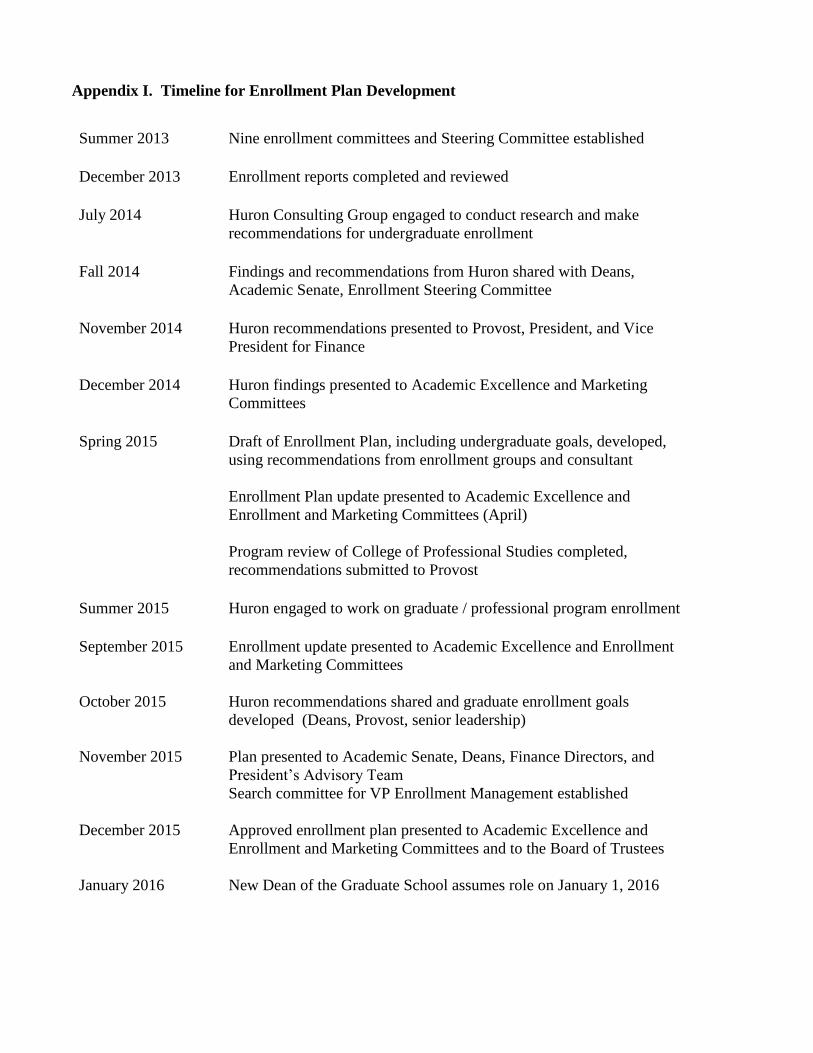
Appendix I. Timeline for Enrollment Plan Development
Summer 2013 Nine enrollment committees and Steering Committee established
December 2013
Enrollment reports completed and reviewed
July 2014 Huron Consulting Group engaged to conduct research and make
recommendations for undergraduate enrollment
Fall 2014 Findings and recommendations from Huron shared with Deans,
Academic Senate, Enrollment Steering Committee
November 2014 Huron recommendations presented to Provost, President, and Vice
President for Finance
December 2014 Huron findings presented to Academic Excellence and Marketing
Committees
Spring 2015 Draft of Enrollment Plan, including undergraduate goals, developed,
using recommendations from enrollment groups and consultant
Enrollment Plan update presented to Academic Excellence and
Enrollment and Marketing Committees (April)
Program review of College of Professional Studies completed,
recommendations submitted to Provost
Summer 2015 Huron engaged to work on graduate / professional program enrollment
September 2015
October 2015
Enrollment update presented to Academic Excellence and Enrollment
and Marketing Committees
Huron recommendations shared and graduate enrollment goals
developed (Deans, Provost, senior leadership)
November 2015 Plan presented to Academic Senate, Deans, Finance Directors, and
President’s Advisory Team
Search committee for VP Enrollment Management established
December 2015 Approved enrollment plan presented to Academic Excellence and
Enrollment and Marketing Committees and to the Board of Trustees
January 2016 New Dean of the Graduate School assumes role on January 1, 2016
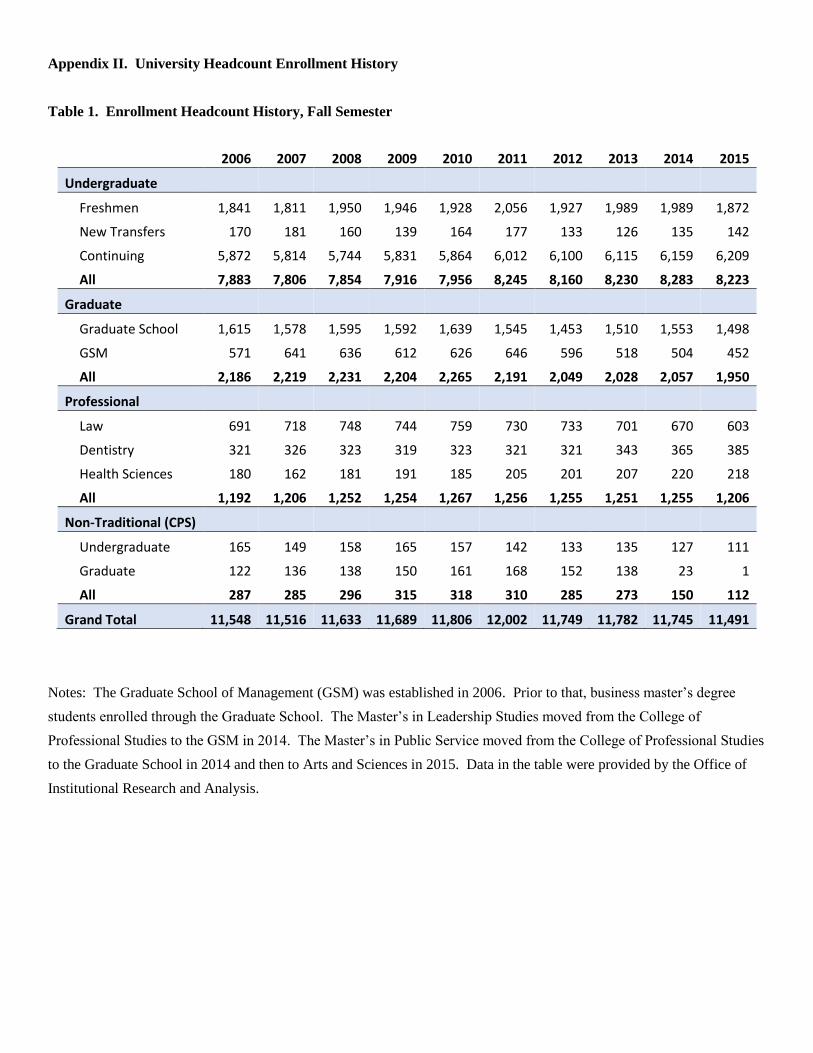
Appendix II. University Headcount Enrollment History
Table 1. Enrollment Headcount History, Fall Semester
2006 2007 2008 2009 2010 2011 2012 2013 2014 2015
Undergraduate
Freshmen 1,841 1,811 1,950 1,946 1,928 2,056 1,927 1,989 1,989 1,872
New Transfers 170 181 160 139 164 177 133 126 135 142
Continuing 5,872 5,814 5,744 5,831 5,864 6,012 6,100 6,115 6,159 6,209
All 7,883 7,806 7,854 7,916 7,956 8,245 8,160 8,230 8,283 8,223
Graduate
Graduate School 1,615 1,578 1,595 1,592 1,639 1,545 1,453 1,510 1,553 1,498
GSM 571 641 636 612 626 646 596 518 504 452
All 2,186 2,219 2,231 2,204 2,265 2,191 2,049 2,028 2,057 1,950
Professional
Law 691 718 748 744 759 730 733 701 670 603
Dentistry 321 326 323 319 323 321 321 343 365 385
Health Sciences 180 162 181 191 185 205 201 207 220 218
All 1,192 1,206 1,252 1,254 1,267 1,256 1,255 1,251 1,255 1,206
Non-Traditional (CPS)
Undergraduate 165 149 158 165 157 142 133 135 127 111
Graduate 122 136 138 150 161 168 152 138 23 1
All 287 285 296 315 318 310 285 273 150 112
Grand Total 11,548 11,516 11,633 11,689 11,806 12,002 11,749 11,782 11,745 11,491
Notes: The Graduate School of Management (GSM) was established in 2006. Prior to that, business master’s degree
students enrolled through the Graduate School. The Master’s in Leadership Studies moved from the College of
Professional Studies to the GSM in 2014. The Master’s in Public Service moved from the College of Professional Studies
to the Graduate School in 2014 and then to Arts and Sciences in 2015. Data in the table were provided by the Office of
Institutional Research and Analysis.
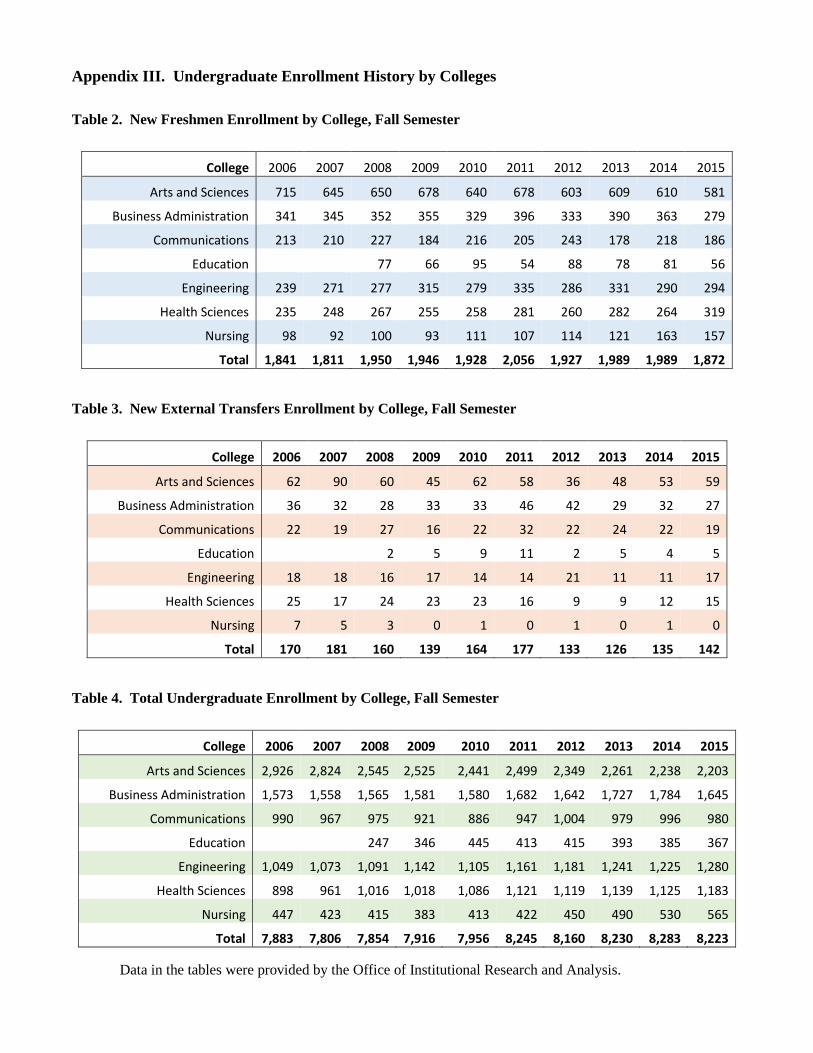
Appendix III. Undergraduate Enrollment History by Colleges
Table 2. New Freshmen Enrollment by College, Fall Semester
College 2006 2007 2008 2009 2010 2011 2012 2013 2014 2015
Arts and Sciences 715 645 650 678 640 678 603 609 610 581
Business Administration 341 345 352 355 329 396 333 390 363 279
Communications 213 210 227 184 216 205 243 178 218 186
Education 77 66 95 54 88 78 81 56
Engineering 239 271 277 315 279 335 286 331 290 294
Health Sciences 235 248 267 255 258 281 260 282 264 319
Nursing 98 92 100 93 111 107 114 121 163 157
Total 1,841 1,811 1,950 1,946 1,928 2,056 1,927 1,989 1,989 1,872
Table 3. New External Transfers Enrollment by College, Fall Semester
College 2006 2007 2008 2009 2010 2011 2012 2013 2014 2015
Arts and Sciences 62 90 60 45 62 58 36 48 53 59
Business Administration 36 32 28 33 33 46 42 29 32 27
Communications 22 19 27 16 22 32 22 24 22 19
Education 2 5 9 11 2 5 4 5
Engineering 18 18 16 17 14 14 21 11 11 17
Health Sciences 25 17 24 23 23 16 9 9 12 15
Nursing 7 5 3 0 1 0 1 0 1 0
Total 170 181 160 139 164 177 133 126 135 142
Table 4. Total Undergraduate Enrollment by College, Fall Semester
College 2006 2007 2008 2009 2010 2011 2012 2013 2014 2015
Arts and Sciences 2,926 2,824 2,545 2,525 2,441 2,499 2,349 2,261 2,238 2,203
Business Administration 1,573 1,558 1,565 1,581 1,580 1,682 1,642 1,727 1,784 1,645
Communications 990 967 975 921 886 947 1,004 979 996 980
Education 247 346 445 413 415 393 385 367
Engineering 1,049 1,073 1,091 1,142 1,105 1,161 1,181 1,241 1,225 1,280
Health Sciences 898 961 1,016 1,018 1,086 1,121 1,119 1,139 1,125 1,183
Nursing 447 423 415 383 413 422 450 490 530 565
Total 7,883 7,806 7,854 7,916 7,956 8,245 8,160 8,230 8,283 8,223
Data in the tables were provided by the Office of Institutional Research and Analysis.
Appendix IV. Diversity Profile
Table 5. Undergraduate Enrollment by Race/Ethnicity, Fall Semester
Race/Ethnicity Headcount Percent Headcount
2011 2012 2013 2014 2015 2011 2012 2013 2014 2015
American Indian or Alaska Native 24 20 15 18 19 0% 0% 0% 0% 0%
Asian 329 375 383 414 454 4% 5% 5% 5% 5%
Black or African American 418 413 379 354 343 5% 5% 5% 4% 4%
Hispanic/Latino 633 717 771 799 811 8% 9% 9% 10% 10%
Native Hawaiian or Other Pacific Islander
20 14 9 7 7 0% 0% 0% 0% 0%
White 6,51
9 6,25
2 6,16
8 6,15
8 6,01
9 78% 75% 74% 73% 72%
Two or More Races 165 201 273 285 306 2% 2% 3% 3% 4%
Race and Ethnicity Unknown 45 42 44 61 40 1% 1% 1% 1% 0%
Nonresident Alien 234 259 323 314 335 3% 3% 4% 4% 4%
Total 8,38
7 8,29
3 8,36
5 8,41
0 8,33
4 100
% 100
% 100
% 100
% 100
%
Table 6. Graduate/Professional Student Enrollment by Race/Ethnicity, Fall Semester
Race/Ethnicity Headcount Percent Headcount
2011 2012 2013 2014 2015 2011 2012 2013 2014 2015
American Indian or Alaska Native 8 9 13 11 5 0% 0% 0% 0% 0%
Asian 122 120 104 113 127 3% 3% 3% 3% 4%
Black or African American 128 132 118 109 84 4% 4% 3% 3% 3%
Hispanic/Latino 148 139 139 151 166 4% 4% 4% 5% 5%
Native Hawaiian or Other Pacific Islander
4 3 5 4 0 0% 0% 0% 0% 0%
White 2,68
8 2,49
3 2,19
9 2,19
7 2,12
2 74% 72% 64% 66% 67%
Two or More Races 41 43 42 44 55 1% 1% 1% 1% 2%
Race and Ethnicity Unknown 157 194 499 416 313 4% 6% 15% 12% 10%
Nonresident Alien 319 323 298 290 285 9% 9% 9% 9% 9%
Total 3,61
5 3,45
6 3,41
7 3,33
5 3,15
7 100
% 100
% 100
% 100
% 100
%
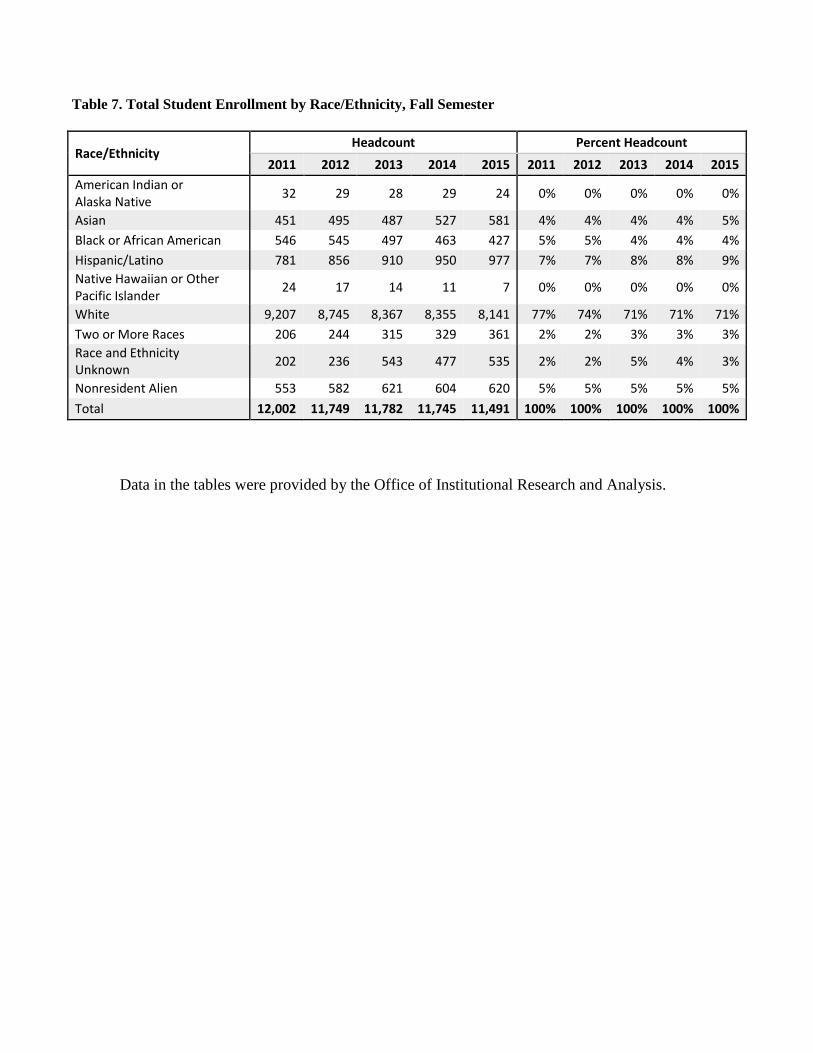
Table 7. Total Student Enrollment by Race/Ethnicity, Fall Semester
Race/Ethnicity Headcount Percent Headcount
2011 2012 2013 2014 2015 2011 2012 2013 2014 2015
American Indian or Alaska Native
32 29 28 29 24 0% 0% 0% 0% 0%
Asian 451 495 487 527 581 4% 4% 4% 4% 5%
Black or African American 546 545 497 463 427 5% 5% 4% 4% 4%
Hispanic/Latino 781 856 910 950 977 7% 7% 8% 8% 9%
Native Hawaiian or Other Pacific Islander
24 17 14 11 7 0% 0% 0% 0% 0%
White 9,207 8,745 8,367 8,355 8,141 77% 74% 71% 71% 71%
Two or More Races 206 244 315 329 361 2% 2% 3% 3% 3%
Race and Ethnicity Unknown
202 236 543 477 535 2% 2% 5% 4% 3%
Nonresident Alien 553 582 621 604 620 5% 5% 5% 5% 5%
Total 12,002 11,749 11,782 11,745 11,491 100% 100% 100% 100% 100%
Data in the tables were provided by the Office of Institutional Research and Analysis.
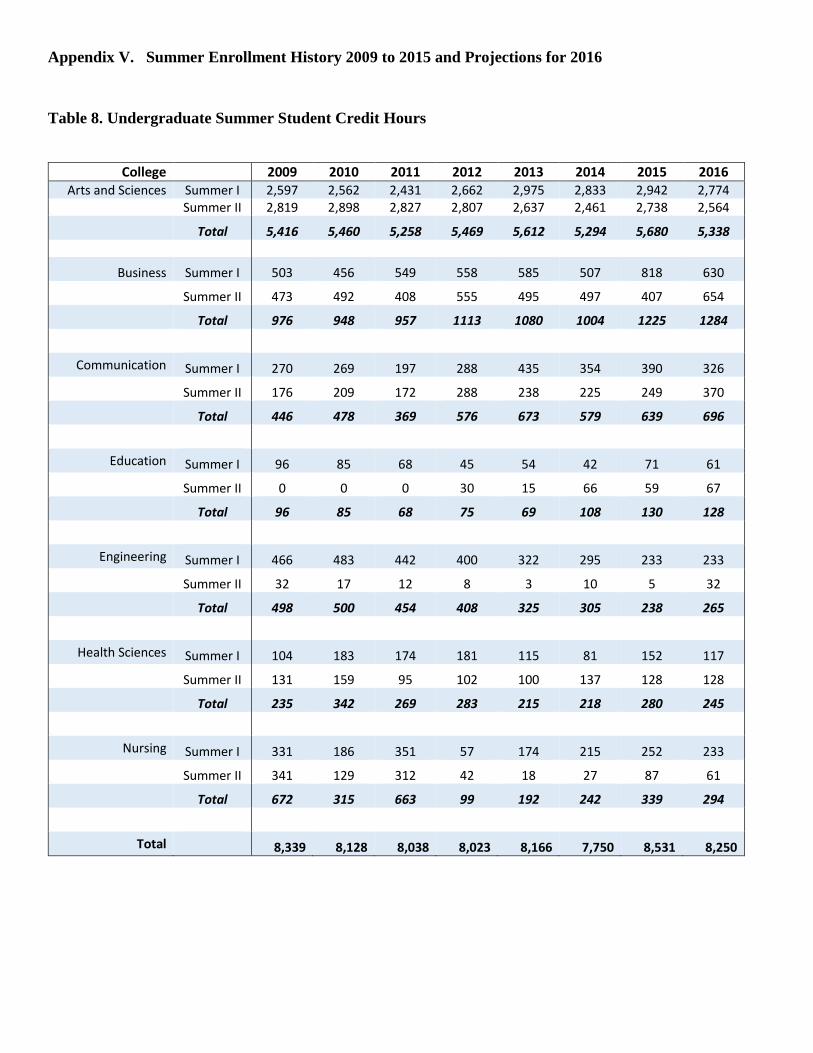
Appendix V. Summer Enrollment History 2009 to 2015 and Projections for 2016
Table 8. Undergraduate Summer Student Credit Hours
College 2009 2010 2011 2012 2013 2014 2015 2016 Arts and Sciences Summer I 2,597 2,562 2,431 2,662 2,975 2,833 2,942 2,774
Summer II 2,819 2,898 2,827 2,807 2,637 2,461 2,738 2,564
Total 5,416 5,460 5,258 5,469 5,612 5,294 5,680 5,338
Business Summer I 503 456 549 558 585 507 818 630
Summer II 473 492 408 555 495 497 407 654
Total 976 948 957 1113 1080 1004 1225 1284
Communication Summer I 270 269 197 288 435 354 390 326
Summer II 176 209 172 288 238 225 249 370
Total 446 478 369 576 673 579 639 696
Education Summer I 96 85 68 45 54 42 71 61
Summer II 0 0 0 30 15 66 59 67
Total 96 85 68 75 69 108 130 128
Engineering Summer I 466 483 442 400 322 295 233 233
Summer II 32 17 12 8 3 10 5 32
Total 498 500 454 408 325 305 238 265
Health Sciences Summer I 104 183 174 181 115 81 152 117
Summer II 131 159 95 102 100 137 128 128
Total 235 342 269 283 215 218 280 245
Nursing Summer I 331 186 351 57 174 215 252 233
Summer II 341 129 312 42 18 27 87 61
Total 672 315 663 99 192 242 339 294
Total 8,339 8,128 8,038 8,023 8,166 7,750 8,531 8,250
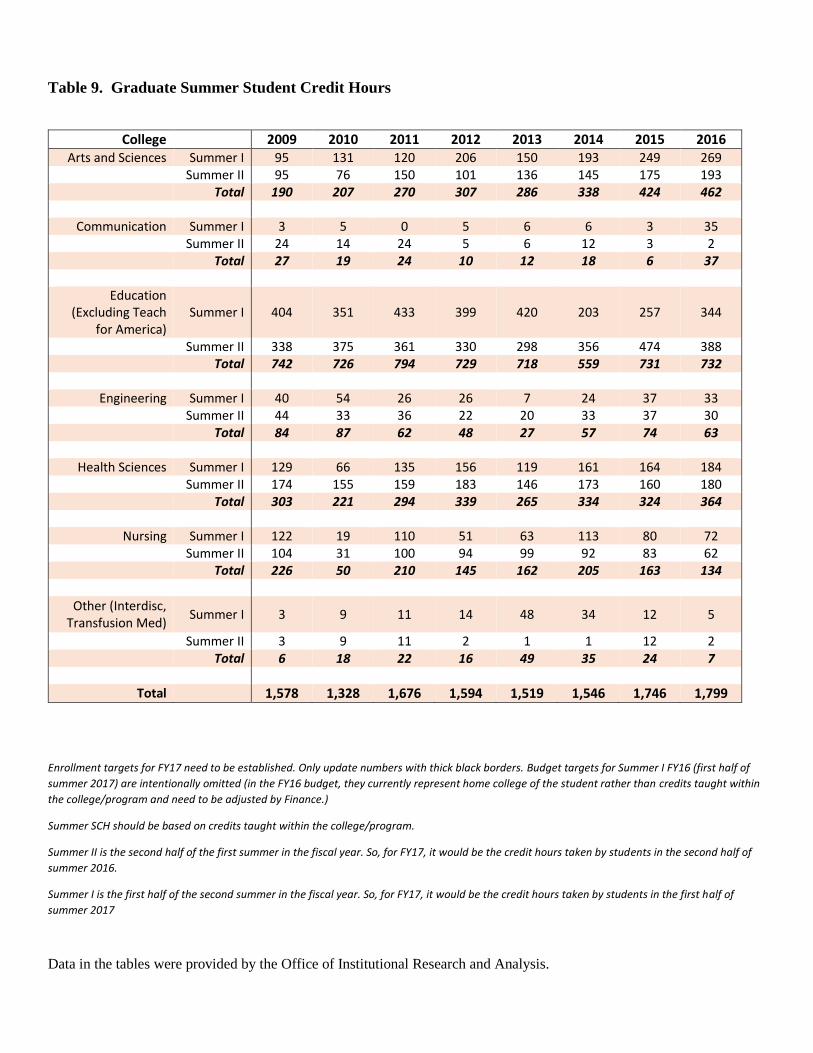
Table 9. Graduate Summer Student Credit Hours
Enrollment targets for FY17 need to be established. Only update numbers with thick black borders. Budget targets for Summer I FY16 (first half of
summer 2017) are intentionally omitted (in the FY16 budget, they currently represent home college of the student rather than credits taught within
the college/program and need to be adjusted by Finance.)
Summer SCH should be based on credits taught within the college/program.
Summer II is the second half of the first summer in the fiscal year. So, for FY17, it would be the credit hours taken by students in the second half of
summer 2016.
Summer I is the first half of the second summer in the fiscal year. So, for FY17, it would be the credit hours taken by students in the first half of
summer 2017
Data in the tables were provided by the Office of Institutional Research and Analysis.
College 2009 2010 2011 2012 2013 2014 2015 2016 Arts and Sciences Summer I 95 131 120 206 150 193 249 269
Summer II 95 76 150 101 136 145 175 193 Total 190 207 270 307 286 338 424 462
Communication Summer I 3 5 0 5 6 6 3 35 Summer II 24 14 24 5 6 12 3 2 Total 27 19 24 10 12 18 6 37
Education (Excluding Teach
for America) Summer I 404 351 433 399 420 203 257 344
Summer II 338 375 361 330 298 356 474 388 Total 742 726 794 729 718 559 731 732
Engineering Summer I 40 54 26 26 7 24 37 33 Summer II 44 33 36 22 20 33 37 30 Total 84 87 62 48 27 57 74 63
Health Sciences Summer I 129 66 135 156 119 161 164 184 Summer II 174 155 159 183 146 173 160 180 Total 303 221 294 339 265 334 324 364
Nursing Summer I 122 19 110 51 63 113 80 72 Summer II 104 31 100 94 99 92 83 62 Total 226 50 210 145 162 205 163 134
Other (Interdisc, Transfusion Med)
Summer I 3 9 11 14 48 34 12 5
Summer II 3 9 11 2 1 1 12 2 Total 6 18 22 16 49 35 24 7
Total 1,578 1,328 1,676 1,594 1,519 1,546 1,746 1,799
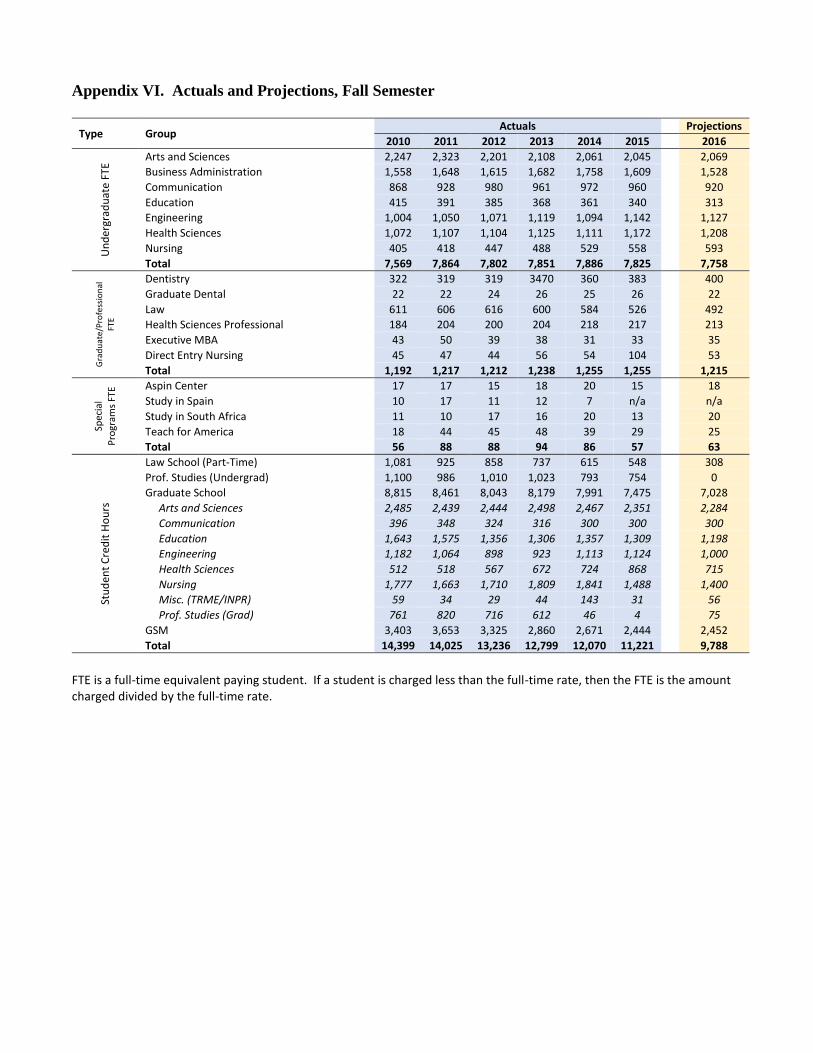
Appendix VI. Actuals and Projections, Fall Semester
Type Group Actuals Projections
2010 2011 2012 2013 2014 2015 2016
Un
der
grad
uat
e FT
E Arts and Sciences 2,247 2,323 2,201 2,108 2,061 2,045 2,069
Business Administration 1,558 1,648 1,615 1,682 1,758 1,609 1,528
Communication 868 928 980 961 972 960 920
Education 415 391 385 368 361 340 313
Engineering 1,004 1,050 1,071 1,119 1,094 1,142 1,127
Health Sciences 1,072 1,107 1,104 1,125 1,111 1,172 1,208
Nursing 405 418 447 488 529 558 593
Total 7,569 7,864 7,802 7,851 7,886 7,825 7,758
Gra
du
ate/
Pro
fess
ion
al
FTE
Dentistry 322 319 319 3470 360 383 400
Graduate Dental 22 22 24 26 25 26 22
Law 611 606 616 600 584 526 492
Health Sciences Professional 184 204 200 204 218 217 213
Executive MBA 43 50 39 38 31 33 35
Direct Entry Nursing 45 47 44 56 54 104 53
Total 1,192 1,217 1,212 1,238 1,255 1,255 1,215
Spec
ial
Pro
gram
s FT
E Aspin Center 17 17 15 18 20 15 18
Study in Spain 10 17 11 12 7 n/a n/a
Study in South Africa 11 10 17 16 20 13 20
Teach for America 18 44 45 48 39 29 25
Total 56 88 88 94 86 57 63
Stu
den
t C
red
it H
ou
rs
Law School (Part-Time) 1,081 925 858 737 615 548 308
Prof. Studies (Undergrad) 1,100 986 1,010 1,023 793 754 0
Graduate School 8,815 8,461 8,043 8,179 7,991 7,475 7,028
Arts and Sciences 2,485 2,439 2,444 2,498 2,467 2,351 2,284
Communication 396 348 324 316 300 300 300
Education 1,643 1,575 1,356 1,306 1,357 1,309 1,198
Engineering 1,182 1,064 898 923 1,113 1,124 1,000
Health Sciences 512 518 567 672 724 868 715
Nursing 1,777 1,663 1,710 1,809 1,841 1,488 1,400
Misc. (TRME/INPR) 59 34 29 44 143 31 56
Prof. Studies (Grad) 761 820 716 612 46 4 75
GSM 3,403 3,653 3,325 2,860 2,671 2,444 2,452
Total 14,399 14,025 13,236 12,799 12,070 11,221 9,788
FTE is a full-time equivalent paying student. If a student is charged less than the full-time rate, then the FTE is the amount charged divided by the full-time rate.
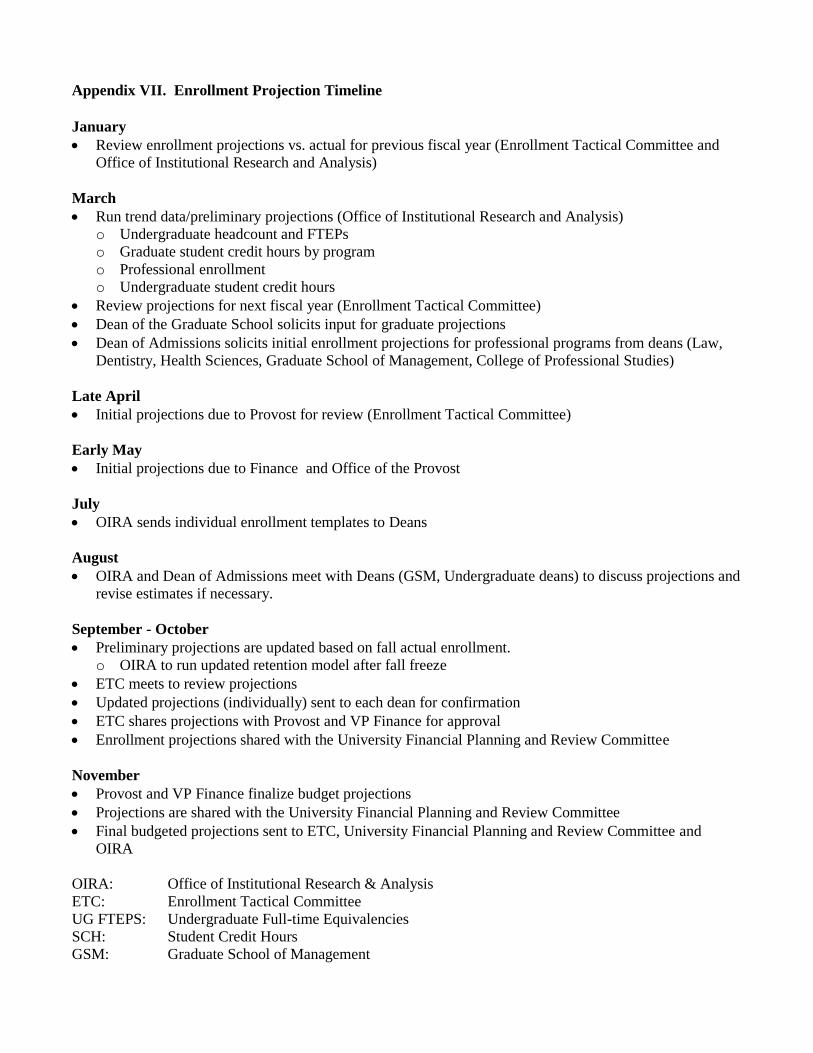
Appendix VII. Enrollment Projection Timeline
January
Review enrollment projections vs. actual for previous fiscal year (Enrollment Tactical Committee and
Office of Institutional Research and Analysis)
March
Run trend data/preliminary projections (Office of Institutional Research and Analysis)
o Undergraduate headcount and FTEPs
o Graduate student credit hours by program
o Professional enrollment
o Undergraduate student credit hours
Review projections for next fiscal year (Enrollment Tactical Committee)
Dean of the Graduate School solicits input for graduate projections
Dean of Admissions solicits initial enrollment projections for professional programs from deans (Law,
Dentistry, Health Sciences, Graduate School of Management, College of Professional Studies)
Late April
Initial projections due to Provost for review (Enrollment Tactical Committee)
Early May
Initial projections due to Finance and Office of the Provost
July
OIRA sends individual enrollment templates to Deans
August
OIRA and Dean of Admissions meet with Deans (GSM, Undergraduate deans) to discuss projections and
revise estimates if necessary.
September - October
Preliminary projections are updated based on fall actual enrollment.
o OIRA to run updated retention model after fall freeze
ETC meets to review projections
Updated projections (individually) sent to each dean for confirmation
ETC shares projections with Provost and VP Finance for approval
Enrollment projections shared with the University Financial Planning and Review Committee
November
Provost and VP Finance finalize budget projections
Projections are shared with the University Financial Planning and Review Committee
Final budgeted projections sent to ETC, University Financial Planning and Review Committee and
OIRA
OIRA: Office of Institutional Research & Analysis
ETC: Enrollment Tactical Committee
UG FTEPS: Undergraduate Full-time Equivalencies
SCH: Student Credit Hours
GSM: Graduate School of Management