mars market insights the evolving digital utility: the ... · mars market insights the evolving...
TRANSCRIPT
00979
42 356 620
CL320 240W 3W TYPE C1SR 50TA 1.0 M
MaRS Market Insights
The Evolving Digital Utility: The convergence of energy and IT
MaRS is a member of
Authors
Lynda O’Malley, Industry Analyst,
Cleantech, MaRS Market Intelligence
To download the original report, please visit
http://www.marsdd.com/news-and-insights/
the-evolving-digital-utility
For further information, please contact
Lynda O’Malley at [email protected]
Disclaimer: The information provided in this report
is presented in summary form, is general in nature,
current only as of the date of publication and is
provided for informational purposes only.
MaRS Discovery District, ©August 2014
Table of Contents
04 IT for a smarter grid, smarter home and a smarter customer
05 The advanced metering infrastructure market by the numbers
06 The smart meter market is growing in the United States, stabilizing in Ontario
06 Green Button (box)
07 Data deluge
08 Meter data management
09 Turning data into insights: data analytics
09 Moving information
10 AMI Communication Infrastructure
10 Market dynamics
11 A made-in-Ontario solution
11 Policy as a market driver
12 Advanced metering infrastructure drivers
12 Advanced metering infrastructure challenges
13 Scaling Ontario’s meter data management to real-time
14 Competitive landscape
15 The final frontier for information technology
Table of Contents | 03
IT for a smarter grid, smarter home and a smarter customer. | 04
Information technology (IT) makes the
smart grid possible. It is also a major
driver of energy efficiency. As utilities
work toward building smart grids with
IT, they are turning to smart meters and
advanced metering infrastructure as a
key first step in adding intelligence to
energy networks. The smart meter brings
utilities into the home, where battle lines
are being drawn as traditional home-based
IT players (such as telecom and security
companies) already have a foothold in
this market.
Advanced metering infrastructure (AMI) is the two-
way communication between a smart meter and
the utility,1 and includes meter data management
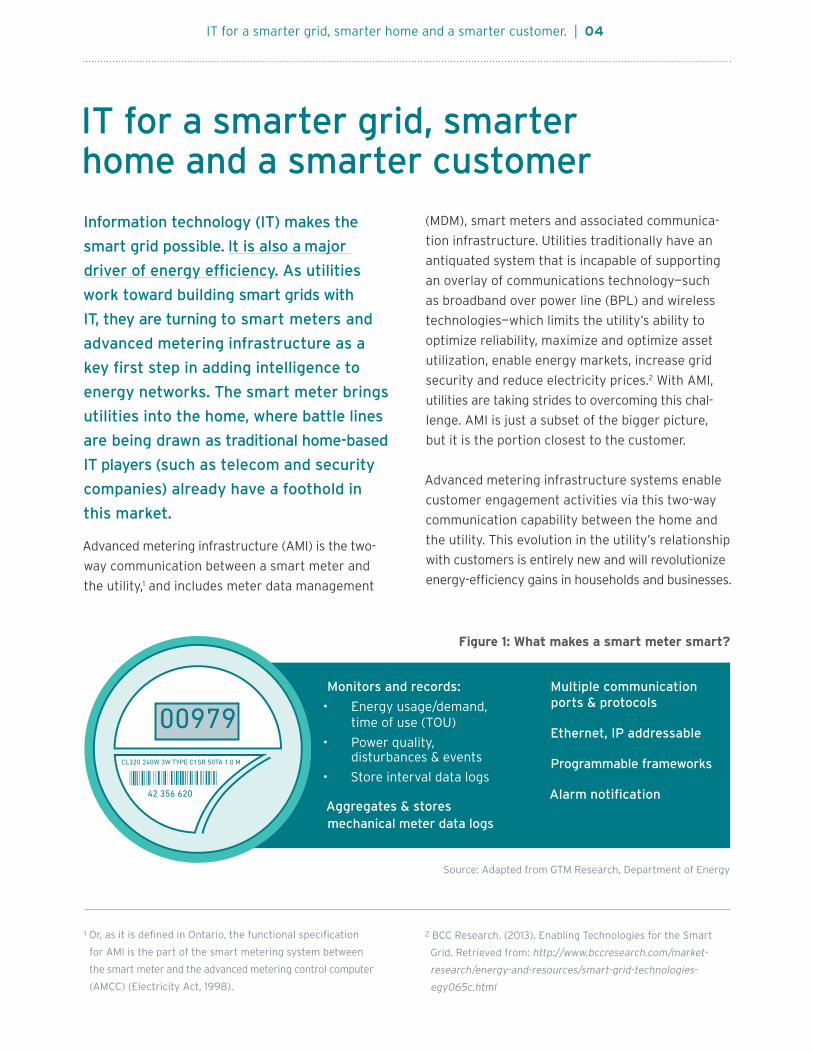
Monitors and records:
• Energy usage/demand, time of use (TOU)
• Power quality, disturbances & events
• Store interval data logs
Aggregates & stores mechanical meter data logs
1 Or, as it is defined in Ontario, the functional specification
for AMI is the part of the smart metering system between
the smart meter and the advanced metering control computer
(AMCC) (Electricity Act, 1998).
(MDM), smart meters and associated communica-
tion infrastructure. Utilities traditionally have an
antiquated system that is incapable of supporting
an overlay of communications technology—such
as broadband over power line (BPL) and wireless
technologies—which limits the utility’s ability to
optimize reliability, maximize and optimize asset
utilization, enable energy markets, increase grid
security and reduce electricity prices.2 With AMI,
utilities are taking strides to overcoming this chal-
lenge. AMI is just a subset of the bigger picture,
but it is the portion closest to the customer.
Advanced metering infrastructure systems enable
customer engagement activities via this two-way
communication capability between the home and
the utility. This evolution in the utility’s relationship
with customers is entirely new and will revolutionize
energy-efficiency gains in households and businesses.
2 BCC Research. (2013). Enabling Technologies for the Smart
Grid. Retrieved from: http://www.bccresearch.com/market-
research/energy-and-resources/smart-grid-technologies-
egy065c.html
Figure 1: What makes a smart meter smart?
IT for a smarter grid, smarter home and a smarter customer
00979
42 356 620
CL320 240W 3W TYPE C1SR 50TA 1.0 M
Multiple communication ports & protocols
Ethernet, IP addressable
Programmable frameworks
Alarm notification
Source: Adapted from GTM Research, Department of Energy
The advanced metering infrastructure market by the numbers | 5
Frost & Sullivan, a market research firm,3 puts the
revenue cumulative average growth rate (CAGR)
of the AMI market at 15.8% during the forecast
period 2012–2017. Frost estimates this CAGR to be
lower in North America, at 5.6% (2012–2017). AMI
market growth is driven by smart meters, which
capture 41% of the AMI market revenues.4 Frost &
Sullivan estimates that sales for MDM, combined
with customer and program data management,
are expected to account for 32.6% of total AMI
The advanced metering infrastructure market by the numbers
3 Frost & Sullivan. (2013). Smart Metering Focus: Advanced
Metering Infrastructure. Retrieved from www.frost.com/prod
servlet/cio/246140776 (PDF)
4 Frost & Sullivan. Smart Metering Focus: Advanced Metering
Infrastructure.
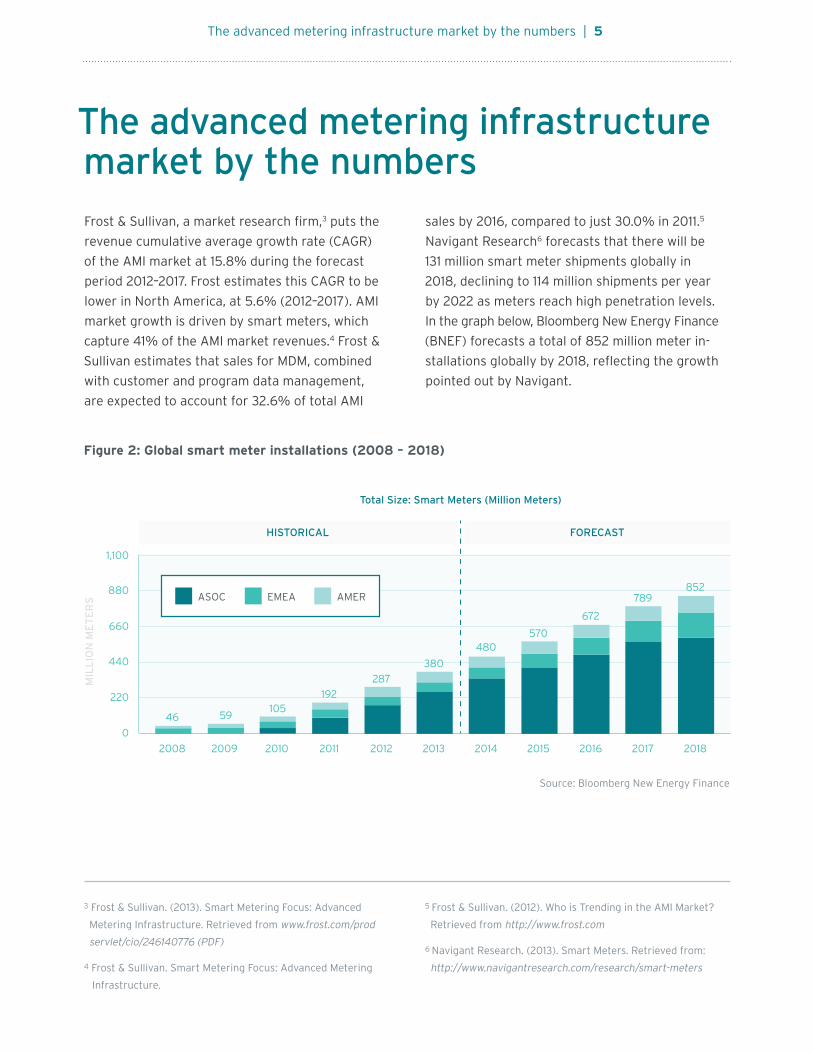
Figure 2: Global smart meter installations (2008 – 2018)
Source: Bloomberg New Energy Finance
sales by 2016, compared to just 30.0% in 2011.5
Navigant Research6 forecasts that there will be
131 million smart meter shipments globally in
2018, declining to 114 million shipments per year
by 2022 as meters reach high penetration levels.
In the graph below, Bloomberg New Energy Finance
(BNEF) forecasts a total of 852 million meter in-
stallations globally by 2018, reflecting the growth
pointed out by Navigant.
1,100
880
660
2008
46 59105
192
287
380
480570
672
789852
2009 2010 2011 2012 2013 2014 2015 2016 2017 2018
440
220
0
ASOC EMEA AMER
HISTORICAL FORECAST
Total Size: Smart Meters (Million Meters)
MIL
LIO
N M
ET
ER
S
5 Frost & Sullivan. (2012). Who is Trending in the AMI Market?
Retrieved from http://www.frost.com
6 Navigant Research. (2013). Smart Meters. Retrieved from:
http://www.navigantresearch.com/research/smart-meters
Green Button | 6
In North America, the United States has more than 3000 utilities with over 146 million
customers. In 2012, 533 American electric utilities had more than 43 million AMI instal-
lations. This represents only about 30% of the addressable AMI market, which comprises
146 million end points. In Canada, the smart meter market is led by British Columbia and
Ontario. Hydro Quebec is joining these leaders as it rolls out a 3.75 million meter project.
Ontario has rolled out smart meters for 4.8 million commercial and residential customers.
GREEN BUTTON was brought forward by the Ontario’s
Ministry of Energy and facilitated by MaRS. The first step
was Download My Data, a secure data transfer directly from
the utility to the customer in a consistent format. The Green
Button standard was released in spring 2013; it allows energy
usage information to be shared in a common format (XML),
24 hours after usage occurs, complete with privacy measures.
So far, the data standard only applies to electricity—but it can
be expanded to gas and water data too, and it is relevant for
residential, commercial and industrial market segments. The
Connect My Data (CMD) pilot, an automated, secure elec-
tronic data transfer from the utility to a third party, based
on customer authorization, is currently underway. The CMD
pilots have been implemented in London Hydro and Hydro
One’s service territories and will run for 12 months. The main
objectives of the pilots are: to test the implementation of
the Green Button standard; to undertake a comprehensive
process review; and to document the findings to help other
utilities and solutions providers learn about best practices
and lessons to consider when implementing the standard
across Ontario. In the US, where the standard was first
adopted, 35 utilities have implemented Green Button, and
44 have committed. These 35 utilities represent 36 million
homes and businesses.
The smart meter market is growing in the United States, stabilizing in Ontario
Ontario’s meter data man-
agement repository (MDM/R)
processes the data from these
smart meters and fulfills
200 to 300 thousand billing
determinant requests every
day. Currently this data is used
by utilities for time-of-use
(TOU) pricing and billing, and
additional valuable uses for
this data are opening up due
to initiatives such as the Green
Button Program. There is now
a large amount of data avail-
able, and we could be doing a
lot more with it. According to
BNEF, the greatest value from
smart meter data will continue
to come from applications that
include outage management,
distribution automation, asset
management, customer en-
gagement and load forecasting.

1000
800
600
400
200
0
New HAN devices
Workforcemanagement
project
Mobile datagoes live
PCTs come online
AMI deployment
Distribution management roll out
Substationautomation system
GIS systemdeployment
Advanceddistributionautomation
OMS upgrate
RTU upgrade
Data deluge | 7
7 Bloomberg New Energy Finance. (2012).
Figure 3: Typical smart grid data volume growth (Terabytes)
Source: Electric Power Research Institute as cited by Bloomberg New Energy Finance
Note: Average data growth for a utility with 1m clients.
A smart meter that is reporting data at
15-minute intervals will generate 400MB
of data a year; extrapolating from that,
a utility implementing AMI to a million
customers will generate 400TB of data
a year. In 2012, BNEF predicted 680
million smart meter installations globally
by 2017—leading to 280PB of data a year.
This is not the only data utilities are deal-
ing with, by far. The BNEF graph below
demonstrates the exponential increase
in the quantities of smart grid data for
a vertically integrated utility with about
a million customers.7
Data deluge
Meter data management | 8
This brings us back to an innovative IT component—
meter data management (MDM). The MDM manages
the data collected from AMI; it is the data repository
and what makes interval data from a plethora of
meters accessible for TOU pricing, load forecasting,
outage management and operational processes. It
is the platform that metering service companies
use to provide useful access to supply-and-demand
data. Meter data management processes and iso-
lates the right data for a billing or analytical appli-
cation.8 MDM is a flexible and scalable AMI solution.
It is the key to driving benefits in AMI because it
will integrate new technologies for storing, managing
and assimilating new data into existing systems.
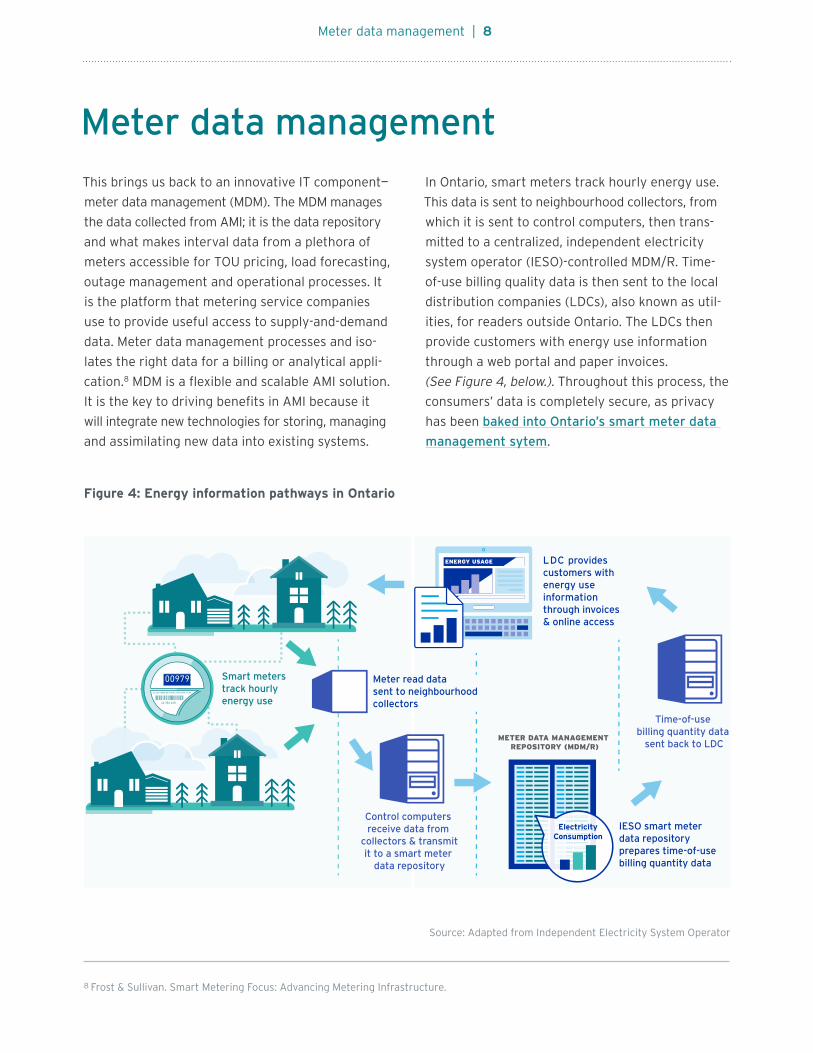
In Ontario, smart meters track hourly energy use.
This data is sent to neighbourhood collectors, from
which it is sent to control computers, then trans-
mitted to a centralized, independent electricity
system operator (IESO)-controlled MDM/R. Time-
of-use billing quality data is then sent to the local
distribution companies (LDCs), also known as util-
ities, for readers outside Ontario. The LDCs then
provide customers with energy use information
through a web portal and paper invoices.
(See Figure 4, below.). Throughout this process, the
consumers’ data is completely secure, as privacy
has been baked into Ontario’s smart meter data
management sytem.
Figure 4: Energy information pathways in Ontario
8 Frost & Sullivan. Smart Metering Focus: Advancing Metering Infrastructure.
Meter data management
Meter read data sent to neighbourhoodcollectors
LDC provides customers with energy use information through invoices & online access
IESO smart meter data repositoryprepares time-of-use billing quantity data
Time-of-use billing quantity data
sent back to LDC
Control computers receive data from
collectors & transmitit to a smart meter
data repository
Smart meters track hourly energy use
METER DATA MANAGEMENT REPOSITORY (MDM/R)
ElectricityConsumption
ENERGY USAGE
Source: Adapted from Independent Electricity System Operator
Turning data into insights: data analytics | 9
Turning data into insights: data analytics
Frost and BNEF already see a trend in MDM ven-
dors offering analytics services to utilities in order
to provide those utilities with add-on capabilities
for data processing, as well as providing analysis
that adds value beyond the data upload. This is al-
lowing utilities to exploit the smart grid infrastruc-
ture they have deployed to date. By using data an-
alytics, utilities can predict load and demand, help
consumers determine where they can find the best
cost-savings through increased energy efficiency,
and help large facilities to optimize their building
operations, among many other applications.
Moving information
Information from smart meters is automatically
and wirelessly sent over a secure network to the
utility. Data is first sent to a neighbourhood area
network (NAN) or wide area network (WAN) data
concentrator. From there, it is relayed to the utility
back office (utility head end).9 Figure 4 (above)
shows the AMI structure in Ontario; table 1 (below)
shows common methods for transmitting meter
data along with some of the pros and cons associ-
ated with each method.
In Europe, power-line communication (PLC) is
widely used for sending data from smart meters
to data concentrators—according to BNEF, the two
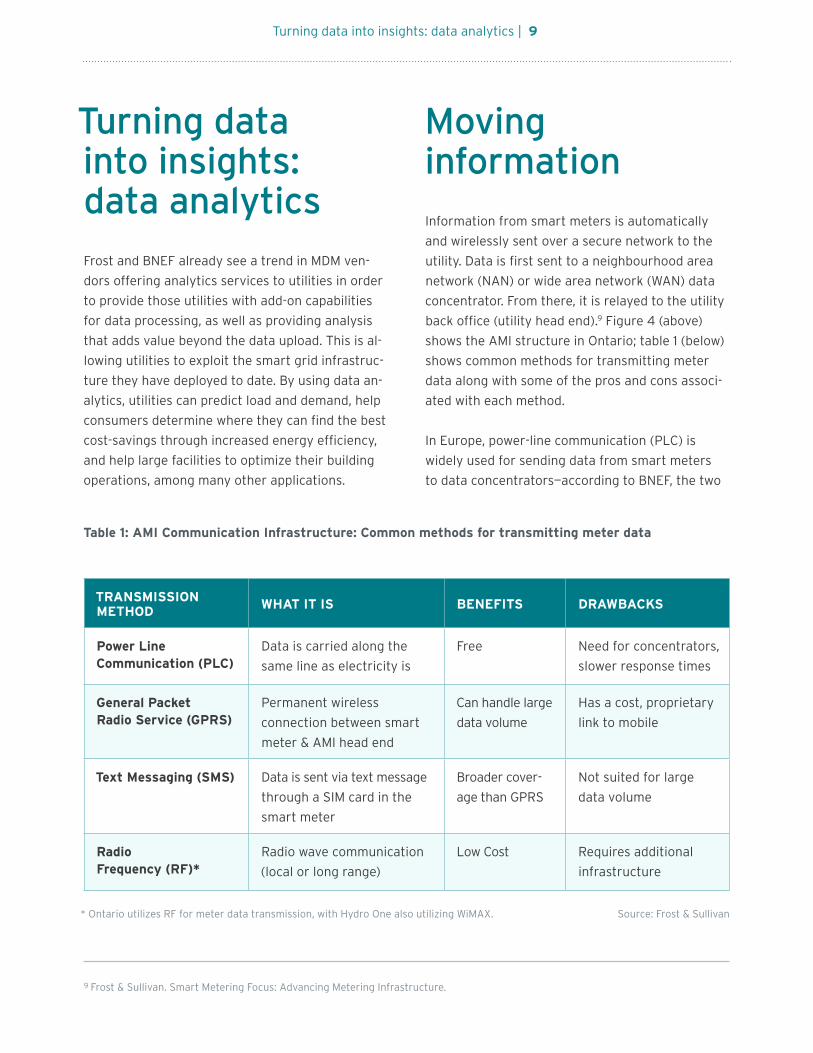
* Ontario utilizes RF for meter data transmission, with Hydro One also utilizing WiMAX. Source: Frost & Sullivan
TRANSMISSION METHOD WHAT IT IS BENEFITS DRAWBACKS
Power Line Communication (PLC)
Data is carried along the
same line as electricity is
Free Need for concentrators,
slower response times
General Packet Radio Service (GPRS)
Permanent wireless
connection between smart
meter & AMI head end
Can handle large
data volume
Has a cost, proprietary
link to mobile
Text Messaging (SMS) Data is sent via text message
through a SIM card in the
smart meter
Broader cover-
age than GPRS
Not suited for large
data volume
Radio Frequency (RF)*
Radio wave communication
(local or long range)
Low Cost Requires additional
infrastructure
Table 1: AMI Communication Infrastructure: Common methods for transmitting meter data
9 Frost & Sullivan. Smart Metering Focus: Advancing Metering Infrastructure.
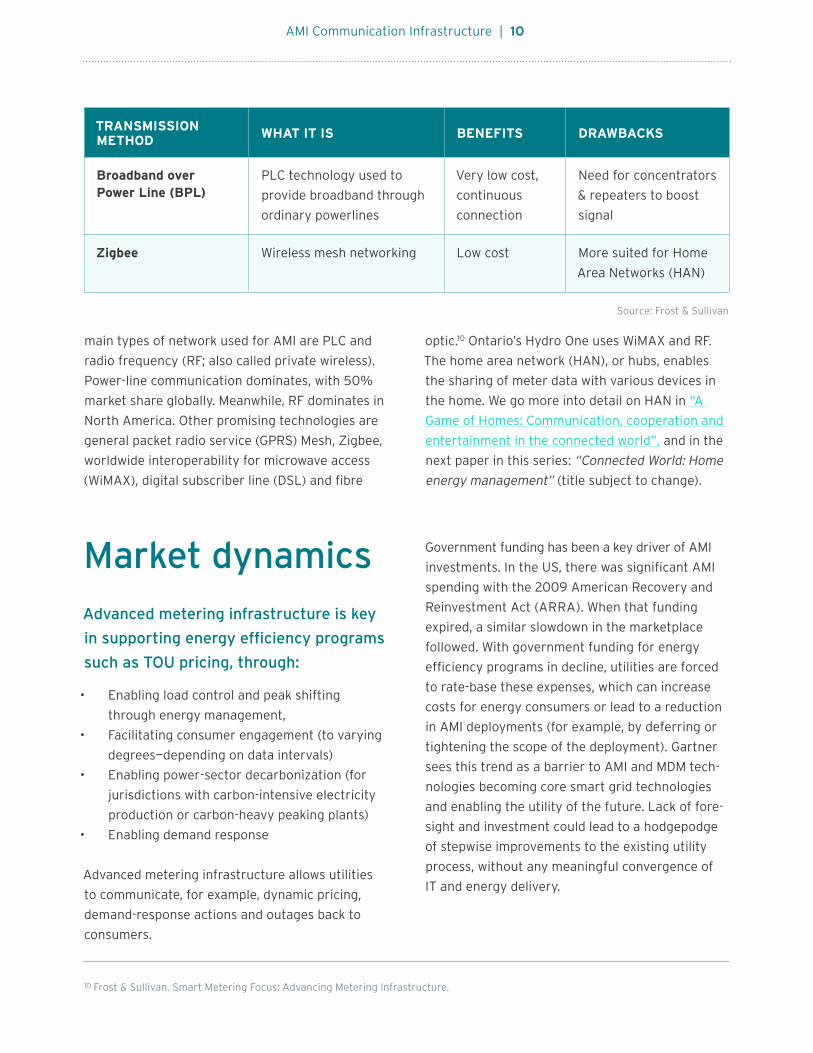
AMI Communication Infrastructure | 10
TRANSMISSION METHOD WHAT IT IS BENEFITS DRAWBACKS
Broadband over Power Line (BPL)
PLC technology used to
provide broadband through
ordinary powerlines
Very low cost,
continuous
connection
Need for concentrators
& repeaters to boost
signal
Zigbee Wireless mesh networking Low cost More suited for Home
Area Networks (HAN)
main types of network used for AMI are PLC and
radio frequency (RF; also called private wireless).
Power-line communication dominates, with 50%
market share globally. Meanwhile, RF dominates in
North America. Other promising technologies are
general packet radio service (GPRS) Mesh, Zigbee,
worldwide interoperability for microwave access
(WiMAX), digital subscriber line (DSL) and fibre
optic.10 Ontario’s Hydro One uses WiMAX and RF.
The home area network (HAN), or hubs, enables
the sharing of meter data with various devices in
the home. We go more into detail on HAN in “A
Game of Homes: Communication, cooperation and
entertainment in the connected world”, and in the
next paper in this series: “Connected World: Home
energy management” (title subject to change).
Market dynamics Advanced metering infrastructure is key
in supporting energy efficiency programs
such as TOU pricing, through:
• Enabling load control and peak shifting
through energy management,
• Facilitating consumer engagement (to varying
degrees—depending on data intervals)
• Enabling power-sector decarbonization (for
jurisdictions with carbon-intensive electricity
production or carbon-heavy peaking plants)
• Enabling demand response
Advanced metering infrastructure allows utilities
to communicate, for example, dynamic pricing,
demand-response actions and outages back to
consumers.
Government funding has been a key driver of AMI
investments. In the US, there was significant AMI
spending with the 2009 American Recovery and
Reinvestment Act (ARRA). When that funding
expired, a similar slowdown in the marketplace
followed. With government funding for energy
efficiency programs in decline, utilities are forced
to rate-base these expenses, which can increase
costs for energy consumers or lead to a reduction
in AMI deployments (for example, by deferring or
tightening the scope of the deployment). Gartner
sees this trend as a barrier to AMI and MDM tech-
nologies becoming core smart grid technologies
and enabling the utility of the future. Lack of fore-
sight and investment could lead to a hodgepodge
of stepwise improvements to the existing utility
process, without any meaningful convergence of
IT and energy delivery.
10 Frost & Sullivan. Smart Metering Focus: Advancing Metering Infrastructure.
Source: Frost & Sullivan
A made-in-Ontario solution | 11
A made-in- Ontario solutionSmart grid development began early in Ontario,
with an ambitious strategy for the deployment of
smart meters in 2004.11 Ontario’s Smart Metering
Initiative (SMI) aims to reduce the need for new
generation sources, increase conservation, im-
prove reliability, and provide more accurate and
timely energy use information to customers.12 In
their working paper, “Beyond Smart Meters,” Win-
field and Wieler note the drivers for smart meters
from 2004–2008 were to enable the province to
move to TOU electricity pricing. This was done in
order to shift to a demand-response (DR) strategy,
which the province thought was required to better
manage summer peaks in demand, as well as to
deal with an aging asset base and anticipated
further increases in demand.
Ontario’s MDM/R was procured and implemented
in support of the Ministry of Energy’s specifications,
established in 2006. The independent electricity
system operator (IESO) was designated as the
smart metering entity (SME) and managed the
smart metering system implementation program
(SMSIP) to procure, develop, implement and
Policy as a market driverSince 2009, the main market driver has been the
Green Energy Act (GEA). In particular, the GEA sets
a framework for smart grid development in Ontario,
with several objectives, such as to expand oppor-
tunities for demand response, price information
and load control to electricity customers, in order
to provide customer control and consequently
encourage energy conservation via smart meters,
TOU rates, in-home displays and load control.15
Ontario’s Long Term Energy Plan continues this
trend, and lays out some plans for conservation in
the province, including an aim to reduce consump-
tion by 30 terawatt hours by 2032, an aim to use
demand response to meet 10% of peak demand
by 2025, and continue with some key initiatives/
programs, such as: SaveOnEnergy, Social Bench-
marking pilot, Green Button Initiative, and the
Smart Grid Fund.
operate the MDM/R. The SMI is the overall Govern-
ment of Ontario initiative to create a conservation
culture and a toolset for demand management in
Ontario.13 14
11 Winfield, M. & Weiler, S. (2014). Working paper: Beyond Smart
Meters: The State of Ontario Smart Grid Policy and Practice.
York University. Retrieved from: sei.info.yorku.ca/files/2012/12/
Beyond-Smart-Meters-April-28-2014.pdf
12 Information and Privacy Commisioner, Ontario, Canada. (2012).
Building Privacy into Ontario’s Smart Meter Data Management
System: A Control Framework. Retrieved from: http://www.ipc.
on.ca/images/Resources/pbd-ieso.pdf
13 Arlitt, E. IESO. (2009). Ontario’s Smart Metering Implementation
Program: Lessons Being Learned. Retrieved from: http://esr.
degroote.mcmaster.ca/documents/1A-1.pdf
14 Information and Privacy Commissioner, Ontario, Canada.
(2012). Building Privacy into Ontario’s Smart Meter Data Man-
agement System: A Control Framework. Retrieved from:
http://www.ipc.on.ca/images/Resources/pbd-ieso.pdf
15 Norman, J. Ministry of Energy. (2011). Presentation: The Green
Energy Act and the Smart Grid in Ontario. Retrieved from:
http://energy.mcmaster.ca/CES_presentations/green_ener
gy_act_NORMAN.pdf
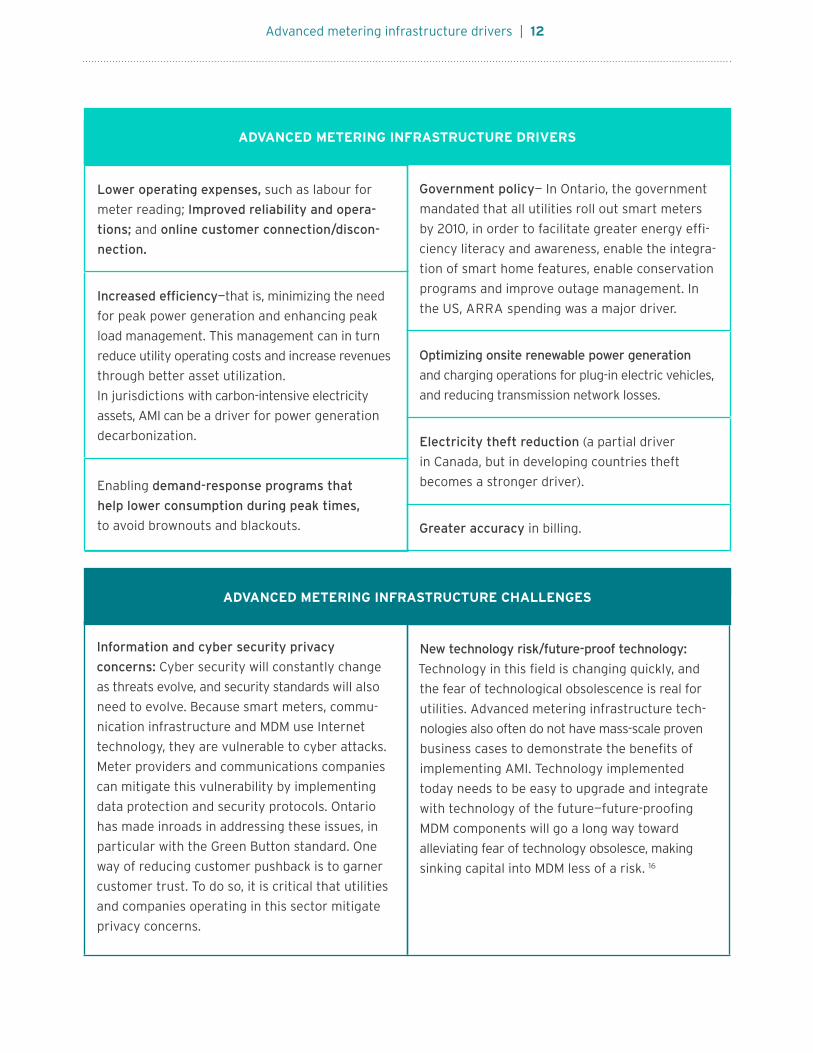
Lower operating expenses, such as labour for
meter reading; Improved reliability and opera-
tions; and online customer connection/discon-
nection.
Increased efficiency—that is, minimizing the need
for peak power generation and enhancing peak
load management. This management can in turn
reduce utility operating costs and increase revenues
through better asset utilization.
In jurisdictions with carbon-intensive electricity
assets, AMI can be a driver for power generation
decarbonization.
Enabling demand-response programs that
help lower consumption during peak times,
to avoid brownouts and blackouts.
ADVANCED METERING INFRASTRUCTURE DRIVERS
Government policy— In Ontario, the government
mandated that all utilities roll out smart meters
by 2010, in order to facilitate greater energy effi-
ciency literacy and awareness, enable the integra-
tion of smart home features, enable conservation
programs and improve outage management. In
the US, ARRA spending was a major driver.
Optimizing onsite renewable power generation
and charging operations for plug-in electric vehicles,
and reducing transmission network losses.
Electricity theft reduction (a partial driver
in Canada, but in developing countries theft
becomes a stronger driver).
Greater accuracy in billing.
Information and cyber security privacy
concerns: Cyber security will constantly change
as threats evolve, and security standards will also
need to evolve. Because smart meters, commu-
nication infrastructure and MDM use Internet
technology, they are vulnerable to cyber attacks.
Meter providers and communications companies
can mitigate this vulnerability by implementing
data protection and security protocols. Ontario
has made inroads in addressing these issues, in
particular with the Green Button standard. One
way of reducing customer pushback is to garner
customer trust. To do so, it is critical that utilities
and companies operating in this sector mitigate
privacy concerns.
New technology risk/future-proof technology:
Technology in this field is changing quickly, and
the fear of technological obsolescence is real for
utilities. Advanced metering infrastructure tech-
nologies also often do not have mass-scale proven
business cases to demonstrate the benefits of
implementing AMI. Technology implemented
today needs to be easy to upgrade and integrate
with technology of the future—future-proofing
MDM components will go a long way toward
alleviating fear of technology obsolesce, making
sinking capital into MDM less of a risk. 16
Advanced metering infrastructure drivers | 12
ADVANCED METERING INFRASTRUCTURE CHALLENGES
Advanced metering infrastructure challenges | 13
Ontario and the US were ahead of many other juris-
dictions in driving smart meter investment. In Ontar-
io, reducing peak demand to avoid system pressures,
avoid building new generation, and billing accuracy
and shifting to TOU pricing were key motivations in
rolling out smart meters. In other jurisdictions, util-
ities built their entire business case on the avoided
cost of manual meter data collection, greater accu-
racy of billing and shifting to TOU pricing. In the US,
ARRA led to high shipments of meters between 2009
and 2012. Some of these early meters were not fully
functioning smart meters, as they only offered one-
way meter reading (such as some in Ontario). Conse-
quently, these meters are becoming dated already,
with an expected lifetime of just 7 to 10 years, versus
15 to 20 years for fully functional smart meters.17 In
Ontario, another key challenge has been that the MD-
M/R was installed before a set of common communi-
16 Frost & Sullivan. Smart Metering Focus: Advanced Metering
Infrastructure.
17 Frost & Sullivan. Smart Metering Focus: Advanced Metering
Infrastructure.
18 Arlitt, E. IESO. Ontario’s Smart Metering Implementation
Program: Lessons Being Learned.
19 Frost & Sullivan. Smart Metering Focus: Advanced Metering
Infrastructure.
With AMI and smart meters in particular, customers
are provided with a platform to empower them to
change their consumption patterns, first through
TOU pricing, then through access to their data using
programs like the Ontario Green Button Program,
and later (and deeper) through access to real-time
consumption data. Data gathered from smart meters
is essential in order to implement demand-response
programs. In the future, information from smart
meters could be generated at more frequent intervals
to improve these programs. In terms of moving MDM
to real-time, Gartner notes that there are not enough
implementation sites in production that are able to
handle multimillion endpoints with less-than-an-hour
interval data, making it difficult to prove product
scalability for many vendors. Gartner also notes that
there is a lack of data standards and agreed-up-
on business rules. While this challenge is being
Scaling Ontario’s meter data management to real-time
cation standards for AMI had been developed.18
Better data-mining capabilities, storage and retention
are needed. Utilities should take care when planning
and selecting communications and MDM technologies,
in order to maximize the overall benefits of their AMI
installations. As for the vendors, because installation
of hardware does not generate a constant stream of
revenue, higher margins can be gained in providing
the software and network.19
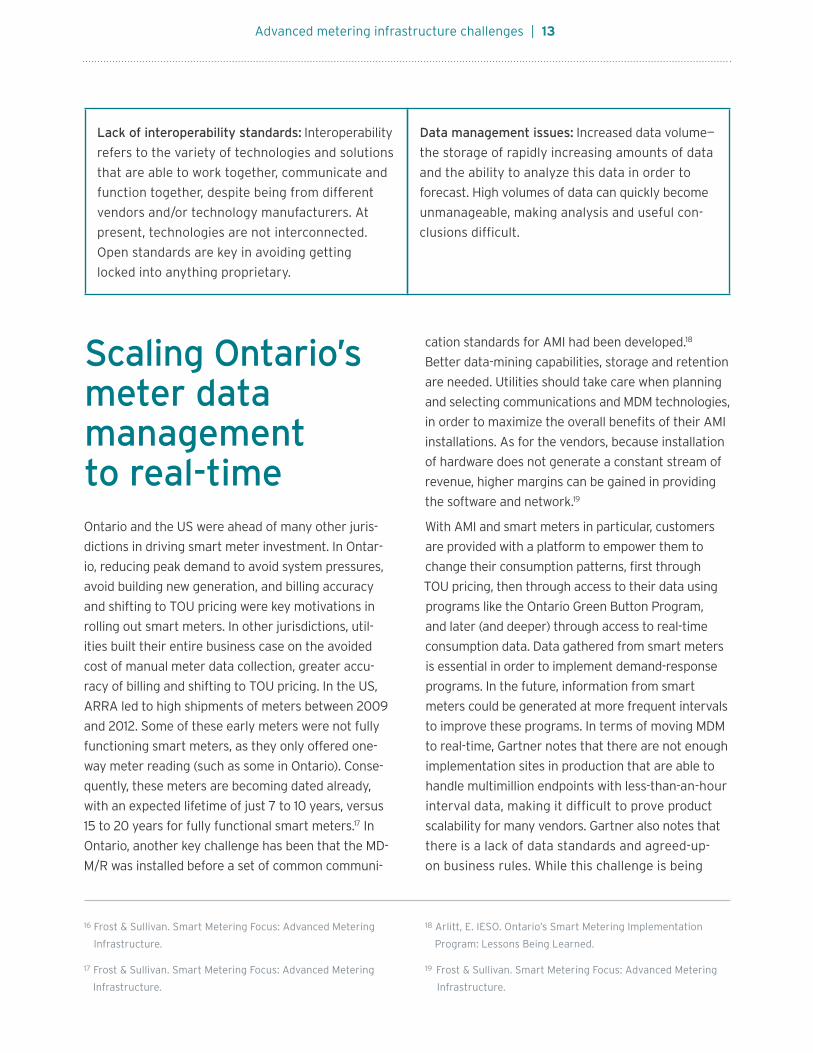
Data management issues: Increased data volume—
the storage of rapidly increasing amounts of data
and the ability to analyze this data in order to
forecast. High volumes of data can quickly become
unmanageable, making analysis and useful con-
clusions difficult.
Lack of interoperability standards: Interoperability
refers to the variety of technologies and solutions
that are able to work together, communicate and
function together, despite being from different
vendors and/or technology manufacturers. At
present, technologies are not interconnected.
Open standards are key in avoiding getting
locked into anything proprietary.
Competitive landscape | 14
addressed with vendors, standards organizations
and government participation in standards-setting
activities, the implementation of these standards is
lagging.
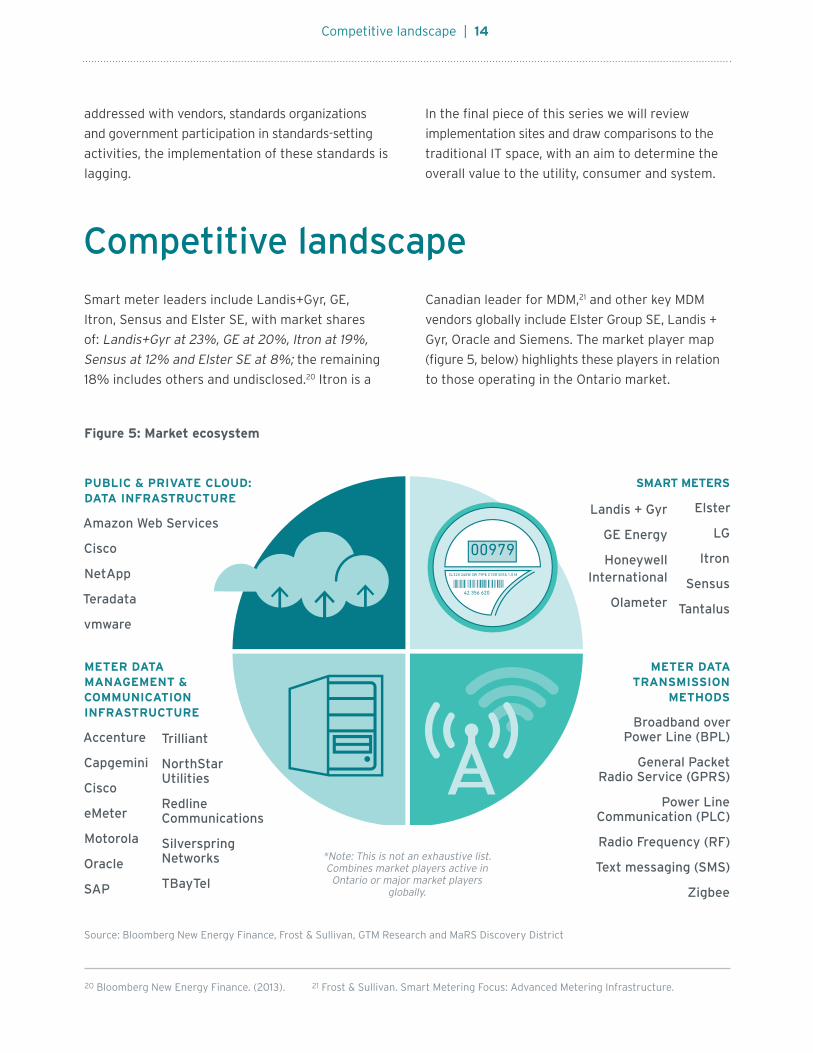
Competitive landscapeSmart meter leaders include Landis+Gyr, GE,
Itron, Sensus and Elster SE, with market shares
of: Landis+Gyr at 23%, GE at 20%, Itron at 19%,
Sensus at 12% and Elster SE at 8%; the remaining
18% includes others and undisclosed.20 Itron is a
Canadian leader for MDM,21 and other key MDM
vendors globally include Elster Group SE, Landis +
Gyr, Oracle and Siemens. The market player map
(figure 5, below) highlights these players in relation
to those operating in the Ontario market.
Figure 5: Market ecosystem
PUBLIC & PRIVATE CLOUD: DATA INFRASTRUCTURE
Amazon Web Services
Cisco
NetApp
Teradata
vmware
METER DATA MANAGEMENT & COMMUNICATION INFRASTRUCTURE
Accenture
Capgemini
Cisco
eMeter
Motorola
Oracle
SAP
Trilliant
NorthStar Utilities
Redline Communications
Silverspring Networks
TBayTel
METER DATA TRANSMISSION
METHODS
Broadband over Power Line (BPL)
General Packet Radio Service (GPRS)
Power Line Communication (PLC)
Radio Frequency (RF)
Text messaging (SMS)
Zigbee
SMART METERS
Elster
LG
Itron
Sensus
Tantalus
Landis + Gyr
GE Energy
Honeywell International
Olameter
Source: Bloomberg New Energy Finance, Frost & Sullivan, GTM Research and MaRS Discovery District
20 Bloomberg New Energy Finance. (2013). 21 Frost & Sullivan. Smart Metering Focus: Advanced Metering Infrastructure.
In the final piece of this series we will review
implementation sites and draw comparisons to the
traditional IT space, with an aim to determine the
overall value to the utility, consumer and system.
*Note: This is not an exhaustive list. Combines market players active in
Ontario or major market players globally.
The final frontier for information technology | 15
The smart meter is the utility’s gateway
to the connected home. Behind the meter,
sensors embedded in home technologies
(such as appliances, thermostats, and
entertainment and security systems) can
collect data in real time, thereby allowing
consumers to respond to utility price sig-
nals, enhance home security and enter-
tainment, and adjust comfort settings.
Smart meters and the data they provide represent
an opportunity for the utility to better understand
its customer, detect outages, better manage
operations (for example, when numerous homes
in a neighbourhood charge their cars at the same
time), and so on. All of this is an opportunity for
the utility to provide services. If utility companies
delay in leveraging the information provided by
smart meters to offer services to their customers,
they could get bypassed by other companies, such
as communications or security providers, which
already have a presence in the home.
The incentive for a consumer to invest in a smart
home goes beyond energy management. Indeed,
the value of a connected home is in entertainment,
security and in home energy management. This is
why Rogers is present in the smart home market,
and why Apple has made a move with HomeKit
The final frontier for information technology
and Google has made a move with Nest. Security
companies, like US-based Vivant, are also estab-
lishing themselves in the smart home game.
It is these market players—big telecom, IT and
security companies—that are challenging the
100+ year utility business model. According to
Bloomberg Businessweek, these companies have
an advantage because they already have access
to their clients’ homes—and those “digital portals”
could provide the companies with “back door”
access to the retail power market, which is esti-
mated to be worth about US$400 billion. David
Crane, CEO of NRG Energy is quoted as saying
“When we think of who our competitors or partners
will be, it will be the Googles, Comcasts, AT&Ts who
are already inside the meter.” According to Crane,
the utilities—some of whom struggle to make the
best use of the data available—won’t provide much
competition. We aren’t worried about the utilities,
because they have no clue how to get beyond the
meter, to be inside the house.’...”
Energy is just another suite of services these
large players can offer—and, much like healthcare,
energy is a key vertical that has yet to be trans-
formed by IT. If these major commercial players
are allowed to enter the market unhindered, the
result could be chaotic. To prevent that “Wild
West” effect, utility companies should get involved
early, and make maintaining the privacy of their
consumers a priority.