marsol d10-6 final version ms1 cs
TRANSCRIPT

The MARSOL project has received funding from the European Union's Seventh Framework Programme for Research, Technological Development and Demonstration under grant agree‐ment no 619120.
MARSOL
Demonstrating Managed Aquifer Recharge as a Solution to Water Scarcity and Drought
Combating sea‐water intrusion by managed
aquifer recharge of treated effluent at the
Malta South Demonstration Site
Deliverable No. D10.6
Version 1
Version Date 31.03.2017
Author(s) Manuel Sapiano, Michael Schembri (SEWCU)
Dissemination Level PU
Status Final

MARSOL Deliverable D10.6
2
CONTENTS
1. Introduction
2. Schematic Representation of the Managed Aquifer Recharge Scheme
3. Characterisation of the Managed Aquifer Recharge Site
4. Results – Impact of Managed Aquifer Recharge on the Aquifer System
5. Upscaling Potential of the Managed Aquifer Recharge Scheme
6. Conclusions
References

MARSOL Deliverable D10.6
3
1. INTRODUCTION
The overall objective of the Malta South Managed Aquifer Recharge (MAR) pilot site is to assess the
impact of the development of a sea‐water intrusion barrier for the protection of the southern region
of the Malta Mean Sea Level aquifer system. Groundwater abstracted from the southern region of
this Sea Level aquifer system exhibits a characteristically high chloride content. This historical
deterioration in quality has resulted from the lateral and vertical intrusion of the bounding saline
waters in response to the high abstraction rates registered in the area, particularly from the dense
and widely distributed private abstraction for agricultural purposes.
Through this pilot initiative under the MARSOL Project, a Managed Aquifer Recharge scheme is being
proposed to assess the potential development of a sea‐water intrusion barrier in coastal aquifer
hydrogeological conditions. Through the increased local recharge the MAR scheme will aim to
increase the piezometric head at the coastal margins of the aquifer system, thereby using the
increased positive pressure generated by this hydraulic head barrier to alter groundwater flow in the
region and hence protect the aquifer system from lateral and vertical sea‐water intrusion. The
impact of this MAR scheme would therefore be expected to result in an improvement of the
quantitative and qualitative conditions of the aquifer system in the region of the MAR pilot site.
The impact of this Managed Aquifer Recharge scheme will be assessed throughout the lifetime of the
project and beyond through the water level and water quality measurement probes installed in a
series of specifically developed monitoring wells, which will monitor for changes in key identified
water quantity and quality indicator parameters. The information gathered from this pilot project
under the MARSOL project is key to assess the potential of upscaling the MAR pilot site to regional
dimensions and therefore address the optimisation of groundwater quality on a regional level.

MARSOL Deliverable D10.6
4
2. SCHEMATIC REPRESENTATION OF THE MANAGED AQUIFER RECHARGE SCHEME
The Malta Mean Sea Level Aquifer system is essentially a fresh‐water floating lens aquifer system
where the freshwater body is in direct lateral and vertical contact with the underlying sea‐water
within the rock matrix. Intrusion of sea‐water into the freshwater body in response to groundwater
abstraction therefore occurs through different mechanisms, including:
(i) The lateral inflow of sea‐water due to the landward movement of the freshwater‐sea‐water
interface as shown in Figure 2.1; and
(ii) The upconing of sea‐water beneath abstraction wells in response to pumping activities (localized
intrusion).
It is worth noting that sea‐water intrusion can also occur due to natural processes such as hydro‐
dynamic dispersion, which results in the mixing (lateral inflow) of saline water into the freshwater
body due to the density and concentration difference in the dissolved salt content between the fresh
and saline (ground) water bodies.
Whilst regional intrusion affects the overall status of the aquifer system, localized intrusion has a
direct impact on the water being abstracted from the aquifer system. Localized intrusion results in
the inflow of more saline water into the abstraction point through the upwelling (upconing) of the
saline‐freshwater interface beneath the abstraction point, with the resulting mix of abstracted
groundwater having a higher salinity than the surrounding fresh groundwater.
Figure 2.1: Regional sea‐water intrusion in a coastal aquifer system.
The rate (or extent) of localized intrusion depends on a number of factors such as the yield (or
abstraction rate) from the groundwater source, the hydrogeological properties of the aquifer
formation (such as hydraulic conductivity) and also on the distance between the bottom of the
abstraction well and the freshwater‐saltwater interface. In as much, as shown in Figure 2.2, by raising
the level of the interface under the aquifer system, regional intrusion results in making the aquifer
system more prone to localized intrusion (upconing) beneath the abstraction wells.
A further characteristic of such a sea‐level or coastal aquifer is the natural discharge of freshwater
along the coast, where as a result of the freshwater head in the central regions of the aquifer system,

MARSOL Deliverable D10.6
5
water from the central region of the lens is constantly moving outwards to be eventually discharged
in the near‐coastal regions. This is a natural condition of such aquifer system, and is a pre‐requisite
for such system having a positive inland hydraulic head.
Figure 2.2: Localized Intrusion of Sea‐Water beneath an abstraction well in a coastal aquifer system.
The application of Managed Aquifer Recharge (MAR) in the context of a coastal aquifer system is
usually directed to address (mitigate) sea‐water intrusion, and therefore indirectly aims at optimising
both the quantitative and qualitative status of the aquifer system.
From a technical perspective, the expected (theoretical) benefits of a MAR scheme in such an aquifer
system are therefore considered to be twofold:
(i) The MAR system will lead to an increase in water levels (hydraulic head) in the near coastal zone
due to an increase in localized recharge. This results in the corresponding regional lowering of
the freshwater‐saltwater interface in response to the rising hydraulic heads according to the
Gyben‐Herzberg principle. The thicker freshwater lens will limit the advent of localized sea‐water
intrusion beneath groundwater abstraction stations thereby resulting in an improvement in the
quality of the abstracted groundwater; and
(ii) The MAR system will create a positive head mound which would limit the outward flow of
freshwater from the central regions of the aquifer system. The higher hydraulic heads under and
around the MAR site would modify groundwater flow conditions by inducing an inward ground‐
water flow component maintaining (blocking) fresh, naturally recharged groundwater in the
inner regions of the aquifer system, whilst preferentially discharging the recharge waters.
Furthermore the discharging recharge waters would be expected to flush out contaminants from
the coastal aquifer system, thereby having also a beneficial ‘cleaning’ effect by improving the
overall water quality of the coastal aquifer system downstream of the MAR site as shown in
Figure 2.3.

MARSOL Deliverable D10.6
6
Figure 2.3: Impact of a MAR scheme in a coastal aquifer system as a sea‐water intrusion barrier and
improvement of quality in the downstream region of the aquifer system.
It is also noted that MAR schemes in coastal regions are expected to result in the loss of a significant
fraction of the volume of recharge water which would be preferentially lost instead of natural fresh
groundwater from the inner regions of the aquifer system. Therefore from a policy/planning
perspective, under these hydrogeological conditions, the direct use of this water as a replacement to
groundwater should first be considered prior to the undertaking of any MAR scheme. Considering
Malta’s hydro‐geological conditions, current water demand patterns and the quality of water being
produced by the Barkat polishing plant, MAR should be considered as a ‘last’ solution in cases of
temporary over‐supply of water to maximize the resource benefits of the particular water supply
source.

MARSOL Deliverable D10.6
7
3. CHARACTERISATION OF THE MANAGED AQUIFER RECHARGE SITE
The Managed Aquifer Recharge site in the Malta case‐study has been located at the fringes of the
mean sea‐level aquifer system and in the immediate near‐coastal zone as shown in Figure 3.1 below.
This choice of location of the MAR site was driven by the following considerations:
‐ The availability of recharge water (highly polished treated effluent) in sufficient quantity from the
Ta Barkat water polishing site,
‐ the accessibility of the site and level of control over the site and installed equipment,
‐ the possibility of testing the impact of MAR under extreme coastal conditions, and
‐ the possibility of improving the overall status of the local aquifer system, which aquifer was
historically of a lower quality when compared to the Malta mean sea level aquifer.
In fact the site is located approximately 130 m from the coast and recharge is undertaken within the
Lower Coralline Limestone formation, the main aquifer formation in the Maltese islands. The Lower
Coralline Limestone formation is locally overlain by the Globigerina Limestone, which however is
located well above sea‐level and therefore does not affect the recharge process. The drilling logs of
the recharge wells (please refer to Deliverable D10.5) note ‘lost returns’ during drilling in the Lower
Coralline Limestone formations indicating the presence of open fractures and/or karstic cavities in
the aquifer matrix. The presence of karstification features in the aquifer formation, as noted during
the drilling of the recharge wells, represents highly heterogeneous geological conditions further
complicating the assessment of the impact of MAR at this particular site.
Figure 3.1: Layout of the MAR Site at the Ta Barkat Plant, indicating both recharge wells (RB1‐6) and monitoring wells (MB1‐4).

MARSOL Deliverable D10.6
8
Following the drilling of the monitoring wells on the site (wells MB1 ‐ MB4), water level measuring
probes (multi‐parametric probes) were installed in the wells and an initial monitoring period was
undertaken with the aim of characterising the background hydrological conditions of the aquifer
system at the recharge site.
Figure 3.2: Water level readings at Monitoring Boreholes MB2 and MB4 between March and October 2016.
The measured water levels indicate a strong tidal influence on water level, with the variations in level
(potentially) varying according to the level of karstification present in the monitoring well profile. The
water level variations in the monitoring wells were found to generally be in phase, with response
differences mainly attributable to different levels of karstification along the well profile. Figure 3.2
compares the water level readings in monitoring wells MB2 and MB4. As shown in Table 3.1, the
background mean water level at each well stands at 0.78 m and 0.74 m respectively, levels which are
expected at the fringe levels of the aquifer system. However the water level measurements in both
wells show significant variation during the monitoring period. This cyclic variation in water level
presents a further challenge in the assessment of the impact of the MAR exercise.
Table 3.1: Minimum, maximum and mean water level measurements at monitoring wells MB2 and MB4 during the initial monitoring period.
Minimum Water
Level (m)
Maximum Water
Level (m)
Mean Water Level
(m)
Monitoring Well (MB2) 0.66 0.95 0.78
Monitoring Well (MB4) 0.53 0.92 0.74
During the initial monitoring period, conductivity profiles at the monitoring wells were also under‐
taken, the results of which show relatively brackish conditions for the first 20 meters depth of the
profile with sea‐water being encountered at a depth ranging between 25 ‐ 30 m below mean sea
level. The profiles also show a relatively sharp interface between the brackish groundwater and sea‐
water. The conductivity profile for monitoring well MB4 is shown in Figure 3.3. It is noted that the

MARSOL Deliverable D10.6
9
depth of the lens below sea‐level corresponds to the measured water level head values, where
according to the Ghyben‐Herzberg principle a head of 0.75 m would be expected to correspond to an
interface depth of around 25 ‐ 30 m. Allowances in the calculation need to be made to take into
consideration the higher salinity content of ‘fresh groundwater’ at this particular MAR site.
Figure 3.3: Electrical Conductivity profile along monitoring well MB4.
The water level (multi‐parametric) pressure probes installed in the monitoring wells enabled the
measurement of other relevant parameters such as the electrical conductivity and the temperature
level of the groundwater, at a fixed depth along the monitoring well. The fixed depth refers to the
depth at which the water level pressure probes have been installed. The collection of data for these
two parameters enabled the assessment of variations in electrical conductivity and temperature in
the monitoring wells. It is noted that the water level pressure probes were installed at a depth of
15 m below mean sea level and therefore well above the freshwater‐seawater interface in the upper
‘freshwater’ section of the groundwater body.
Figure 3.4 Variation in Electrical Conductivity level (at a fixed depth) in monitoring wells.
MARSOL Deliverable D10.6
10
The electrical conductivity values at wells MB2 and MB4 were therefore measured at a fixed depth of
15 m below mean sea level and are compared in Figure 3.4. The values for electrical conductivity in
both wells show a constant lowering in the values from 3000 µS/cm to slightly over 2600 µS/cm. It is
noted that this improvement in water quality was registered before the start of the MAR exercise
and therefore cannot be attributed to an effect of MAR. This phenomenon can probably be
attributed to the mixing effect of the groundwater present in the monitoring well with outflowing
groundwater from the central parts of the island and should therefore be considered/analysed on a
medium to long term period. The short monitoring term did not permit the assessment of long‐term
cyclic variations at the monitoring wells.
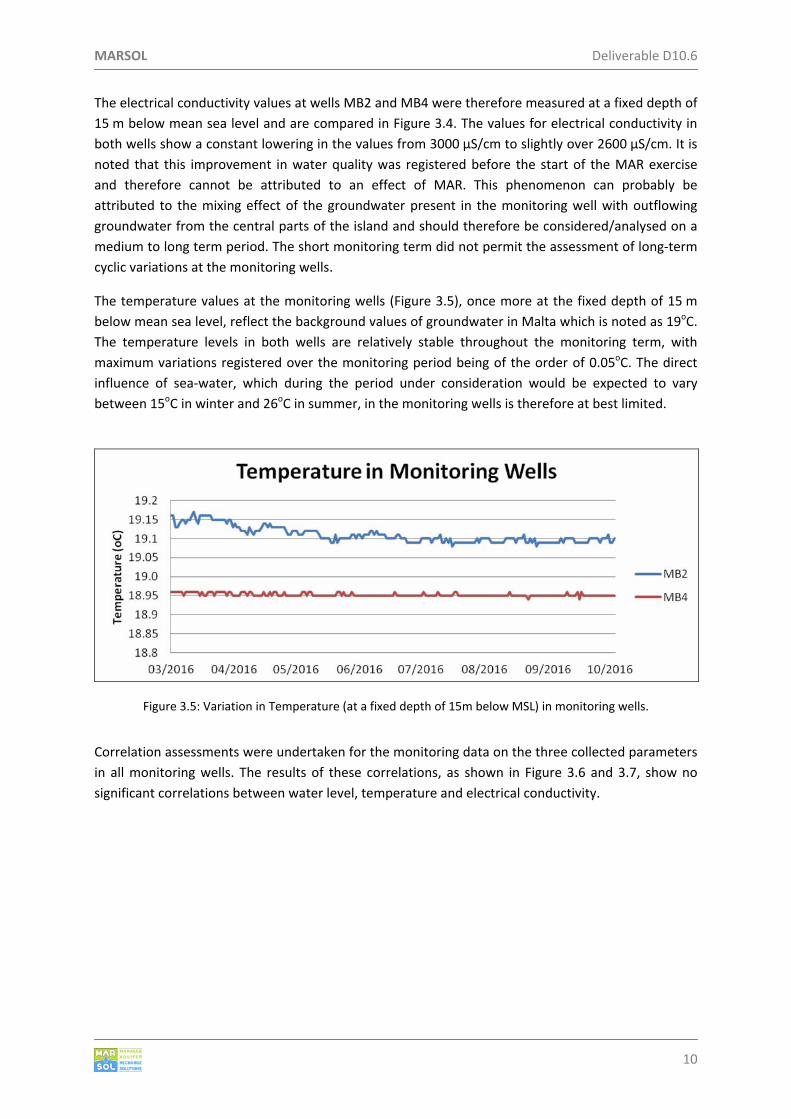
The temperature values at the monitoring wells (Figure 3.5), once more at the fixed depth of 15 m
below mean sea level, reflect the background values of groundwater in Malta which is noted as 19oC.
The temperature levels in both wells are relatively stable throughout the monitoring term, with
maximum variations registered over the monitoring period being of the order of 0.05oC. The direct
influence of sea‐water, which during the period under consideration would be expected to vary
between 15oC in winter and 26oC in summer, in the monitoring wells is therefore at best limited.
Figure 3.5: Variation in Temperature (at a fixed depth of 15m below MSL) in monitoring wells.
Correlation assessments were undertaken for the monitoring data on the three collected parameters
in all monitoring wells. The results of these correlations, as shown in Figure 3.6 and 3.7, show no
significant correlations between water level, temperature and electrical conductivity.

MARSOL Deliverable D10.6
11
Figure 3.6: Correlation between water level, groundwater temperature and electrical conductivity in Monitoring Well MB2.
Figure 3.6: Correlation between water level, groundwater temperature and electrical conductivity in Monitoring Well MB4.

MARSOL Deliverable D10.6
12
4. RESULTS – IMPACT OF MANAGED AQUIFER RECHARGE ON THE AQUIFER SYSTEM
Following the end of the aquifer characterisation assessment undertaken over a seven month period
between March and October 2016, managed aquifer recharge with highly polished treated effluent
produced at the TSE polishing plant at WSC’s Ta Barkat WWTP was initiated during the second week
of October 2016. Aquifer recharge was undertaken through six recharge wells (RB1 to RB6) located
on the north‐eastern border of the water treatment plant, downstream from the monitoring wells.
The monitoring and recharge well layout is presented in Figure 3.1 above. Recharge water was
delivered through a 75 mm diameter HDPE pipe from the polishing plant to the recharge wells
through a 300 m network connecting all the recharge wells and which was developed by the project
partner, the Water Services Corporation. The Corporation was also responsible for ensuring the
continuous flow of recharge water through the conveyance system to the recharge wells.
The physico‐chemical characteristics of the recharge water were extensively presented in Deliverable
10.5 under the MARSOL Project, where the values of the two main parameters of interest to the
MAR exercise, electrical conductivity and temperature of the treatment plant effluent are presented.
The aquifer characterisation exercise confirmed the significant differences between the treatment
plant effluent and the resident groundwater in the levels of these two parameters, where the
electrical conductivity and temperature of the resident groundwater were measured to be in the
range of 2500 ‐ 3500 µS/cm and 18.9‐19.1oC respectively (Table 4.1). Therefore, apart from water
level changes due to the increase in recharge received by the aquifer system, during the MAR
exercise, data on these two parameters will also be collected from the monitoring wells to gauge any
differences which might arise as a result of the MAR exercise. This since the difference between the
levels of the resident groundwater and the recharging effluent present a possibility for the detection
of changes in the levels of each parameter in the monitoring wells following the start of the MAR
exercise.
Table 4.1: Electrical conductivity and temperature levels for the treatment plant effluent.
Parameter Treatment Plant Effluent Groundwater
Conductivity (µS/cm) 380 2610 ‐ 3660
Temperature (oC) 23.1 18.95 ‐ 19.16
For the purpose of the MARSOL project, recharge was initiated during the second week of October
2016 and maintained over the subsequent six‐month period, up to the end of March 2017. The
analysis presented in this report therefore covers the period during which the impact of MAR on the
parameters measured in the monitoring wells is assessed. However, it is pertinent to note that MAR
was effectively continued after this period in order to permit the project partners to collect
sufficiently long‐term data to help guide the development of future (up‐scaled) MAR schemes in the
Maltese islands.
The plots below present the measurements of water level, electrical conductivity and temperature as
measured in monitoring wells MB2 and MB4 following the start of the MAR exercise in October 2016.
MARSOL Deliverable D10.6
13
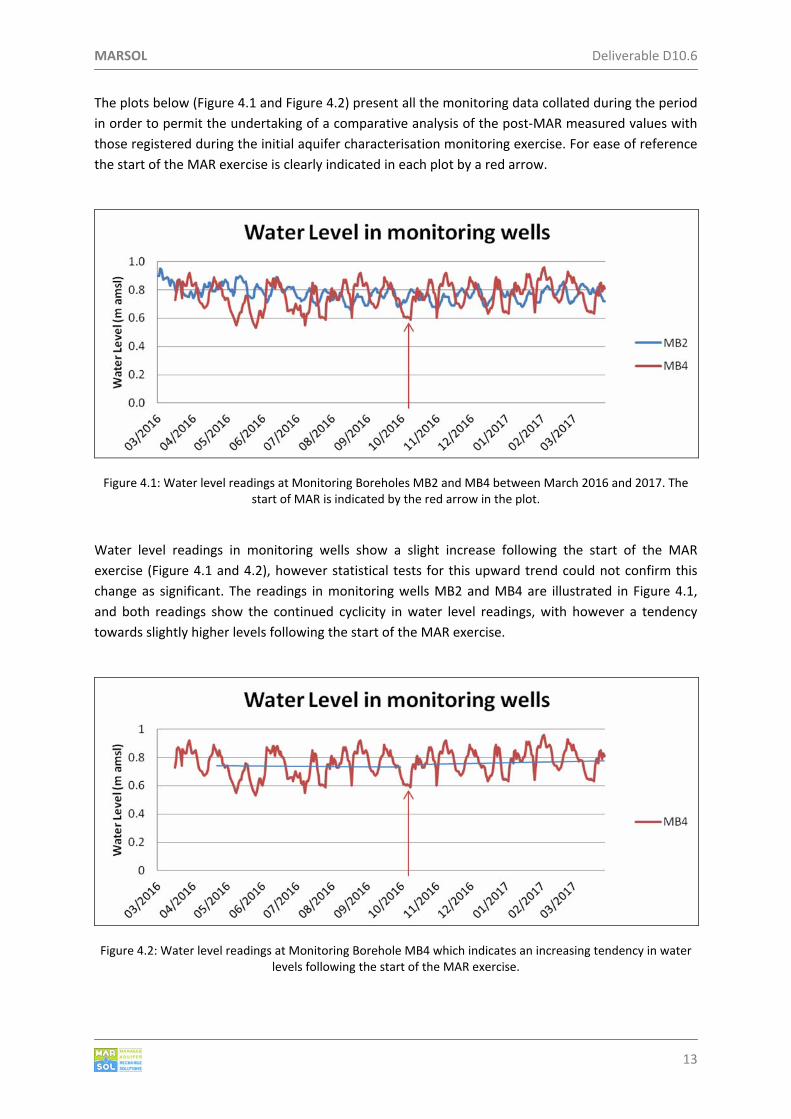
The plots below (Figure 4.1 and Figure 4.2) present all the monitoring data collated during the period
in order to permit the undertaking of a comparative analysis of the post‐MAR measured values with
those registered during the initial aquifer characterisation monitoring exercise. For ease of reference
the start of the MAR exercise is clearly indicated in each plot by a red arrow.
Figure 4.1: Water level readings at Monitoring Boreholes MB2 and MB4 between March 2016 and 2017. The start of MAR is indicated by the red arrow in the plot.
Water level readings in monitoring wells show a slight increase following the start of the MAR
exercise (Figure 4.1 and 4.2), however statistical tests for this upward trend could not confirm this
change as significant. The readings in monitoring wells MB2 and MB4 are illustrated in Figure 4.1,
and both readings show the continued cyclicity in water level readings, with however a tendency
towards slightly higher levels following the start of the MAR exercise.
Figure 4.2: Water level readings at Monitoring Borehole MB4 which indicates an increasing tendency in water levels following the start of the MAR exercise.
MARSOL Deliverable D10.6
14
The increasing tendency is illustrated in Figure 4.2 for water level readings in monitoring borehole
MB4 which in general shows a higher increase than monitoring well MB2. This is also reflected in the
maximum and minimum water level values measured during the MAR period which show a clearer
increase in the case of monitoring well MB4 as compared to monitoring well MB2 (Table 4.2).
Table 4.2: Minimum, maximum and mean water level measurements at monitoring wells MB2 and MB4 following the start of the MAR exercise. The corresponding values measured during the initial monitoring
period are presented in Fig. 4.1 and 4.2.
Minimum Water
Level (m)
Maximum Water
Level (m)
Mean Water Level
(m)
Monitoring Well (MB2) 0.66 (0.66) 0.86 (0.95) 0.76 (0.78)
Monitoring Well (MB4) 0.59 (0.53) 0.96 (0.92) 0.77 (0.74)
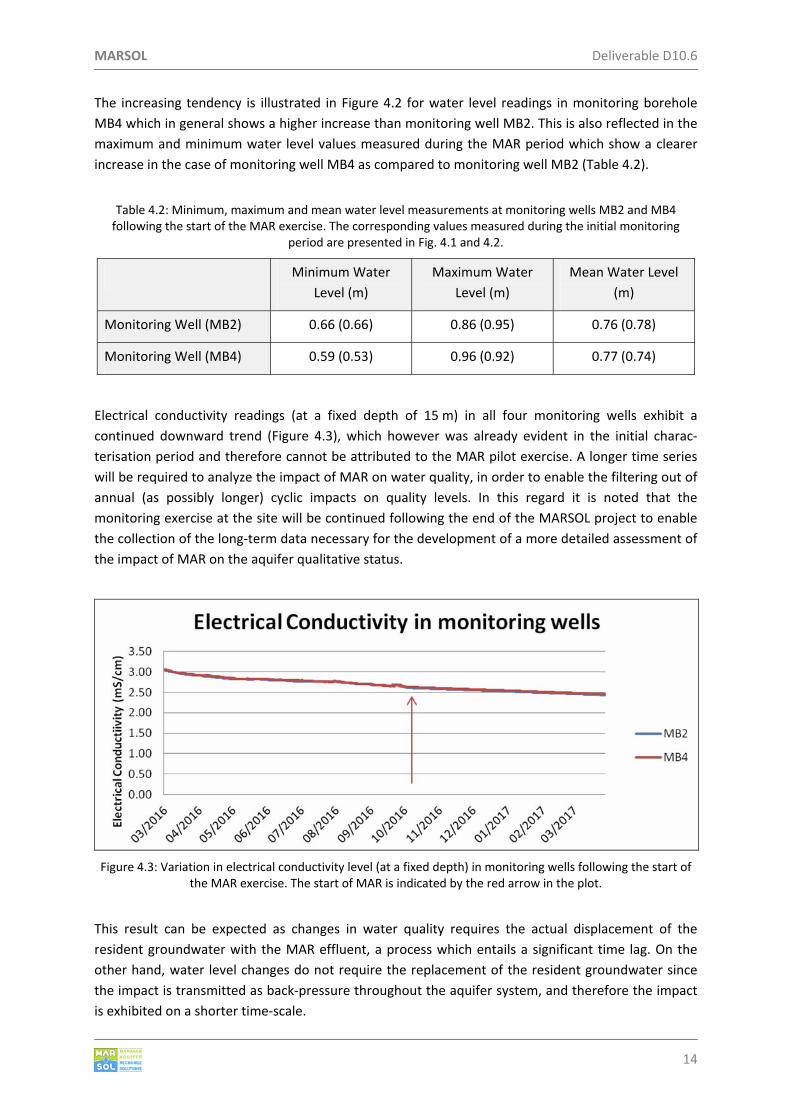
Electrical conductivity readings (at a fixed depth of 15 m) in all four monitoring wells exhibit a
continued downward trend (Figure 4.3), which however was already evident in the initial charac‐
terisation period and therefore cannot be attributed to the MAR pilot exercise. A longer time series
will be required to analyze the impact of MAR on water quality, in order to enable the filtering out of
annual (as possibly longer) cyclic impacts on quality levels. In this regard it is noted that the
monitoring exercise at the site will be continued following the end of the MARSOL project to enable
the collection of the long‐term data necessary for the development of a more detailed assessment of
the impact of MAR on the aquifer qualitative status.
Figure 4.3: Variation in electrical conductivity level (at a fixed depth) in monitoring wells following the start of the MAR exercise. The start of MAR is indicated by the red arrow in the plot.
This result can be expected as changes in water quality requires the actual displacement of the
resident groundwater with the MAR effluent, a process which entails a significant time lag. On the
other hand, water level changes do not require the replacement of the resident groundwater since
the impact is transmitted as back‐pressure throughout the aquifer system, and therefore the impact
is exhibited on a shorter time‐scale.

MARSOL Deliverable D10.6
15
In effect, similarly to electrical conductivity, temperature readings in the monitoring wells do not
exhibit any variation following the start of the MAR exercise. The readings, presented in Figure 4.4,
show an initial increase of 0.05oC at the exact start of the MAR exercise of monitoring well MB2, with
values than settling once more at 19.1oC. Such small variations in temperature were also identified
during the initial monitoring period (March 2016) and hence cannot be attributed to the MAR
exercise. The temperature readings for the other monitoring wells were relatively stable, as shown
for well MB4 in Figure 4.4 below.
Figure 4.4: Variation in Temperature levels (at a fixed depth of 15 m below MSL) in monitoring wells following the start of the MAR exercise. The start of MAR is indicated by the red arrow in the plot.
Correlation analyses were also undertaken for the three parameters measured in each monitoring
well. The analyses for monitoring wells MB2 and MB4 are presented in Figures 4.5 and 4.6 below.
The correlation analysis confirmed the assessment of the individual parameters, since no significant
correlation could be identified between the collected data for water level, electrical conductivity and
temperature in all the monitoring wells.
Figure 4.5: Correlation between water level, groundwater temperature and electrical conductivity in Monito‐ring Well MB2 during the whole monitoring period. The start of MAR is indicated by the red arrow in the plot.

MARSOL Deliverable D10.6
16
Figure 4.6: Correlation between water level, groundwater temperature and electrical conductivity in Monito‐ring Well MB4 during the whole monitoring period. The start of MAR is indicated by the red arrow in the plot.

MARSOL Deliverable D10.6
17
5. UPSCALING POTENTIAL OF THE MANAGED AQUIFER RECHARGE SCHEME
The local increase in hydraulic head around the recharge wells is the main outcome resulting from
the MAR site at Ta Barkat undertaken through the MARSOL project. Although the statistical signi‐
ficance of this increase in hydraulic head could not be determined during the monitoring period
under the project, monitoring will be continued following the end of the project to confirm this
increase in hydraulic head and enable the assessment of any corresponding changes in the local
qualitative status of the aquifer system.
The MAR pilot site at Ta Barkat was intended as a test site to assess the practical impact of managed
aquifer recharge in combating sea‐water intrusion in a coastal groundwater system. It is planned that
the results of this pilot site will help guide the development of an upscaled MAR system further
inland in the Malta south sea‐level aquifer system. The planned MAR site is located in a region where
the aquifer system is laterally confined by less‐permeable formations. An increase in hydraulic head
would thus change hydraulic gradients and limit the outflow of groundwater from the central regions
of the Malta mean sea level aquifer system. Furthermore, the discharging recharged water would
flush out polluted groundwater downstream from the MAR site.
Figure 5.1: Planned up‐scaled MAR site in the Malta South mean sea‐level
aquifer system. The red line indicates the location of the proposed MAR site.
Under the MARSOL project, the planned up‐scaled MAR scheme was assessed through the develop‐
ment of a numerical model of the aquifer system. As shown in Figure 5.2, following the start of the
MAR scheme, the numerical model indicates an increase in hydraulic head on the order of 0.3m at
the MAR site. The increase in hydraulic head registered at the pilot site at Ta Barkat, once statistically
confirmed, will increase the confidence in the impact of MAR under these specific coastal aquifer
system conditions. These initial results (Figure 5.2) therefore confirm the potential of MAR as a tool
to address sea‐water intrusion in a coastal aquifer system, as the residual higher hydraulic head will

MARSOL Deliverable D10.6
18
modify hydraulic gradients in the region, thereby protecting the inner regions of the aquifer system
(improve quantitative status) and flush out contaminants from the downstream regions of the aqui‐
fer system (improve qualitative status). In the longer term, the MAR scheme would also be expected
to have a beneficial impact on the qualitative status of the inner regions of the aquifer system. As
indicated from the results of the MAR pilot site at Ta Barkat, however, upstream qualitative impacts
in the more central regions of the Malta mean sea level aquifer are expected to manifest themselves
over a longer timescale given the slow response of the aquifer system.
Figure 5.2: Modelled impact of the eventual up‐scaled MAR site.

MARSOL Deliverable D10.6
19
6. CONCLUSION
The Managed Aquifer Recharge pilot site installed at the Ta Barkat Wastewater Treatment Plant
under the MARSOL project was intended to assess the impact of MAR with highly polished treated
effluent on the qualitative and quantitative status of a local coastal aquifer system. The quantitative
and qualitative data collected during the pilot project would thus be used to assess the eventual
potential application of MAR on a more regional scale to optimise the management of the regional
aquifer system.
The choice of the MARSOL pilot‐project site, which is located within the precincts of the Ta Barkat
WWTP, was mainly guided by the availability of highly polished treated effluent in the area and the
level of access and control on monitoring and recharge wells. The site also presented a possibility of
testing the impact of MAR under extreme coastal conditions, given the close proximity of the pilot
site to the coast.
An initial monitoring period of 8 months was undertaken to enable the characterisation of the
aquifer system. The parameters identified for the purpose of the monitoring programme where
water level – the main parameter for the determination of groundwater quantitative status, and
electrical conductivity and groundwater temperature in view of the significant difference between
the latter parameters between the resident groundwater and the recharge effluent. The main results
registered during the initial monitoring period were the identification of:
‐ A short‐term cyclic fluctuation in water level, reflecting the direct impact of sea‐water tidal effects,
‐ a longer‐term decreasing trend in the level of conductivity, which could not be effectively assessed
in the short period of monitoring, and
‐ a groundwater temperature of the order of 19oC, closely reflecting the background temperature of
groundwater in the Maltese islands.
The cycling variation in groundwater level and the relatively short‐time span for the background
monitoring were the two main factors which were identified as limiting factors to permit a detailed
assessment to detect and identify any changes resulting from the implementation of the managed
aquifer recharge exercise.
Following the start of the MAR, through the injection of highly polished treated effluent in six
recharge wells, monitoring for the three identified parameters was continued for a period of 6
months. The main results identified during this monitoring period include:
‐ An increase in water levels in the monitoring wells compared to the pre‐recharge levels. The
increase was however not statistically significant,
‐ a continued decreasing trend in the electrical conductivity levels of the groundwater, reflecting the
pre‐MAR trends, and
‐ a stable temperature reflecting the background levels of the resident groundwater.

MARSOL Deliverable D10.6
20
The data gathered during the 6 month post‐MAR monitoring period was not sufficient to isolate the
impact of MAR on groundwater status at the pilot site at a statistically significant level. Monitoring
will be continued following the end of the project to enable the collation of longer term data to
enable more detailed analysis of the impact of MAR on the coastal aquifer system.
However, the initial results obtained during the course of the MARSOL project indicate an increase in
the hydraulic head in the local aquifer system located in the area beneath the MAR site, in response
to the increased recharge. No qualitative impacts could be identified in the monitoring wells
following the start of the MAR exercise. However, from a hydrogeological perspective qualitative
impacts are expected to be discernible following a reasonable lag‐time, required for the recharge
water to move through the aquifer system and reach the monitoring wells – and in this case against
the prevailing hydraulic gradient at the time of initiation of MAR activity.
The indicative increase in hydraulic head is a promising result, in particular with reference to plans to
upscale MAR activity in Malta on a regional scale to support the quantitative and qualitative
optimisation of the Malta south mean sea level aquifer system. The results of a modelling exercise
undertaken during the course of the MARSOL project indicate that MAR can sufficiently increase
hydraulic heads to modify prevailing hydraulic gradients on a regional level and thus enable the
better protection of the aquifer system from the impacts of sea‐water intrusion. Monitoring of
groundwater properties in the pilot site’s monitoring wells will thus be continued in the post‐
MARSOL project period to enable the collation of sufficient data to reliably support the development
of MAR on a regional basis.

MARSOL Deliverable D10.6
21
REFERENCES
FAO (1997). Sea‐water intrusion in coastal aquifers: guidelines for study, monitoring and control. FAO
Water Report No. 11. Rome.
Fetter C.W., (2000). Applied Hydrogeology. 4th edn. Prentice Hall Publishing.
Mangion J., Sapiano M. (2008). The Mean Sea Level Aquifer, Malta and Gozo, in Natural Groundwater
Quality, Blackwell Publishing 400‐420.
Micallef P. (2016). Development of a distribution network delivering treated effluent from WWTO to
the recharge boreholes – MARSOL Deliverable 10.5.
Monteiro J.P., Costa L., Hugman R., Sapiano M., Schembri M. (2016). Regional Groundwater Model of
the Malta South Region – MARSOL Deliverable 10.4.
Sapiano M., Schembri M. (2016). Characterisation of the sea‐level aquifer system in the Malta South
Region – MARSOL Deliverable 10.1.