maruti suzuki india ltd. - ventura securities ltdmaruti suzuki india ltd. (msil), a subsidiary of...
TRANSCRIPT
Maruti Suzuki India Ltd.
BUY
- 1 of 18 - Tuesday 1st October, 2013
This document is for private circulation, and must be read in conjunction with the disclaimer on the last page.
ST
OC
K P
OIN
TE
R
Target Price `1,664 CMP `1,380 FY15 PE 12.4x
Index Details We initiate coverage on Maruti Suzuki India Ltd (MSIL) as a BUY with a Price Objective of `1,664. At the CMP of `1,380, the stock is trading at 15.3x and 12.4x its estimated earnings for FY14E & FY15E respectively, representing a potential upside of ~21% over a period of 18 months.
We are particularly enthused by the fact that MSIL over the last two years, despite challenging times like the Manesar plant lock out and intense competition across segments, has been able to maintain market share across all segments. We strongly believe that when the auto revival resumes MSIL would be best placed to benefit from this.
In the near term, we expect new models in the compact & hatchback (WagonR Stingray & Swift Sport) and SUV segment (XA Alpha) to drive sales growth. In addition, diesel engine capacity expansion and SPIL merger coupled with increasing localization initiatives (on the input side) will enhance scale of operations and improve operating margins. We forecast revenues and earnings to grow at a CAGR of 8.2% and 18.3% to `51,048 and `3,350.2 crore, respectively over FY14-15E.
Despite challenging times, MSIL is well placed to sustain
market share
Although MSIL (with its 1.1% growth to 4,37,056 units YTD in FY14) seems to
have bucked the prevailing recessionary trend in the PV segment, we have to
bear in mind that this growth was due to the low base effect (due to plant lock out
at Manesar) in the last fiscal. However, we could expect an improved
performance going forth as the monsoon has been satisfactory and elections are
around the corner. We expect the launch of new models, WagonR Stingray, Swift
Sport and SUV XA Alpha to drive sales.
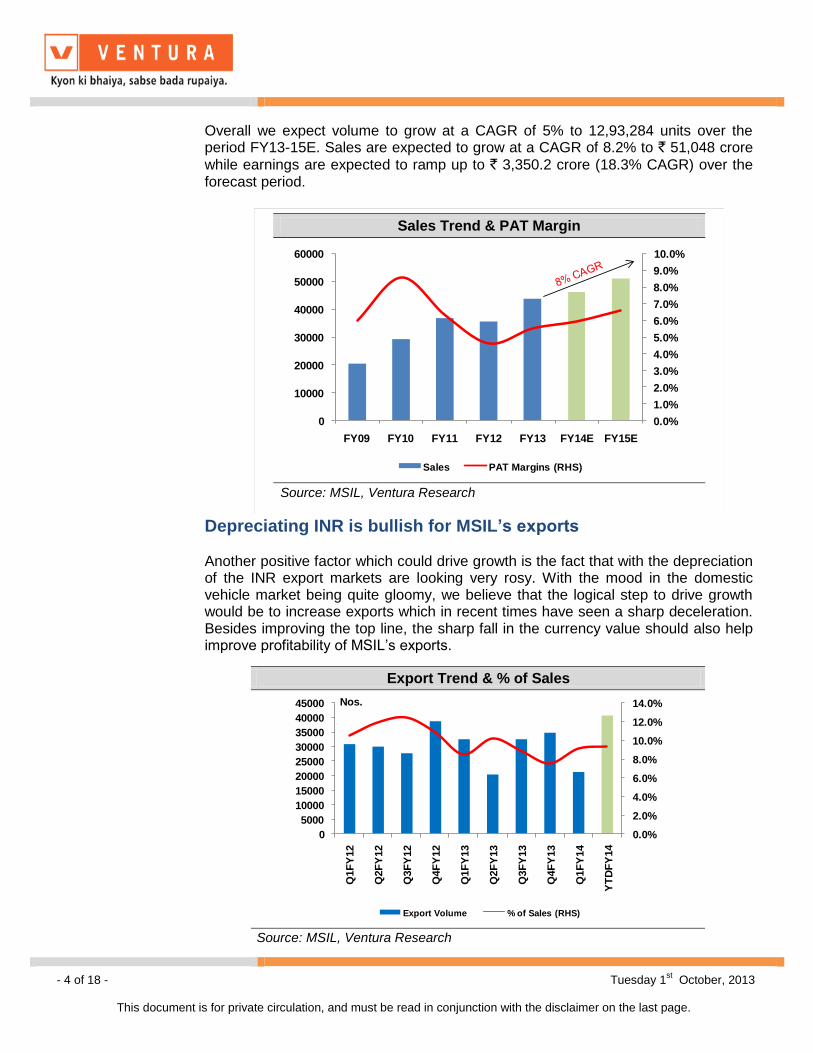
Overall we expect volume to grow at a CAGR of 5% to 12,93,284 units over the
period FY13-15E. Sales are expected to grow at a CAGR of 8.2% to `51,048
crore while earnings are expected to ramp up to `3,350.2 crore (18.3% CAGR)
over the forecast period.
Sensex 19,517
Nifty 5,780
BSE 100 5,765
Industry Automobile
Scrip Details
Mkt Cap (` cr) 41,687
BVPS (`) 629.9
O/s Shares (Cr) 30.2
Av Vol (Lacs) 0.6
52 Week H/L 1773/1217
Div Yield (%) 0.6
FVPS (`) 5.0
Shareholding Pattern
Shareholders %
Promoters 56.2
DIIs 13.1
FIIs 22.0
Public 8.7
Total 100.0
Maruti Suzuki vs. Sensex
Key Financials (` in Cr)
Y/E Mar Net
Revenue EBITDA PAT EPS
EPS Growth (%)
RONW (%)
ROCE (%)
P/E (x)
EV/EBITDA (x)
2012 35,587.1 2,513.0 1,635.2 56.6 -28.6 10.8 21.6 24.4 16.7
2013 43,588.0 4,229.8 2,392.3 79.2 39.9 12.9 25.9 17.4 9.9
2014E 46,104.1 4,744.0 2,724.5 90.2 13.9 13.0 25.6 15.3 8.8
2015E 51,048.6 5,712.2 3,350.2 110.9 23.0 13.9 26.8 12.4 7.3
- 2 of 18 - Tuesday 1st October, 2013
This document is for private circulation, and must be read in conjunction with the disclaimer on the last page.
Increased localization and other measures to boost margins
The merger of diesel engine manufacturing facility Suzuki Powertrain India Ltd.
(SPIL) with itself, expansion of diesel engine capacity and thrust towards increased
localization should help boost margins besides lower exposure to the currency
fluctuations (through lowered imports). We expect margins to improve by 150 bps
to 11.2% by FY15E.
Further the new R&D centre at Rohtak, apart from being a valuable contributor to new technological advancement, should provide significant tax savings which should improve PAT margins. We expect PAT margins to improve to 6.6% by FY15E from the current 5.5% clocked in FY13.
Valuation
We initiate coverage on MSIL as a BUY with a Price Objective of `1,664 (target PE 15x) representing a potential upside of ~21% over a period of 18 months. At the CMP of `1,380, the stock is trading at 15.3x and 12.4x its estimated earnings for FY14E and FY15E respectively. Improved product mix along with increased localization and operational synergies of the SPIL merger should enable MSIL to boost revenue and profitability going forward. Accordingly we expect sales and earnings to grow at a CAGR of 8.2% & 18.3%, respectively to `51,048.6 crore & `3,350.2 crore by FY15.
- 3 of 18 - Tuesday 1st October, 2013
This document is for private circulation, and must be read in conjunction with the disclaimer on the last page.
Company Background
Maruti Suzuki India Ltd. (MSIL), a subsidiary of Suzuki Motor Corporation, Japan (with a 54.2% stake), is the largest passenger car (PV) company in India, accounting for 40% of the domestic passenger car market. MSIL derives ~64% of its domestic sales volume from the small car segment and has a dominant position in the segment with a market share of ~61%. The company operates from two facilities in India (Gurgaon and Manesar) and is in the process of expanding its manufacturing capacity to 1.8 mn units (1.26 mn units in FY13) by FY15. Currently, exports account for ~8% of its overall sales volume and MSIL is striving hard to expand its market in the non European countries (thereby reducing its dependency on the deteriorating European markets).
Key Investment Highlights
Despite challenging times, MSIL is well placed to sustain
market share
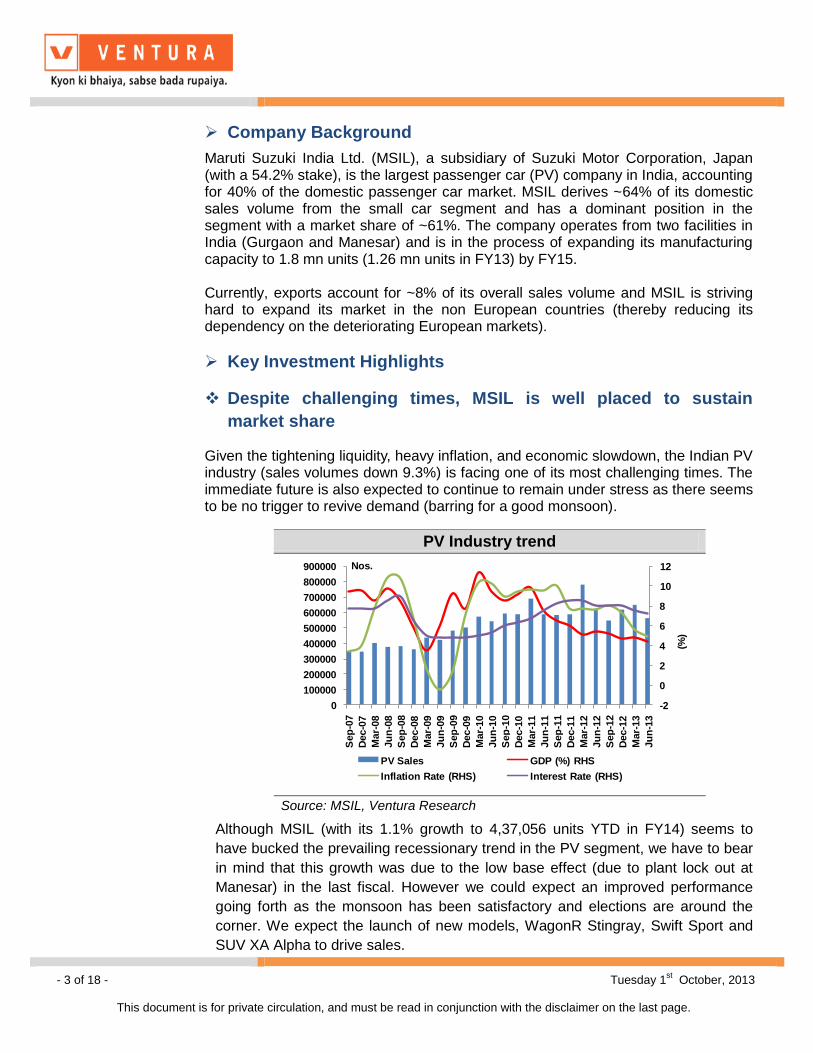
Given the tightening liquidity, heavy inflation, and economic slowdown, the Indian PV industry (sales volumes down 9.3%) is facing one of its most challenging times. The immediate future is also expected to continue to remain under stress as there seems to be no trigger to revive demand (barring for a good monsoon).
Although MSIL (with its 1.1% growth to 4,37,056 units YTD in FY14) seems to
have bucked the prevailing recessionary trend in the PV segment, we have to bear
in mind that this growth was due to the low base effect (due to plant lock out at
Manesar) in the last fiscal. However we could expect an improved performance
going forth as the monsoon has been satisfactory and elections are around the
corner. We expect the launch of new models, WagonR Stingray, Swift Sport and
SUV XA Alpha to drive sales.
PV Industry trend
-2
0
2
4
6
8
10
12
0
100000
200000
300000
400000
500000
600000
700000
800000
900000
Sep
-07
Dec-0
7
Mar-
08
Ju
n-0
8
Sep
-08
Dec-0
8
Mar-
09
Ju
n-0
9
Sep
-09
Dec-0
9
Mar-
10
Ju
n-1
0
Sep
-10
Dec-1
0
Mar-
11
Ju
n-1
1
Sep
-11
Dec-1
1
Mar-
12
Ju
n-1
2
Sep
-12
Dec-1
2
Mar-
13
Ju
n-1
3
(%)
Nos.
PV Sales GDP (%) RHS
Inflation Rate (RHS) Interest Rate (RHS)
Source: MSIL, Ventura Research
- 4 of 18 - Tuesday 1st October, 2013
This document is for private circulation, and must be read in conjunction with the disclaimer on the last page.
Overall we expect volume to grow at a CAGR of 5% to 12,93,284 units over the period FY13-15E. Sales are expected to grow at a CAGR of 8.2% to ` 51,048 crore
while earnings are expected to ramp up to ` 3,350.2 crore (18.3% CAGR) over the forecast period.
Depreciating INR is bullish for MSIL’s exports Another positive factor which could drive growth is the fact that with the depreciation of the INR export markets are looking very rosy. With the mood in the domestic vehicle market being quite gloomy, we believe that the logical step to drive growth would be to increase exports which in recent times have seen a sharp deceleration. Besides improving the top line, the sharp fall in the currency value should also help improve profitability of MSIL’s exports.
Export Trend & % of Sales
0.0%
2.0%
4.0%
6.0%
8.0%
10.0%
12.0%
14.0%
0
5000
10000
15000
20000
25000
30000
35000
40000
45000
Q1F
Y12
Q2F
Y12
Q3F
Y12
Q4F
Y12
Q1F
Y13
Q2F
Y13
Q3F
Y13
Q4F
Y13
Q1F
Y14
YT
DF
Y14
Nos.
Export Volume % of Sales (RHS)
Source: MSIL, Ventura Research
Sales Trend & PAT Margin
0.0%
1.0%
2.0%
3.0%
4.0%
5.0%
6.0%
7.0%
8.0%
9.0%
10.0%
0
10000
20000
30000
40000
50000
60000
FY09 FY10 FY11 FY12 FY13 FY14E FY15E
Sales PAT Margins (RHS)
Source: MSIL, Ventura Research
- 5 of 18 - Tuesday 1st October, 2013
This document is for private circulation, and must be read in conjunction with the disclaimer on the last page.
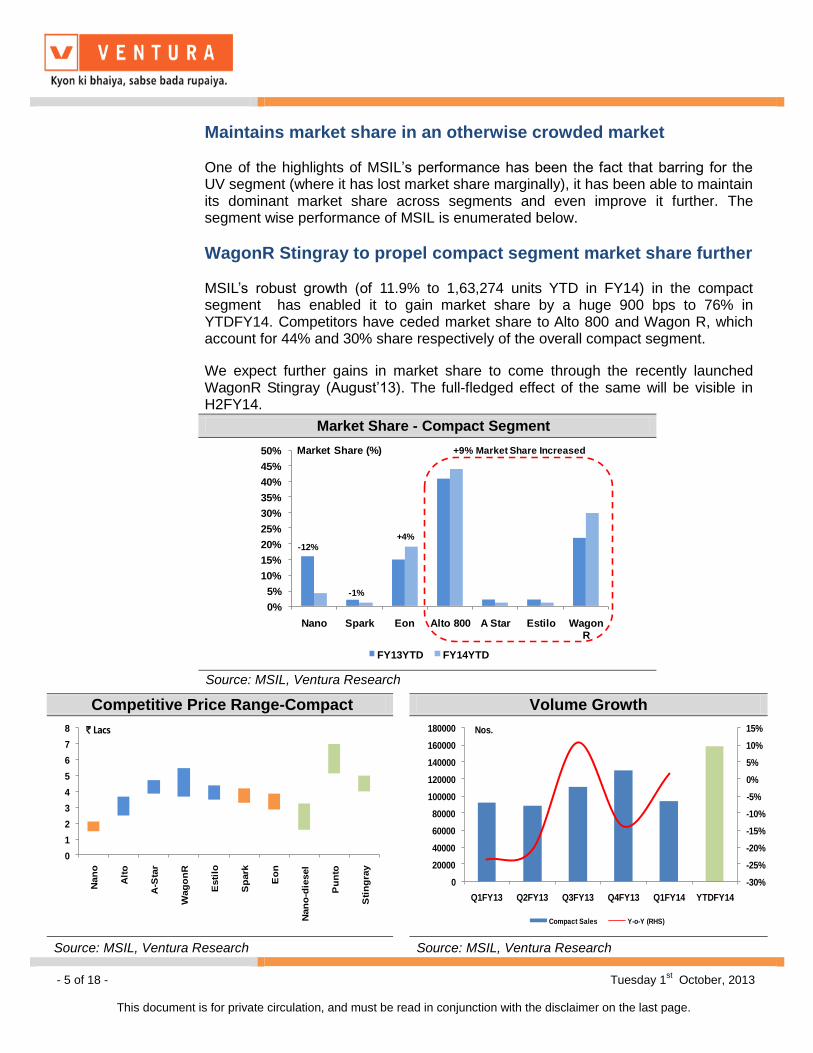
Maintains market share in an otherwise crowded market One of the highlights of MSIL’s performance has been the fact that barring for the UV segment (where it has lost market share marginally), it has been able to maintain its dominant market share across segments and even improve it further. The segment wise performance of MSIL is enumerated below.
WagonR Stingray to propel compact segment market share further MSIL’s robust growth (of 11.9% to 1,63,274 units YTD in FY14) in the compact segment has enabled it to gain market share by a huge 900 bps to 76% in YTDFY14. Competitors have ceded market share to Alto 800 and Wagon R, which account for 44% and 30% share respectively of the overall compact segment.
We expect further gains in market share to come through the recently launched WagonR Stingray (August’13). The full-fledged effect of the same will be visible in H2FY14.
Competitive Price Range-Compact Volume Growth
0
1
2
3
4
5
6
7
8
Nan
o
Alt
o
A-S
tar
Wag
on
R
Esti
lo
Sp
ark
Eo
n
Nan
o-d
iesel
Pu
nto
Sti
ng
ray
` Lacs
-30%
-25%
-20%
-15%
-10%
-5%
0%
5%
10%
15%
0
20000
40000
60000
80000
100000
120000
140000
160000
180000
Q1FY13 Q2FY13 Q3FY13 Q4FY13 Q1FY14 YTDFY14
Nos.
Compact Sales Y-o-Y (RHS)
Source: MSIL, Ventura Research Source: MSIL, Ventura Research
Market Share - Compact Segment
0%
5%
10%
15%
20%
25%
30%
35%
40%
45%
50%
Nano Spark Eon Alto 800 A Star Estilo Wagon R
Market Share (%)
FY13YTD FY14YTD
+9% Market Share Increased
-1%
+4%
-12%
Source: MSIL, Ventura Research
- 6 of 18 - Tuesday 1st October, 2013
This document is for private circulation, and must be read in conjunction with the disclaimer on the last page.
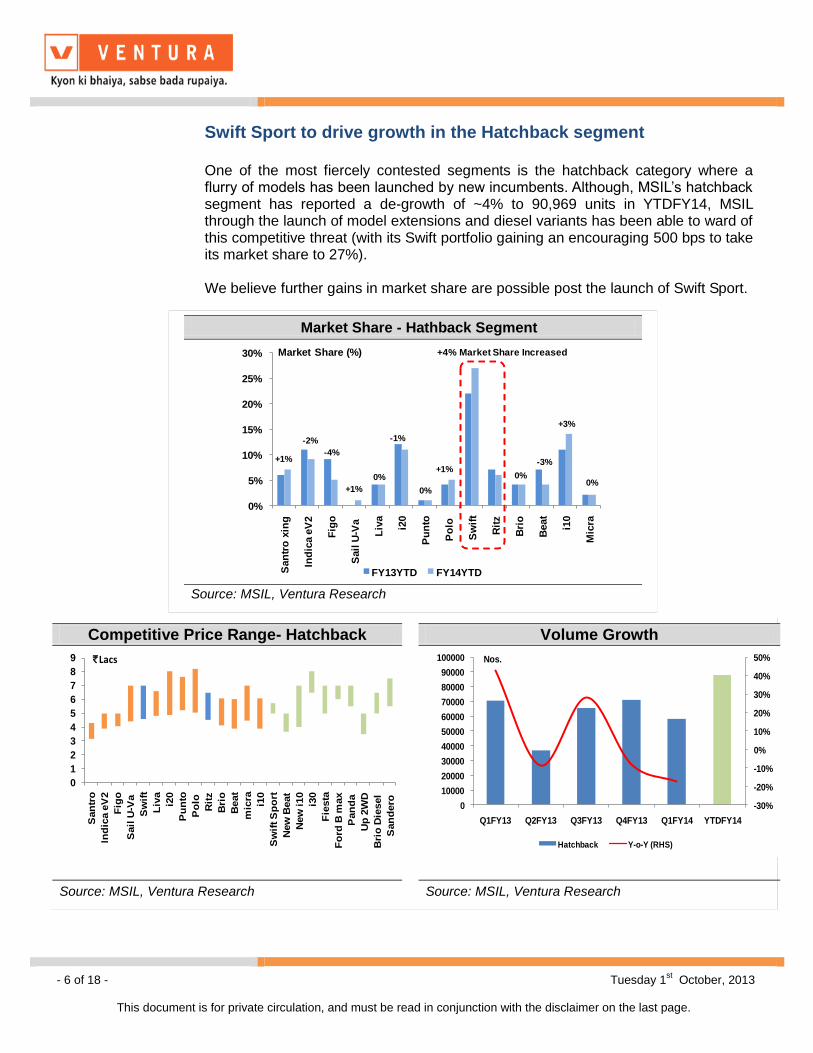
Swift Sport to drive growth in the Hatchback segment One of the most fiercely contested segments is the hatchback category where a flurry of models has been launched by new incumbents. Although, MSIL’s hatchback segment has reported a de-growth of ~4% to 90,969 units in YTDFY14, MSIL through the launch of model extensions and diesel variants has been able to ward of this competitive threat (with its Swift portfolio gaining an encouraging 500 bps to take its market share to 27%). We believe further gains in market share are possible post the launch of Swift Sport.
Competitive Price Range- Hatchback Volume Growth
0
1
2
3
4
5
6
7
8
9
San
tro
Ind
ica e
V2
Fig
o
Sail
U-V
a
Sw
ift
Liv
a
i20
Pu
nto
Po
lo
Rit
z
Bri
o
Beat
mic
ra
i10
Sw
ift S
po
rt
New
Beat
New
i10
i30
Fie
sta
Fo
rd B
max
Pan
da
Up
2W
D
Bri
o D
iesel
San
dero
`Lacs
-30%
-20%
-10%
0%
10%
20%
30%
40%
50%
0
10000
20000
30000
40000
50000
60000
70000
80000
90000
100000
Q1FY13 Q2FY13 Q3FY13 Q4FY13 Q1FY14 YTDFY14
Nos.
Hatchback Y-o-Y (RHS)
Source: MSIL, Ventura Research Source: MSIL, Ventura Research
Market Share - Hathback Segment
0%
5%
10%
15%
20%
25%
30%
San
tro
xin
g
Ind
ica e
V2
Fig
o
Sail
U-V
a
Liv
a
i20
Pu
nto
Po
lo
Sw
ift
Rit
z
Bri
o
Beat
i10
Mic
ra
Market Share (%)
FY13YTD FY14YTD
+4% Market Share Increased
+1%
-2% -1%
+1%-3%
0%0%
0%
+3%
0%
+1%
-4%
Source: MSIL, Ventura Research
- 7 of 18 - Tuesday 1st October, 2013
This document is for private circulation, and must be read in conjunction with the disclaimer on the last page.
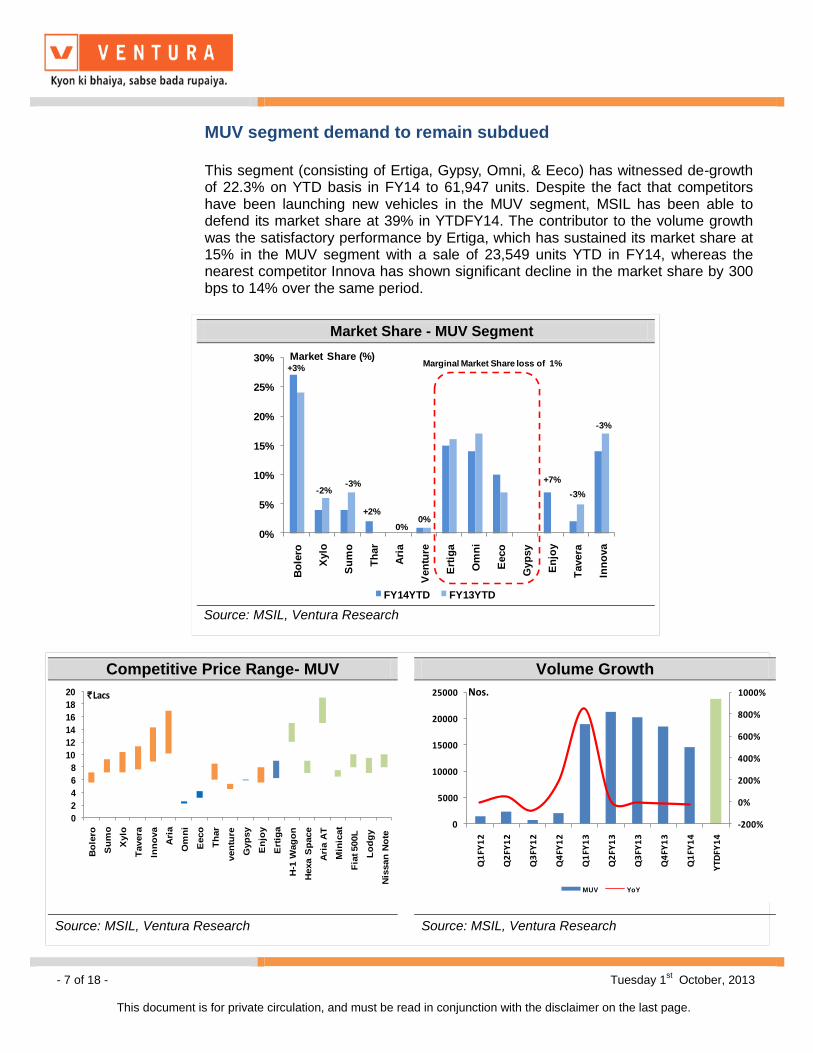
MUV segment demand to remain subdued This segment (consisting of Ertiga, Gypsy, Omni, & Eeco) has witnessed de-growth of 22.3% on YTD basis in FY14 to 61,947 units. Despite the fact that competitors have been launching new vehicles in the MUV segment, MSIL has been able to defend its market share at 39% in YTDFY14. The contributor to the volume growth was the satisfactory performance by Ertiga, which has sustained its market share at 15% in the MUV segment with a sale of 23,549 units YTD in FY14, whereas the nearest competitor Innova has shown significant decline in the market share by 300 bps to 14% over the same period.
Competitive Price Range- MUV Volume Growth
0
2
4
6
8
10
12
14
16
18
20
Bo
lero
Su
mo
Xylo
Tavera
Inn
ova
Ari
a
Om
ni
Eeco
Th
ar
ven
ture
Gyp
sy
En
joy
Ert
iga
H-1
Wag
on
Hexa S
pace
Ari
a A
T
Min
icat
Fia
t 500L
Lo
dg
y
Nis
san
No
te
`Lacs
-200%
0%
200%
400%
600%
800%
1000%
0
5000
10000
15000
20000
25000
Q1
FY1
2
Q2
FY1
2
Q3
FY1
2
Q4
FY1
2
Q1
FY1
3
Q2
FY1
3
Q3
FY1
3
Q4
FY1
3
Q1
FY1
4
YTD
FY1
4
Nos.
MUV YoY
Source: MSIL, Ventura Research Source: MSIL, Ventura Research
Market Share - MUV Segment
0%
5%
10%
15%
20%
25%
30%
Bo
lero
Xylo
Su
mo
Th
ar
Ari
a
Ven
ture
Ert
iga
Om
ni
Eeco
Gyp
sy
En
joy
Tavera
Inn
ova
Market Share (%)
FY14YTD FY13YTD
Marginal Market Share loss of 1%+3%
-3%
-3%-2%
+7%
-3%
+2%
0%0%
Source: MSIL, Ventura Research
- 8 of 18 - Tuesday 1st October, 2013
This document is for private circulation, and must be read in conjunction with the disclaimer on the last page.
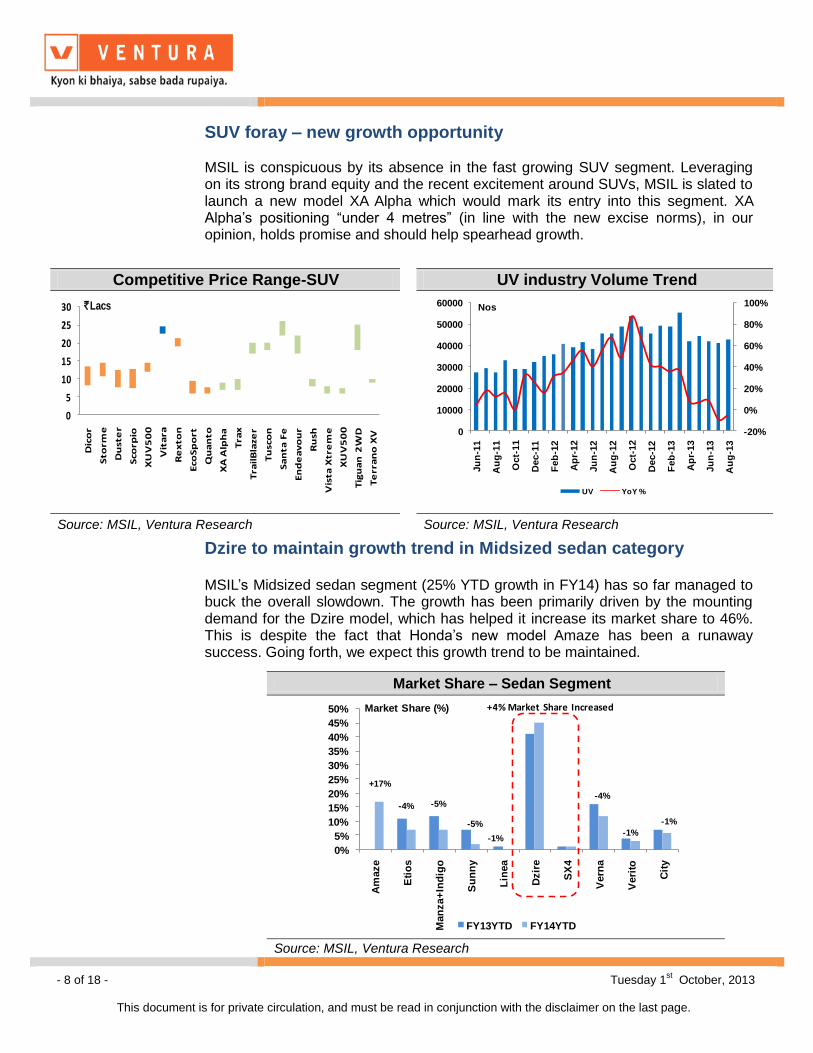
SUV foray – new growth opportunity MSIL is conspicuous by its absence in the fast growing SUV segment. Leveraging on its strong brand equity and the recent excitement around SUVs, MSIL is slated to launch a new model XA Alpha which would mark its entry into this segment. XA Alpha’s positioning “under 4 metres” (in line with the new excise norms), in our opinion, holds promise and should help spearhead growth.
Dzire to maintain growth trend in Midsized sedan category MSIL’s Midsized sedan segment (25% YTD growth in FY14) has so far managed to buck the overall slowdown. The growth has been primarily driven by the mounting demand for the Dzire model, which has helped it increase its market share to 46%. This is despite the fact that Honda’s new model Amaze has been a runaway success. Going forth, we expect this growth trend to be maintained.
Competitive Price Range-SUV UV industry Volume Trend
0
5
10
15
20
25
30
Dic
or
Sto
rme
Du
ste
r
Sco
rpio
XU
V5
00
Vit
ara
Re
xto
n
Eco
Sp
ort
Qu
an
to
XA
Alp
ha
Tra
x
Tra
ilB
laze
r
Tu
sco
n
Sa
nta
Fe
En
de
av
ou
r
Ru
sh
Vis
ta X
tre
me
XU
V5
00
Tig
ua
n 2
WD
Te
rra
no
XV
`Lacs
-20%
0%
20%
40%
60%
80%
100%
0
10000
20000
30000
40000
50000
60000
Ju
n-1
1
Au
g-1
1
Oct-
11
Dec-1
1
Feb
-12
Ap
r-12
Ju
n-1
2
Au
g-1
2
Oct-
12
Dec-1
2
Feb
-13
Ap
r-13
Ju
n-1
3
Au
g-1
3
UV YoY %
Nos
Source: MSIL, Ventura Research Source: MSIL, Ventura Research
Market Share – Sedan Segment
0%
5%
10%
15%
20%
25%
30%
35%
40%
45%
50%
Am
aze
Eti
os
Man
za+
Ind
igo
Su
nn
y
Lin
ea
Dzir
e
SX
4
Vern
a
Veri
to
Cit
y
Market Share (%)
FY13YTD FY14YTD
+4% Market Share Increased
+17%
-4%
-5%
-5%-4%
-1%
-1%
-1%
Source: MSIL, Ventura Research
- 9 of 18 - Tuesday 1st October, 2013
This document is for private circulation, and must be read in conjunction with the disclaimer on the last page.
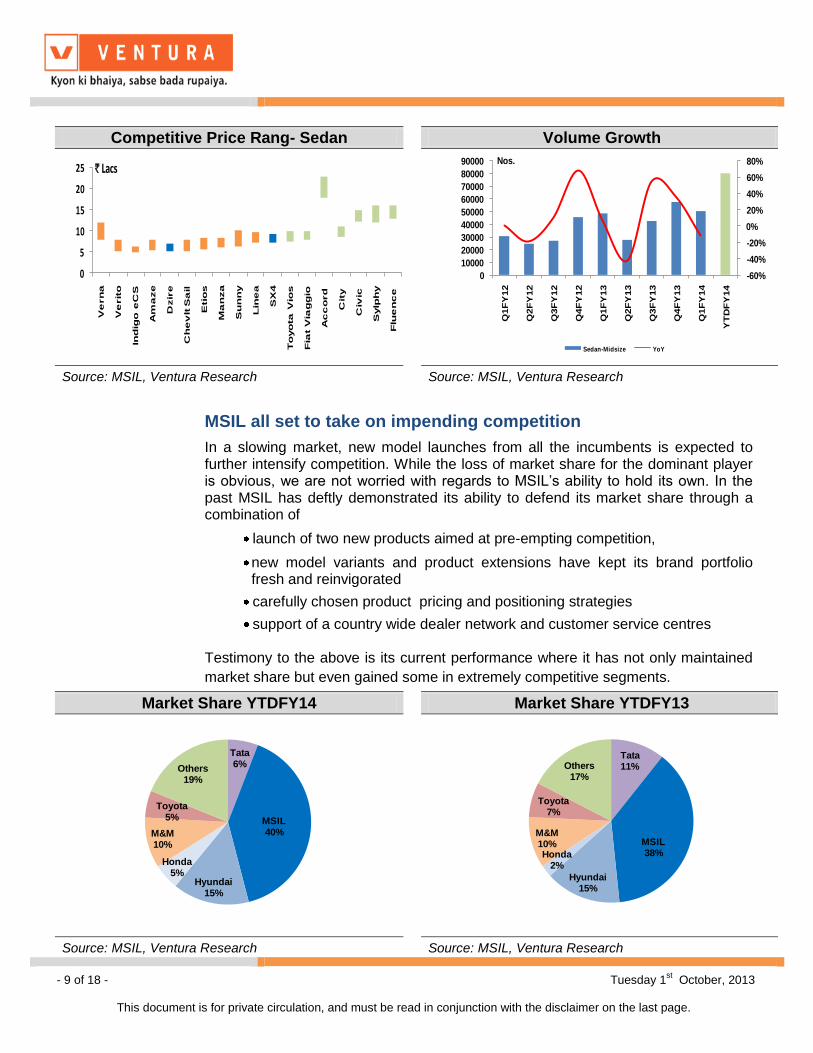
MSIL all set to take on impending competition
In a slowing market, new model launches from all the incumbents is expected to further intensify competition. While the loss of market share for the dominant player is obvious, we are not worried with regards to MSIL’s ability to hold its own. In the past MSIL has deftly demonstrated its ability to defend its market share through a combination of
launch of two new products aimed at pre-empting competition,
new model variants and product extensions have kept its brand portfolio fresh and reinvigorated
carefully chosen product pricing and positioning strategies
support of a country wide dealer network and customer service centres
Testimony to the above is its current performance where it has not only maintained
market share but even gained some in extremely competitive segments.
Competitive Price Rang- Sedan Volume Growth
0
5
10
15
20
25
Ve
rn
a
Ve
rit
o
Ind
igo
e
CS
Am
aze
Dzir
e
Ch
ev
lt S
ail
Etio
s
Ma
nza
Su
nn
y
Lin
ea
SX
4
To
yo
ta
V
ios
Fia
t V
iag
gio
Ac
co
rd
Cit
y
Civ
ic
Sylp
hy
Flu
en
ce
` Lacs
-60%
-40%
-20%
0%
20%
40%
60%
80%
0
10000
20000
30000
40000
50000
60000
70000
80000
90000
Q1F
Y12
Q2F
Y12
Q3F
Y12
Q4F
Y12
Q1F
Y13
Q2F
Y13
Q3F
Y13
Q4F
Y13
Q1F
Y14
YT
DF
Y14
Nos.
Sedan-Midsize YoY
Source: MSIL, Ventura Research Source: MSIL, Ventura Research
Market Share YTDFY14 Market Share YTDFY13
Tata 6%
MSIL40%
Hyundai15%
Honda5%
M&M10%
Toyota5%
Others19%
Tata 11%
MSIL38%
Hyundai15%
Honda2%
M&M10%
Toyota7%
Others17%
Source: MSIL, Ventura Research Source: MSIL, Ventura Research
- 10 of 18 - Tuesday 1st October, 2013
This document is for private circulation, and must be read in conjunction with the disclaimer on the last page.
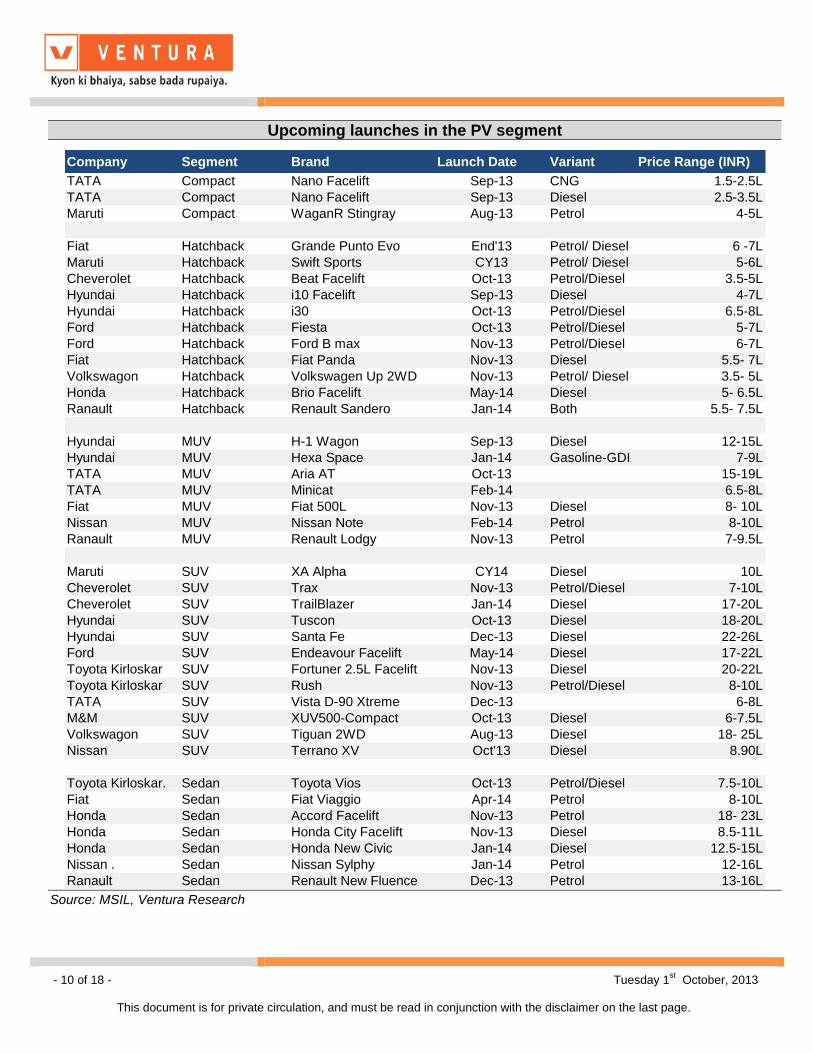
Upcoming launches in the PV segment
Company Segment Brand Launch Date Variant Price Range (INR)
TATA Compact Nano Facelift Sep-13 CNG 1.5-2.5L
TATA Compact Nano Facelift Sep-13 Diesel 2.5-3.5L
Maruti Compact WaganR Stingray Aug-13 Petrol 4-5L
Fiat Hatchback Grande Punto Evo End'13 Petrol/ Diesel 6 -7L
Maruti Hatchback Swift Sports CY13 Petrol/ Diesel 5-6L
Cheverolet Hatchback Beat Facelift Oct-13 Petrol/Diesel 3.5-5L
Hyundai Hatchback i10 Facelift Sep-13 Diesel 4-7L
Hyundai Hatchback i30 Oct-13 Petrol/Diesel 6.5-8L
Ford Hatchback Fiesta Oct-13 Petrol/Diesel 5-7L
Ford Hatchback Ford B max Nov-13 Petrol/Diesel 6-7L
Fiat Hatchback Fiat Panda Nov-13 Diesel 5.5- 7L
Volkswagon Hatchback Volkswagen Up 2WD Nov-13 Petrol/ Diesel 3.5- 5L
Honda Hatchback Brio Facelift May-14 Diesel 5- 6.5L
Ranault Hatchback Renault Sandero Jan-14 Both 5.5- 7.5L
Hyundai MUV H-1 Wagon Sep-13 Diesel 12-15L
Hyundai MUV Hexa Space Jan-14 Gasoline-GDI 7-9L
TATA MUV Aria AT Oct-13 15-19L
TATA MUV Minicat Feb-14 6.5-8L
Fiat MUV Fiat 500L Nov-13 Diesel 8- 10L
Nissan MUV Nissan Note Feb-14 Petrol 8-10L
Ranault MUV Renault Lodgy Nov-13 Petrol 7-9.5L
Maruti SUV XA Alpha CY14 Diesel 10L
Cheverolet SUV Trax Nov-13 Petrol/Diesel 7-10L
Cheverolet SUV TrailBlazer Jan-14 Diesel 17-20L
Hyundai SUV Tuscon Oct-13 Diesel 18-20L
Hyundai SUV Santa Fe Dec-13 Diesel 22-26L
Ford SUV Endeavour Facelift May-14 Diesel 17-22L
Toyota Kirloskar SUV Fortuner 2.5L Facelift Nov-13 Diesel 20-22L
Toyota Kirloskar SUV Rush Nov-13 Petrol/Diesel 8-10L
TATA SUV Vista D-90 Xtreme Dec-13 6-8L
M&M SUV XUV500-Compact Oct-13 Diesel 6-7.5L
Volkswagon SUV Tiguan 2WD Aug-13 Diesel 18- 25L
Nissan SUV Terrano XV Oct'13 Diesel 8.90L
Toyota Kirloskar. Sedan Toyota Vios Oct-13 Petrol/Diesel 7.5-10L
Fiat Sedan Fiat Viaggio Apr-14 Petrol 8-10L
Honda Sedan Accord Facelift Nov-13 Petrol 18- 23L
Honda Sedan Honda City Facelift Nov-13 Diesel 8.5-11L
Honda Sedan Honda New Civic Jan-14 Diesel 12.5-15L
Nissan . Sedan Nissan Sylphy Jan-14 Petrol 12-16L
Ranault Sedan Renault New Fluence Dec-13 Petrol 13-16L Source: MSIL, Ventura Research
- 11 of 18 - Tuesday 1st October, 2013
This document is for private circulation, and must be read in conjunction with the disclaimer on the last page.
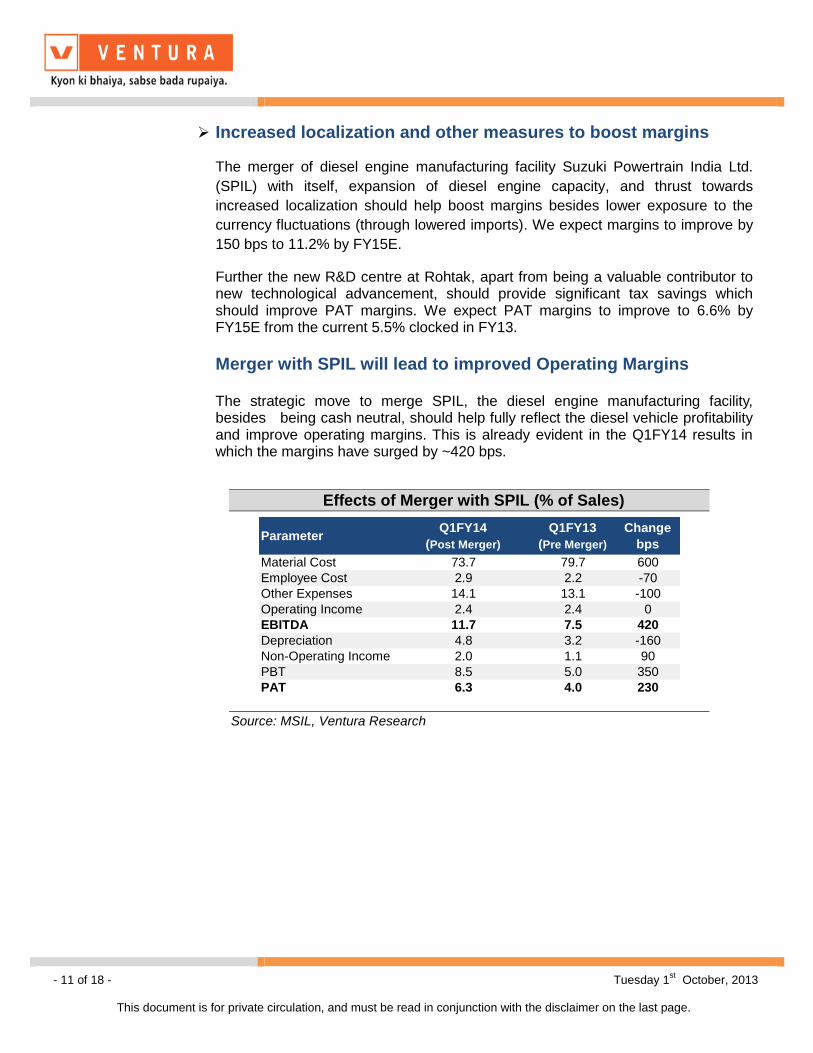
Increased localization and other measures to boost margins
The merger of diesel engine manufacturing facility Suzuki Powertrain India Ltd.
(SPIL) with itself, expansion of diesel engine capacity, and thrust towards
increased localization should help boost margins besides lower exposure to the
currency fluctuations (through lowered imports). We expect margins to improve by
150 bps to 11.2% by FY15E.
Further the new R&D centre at Rohtak, apart from being a valuable contributor to new technological advancement, should provide significant tax savings which should improve PAT margins. We expect PAT margins to improve to 6.6% by FY15E from the current 5.5% clocked in FY13.
Merger with SPIL will lead to improved Operating Margins
The strategic move to merge SPIL, the diesel engine manufacturing facility, besides being cash neutral, should help fully reflect the diesel vehicle profitability and improve operating margins. This is already evident in the Q1FY14 results in which the margins have surged by ~420 bps.
Effects of Merger with SPIL (% of Sales)
ParameterQ1FY14
(Post Merger)
Q1FY13
(Pre Merger)
Change
bps
Material Cost 73.7 79.7 600
Employee Cost 2.9 2.2 -70
Other Expenses 14.1 13.1 -100
Operating Income 2.4 2.4 0
EBITDA 11.7 7.5 420
Depreciation 4.8 3.2 -160
Non-Operating Income 2.0 1.1 90
PBT 8.5 5.0 350
PAT 6.3 4.0 230
Source: MSIL, Ventura Research
- 12 of 18 - Tuesday 1st October, 2013
This document is for private circulation, and must be read in conjunction with the disclaimer on the last page.
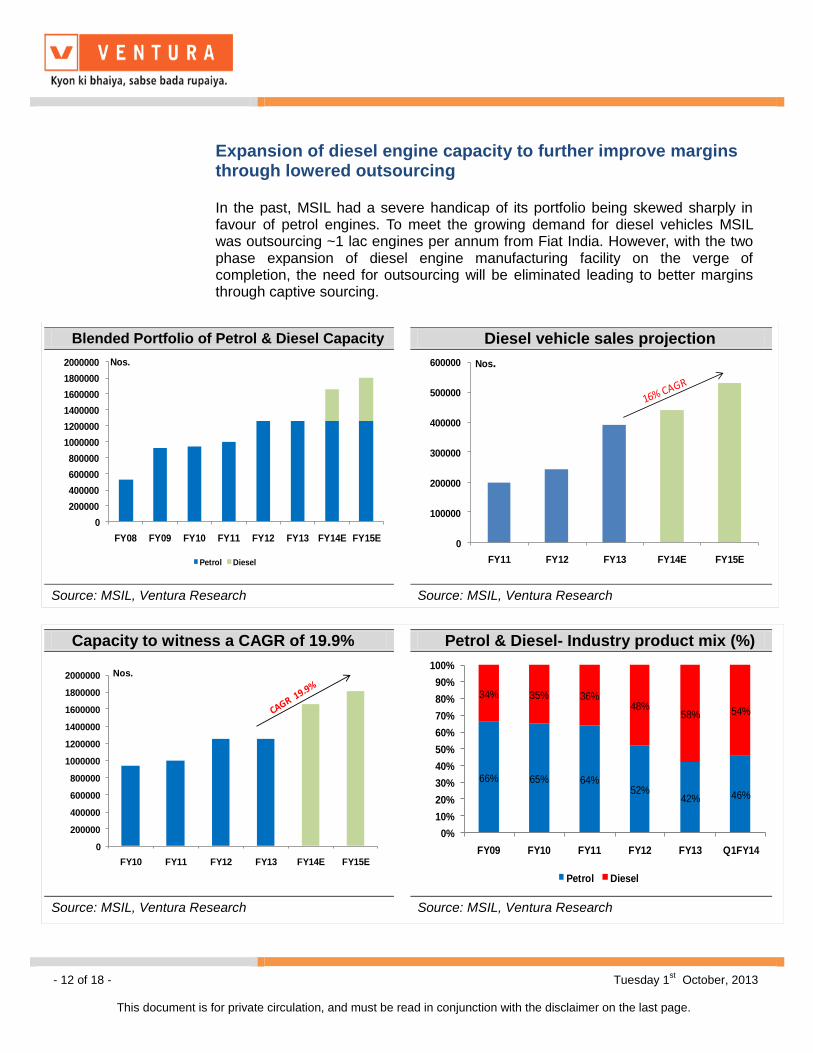
Expansion of diesel engine capacity to further improve margins through lowered outsourcing
In the past, MSIL had a severe handicap of its portfolio being skewed sharply in favour of petrol engines. To meet the growing demand for diesel vehicles MSIL was outsourcing ~1 lac engines per annum from Fiat India. However, with the two phase expansion of diesel engine manufacturing facility on the verge of completion, the need for outsourcing will be eliminated leading to better margins through captive sourcing.
Blended Portfolio of Petrol & Diesel Capacity Diesel vehicle sales projection
0
200000
400000
600000
800000
1000000
1200000
1400000
1600000
1800000
2000000
FY08 FY09 FY10 FY11 FY12 FY13 FY14E FY15E
Nos.
Petrol Diesel
0
100000
200000
300000
400000
500000
600000
FY11 FY12 FY13 FY14E FY15E
Nos.
Source: MSIL, Ventura Research Source: MSIL, Ventura Research
Capacity to witness a CAGR of 19.9% Petrol & Diesel- Industry product mix (%)
0
200000
400000
600000
800000
1000000
1200000
1400000
1600000
1800000
2000000
FY10 FY11 FY12 FY13 FY14E FY15E
Nos.
66% 65% 64%52%
42% 46%
34% 35% 36%48%
58% 54%
0%
10%
20%
30%
40%
50%
60%
70%
80%
90%
100%
FY09 FY10 FY11 FY12 FY13 Q1FY14
Petrol Diesel
Source: MSIL, Ventura Research Source: MSIL, Ventura Research
- 13 of 18 - Tuesday 1st October, 2013
This document is for private circulation, and must be read in conjunction with the disclaimer on the last page.
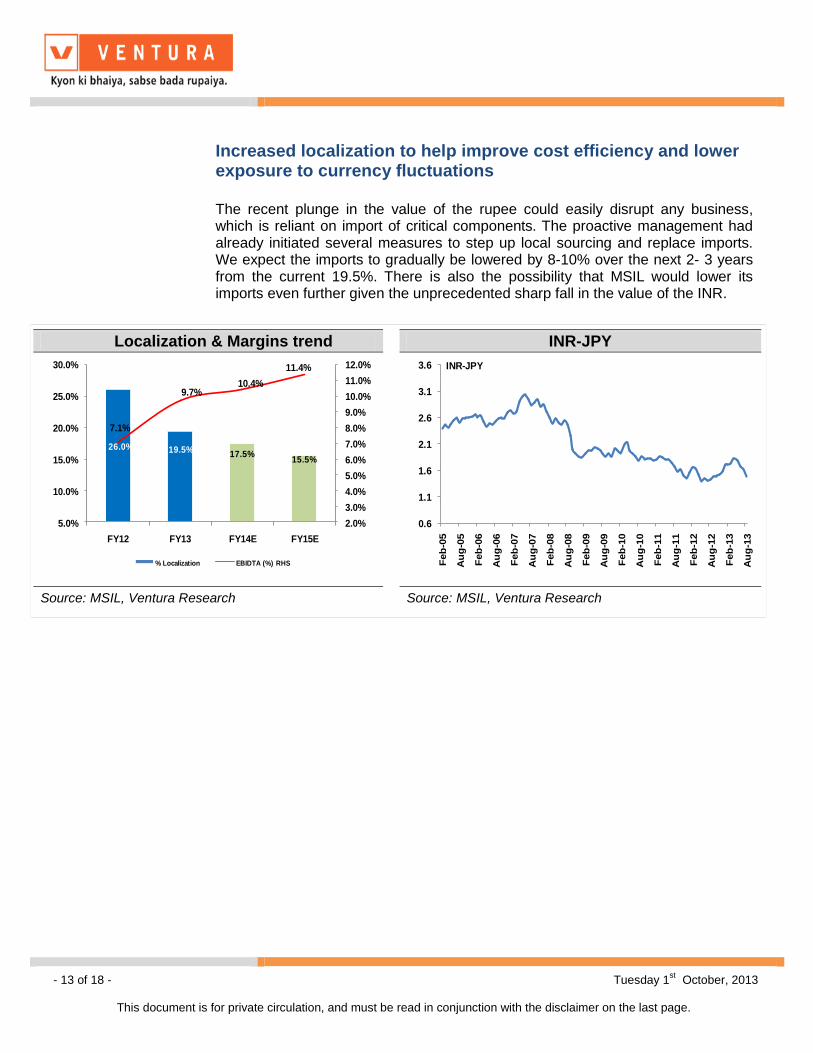
Increased localization to help improve cost efficiency and lower exposure to currency fluctuations
The recent plunge in the value of the rupee could easily disrupt any business, which is reliant on import of critical components. The proactive management had already initiated several measures to step up local sourcing and replace imports. We expect the imports to gradually be lowered by 8-10% over the next 2- 3 years from the current 19.5%. There is also the possibility that MSIL would lower its imports even further given the unprecedented sharp fall in the value of the INR.
Localization & Margins trend INR-JPY
26.0% 19.5%17.5%
15.5%
7.1%
9.7%10.4%
11.4%
2.0%
3.0%
4.0%
5.0%
6.0%
7.0%
8.0%
9.0%
10.0%
11.0%
12.0%
5.0%
10.0%
15.0%
20.0%
25.0%
30.0%
FY12 FY13 FY14E FY15E
% Localization EBIDTA (%) RHS
0.6
1.1
1.6
2.1
2.6
3.1
3.6
Feb
-05
Au
g-0
5
Feb
-06
Au
g-0
6
Feb
-07
Au
g-0
7
Feb
-08
Au
g-0
8
Feb
-09
Au
g-0
9
Feb
-10
Au
g-1
0
Feb
-11
Au
g-1
1
Feb
-12
Au
g-1
2
Feb
-13
Au
g-1
3
INR-JPY
Source: MSIL, Ventura Research Source: MSIL, Ventura Research
- 14 of 18 - Tuesday 1st October, 2013
This document is for private circulation, and must be read in conjunction with the disclaimer on the last page.
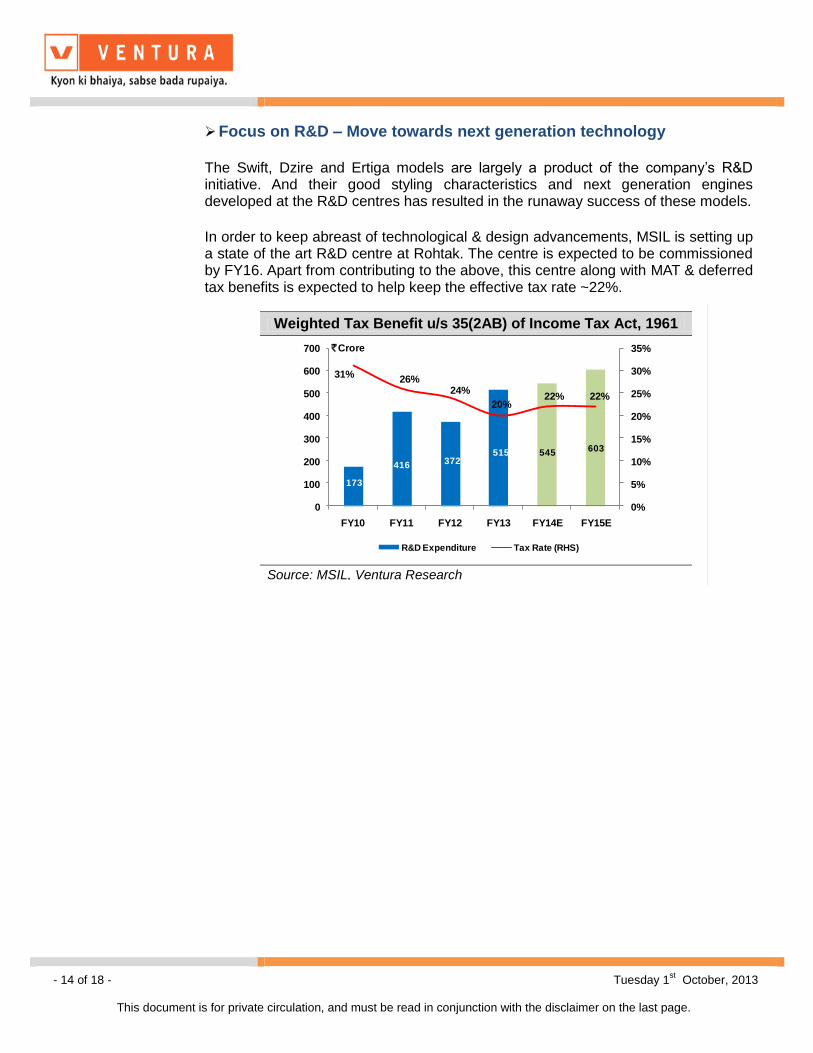
Focus on R&D – Move towards next generation technology
The Swift, Dzire and Ertiga models are largely a product of the company’s R&D initiative. And their good styling characteristics and next generation engines developed at the R&D centres has resulted in the runaway success of these models.
In order to keep abreast of technological & design advancements, MSIL is setting up a state of the art R&D centre at Rohtak. The centre is expected to be commissioned by FY16. Apart from contributing to the above, this centre along with MAT & deferred tax benefits is expected to help keep the effective tax rate ~22%.
Weighted Tax Benefit u/s 35(2AB) of Income Tax Act, 1961
173
416 372515 545 603
31%26%
24%
20%22% 22%
0%
5%
10%
15%
20%
25%
30%
35%
0
100
200
300
400
500
600
700
FY10 FY11 FY12 FY13 FY14E FY15E
`Crore
R&D Expenditure Tax Rate (RHS)
Source: MSIL, Ventura Research
- 15 of 18 - Tuesday 1st October, 2013
This document is for private circulation, and must be read in conjunction with the disclaimer on the last page.
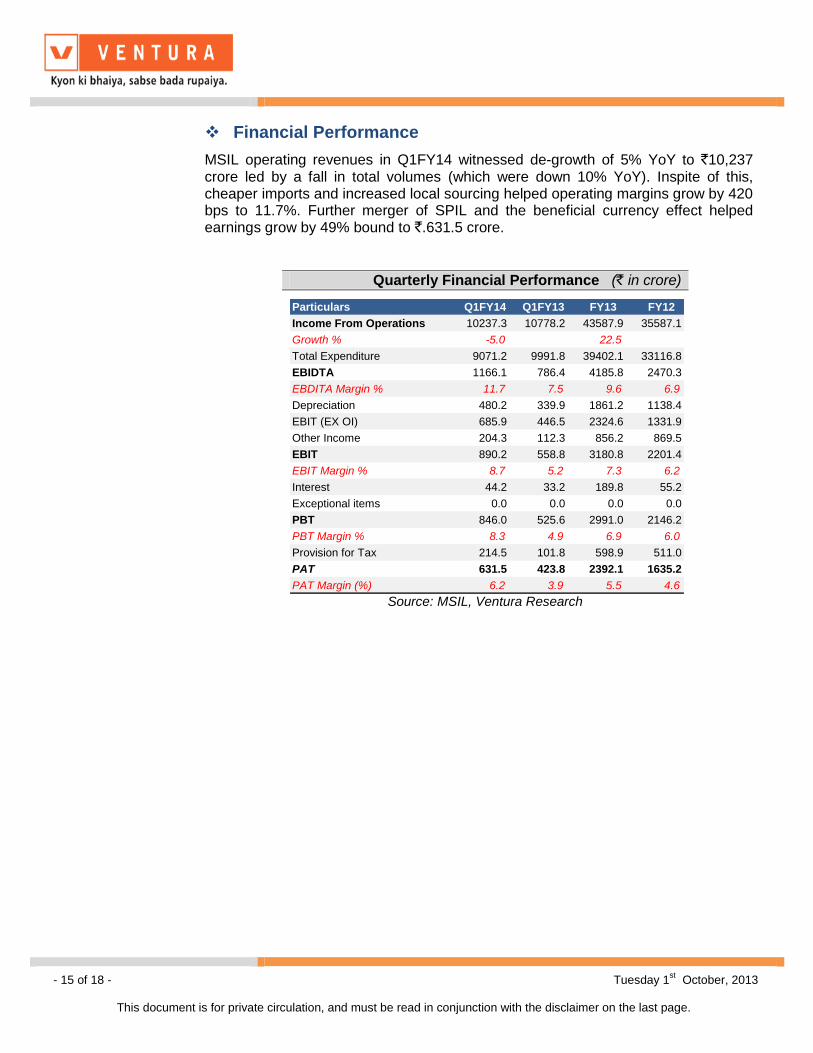
Financial Performance
MSIL operating revenues in Q1FY14 witnessed de-growth of 5% YoY to `10,237 crore led by a fall in total volumes (which were down 10% YoY). Inspite of this, cheaper imports and increased local sourcing helped operating margins grow by 420 bps to 11.7%. Further merger of SPIL and the beneficial currency effect helped earnings grow by 49% bound to `.631.5 crore.
Quarterly Financial Performance (` in crore)
Particulars Q1FY14 Q1FY13 FY13 FY12
Income From Operations 10237.3 10778.2 43587.9 35587.1
Growth % -5.0 22.5
Total Expenditure 9071.2 9991.8 39402.1 33116.8
EBIDTA 1166.1 786.4 4185.8 2470.3
EBDITA Margin % 11.7 7.5 9.6 6.9
Depreciation 480.2 339.9 1861.2 1138.4
EBIT (EX OI) 685.9 446.5 2324.6 1331.9
Other Income 204.3 112.3 856.2 869.5
EBIT 890.2 558.8 3180.8 2201.4
EBIT Margin % 8.7 5.2 7.3 6.2
Interest 44.2 33.2 189.8 55.2
Exceptional items 0.0 0.0 0.0 0.0
PBT 846.0 525.6 2991.0 2146.2
PBT Margin % 8.3 4.9 6.9 6.0
Provision for Tax 214.5 101.8 598.9 511.0
PAT 631.5 423.8 2392.1 1635.2
PAT Margin (%) 6.2 3.9 5.5 4.6
Source: MSIL, Ventura Research
- 16 of 18 - Tuesday 1st October, 2013
This document is for private circulation, and must be read in conjunction with the disclaimer on the last page.
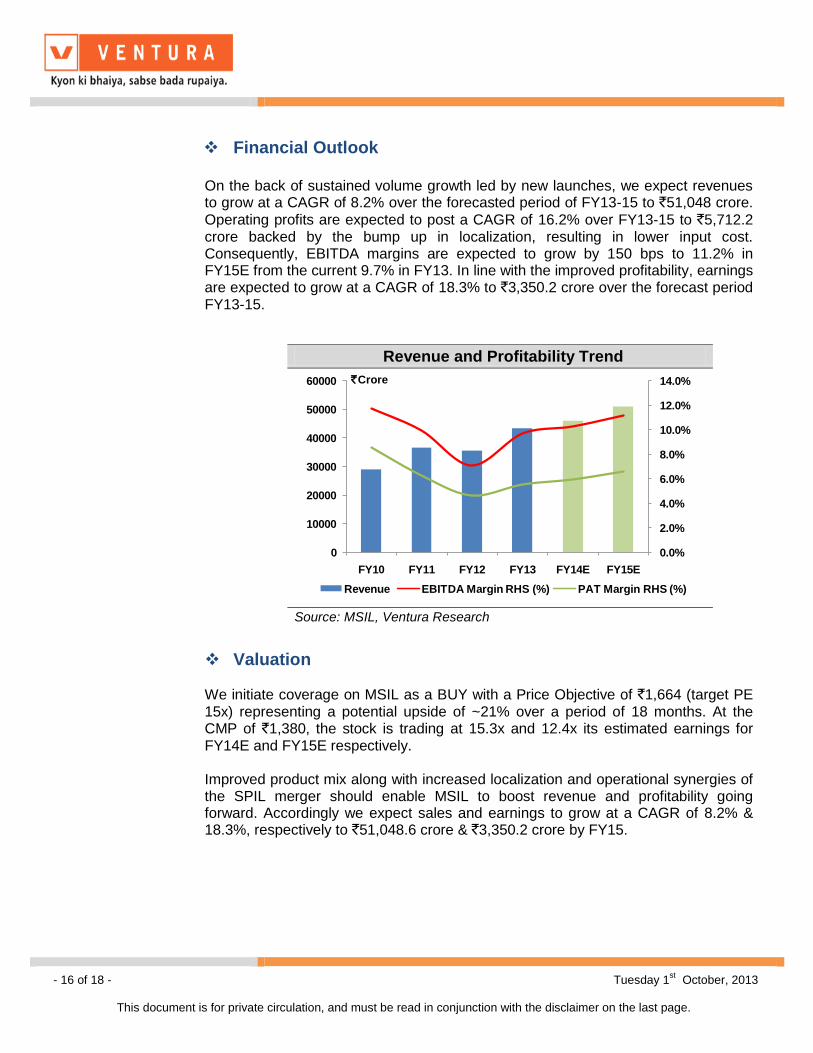
Financial Outlook
On the back of sustained volume growth led by new launches, we expect revenues to grow at a CAGR of 8.2% over the forecasted period of FY13-15 to `51,048 crore.
Operating profits are expected to post a CAGR of 16.2% over FY13-15 to `5,712.2 crore backed by the bump up in localization, resulting in lower input cost. Consequently, EBITDA margins are expected to grow by 150 bps to 11.2% in FY15E from the current 9.7% in FY13. In line with the improved profitability, earnings are expected to grow at a CAGR of 18.3% to `3,350.2 crore over the forecast period FY13-15.
Valuation We initiate coverage on MSIL as a BUY with a Price Objective of `1,664 (target PE 15x) representing a potential upside of ~21% over a period of 18 months. At the CMP of `1,380, the stock is trading at 15.3x and 12.4x its estimated earnings for FY14E and FY15E respectively. Improved product mix along with increased localization and operational synergies of the SPIL merger should enable MSIL to boost revenue and profitability going forward. Accordingly we expect sales and earnings to grow at a CAGR of 8.2% & 18.3%, respectively to `51,048.6 crore & `3,350.2 crore by FY15.
Revenue and Profitability Trend
0.0%
2.0%
4.0%
6.0%
8.0%
10.0%
12.0%
14.0%
0
10000
20000
30000
40000
50000
60000
FY10 FY11 FY12 FY13 FY14E FY15E
`Crore
Revenue EBITDA Margin RHS (%) PAT Margin RHS (%)
Source: MSIL, Ventura Research
- 17 of 18 - Tuesday 1st October, 2013
This document is for private circulation, and must be read in conjunction with the disclaimer on the last page.
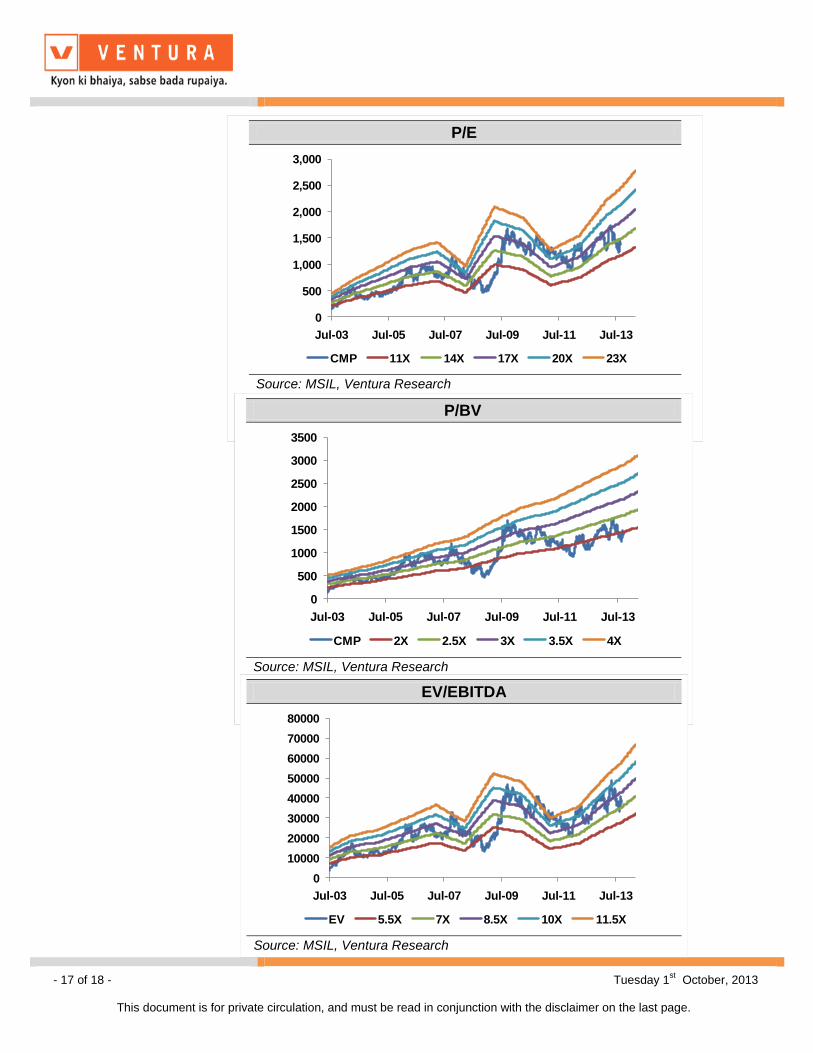
P/E
0
500
1,000
1,500
2,000
2,500
3,000
Jul-03 Jul-05 Jul-07 Jul-09 Jul-11 Jul-13
CMP 11X 14X 17X 20X 23X
Source: MSIL, Ventura Research
P/BV
0
500
1000
1500
2000
2500
3000
3500
Jul-03 Jul-05 Jul-07 Jul-09 Jul-11 Jul-13
CMP 2X 2.5X 3X 3.5X 4X
Source: MSIL, Ventura Research
EV/EBITDA
0
10000
20000
30000
40000
50000
60000
70000
80000
Jul-03 Jul-05 Jul-07 Jul-09 Jul-11 Jul-13
EV 5.5X 7X 8.5X 10X 11.5X
Source: MSIL, Ventura Research
- 18 of 18 - Tuesday 1st October, 2013
This document is for private circulation, and must be read in conjunction with the disclaimer on the last page.
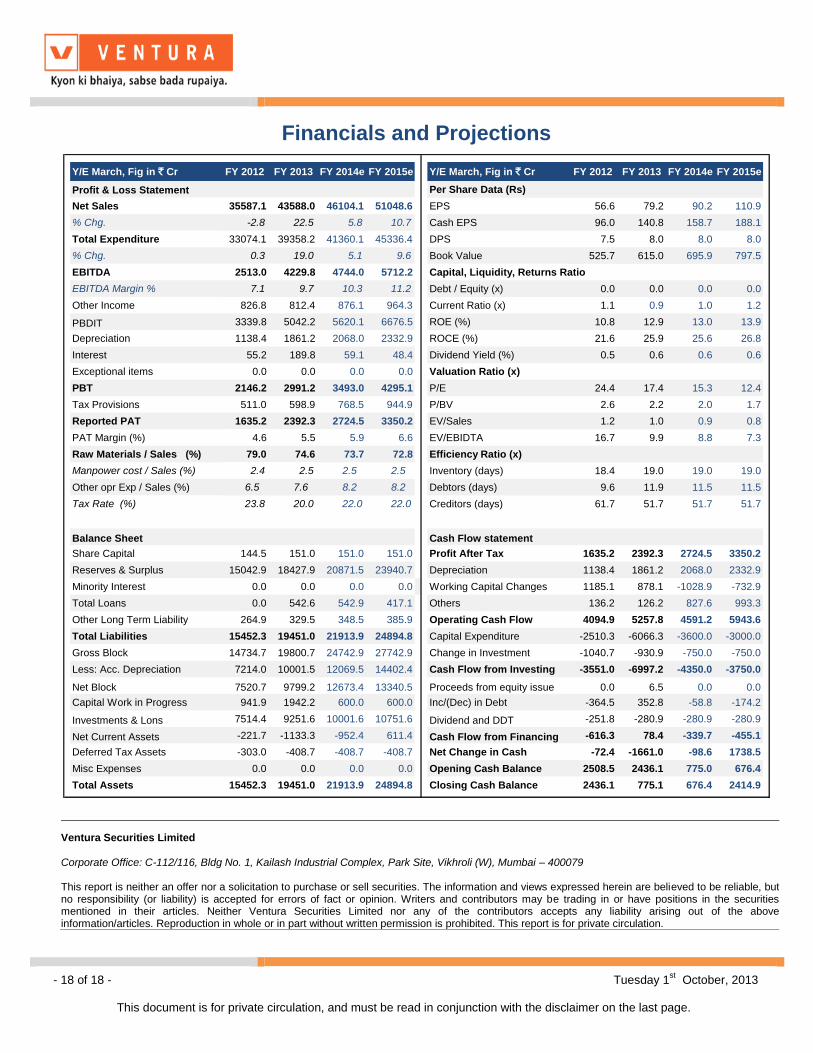
Financials and Projections
Y/E March, Fig in ` Cr FY 2012 FY 2013 FY 2014e FY 2015e Y/E March, Fig in ` Cr FY 2012 FY 2013 FY 2014e FY 2015e
Profit & Loss Statement Per Share Data (Rs)
Net Sales 35587.1 43588.0 46104.1 51048.6 EPS 56.6 79.2 90.2 110.9
% Chg. -2.8 22.5 5.8 10.7 Cash EPS 96.0 140.8 158.7 188.1
Total Expenditure 33074.1 39358.2 41360.1 45336.4 DPS 7.5 8.0 8.0 8.0
% Chg. 0.3 19.0 5.1 9.6 Book Value 525.7 615.0 695.9 797.5
EBITDA 2513.0 4229.8 4744.0 5712.2 Capital, Liquidity, Returns Ratio
EBITDA Margin % 7.1 9.7 10.3 11.2 Debt / Equity (x) 0.0 0.0 0.0 0.0
Other Income 826.8 812.4 876.1 964.3 Current Ratio (x) 1.1 0.9 1.0 1.2
PBDIT 3339.8 5042.2 5620.1 6676.5 ROE (%) 10.8 12.9 13.0 13.9
Depreciation 1138.4 1861.2 2068.0 2332.9 ROCE (%) 21.6 25.9 25.6 26.8
Interest 55.2 189.8 59.1 48.4 Dividend Yield (%) 0.5 0.6 0.6 0.6
Exceptional items 0.0 0.0 0.0 0.0 Valuation Ratio (x)
PBT 2146.2 2991.2 3493.0 4295.1 P/E 24.4 17.4 15.3 12.4
Tax Provisions 511.0 598.9 768.5 944.9 P/BV 2.6 2.2 2.0 1.7
Reported PAT 1635.2 2392.3 2724.5 3350.2 EV/Sales 1.2 1.0 0.9 0.8
PAT Margin (%) 4.6 5.5 5.9 6.6 EV/EBIDTA 16.7 9.9 8.8 7.3
Raw Materials / Sales (%) 79.0 74.6 73.7 72.8 Efficiency Ratio (x)
Manpower cost / Sales (%) 2.4 2.5 2.5 2.5 Inventory (days) 18.4 19.0 19.0 19.0
Other opr Exp / Sales (%) 6.5 7.6 8.2 8.2 Debtors (days) 9.6 11.9 11.5 11.5
Tax Rate (%) 23.8 20.0 22.0 22.0 Creditors (days) 61.7 51.7 51.7 51.7
Balance Sheet Cash Flow statement
Share Capital 144.5 151.0 151.0 151.0 Profit After Tax 1635.2 2392.3 2724.5 3350.2
Reserves & Surplus 15042.9 18427.9 20871.5 23940.7 Depreciation 1138.4 1861.2 2068.0 2332.9
Minority Interest 0.0 0.0 0.0 0.0 Working Capital Changes 1185.1 878.1 -1028.9 -732.9
Total Loans 0.0 542.6 542.9 417.1 Others 136.2 126.2 827.6 993.3
Other Long Term Liability 264.9 329.5 348.5 385.9 Operating Cash Flow 4094.9 5257.8 4591.2 5943.6
Total Liabilities 15452.3 19451.0 21913.9 24894.8 Capital Expenditure -2510.3 -6066.3 -3600.0 -3000.0
Gross Block 14734.7 19800.7 24742.9 27742.9 Change in Investment -1040.7 -930.9 -750.0 -750.0
Less: Acc. Depreciation 7214.0 10001.5 12069.5 14402.4 Cash Flow from Investing -3551.0 -6997.2 -4350.0 -3750.0
Net Block 7520.7 9799.2 12673.4 13340.5 Proceeds from equity issue 0.0 6.5 0.0 0.0
Capital Work in Progress 941.9 1942.2 600.0 600.0 Inc/(Dec) in Debt -364.5 352.8 -58.8 -174.2
Investments & Lons 7514.4 9251.6 10001.6 10751.6 Dividend and DDT -251.8 -280.9 -280.9 -280.9
Net Current Assets -221.7 -1133.3 -952.4 611.4 Cash Flow from Financing -616.3 78.4 -339.7 -455.1
Deferred Tax Assets -303.0 -408.7 -408.7 -408.7 Net Change in Cash -72.4 -1661.0 -98.6 1738.5
Misc Expenses 0.0 0.0 0.0 0.0 Opening Cash Balance 2508.5 2436.1 775.0 676.4
Total Assets 15452.3 19451.0 21913.9 24894.8 Closing Cash Balance 2436.1 775.1 676.4 2414.9
Ventura Securities Limited Corporate Office: C-112/116, Bldg No. 1, Kailash Industrial Complex, Park Site, Vikhroli (W), Mumbai – 400079 This report is neither an offer nor a solicitation to purchase or sell securities. The information and views expressed herein are believed to be reliable, but no responsibility (or liability) is accepted for errors of fact or opinion. Writers and contributors may be trading in or have positions in the securities mentioned in their articles. Neither Ventura Securities Limited nor any of the contributors accepts any liability arising out of the above information/articles. Reproduction in whole or in part without written permission is prohibited. This report is for private circulation.