maruti suzuki india (maruti) | 6650 · maruti suzuki ltd (msil) reported steady performance in...
TRANSCRIPT

October 26, 2018
ICICI Securities Ltd | Retail Equity Research
Result Update
Near term headwinds, recovery in FY20E…
Maruti Suzuki Ltd (MSIL) reported steady performance in Q2FY19
with optical out-performance led by higher other operating income
(~| 200 crore) on account of income from services from its parent.
Total operating income in Q2FY19 stood at | 22,433 crore, up 3.1%
YoY. ASP for the quarter came in at | 4.44 lakh/unit, flat YoY.
Discounting however was aggressive at | 18,750/unit, up 23% YoY
Volumes for Q2FY19 stood at 484,848 units, down 1.5% YoY. Of
this, the domestic volumes de-grew by 0.4% YoY to 455,400 units,
while the exports were down 15.2% YoY to 29,448 units.
EBITDA in Q2FY19 stood at | 3,431 crore with corresponding EBITDA
margins at 15.3%. EBITDA margins are up 40 bps on QoQ basis
largely factoring in cost reduction efforts undertaken by company
which were partially offset by higher sales promotion expense and
adverse foreign exchange movement.
PAT in Q2FY19 stood at | 2,240 crore, down 9.8%YoY
Management commentary cautiously optimistic over H2FY19!
The management sounded cautious on rising cost of ownership of vehicle
owing to higher insurance (blended hike by ~| 9000/unit; ~2% of vehicle
costs), fuel (up nearly 17-25%) as well financing costs (up 35 bps) which
is leading somewhat postposing of purchase by consumers and
consequent slowdown in demand in the PV space domestically. Festive
season too is a lacklustre, resulting in largely flat sales at the retail level. In
the exports market the situation is no different wherein growth is a
challenge amidst currency headwinds and imposition of import tariffs in
key markets. The management however re-iterated its commitment
towards double digit volume growth for FY19E. Sensing the demand
slowdown as well as new launch by one of its key competitor in the
passenger car market we have revised downward our volume estimates
for MSIL going forward. We now expect volumes at MSIL to grow at a
CAGR of 9.0% (11.5% earlier) over FY18-20E to 21.2 lakh units in FY20E.
Market leadership maintained, across segments!
MSIL has been a market leader and outperformed industry in the past. Its
market share increased from ~47% in FY17 to ~50% in FY18 to further
~52% in H1FY19. It has been done by introducing new and impressive
models at an appropriate time suiting to the market needs. It enjoys
market leadership across segments namely- PC, UV and Vans. Currently
its top selling models include Swift, Dzire, Baleno among others and
possesses 7 models out of top 10 PV models sold domestically. Going
forward from the customer perspective it still remains a prominent brand
owing to: low cost of ownership & high dealer and servicing network;
which warrants it to be held in one’s portfolio on long term basis.
Margins to recover in FY20E, B/s positives persists, maintain HOLD!
Management commentary suggest margins to remain muted in H2FY19
primarily tracking impact of INR deprecation on input costs which comes
with a quarterly lag. This will be partially offsetted against cost cutting
undertaken by the company. Going forward, as INR stabilises in FY20E
and structural decline in royalty as well as operating leverage benefits we
expect margins to recover in FY20E. Revising our estimates, we now
expect Sales, EBITDA, PAT of 11,12,14% respectively over FY18-20E. We
value MSIL at | 7250 i.e. 22x P/E on FY20E EPS of | 330 and assign HOLD
rating on the stock. Key positives which remain with MSIL is its cash
surplus balance sheet (~15% market cap), negative working capital cycle,
healthy 20%+ RoCE, ~6% CFO yield and ~4% FCF yield.
Rating matrix
Rating : Hold
Target : | 7250
Target Period : 12 months
Potential Upside : 9%
What’s Changed?
Target Changed from | 9875 to | 7250
EPS FY19E Changed from | 318 to | 291
EPS FY20E Changed from | 380 to | 330
Rating Unchanged
Quarterly Performance
(| Crore) Q2FY19 Q2FY18 YoY (%) Q1FY18 QoQ (%)
Revenue 22,433.2 21,768.2 3.1 22,459.4 -0.1
EBITDA 3,431.3 3,677.5 -6.7 3,351.1 2.4
EBITDA (%) 15.3 16.9 -160 bps 14.9 37 bps
Reported PAT 2,240.4 2,484.3 -9.8 1,975.3 13.4
Key Financials
| Crore FY17 FY18 FY19E FY20E
Revenue 68,035 79,763 89,203 99,109
EBITDA 10,353.0 12,061.5 13,410.8 15,255.0
Net Profit 7,337.7 7,721.8 8,791.3 9,959.3
EPS (|) 242.9 255.6 291.0 329.7
Valuation summary
FY17 FY18 FY19E FY20E
P/E (x) 27.4 26.0 22.9 20.2
Target P/E (x) 29.8 28.4 24.9 22.0
EV/EBITDA (x) 16.8 13.8 12.2 10.3
P/BV (x) 5.6 4.8 4.2 3.8
RoNW (%) 20.3 18.5 18.6 18.6
RoCE (%) 20.3 21.1 21.1 21.1
Stock data
Particular Amount
Market Capitalization (| Crore) | 200883.2 Crore
Total Debt | 110.8 Crore
Cash & Investment | 34153.1 Crore
EV | 166840.9 Crore
52 week H/L (|) 10000 / 6625
Equity capital (| crore) | 151 Crore
Face value (|) | 5
Price performance (%)
1M 3M 6M 12M
M&M Ltd -17.8 -19.4 -14.1 7.5
Maruti Suzuki India -16.0 -31.1 -24.8 -14.6
Tata Motors -31.3 -35.9 -49.7 -60.8
Maruti Suzuki India (MARUTI) | 6650
Research Analyst
Shashank Kanodia, CFA
Vidrum Mehta
ICICI Securities Ltd | Retail Equity Research Page 2
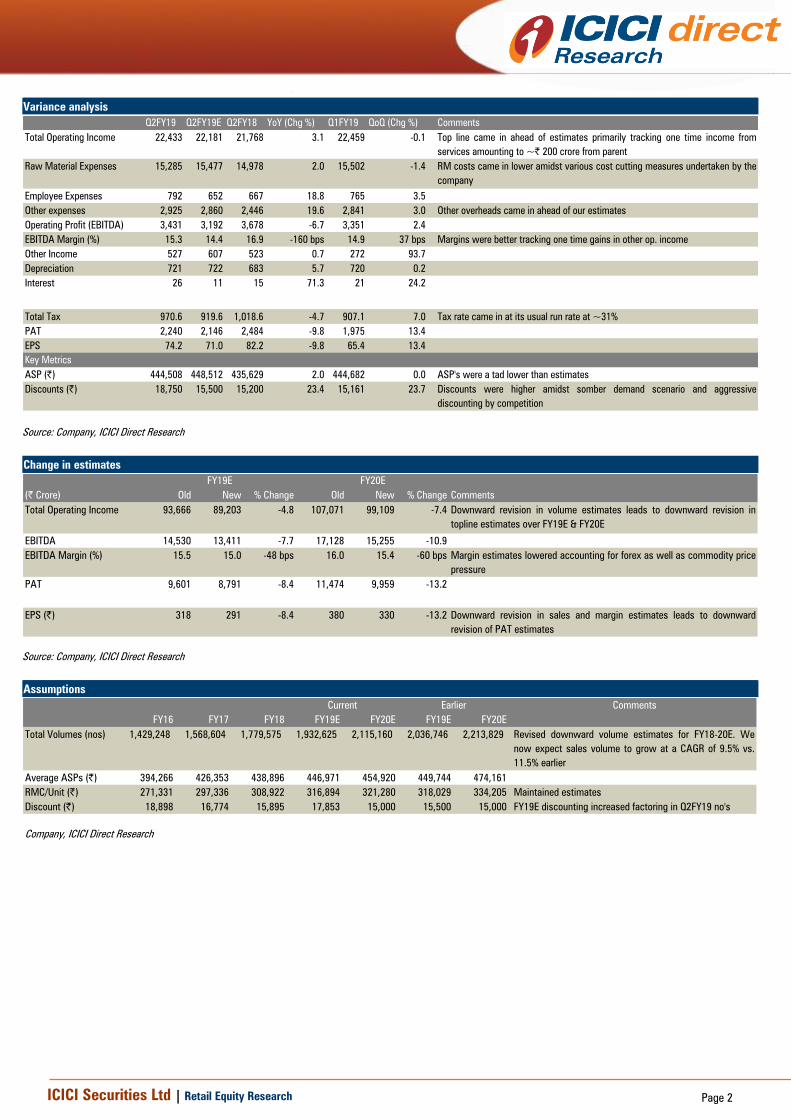
Variance analysis
Q2FY19 Q2FY19E Q2FY18 YoY (Chg %) Q1FY19 QoQ (Chg %) Comments
Total Operating Income 22,433 22,181 21,768 3.1 22,459 -0.1 Top line came in ahead of estimates primarily tracking one time income from
services amounting to ~| 200 crore from parent
Raw Material Expenses 15,285 15,477 14,978 2.0 15,502 -1.4 RM costs came in lower amidst various cost cutting measures undertaken by the
company
Employee Expenses 792 652 667 18.8 765 3.5
Other expenses 2,925 2,860 2,446 19.6 2,841 3.0 Other overheads came in ahead of our estimates
Operating Profit (EBITDA) 3,431 3,192 3,678 -6.7 3,351 2.4
EBITDA Margin (%) 15.3 14.4 16.9 -160 bps 14.9 37 bps Margins were better tracking one time gains in other op. income
Other Income 527 607 523 0.7 272 93.7
Depreciation 721 722 683 5.7 720 0.2
Interest 26 11 15 71.3 21 24.2
Total Tax 970.6 919.6 1,018.6 -4.7 907.1 7.0 Tax rate came in at its usual run rate at ~31%
PAT 2,240 2,146 2,484 -9.8 1,975 13.4
EPS 74.2 71.0 82.2 -9.8 65.4 13.4
Key Metrics
ASP (|) 444,508 448,512 435,629 2.0 444,682 0.0 ASP's were a tad lower than estimates
Discounts (|) 18,750 15,500 15,200 23.4 15,161 23.7 Discounts were higher amidst somber demand scenario and aggressive
discounting by competition
Source: Company, ICICI Direct Research
Change in estimates
(| Crore) Old New % Change Old New % Change Comments
Total Operating Income 93,666 89,203 -4.8 107,071 99,109 -7.4 Downward revision in volume estimates leads to downward revision in
topline estimates over FY19E & FY20E
EBITDA 14,530 13,411 -7.7 17,128 15,255 -10.9
EBITDA Margin (%) 15.5 15.0 -48 bps 16.0 15.4 -60 bps Margin estimates lowered accounting for forex as well as commodity price
pressure
PAT 9,601 8,791 -8.4 11,474 9,959 -13.2
EPS (|) 318 291 -8.4 380 330 -13.2 Downward revision in sales and margin estimates leads to downward
revision of PAT estimates
FY19E FY20E
Source: Company, ICICI Direct Research
Assumptions
Comments
FY16 FY17 FY18 FY19E FY20E FY19E FY20E
Total Volumes (nos) 1,429,248 1,568,604 1,779,575 1,932,625 2,115,160 2,036,746 2,213,829 Revised downward volume estimates for FY18-20E. We
now expect sales volume to grow at a CAGR of 9.5% vs.
11.5% earlier
Average ASPs (|) 394,266 426,353 438,896 446,971 454,920 449,744 474,161
RMC/Unit (|) 271,331 297,336 308,922 316,894 321,280 318,029 334,205 Maintained estimates
Discount (|) 18,898 16,774 15,895 17,853 15,000 15,500 15,000 FY19E discounting increased factoring in Q2FY19 no's
Current Earlier
Company, ICICI Direct Research

ICICI Securities Ltd | Retail Equity Research Page 3
Conference Call Highlights
Management Outlook/Guidance & Demand
Company sounded guarded on earlier guidance of double digit
growth this year. While it was on track thus far in H1FY19,
H2FY19E has been impacted by issues surrounding cost of
ownership viz. fuel, insurance and financing.
Company is hopeful of pent-up demand emerging over next
couple of months in Kerala, UP, Uttrakhand and some other
eastern states which have been flood-affected in the recent past.
Retail side festive demand has been flat thus far. However,
company remains hopeful about the approaching Diwali season.
On a YoY basis urban centres including Mumbai and Gujarat have
experienced soft demand while rural pockets have registered 13%
growth on the back of higher disposable incomes and good
monsoons.
Company reported that 63% of domestic PV volumes were in the
petrol segment.
It will be an uphill task for the company to match last year’s
export growth due to higher relative currency depreciation of
other economies vis-à-vis Indian Rupee and rising trade
protectionism.
Company remains bullish on its LCV division where it is currently
the second largest player and has sizeable network strength in the
segment that it operates into.
Company sees CNG as an immediate agent for change while
remaining upbeat about electrification and hybridization prospects
as well.
Revenue & Margins
Company’s cost reduction efforts mitigated the combined ~350
bps impact of commodity prices (~120 bps), exchange rate
movement (~120 bps) and product discounts (~130 bps).
Company expects lesser impact of steel prices in H2FY19E than
what was seen in H1FY19. Forex impact however is likely to
impact earnings in H2FY19
Exports at | 1,427 crore for Q2FY19 amounted to ~7% of overall
sales.
Others
60% of the company’s royalty payments are made in Japanese
Yen while the rest are made in Indian Rupees.
Imports amounted to 18% of net sales, of which 5% were direct
and 13% were indirect.
Other operating income included some amount is respect of
recovery of engineering services fees from parent Suzuki. A figure
amounting to ~| 200 crore is a one-off. A variable quantum of
such fees will likely be earned per quarter going forward as well.
Gujarat plant produced ~67000 units in this quarter. Next line for
the plant will be commissioned in early 2019 and the third line in
mid-2020, each with a capacity of 2.5 lakh p.a. By 2020 at
~750,000 p.a. capacity and with ancillary set up being developed
in Gujarat, MSIL’s Gujarat plant is expected to nearly match
Haryana plant on localisation content levels.

ICICI Securities Ltd | Retail Equity Research Page 4
Company Analysis
Management commentary cautiously optimistic over H2FY19!
The management sounded cautious on rising cost of ownership of vehicle
owing to higher insurance (blended hike by ~| 9000/unit; ~2% of vehicle
costs), fuel (up nearly 17-25%) as well financing costs (up 350 bps) which
is leading somewhat postposing of purchase by consumers and
consequent slowdown in demand in the PV space domestically. Festive
season too is a lacklustre, resulting in largely flat sales at the retail level. In
the exports market the situation is no different wherein growth is a
challenge amidst currency headwinds and imposition of import tariffs in
key markets. The management however re-iterated its commitment
towards double digit volume growth for FY19E. Sensing the demand
slowdown as well as new launch by one of its key competitor in the
passenger car market we have revised downward our volume estimates
for MSIL going forward. We now expect volumes at MSIL to grow at a
CAGR of 9.0% (11.5% earlier) over FY18-20E to 21.2 lakh units in FY20E.
Consequently, we expect revenues to grow at a CAGR of 11.5 over FY18-
20E to | 99,109 crore in FY20E (| 79,763 crore in FY18). On the back of
near term headwinds, EBITDA margins are expected to taper to 15.0% in
FY19 and then recover to 15.4% as INR stabilises in FY20E. PAT at MSIL
is expected to grow at a CAGR of 13.6% to | 9,959 crore in FY20E.
Exhibit 1: Topline and bottomline trends
43588
43701
49874
57746
68035
79763
89203
99109
23922783
3711 4571
7338
7722
8791
9959
0
2000
4000
6000
8000
10000
12000
0
20000
40000
60000
80000
100000
120000
FY13 FY14 FY15 FY16 FY17 FY18 FY19E FY20E
(| crore)
(| crore)
Topline Bottomline
Source: Company press release, ICICI Direct Research
Exhibit 2: Margins to recover in FY20E
5,089.9
6,605.9
8,978.6
10,353.0
12,061.5
13,410.8
15,255.0
11.6
13.2
15.5 15.2 15.1 15.0
15.4
-
2
4
6
8
10
12
14
16
18
-
2,000
4,000
6,000
8,000
10,000
12,000
14,000
16,000
18,000
FY14 FY15 FY16 FY17 FY18 FY19E FY20E
(%
)
(| crore)
EBITDA Margins (%)
Source: Company press release, ICICI Direct Research
ICICI Securities Ltd | Retail Equity Research Page 5
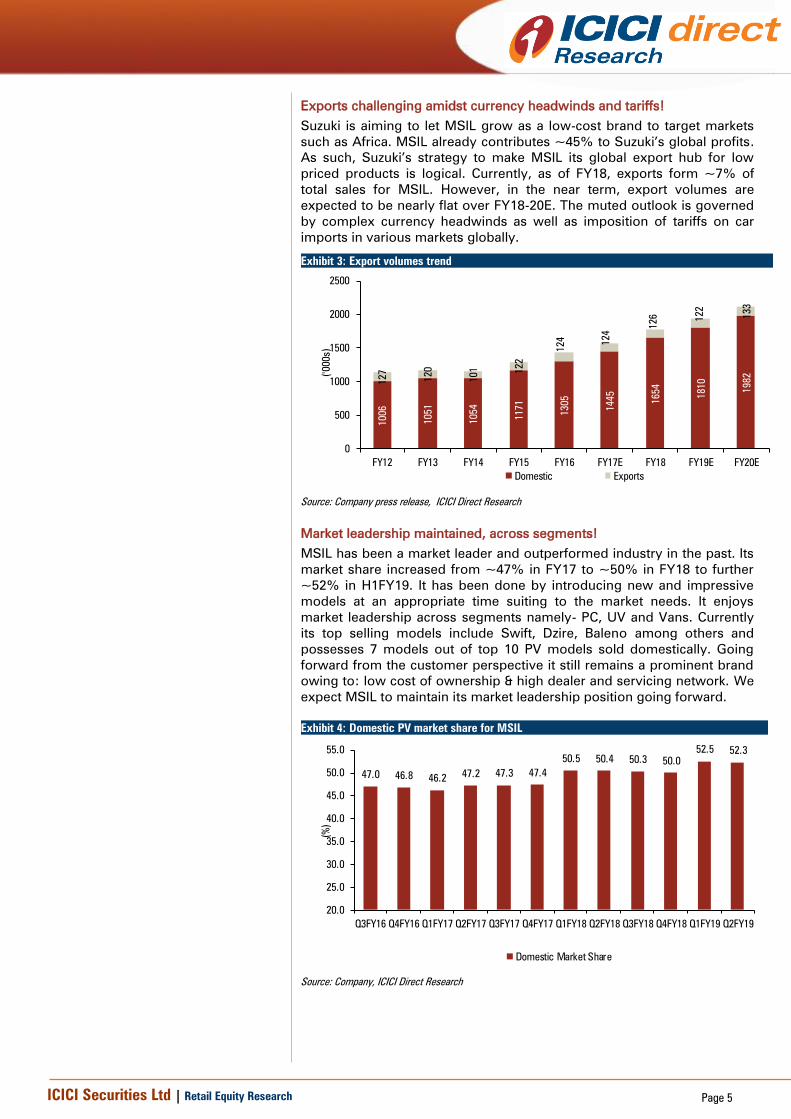
Exports challenging amidst currency headwinds and tariffs!
Suzuki is aiming to let MSIL grow as a low-cost brand to target markets
such as Africa. MSIL already contributes ~45% to Suzuki’s global profits.
As such, Suzuki’s strategy to make MSIL its global export hub for low
priced products is logical. Currently, as of FY18, exports form ~7% of
total sales for MSIL. However, in the near term, export volumes are
expected to be nearly flat over FY18-20E. The muted outlook is governed
by complex currency headwinds as well as imposition of tariffs on car
imports in various markets globally.
Market leadership maintained, across segments!
MSIL has been a market leader and outperformed industry in the past. Its
market share increased from ~47% in FY17 to ~50% in FY18 to further
~52% in H1FY19. It has been done by introducing new and impressive
models at an appropriate time suiting to the market needs. It enjoys
market leadership across segments namely- PC, UV and Vans. Currently
its top selling models include Swift, Dzire, Baleno among others and
possesses 7 models out of top 10 PV models sold domestically. Going
forward from the customer perspective it still remains a prominent brand
owing to: low cost of ownership & high dealer and servicing network. We
expect MSIL to maintain its market leadership position going forward.
Exhibit 4: Domestic PV market share for MSIL
47.0 46.8 46.247.2 47.3 47.4
50.5 50.4 50.3 50.0
52.5 52.3
20.0
25.0
30.0
35.0
40.0
45.0
50.0
55.0
Q3FY16 Q4FY16 Q1FY17 Q2FY17 Q3FY17 Q4FY17 Q1FY18 Q2FY18 Q3FY18 Q4FY18 Q1FY19 Q2FY19
(%
)
Domestic Market Share
Source: Company, ICICI Direct Research
Exhibit 3: Export volumes trend
1006
1051
1054
1171
1305
1445
1654
1810
1982
127
120
101 122
124
124
126 122
133
0
500
1000
1500
2000
2500
FY12 FY13 FY14 FY15 FY16 FY17E FY18 FY19E FY20E
('0
00s)
Domestic Exports
Source: Company press release, ICICI Direct Research
ICICI Securities Ltd | Retail Equity Research Page 6
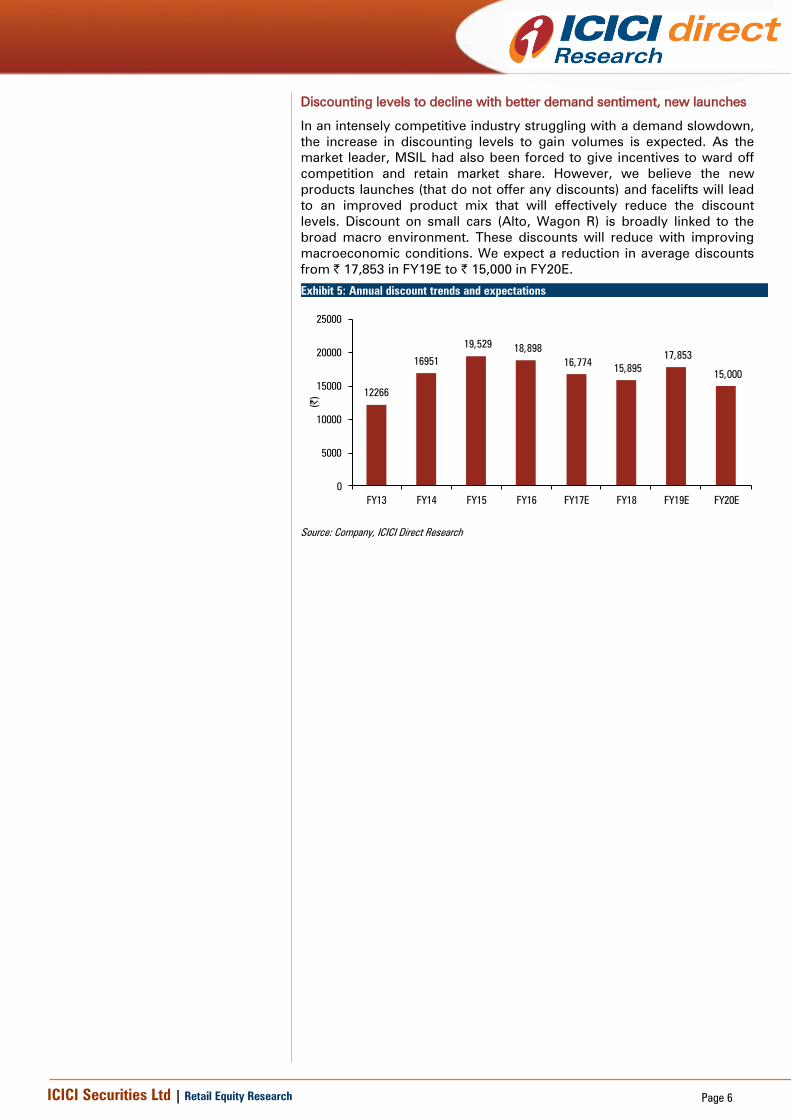
Discounting levels to decline with better demand sentiment, new launches
In an intensely competitive industry struggling with a demand slowdown,
the increase in discounting levels to gain volumes is expected. As the
market leader, MSIL had also been forced to give incentives to ward off
competition and retain market share. However, we believe the new
products launches (that do not offer any discounts) and facelifts will lead
to an improved product mix that will effectively reduce the discount
levels. Discount on small cars (Alto, Wagon R) is broadly linked to the
broad macro environment. These discounts will reduce with improving
macroeconomic conditions. We expect a reduction in average discounts
from | 17,853 in FY19E to | 15,000 in FY20E.
Exhibit 5: Annual discount trends and expectations
12266
16951
19,529 18,898
16,774 15,895
17,853
15,000
0
5000
10000
15000
20000
25000
FY13 FY14 FY15 FY16 FY17E FY18 FY19E FY20E
(|)
Source: Company, ICICI Direct Research
ICICI Securities Ltd | Retail Equity Research Page 7
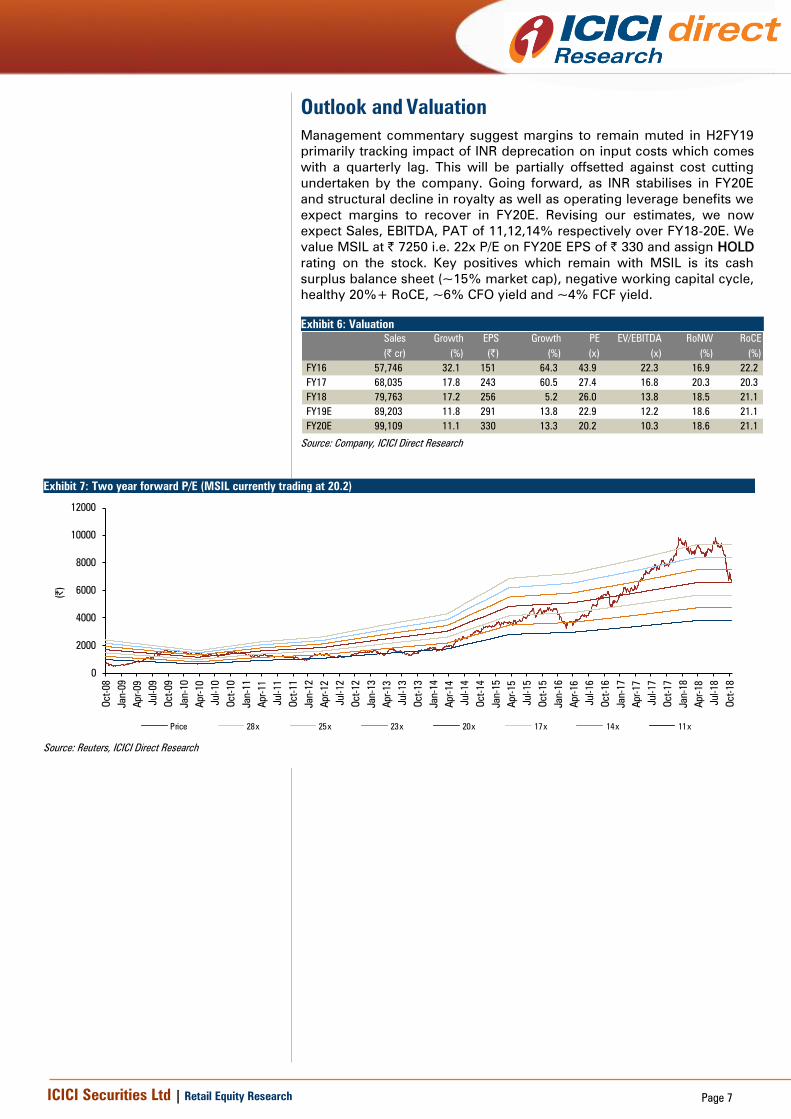
Outlook and Valuation
Management commentary suggest margins to remain muted in H2FY19
primarily tracking impact of INR deprecation on input costs which comes
with a quarterly lag. This will be partially offsetted against cost cutting
undertaken by the company. Going forward, as INR stabilises in FY20E
and structural decline in royalty as well as operating leverage benefits we
expect margins to recover in FY20E. Revising our estimates, we now
expect Sales, EBITDA, PAT of 11,12,14% respectively over FY18-20E. We
value MSIL at | 7250 i.e. 22x P/E on FY20E EPS of | 330 and assign HOLD
rating on the stock. Key positives which remain with MSIL is its cash
surplus balance sheet (~15% market cap), negative working capital cycle,
healthy 20%+ RoCE, ~6% CFO yield and ~4% FCF yield.
Exhibit 6: Valuation
Sales Growth EPS Growth PE EV/EBITDA RoNW RoCE
(| cr) (%) (|) (%) (x) (x) (%) (%)
FY16 57,746 32.1 151 64.3 43.9 22.3 16.9 22.2
FY17 68,035 17.8 243 60.5 27.4 16.8 20.3 20.3
FY18 79,763 17.2 256 5.2 26.0 13.8 18.5 21.1
FY19E 89,203 11.8 291 13.8 22.9 12.2 18.6 21.1
FY20E 99,109 11.1 330 13.3 20.2 10.3 18.6 21.1
Source: Company, ICICI Direct Research
Exhibit 7: Two year forward P/E (MSIL currently trading at 20.2)
0
2000
4000
6000
8000
10000
12000
Oct-08
Jan-09
Apr-09
Jul-09
Oct-09
Jan-10
Apr-10
Jul-10
Oct-10
Jan-11
Apr-11
Jul-11
Oct-11
Jan-12
Apr-12
Jul-12
Oct-12
Jan-13
Apr-13
Jul-13
Oct-13
Jan-14
Apr-14
Jul-14
Oct-14
Jan-15
Apr-15
Jul-15
Oct-15
Jan-16
Apr-16
Jul-16
Oct-16
Jan-17
Apr-17
Jul-17
Oct-17
Jan-18
Apr-18
Jul-18
Oct-18
(|)
Price 28x 25x 23x 20x 17x 14x 11x
Source: Reuters, ICICI Direct Research
ICICI Securities Ltd | Retail Equity Research Page 8
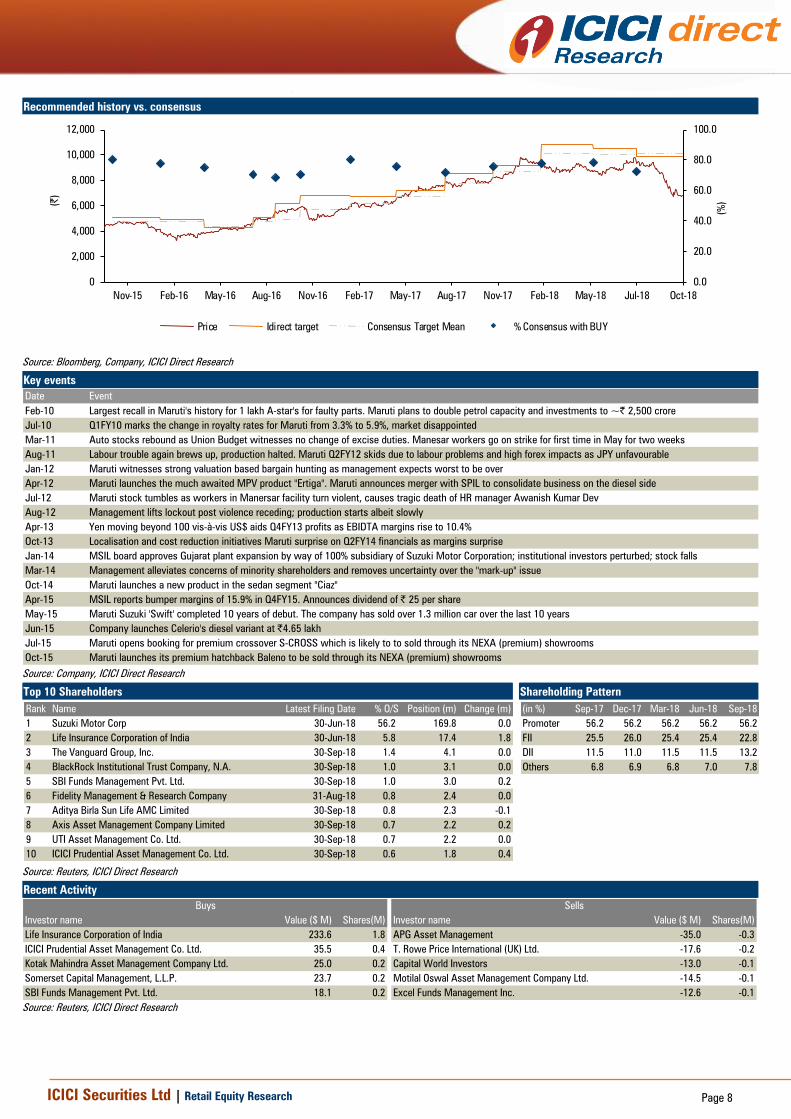
Recommended history vs. consensus
0.0
20.0
40.0
60.0
80.0
100.0
0
2,000
4,000
6,000
8,000
10,000
12,000
Oct-18Jul-18May-18Feb-18Nov-17Aug-17May-17Feb-17Nov-16Aug-16May-16Feb-16Nov-15
(%
)(|)
Price Idirect target Consensus Target Mean % Consensus with BUY
Source: Bloomberg, Company, ICICI Direct Research
Key events
Date Event
Feb-10 Largest recall in Maruti's history for 1 lakh A-star's for faulty parts. Maruti plans to double petrol capacity and investments to ~| 2,500 crore
Jul-10 Q1FY10 marks the change in royalty rates for Maruti from 3.3% to 5.9%, market disappointed
Mar-11 Auto stocks rebound as Union Budget witnesses no change of excise duties. Manesar workers go on strike for first time in May for two weeks
Aug-11 Labour trouble again brews up, production halted. Maruti Q2FY12 skids due to labour problems and high forex impacts as JPY unfavourable
Jan-12 Maruti witnesses strong valuation based bargain hunting as management expects worst to be over
Apr-12 Maruti launches the much awaited MPV product "Ertiga". Maruti announces merger with SPIL to consolidate business on the diesel side
Jul-12 Maruti stock tumbles as workers in Manersar facility turn violent, causes tragic death of HR manager Awanish Kumar Dev
Aug-12 Management lifts lockout post violence receding; production starts albeit slowly
Apr-13 Yen moving beyond 100 vis-à-vis US$ aids Q4FY13 profits as EBIDTA margins rise to 10.4%
Oct-13 Localisation and cost reduction initiatives Maruti surprise on Q2FY14 financials as margins surprise
Jan-14 MSIL board approves Gujarat plant expansion by way of 100% subsidiary of Suzuki Motor Corporation; institutional investors perturbed; stock falls
Mar-14 Management alleviates concerns of minority shareholders and removes uncertainty over the "mark-up" issue
Oct-14 Maruti launches a new product in the sedan segment "Ciaz"
Apr-15 MSIL reports bumper margins of 15.9% in Q4FY15. Announces dividend of | 25 per share
May-15 Maruti Suzuki 'Swift' completed 10 years of debut. The company has sold over 1.3 million car over the last 10 years
Jun-15 Company launches Celerio's diesel variant at |4.65 lakh
Jul-15 Maruti opens booking for premium crossover S-CROSS which is likely to to sold through its NEXA (premium) showrooms
Oct-15 Maruti launches its premium hatchback Baleno to be sold through its NEXA (premium) showrooms
Source: Company, ICICI Direct Research
Top 10 Shareholders Shareholding Pattern
Rank Name Latest Filing Date % O/S Position (m) Change (m)
1 Suzuki Motor Corp 30-Jun-18 56.2 169.8 0.0
2 Life Insurance Corporation of India 30-Jun-18 5.8 17.4 1.8
3 The Vanguard Group, Inc. 30-Sep-18 1.4 4.1 0.0
4 BlackRock Institutional Trust Company, N.A. 30-Sep-18 1.0 3.1 0.0
5 SBI Funds Management Pvt. Ltd. 30-Sep-18 1.0 3.0 0.2
6 Fidelity Management & Research Company 31-Aug-18 0.8 2.4 0.0
7 Aditya Birla Sun Life AMC Limited 30-Sep-18 0.8 2.3 -0.1
8 Axis Asset Management Company Limited 30-Sep-18 0.7 2.2 0.2
9 UTI Asset Management Co. Ltd. 30-Sep-18 0.7 2.2 0.0
10 ICICI Prudential Asset Management Co. Ltd. 30-Sep-18 0.6 1.8 0.4
(in %) Sep-17 Dec-17 Mar-18 Jun-18 Sep-18
Promoter 56.2 56.2 56.2 56.2 56.2
FII 25.5 26.0 25.4 25.4 22.8
DII 11.5 11.0 11.5 11.5 13.2
Others 6.8 6.9 6.8 7.0 7.8
Source: Reuters, ICICI Direct Research
Recent Activity
Investor name Value ($ M) Shares(M) Investor name Value ($ M) Shares(M)
Life Insurance Corporation of India 233.6 1.8 APG Asset Management -35.0 -0.3
ICICI Prudential Asset Management Co. Ltd. 35.5 0.4 T. Rowe Price International (UK) Ltd. -17.6 -0.2
Kotak Mahindra Asset Management Company Ltd. 25.0 0.2 Capital World Investors -13.0 -0.1
Somerset Capital Management, L.L.P. 23.7 0.2 Motilal Oswal Asset Management Company Ltd. -14.5 -0.1
SBI Funds Management Pvt. Ltd. 18.1 0.2 Excel Funds Management Inc. -12.6 -0.1
Buys Sells
Source: Reuters, ICICI Direct Research

ICICI Securities Ltd | Retail Equity Research Page 9
.
Financial summary
Profit and loss statement | Crore
(Year-end March) FY17 FY18 FY19E FY20E
Total operating Income 68,035 79,763 89,203 99,109
Growth (%) 18 17 12 11
Raw Material Expenses 46,732 54,975 61,244 67,956
Employee Expenses 2,331 2,834 3,190 3,390
Marketing Expenses 0 0 0 0
Administrative Expenses 0 0 0 0
Other expenses 8,619 9,892 11,359 12,509
Total Operating Expenditure 57,682 67,701 75,793 83,854
EBITDA 10,353 12,062 13,411 15,255
Growth (%) 57 17 11 14
Depreciation 2,602 2,758 2,944 3,469
Interest 89 346 88 88
Other Income 2,280 2,046 2,346 2,736
PBT 9,941 11,003 12,725 14,434
Others 0 0 0 0
Total Tax 2,604 3,282 3,933 4,474
PAT 7,338 7,722 8,791 9,959
Growth (%) 98 5 14 13
EPS (|) 243 256 291 330
Source: Company, ICICI Direct Research
Cash flow statement | Crore
(Year-end March) FY17 FY18 FY19E FY20E
Profit after Tax 7,338 7,722 8,791 9,959
Add: Depreciation 2,602 2,758 2,944 3,469
(Inc)/dec in Current Assets -346 -50 -1,349 -343
Inc/(dec) in CL and Provisions 1,535 2,584 676 1,282
Others 89 346 88 88
CF from operating activities 11,219 13,359 11,150 14,455
(Inc)/dec in Investments -26,682 -6,527 -3,400 -6,180
(Inc)/dec in Fixed Assets -3,369 -3,701 -4,000 -4,000
Others 16,663 -218 -319 -311
CF from investing activities -13,388 -10,447 -7,719 -10,491
Issue/(Buy back) of Equity 0 0 0 0
Inc/(dec) in loan funds 406 -373 0 0
Dividend paid & dividend tax -2,727 -2,900 -3,262 -3,806
Inc/(dec) in Sec. premium 0 0 0 0
Others 4,464 419 -88 -88
CF from financing activities 2,143 -2,854 -3,350 -3,894
Net Cash flow -26 58 81 70
Opening Cash 39 13 71 152
Closing Cash 13 71 152 222
Source: Company, ICICI Direct Research
Balance sheet | Crore
(Year-end March) FY17 FY18 FY19E FY20E
Liabilities
Equity Capital 151 151 151 151
Reserve and Surplus 36,020 41,606 47,135 53,288
Total Shareholders funds 36,171 41,757 47,286 53,439
Total Debt 484 111 111 111
Deferred Tax Liability 464 559 559 559
Others Liabilties 1,127 1,612 1,652 1,692
Total Liabilities 38,246 44,039 49,608 55,801
Assets
Gross Block 18,656 21,424 26,550 31,050
Less: Acc Depreciation 5,367 8,065 11,009 14,477
Net Block 13,289 13,359 15,541 16,572
Capital WIP 1,252 2,126 1,000 500
Total Fixed Assets 14,542 15,485 16,541 17,072
Investments 28,228 35,290 38,940 45,370
Inventory 3,262 3,161 3,788 3,937
Debtors 1,199 1,462 1,955 1,901
Loans and Advances 3 3 9 10
Other Current Assets 2,119 2,007 2,230 2,478
Cash 13 71 152 222
Total Current Assets 6,596 6,704 8,134 8,547
Creditors 8,367 10,497 10,998 12,219
Provisions 449 560 550 611
Other current Liabilities 3,931 4,274 4,460 4,460
Total Current Liabilities 12,748 15,331 16,008 17,290
Net Current Assets -6,152 -8,627 -7,873 -8,743
Other Assets 1,627 1,891 2,000 2,101
Application of Funds 38,246 44,039 49,608 55,801
Source: Company, ICICI Direct Research
Key ratios
(Year-end March) FY17 FY18 FY19E FY20E
Per share data (|)
EPS 242.9 255.6 291.0 329.7
Cash EPS 329.0 346.9 388.5 444.5
BV 1,197.4 1,382.3 1,565.3 1,769.0
DPS 75.0 80.0 90.0 105.0
Cash Per Share 0.4 2.4 5.0 7.3
Operating Ratios
EBITDA Margin (%) 15.2 15.1 15.0 15.4
PBIT / Net sales (%) 11.4 11.7 11.7 11.9
PAT Margin (%) 10.8 9.7 9.9 10.0
Inventory days 17.5 14.5 15.5 14.5
Debtor days 6.4 6.7 8.0 7.0
Creditor days 44.9 48.0 45.0 45.0
Return Ratios (%)
RoE 20.3 18.5 18.6 18.6
RoCE 20.3 21.1 21.1 21.1
RoIC 66.1 91.7 77.9 85.6
Valuation Ratios (x)
P/E 27.4 26.0 22.9 20.2
EV / EBITDA 16.8 13.8 12.2 10.3
EV / Net Sales 2.6 2.1 1.8 1.6
Market Cap / Sales 3.0 2.5 2.3 2.0
Price to Book Value 5.6 4.8 4.2 3.8
Solvency Ratios
Debt/EBITDA 0.0 0.0 0.0 0.0
Debt / Equity 0.0 0.0 0.0 0.0
Current Ratio 0.7 0.6 0.7 0.6
Quick Ratio 0.4 0.3 0.4 0.3
Source: Company, ICICI Direct Research

ICICI Securities Ltd | Retail Equity Research Page 10
ICICI Direct Research coverage universe (Auto & Auto Ancillary)
CMP M Cap
(|) TP(|) Rating (| Cr) FY18E FY19E FY20E FY18E FY19E FY20E FY18E FY19E FY20E FY18E FY19E FY20E FY18E FY19E FY20E
Amara Raja (AMARAJ) 760 875 Hold 12977 27.6 32.8 41.6 27.5 23.1 18.3 15.9 13.3 10.7 23.3 23.5 25.3 16.0 16.3 17.5
Apollo Tyre (APOTYR) 211 325 Buy 12070 12.7 19.5 25.0 16.7 10.8 8.5 8.4 8.4 7.2 7.8 10.7 12.6 7.4 10.4 12.0
Ashok Leyland (ASHLEY) 117 135 Buy 33010 5.3 6.6 8.2 21.9 17.7 14.3 10.2 8.8 6.8 28.5 31.2 33.0 21.9 23.4 24.2
Bajaj Auto (BAAUTO) 2567 2410 Hold 74271 140.6 153.3 169.5 17.6 16.2 14.6 11.8 10.4 8.9 22.9 22.4 22.3 21.5 20.7 20.4
Balkrishna Ind. (BALIND) 1039 1250 Buy 20085 38.2 50.2 59.2 31.2 23.8 20.2 21.0 14.8 12.1 22.4 25.8 25.9 18.1 25.8 25.9
Bharat Forge (BHAFOR) 565 720 Buy 26302 16.2 24.1 28.1 34.9 23.5 20.1 17.4 14.2 12.0 23.0 27.0 26.1 17.5 23.8 21.7
Bosch (MICO) 18601 20000 Hold 58407 449.1 585.3 645.5 43.0 33.0 29.9 26.8 21.9 19.1 14.4 16.2 16.0 21.4 24.2 23.9
Eicher Motors (EICMOT) 22165 32900 Buy 59868 725.5 989.1 1214.6 30.5 22.4 18.2 26.5 20.6 16.4 39.1 37.0 35.1 29.9 28.7 27.1
Exide Industries (EXIIND) 263 300 Buy 22389 8.2 10.1 12.3 31.9 26.1 21.4 18.3 14.7 12.2 19.1 20.7 22.2 13.0 14.2 15.4
Hero Moto (HERHON) 2832 3350 Buy 56547 185.1 186.6 209.6 15.3 15.2 13.5 9.5 9.2 7.9 42.4 41.0 41.3 31.4 29.0 29.1
JK Tyre & Ind (JKIND) 97 120 Hold 2202 2.9 15.7 22.1 33 6.2 4.4 10.3 5.9 4.8 7.8 13.2 15.3 3.7 16.6 18.8
Mahindra CIE (MAHAUT) 264 280 Buy 9994 9.5 14.5 17.7 27.9 18.2 15.0 13.7 9.9 8.2 9.8 12.9 13.7 11.2 15.0 17.1
Maruti Suzuki (MARUTI) 6650 7250 Hold 200032 255.6 291.0 329.7 26.0 22.9 20.2 13.8 12.2 10.3 21.1 21.1 21.1 18.5 18.6 18.6
Motherson (MOTSUM) 250 335 Hold 52583 7.6 11.2 14.4 32.9 22.3 17.3 14.0 10.7 8.5 16.3 22.5 27.0 17.4 23.0 24.8
Tata Motors (TELCO) 183 200 Hold 54829 26.8 7.0 28.4 6.9 26.2 6.5 2.0 2.8 2.5 10.5 6.9 9.1 10.3 5.9 11.0
Wabco India (WABTVS) 6500 7200 Hold 12350 143.8 175.3 205.8 45.2 37.1 31.6 30.6 26.3 21.6 17.9 18.3 17.9 25.1 25.8 24.9
Sector / Company
RoE (%)EPS (|) P/E (x) EV/EBITDA (x) RoCE (%)
Source: Company, ICICI Direct Research

ICICI Securities Ltd | Retail Equity Research Page 11
RATING RATIONALE
ICICI Direct endeavours to provide objective opinions and recommendations. ICICI Direct assigns ratings to its
stocks according to their notional target price vs. current market price and then categorises them as Strong
Buy, Buy, Hold and Sell. The performance horizon is two years unless specified and the notional target price is
defined as the analysts' valuation for a stock.
Strong Buy: >15%/20% for large caps/midcaps, respectively, with high conviction;
Buy: >10%/15% for large caps/midcaps, respectively;
Hold: Up to +/-10%;
Sell: -10% or more;
Pankaj Pandey Head – Research [email protected]
ICICI Direct Research Desk,
ICICI Securities Limited,
1st Floor, Akruti Trade Centre,
Road No 7, MIDC,
Andheri (East)
Mumbai – 400 093
ICICI Securities Ltd | Retail Equity Research Page 12
ANALYST CERTIFICATION
We /I, Shashank Kanodia, CFA MBA (Capital Markets) and Vidrum Mehta, MBA (Finance) Research Analysts, authors and the names subscribed to this report, hereby certify that all of the views expressed
in this research report accurately reflect our views about the subject issuer(s) or securities. We also certify that no part of our compensation was, is, or will be directly or indirectly related to the specific
recommendation(s) or view(s) in this report.
Terms & conditions and other disclosures:
ICICI Securities Limited (ICICI Securities) is a full-service, integrated investment banking and is, inter alia, engaged in the business of stock brokering and distribution of financial products. ICICI Securities
Limited is a Sebi registered Research Analyst with Sebi Registration Number – INH000000990. ICICI Securities Limited Sebi Registration is INZ000183631 for stock Broker. ICICI Securities is a wholly-owned
subsidiary of ICICI Bank which is India’s largest private sector bank and has its various subsidiaries engaged in businesses of housing finance, asset management, life insurance, general insurance, venture
capital fund management, etc. (“associates”), the details in respect of which are available on www.icicibank.com.
ICICI Securities is one of the leading merchant bankers/ underwriters of securities and participate in virtually all securities trading markets in India. We and our associates might have investment banking
and other business relationship with a significant percentage of companies covered by our Investment Research Department. ICICI Securities generally prohibits its analysts, persons reporting to analysts
and their relatives from maintaining a financial interest in the securities or derivatives of any companies that the analysts cover.
The information and opinions in this report have been prepared by ICICI Securities and are subject to change without any notice. The report and information contained herein is strictly confidential and
meant solely for the selected recipient and may not be altered in any way, transmitted to, copied or distributed, in part or in whole, to any other person or to the media or reproduced in any form, without
prior written consent of ICICI Securities. While we would endeavour to update the information herein on a reasonable basis, ICICI Securities is under no obligation to update or keep the information current.
Also, there may be regulatory, compliance or other reasons that may prevent ICICI Securities from doing so. Non-rated securities indicate that rating on a particular security has been suspended
temporarily and such suspension is in compliance with applicable regulations and/or ICICI Securities policies, in circumstances where ICICI Securities might be acting in an advisory capacity to this
company, or in certain other circumstances.
This report is based on information obtained from public sources and sources believed to be reliable, but no independent verification has been made nor is its accuracy or completeness guaranteed. This
report and information herein is solely for informational purpose and shall not be used or considered as an offer document or solicitation of offer to buy or sell or subscribe for securities or other financial
instruments. Though disseminated to all the customers simultaneously, not all customers may receive this report at the same time. ICICI Securities will not treat recipients as customers by virtue of their
receiving Shashank Kanodia, CFA MBA (Capital Markets) and Vidrum Mehta, MBA (Finance) this report. Nothing in this report constitutes investment, legal, accounting and tax advice or a representation
that any investment or strategy is suitable or appropriate to your specific circumstances. The securities discussed and opinions expressed in this report may not be suitable for all investors, who must make
their own investment decisions, based on their own investment objectives, financial positions and needs of specific recipient. This may not be taken in substitution for the exercise of independent judgment
by any recipient. The recipient should independently evaluate the investment risks. The value and return on investment may vary because of changes in interest rates, foreign exchange rates or any other
reason. ICICI Securities accepts no liabilities whatsoever for any loss or damage of any kind arising out of the use of this report. Past performance is not necessarily a guide to future performance. Investors
are advised to see Risk Disclosure Document to understand the risks associated before investing in the securities markets. Actual results may differ materially from those set forth in projections. Forward-
looking statements are not predictions and may be subject to change without notice.
ICICI Securities or its associates might have managed or co-managed public offering of securities for the subject company or might have been mandated by the subject company for any other assignment
in the past twelve months.
ICICI Securities or its associates might have received any compensation from the companies mentioned in the report during the period preceding twelve months from the date of this report for services in
respect of managing or co-managing public offerings, corporate finance, investment banking or merchant banking, brokerage services or other advisory service in a merger or specific transaction.
ICICI Securities or its associates might have received any compensation for products or services other than investment banking or merchant banking or brokerage services from the companies mentioned
in the report in the past twelve months.
ICICI Securities encourages independence in research report preparation and strives to minimize conflict in preparation of research report. ICICI Securities or its associates or its analysts did not receive any
compensation or other benefits from the companies mentioned in the report or third party in connection with preparation of the research report. Accordingly, neither ICICI Securities nor Research Analysts
and their relatives have any material conflict of interest at the time of publication of this report.
It is confirmed that Shashank Kanodia, CFA MBA (Capital Markets) and Vidrum Mehta, MBA (Finance) Research Analysts of this report have not received any compensation from the companies mentioned
in the report in the preceding twelve months.
Compensation of our Research Analysts is not based on any specific merchant banking, investment banking or brokerage service transactions.
ICICI Securities or its subsidiaries collectively or Research Analysts or their relatives do not own 1% or more of the equity securities of the Company mentioned in the report as of the last day of the month
preceding the publication of the research report.
Since associates of ICICI Securities are engaged in various financial service businesses, they might have financial interests or beneficial ownership in various companies including the subject
company/companies mentioned in this report.