maryland oyster population - department of natural...
TRANSCRIPT

Maryland Oyster Population
Status Report 2015 Fall Survey
Mitchell Tarnowski
And the Staff of the Shellfish Division and
Cooperative Oxford Laboratory
Maryland Department of Natural Resources Publication # 17-5232016-823
June 2016

FOR MORE INFORMATION PLEASE CONTACT
Maryland Department of Natural Resources Fisheries Service
Tawes State Office Building, B-2 580 Taylor Avenue
Annapolis, Maryland 21401 1-800-688-FINS • 410-260-8258
TTY users call via the MD Relay
GENERAL INFORMATION
1-877-620-8DNR dnr.maryland.gov
Fisheries Service Ext. - 8258
Larry Hogan, Governor Boyd K. Rutherford, Lt. Governor
Mark Belton, Secretary
This document is available in alternative format upon request from a qualified individual with a disability.
The facilities and services of the Maryland Department of Natural Resources are available to all without
regard to race, color, religion, sex, age, sexual orientation, national origin, physical or mental disability.

CONTRIBUTORS
Editor
Shellfish Division
Mitchell Tarnowski, Biologist
Technical Participants
Lead Scientist
Shellfish Division
Mitchell Tarnowski
Field Operations
Shellfish Division
David White, Captain R/V Miss Kay
Robert Bussell, Biologist
Thomas Wilson, Mate R/V Miss Kay
Chris Brumwell, Mate R/V Miss Kay
Disease Diagnostics
Cooperative Oxford Laboratory
Chris Dungan, Pathologist
Rita Crockett (Virginia Institute of Marine Science), Pathologist
Judson Blazek, Managing Histologist
Laurinda Serafin, Histotechnician
Stuart Lehmann, Histotechnician
Suzanne Tyler, Histotechnician
Donna Real, Histotechnician
Data Management
Shellfish Division
Jodi Baxter, Biologist
Amy Larimer, Biologist
Statistical Analyses
Shellfish Division
Dr. Mark Homer, Research Statistician
Text
Shellfish Division
Mitchell Tarnowski
Reviewers Fisheries Service Resource Assessment Service
Dr. Mark Homer Carol B. McCollough
Christopher Dungan
Christopher Judy
Field Assistance Maryland Department of Natural Resources
Mark Homer Christopher Judy Carol McCollough
Steven Schneider Amy Larimer Angel Willey
James Dumhart Jeremy George Jodi Baxter
Margaret McGinty Eric Weissberger Frank Marenghi
Bethany Chapman Joanne Throwe Laurinda Serafin
Potomac River Fisheries Commission
Ellen Cosby
Cover: Power dredging on a foggy morning in the Choptank River. (Photo: R. Bussell)

TABLE OF CONTENTS
IN MEMORIAM
Sally V. Otto (1942-2016)………………………………………………………...............2
EXECUTIVE SUMMARY……………………………………………………………...............3
INTRODUCTION……………………………………………………………….........................7
METHODS……………………………………………………………………….........................7
RESULTS
Freshwater Discharge Conditions……………………………………………………………10
Spatfall Intensity……………………………………………………………………………..11
Oyster Diseases………………………………………………………………………………15
Oyster Mortality……………………………………………………………………...............17
Biomass Index………………………………………………………………………………..18
Commercial Harvest………………………………………………………………................19
Oyster Sanctuaries…………………………………………………………………...............20
DISCUSSION
Present Conditions and Trends………………………………………………………………21
LITERATURE CITED...............................................................................................................22
TABLES………………………………………………………………………………………...24
APPENDIX 1: OYSTER HOST and OYSTER PATHOGENS…………………………….50
APPENDIX 2: GLOSSARY…………………………………………………………..............53
Power dredge fleet working on Great Bar in the mouth of Broad Creek, November 2015. (Photo: Robert Bussell)

2
IN MEMORIAM
Sally (Sara V.) Otto Sept. 2, 1942 – Jan. 9, 2016
Born an only child to dairy industry parents of Pittsburgh, Pa. in 1942, Sally Otto relocated with
her family to the Eastern Shore of Chesapeake Bay as a young woman in 1962.
In 1964 she earned her Bachelor of Arts in biology from MacMurray College, and quickly went
to laboratory work on both surf clam histology and electrophoresis of marine invertebrate blood
proteins, at the new Bureau of Commercial Fisheries Biological Laboratory in Oxford, Md. Sally
then broadened her skills during a year of virology research at Johns Hopkins University. In
1967, she returned to Oxford Laboratory to begin what became an accomplished 34-year career
with the Maryland Department of Natural Resources, as a microbiologist and pathologist of
molluscs, and also occasionally of crustacea and finfish.
During three of those years, Sally served a pioneering role as the first female co-editor of
Proceedings of the National Shellfisheries Association (now Journal of Shellfish Research), as
she edited that research journal in partnership with Bill Shaw (1972) and Haskell Tubiash (1973-
1974). Sally was well-educated, highly literate, and articulate in both English and French. She
routinely exercised a sharp wit that issued a steady stream of buoyant, occasionally salty,
observations and commentary. Among her many research and monitoring efforts on diseases and
reproduction of marine invertebrates, the results of several were published for posterity;
frequently in collaboration with renowned co-authors.
In 1989, Sally helped develop and implement revised methods for the Maryland Department of
Natural Resources’ annual Fall Survey of oyster populations, whose consistent and systematic
data inform the management of Maryland oyster resources today. Sally expertly and diligently
analyzed oyster and clam histological slides for such surveys, until her retirement in 2001. Her
knowledge of parasites, pathogens, and diseases of oysters and clams was encyclopedic, and it
was Sally’s passion to share that knowledge enthusiastically with several generations of oyster
pathologist protégés. Her generous and illuminating torch has now been passed.
3
EXECUTIVE SUMMARY
Since 1939, the Maryland Department of Natural Resources and its predecessor agencies have been
monitoring the status of the State’s oyster population by means of annual field surveys – one of the longest
running programs of this kind in the world.
Integral to the Fall Oyster Survey are four indices intended to assess Maryland’s oyster populations: the
Spatfall Intensity Index, a measure of recruitment success and potential increase of the population obtained
from a subset of 53 oyster bars; the Oyster Disease Index, which documents disease infection levels and
rates as derived from a subset of 43 oyster bars; the Total Observed Mortality Index, an indicator of annual
mortality rates of post-spat stage oysters calculated from the 43 oyster bar Disease Index subset; and the
Biomass Index, which measures the number and weight of oysters from the 43 Disease Bar subset relative
to the 1993 baseline.
The 2015 Fall Oyster Survey was conducted from 1 October to 8 December throughout the Maryland
portion of the Chesapeake Bay and its tributaries, including the Potomac River. A total of 323 samples
were collected from 259 oyster bars. Despite a generally low spatset, the results were otherwise
encouraging, with sustained multi-year trends of low disease pressure, below-average mortality, and
elevated biomass.
This was a mixed year for recruitment. The Spatfall Intensity Index of 34.2 was 50% higher than the 31-
year median value and three times as high as the previous year. Most of this gain occurred in southern
Maryland, where the north shore of the lower Potomac River experienced the best spatset in nearly a third
of a century. However, spatfall generally was average to poor upbay from the Patuxent River, with large
expanses of the upper and middle bay and upper Potomac River receiving no spat.
Dermo disease remained below long-term average levels, continuing a trend that began in 2003, although
prevalence and intensity indices increased slightly from the previous year and it continued to be widely
distributed throughout Maryland waters. Oysters at all but two of the standard disease monitoring sites
were infected with Perkinsus marinus, the parasite which causes dermo disease. Some oyster populations,
especially on bars from the Choptank River and south, had elevated intensities that may be cause for
concern in the future. For the second consecutive year, MSX disease showed an increase in prevalence
while expanding its range upbay, reaching as far north as the Eastern Bay and the Miles River, although at
very low prevalences. This was the furthest upbay MSX has been detected since 2009.
Despite an uptick in oyster mortalities, the Mortality Index of 14% remained below the 31-year mean,
continuing a 12-year trend as a consequence of the low disease pressure. This is a remarkable turnaround
from 2002 when record high disease levels devastated the Maryland population, killing 58% of the oysters
statewide.
The 2015 Maryland Oyster Biomass Index dipped slightly from record highs of the two previous years.
Nonetheless, the 2015 Biomass Index of 1.77 was the third highest of the 26-year time series, reflecting the
high oyster survivorship over the past few years, particularly the strong 2010 and 2012 year classes.
The major oyster sanctuaries were sampled during the 2015 Fall Survey. Like the rest of the region,
recruitment was generally indifferent except in the southern part of state waters. No evidence of MSX was
found in either Harris Creek or the Tred Avon River, but was found in the Little Choptank River at elevated
prevalence. Mortality rates continue to be well below the long-term average, including in the Manokin
River sanctuary, where there were anecdotal reports of oysters dying. Overall, those sanctuaries that
received strong spatfalls in 2010 and 2012 and those receiving supplemental oyster seed plantings appeared
to be in good condition.
With reported harvests of 389,000 bushels during the 2014-15 season, commercial oyster landings
decreased by 7% from the previous year, yet the dockside value of $17.1 million was the highest since
1982. Power dredging accounted for 42% of the landings, primarily from the Lower Eastern Shore and
Choptank regions. In addition, 16% of the total harvest was reported from Broad Creek, the highest for any
region.
4
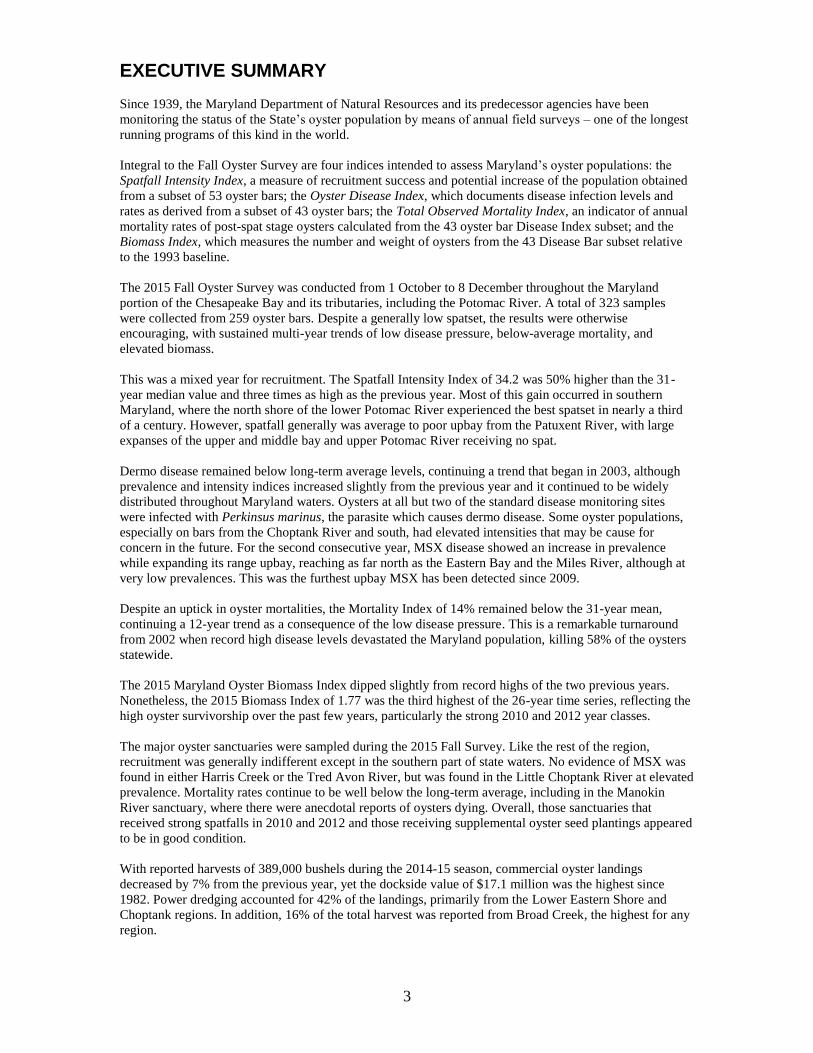
Figure 1a. 2015 Maryland Fall Oyster Survey station locations, all bar types
(standard, Key, Disease, seed) included.
(Return to Text)
5
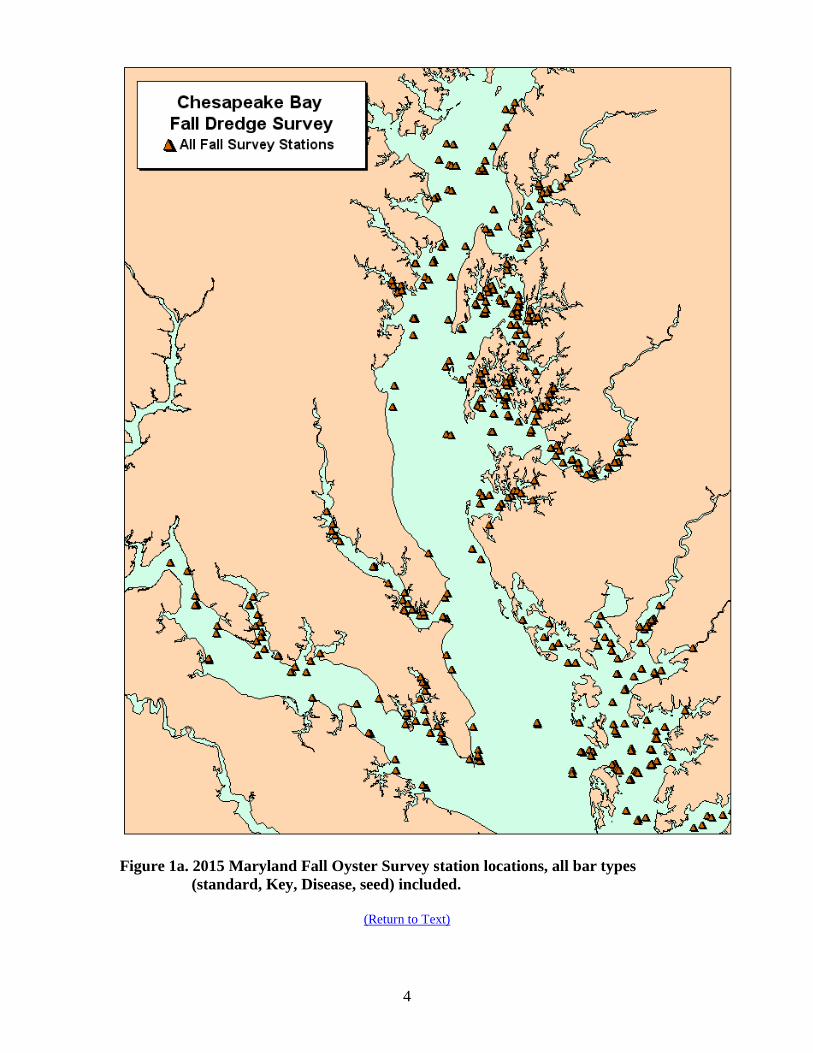
Figure 1b. Maryland Fall Oyster Survey Key Bar locations included in determining
the annual Spatfall Intensity Index.
(Return to Text)

6
Figure 1c. Maryland Fall Oyster Survey standard Disease Bar monitoring location
and additional 2014 disease sample stations.
(Return to Text)

7
INTRODUCTION
Since 1939, a succession of Maryland state
agencies has conducted annual dredge-based
surveys of oyster bars. These oyster
population assessments have provided
biologists and managers with information on
spatfall intensity, observed mortality, and
more recently on parasitic infections in
Maryland’s Chesapeake Bay. The long-term
nature of the data set is a unique and
valuable aspect of the survey that gives a
historical perspective and reveals trends in
the oyster population. Monitored sites have
included natural oyster bars, seed production
and planting areas, dredged and fresh shell
plantings, and sanctuaries.
Since this survey began, several changes and
additions have been made to allow the
development of structured indices and
statistical frameworks while preserving the
continuity of the long-term data set. In 1975,
53 sites and their alternates, referred to as
the historical “Key Bar” set, were fixed to
form the basis of an annual spatfall intensity
index (Krantz and Webster 1980). These
sites were selected to provide both adequate
geographic coverage and continuity with
data going back to 1939. An oyster parasite
diagnosis component was added in 1958,
and in 1990 a 43-bar subset (Disease Bar
set) was established for obtaining
standardized parasite prevalence and
intensity data. Thirty-one of the Disease
Bars are among the 53 spatfall index oyster
bars (Key Bars).
Collaborative Studies and Outreach
Throughout the years, the Fall Survey has
been a source of collaborative research
opportunities for scientists within and
outside of the Department of Natural
Resources. In 2015, the Fall Survey
provided scientific support to a researcher
from the University of California – Davis
studying microplastic concentrations in the
bay and to a student from William and Mary
College looking into the geochemistry of
oyster shells to develop techniques for
sourcing shells from archeological middens.
Fall Survey data were provided to an
environmental consulting firm working on
National Oceanic and Atmospheric
Administration’s Environmental Sensitivity
Index, a project to establish baseline
biological data for possible responses in the
event of an oil spill. The Survey also
assisted with an innovative pilot fishery
program, examining triploid oyster plantings
on Ragged Point for the Potomac River
Fisheries Commission. Data from the Fall
Survey continue to be used extensively by
the multi-partner Oyster Restoration Project.
METHODS Field Collection
The 2015 Annual Fall Oyster Survey was
conducted by Shellfish Division staff of the
Maryland Department of Natural Resources
Fisheries Service from 13 October to 8
December. A total of 323 samples was
collected during surveys on 259 natural
oyster bars (Figure 1a), including Key Bar
(Figure 1b) and Disease Bar (Figure 1c)
sentinel sites as well as sanctuaries,
contemporary seed oyster planting sites,
shell planting locations, and seed production
areas.
A 32-inch-wide oyster dredge was used to
obtain the samples. The number of samples
collected varied with the type of site.
Sample volumes were measured in
Maryland bushels (bu) (Appendix 2). At
each of the 53 Key Bar sites and the 43
Disease Bars, two 0.5-bu subsamples were
collected from replicate dredge tows. On
seed production areas, five 0.2-bu
subsamples were taken from replicate
dredge tows. At all other sites, one 0.5-bu
subsample was collected. A list of data
categories recorded from each sample
appears in Table 1. Oyster counts were
reported as numbers per Maryland bushel.
Since 2005, tow distances have been
recorded for all samples (providing the
dredge was not full) using the odometer
function of a global positioning system unit,
and the total volumes of dredged material

8
per tow were noted before the subsamples
were removed. Photos illustrating the
collection process can be viewed here:
http://dnr2.maryland.gov/fisheries/Pages/she
llfish-monitoring/sample.aspx
Fall Oyster Survey Indices
Integral to the Fall Oyster Survey are four
categories of indices used to assess
Maryland oyster populations: spatfall,
disease, mortality, and biomass. The Spatfall
Intensity Index is a measure of recruitment
success and potential increase of the
population obtained from an established
subset of 53 oyster bars (Key Bars); it is the
arithmetic mean of spat/bushel counts from
this subset. Disease levels are documented
by oyster disease prevalence indices (dermo
and MSX disease) and the Intensity Index
(dermo disease only) as derived from a
subset of 43 oyster bars; these indices were
established in 1990. The Total Observed
Mortality Index is an indicator of annual
natural mortality rates of post-spat stage
oysters from the 43 oyster bar Disease Index
subset, calculated as the number of dead
oysters (boxes and gapers) divided by the
sum of live and dead oysters (Appendix 2).
Although keyed to the Disease Index subset
established in 1990, the Total Observed
Mortality Index also includes data from
1985-1989. The Biomass Index measures
the number and estimates the weight of post-
spat oysters from the 43 Disease Bar subset
relative to the 1993 survey year baseline.
Oyster Disease Analyses
Representative samples of 30 oysters older
than one year were taken at each of the 43
Disease Bar sites. Additional samples for
disease diagnostics were collected from seed
production areas, seed planting areas,
sanctuaries, and other areas of special
interest. Due to scarcities of oysters at two
sampling sites (Holland Point, Flag Pond),
smaller samples (n = 7, 17 respectively)
were secured for disease assays. Oyster
parasite diagnostic tests were performed by
staff of the Cooperative Oxford Laboratory.
Data reported for Perkinsus marinus (dermo
disease) are from Ray’s fluid thioglycollate
medium (RFTM) assays of rectum tissues.
Prior to 1999, less-sensitive hemolymph
assays were performed. Data reported for
Haplosporidium nelsoni (MSX disease)
have been generated by histology since
1999. Before 1999, hemolymph cytology
was performed, while histology samples
were examined for H. nelsoni only from
selected locations.
In this report, prevalence refers to the
percentage of oysters in a sample that were
infected, regardless of infection intensity.
Infection intensity categorically ranks the
relative abundance of pathogen cells in
analyzed oyster tissues. Mean infection
intensities are calculated for all oysters in a
sample or larger group (e.g. Disease Bars
set), including zeroes for uninfected oysters.
A categorical infection intensity range from
0-7 is used to rank dermo disease intensities
(Calvo et al. 1996). See Gieseker (2001) for
a complete description of parasite diagnostic
techniques and calculations.
Biomass Index
Department of Natural Resources staff at the
Cooperative Oxford Laboratory developed
the size-weight relationships used in
calculating the Biomass Index (Jordan et al.
2002). Oyster shells were measured in the
longest dimension and the meats were
removed, oven-dried, then weighed.
Average dry-meat weights (dmw) were
calculated for oysters in each 5-mm
grouping used in the field measurements,
and those standards have been used to
calculate the annual Biomass Index from
size-frequency data collected from Fall
Survey field samples, as follows:
For each of the 43 disease monitoring
stations, the number of small and market
oysters (= post-spat or 1+ year classes) in
each 5-mm size class was multiplied by the
average dry-meat weight (dmw) for that size
class to obtain the total weight for each size
grouping (Eq. 1). These were summed to get
the total dry-meat weight of a 1 bu sample
(two 0.5 bu subsamples) from a disease
monitoring bar (Eq. 2). The sum of dry-meat
weights from the 43 disease monitoring

9
stations, divided by 43, yielded an annual
average biomass value from the previous
year’s survey (Eq. 3). These annual average
biomass values were keyed to the biomass
value for 1993. The Biomass Index was
derived by dividing the year’s average
biomass value by the 1993 average biomass
value (1993 biomass index = 1.0) (Eq. 4).
Note that the baseline data are from the 1993
Fall Survey. In previous years the biomass
index year followed the year the data were
actually collected e.g. the 1994 baseline
biomass index was from the 1993 Fall
Survey. To avoid the confusion this caused,
in this report the biomass index refers to the
year the data were collected (survey year)
i.e. the 2012 biomass index is derived from
the 2012 Fall Survey data.
Equations
For each monitoring station:
1. (# post-spat oysters per size class) x
(avg. dmw per size class) = total
dmw per size class
2. ∑ dmw per size class = total dmw
per 1 bu station sample
For all monitoring stations:
3. (∑ dmw per1 bu station sample)/43 =
annual average biomass value
4. (annual average biomass
value)/(1993 average biomass value)
= Biomass Index
Statistical Framework
To provide a statistical framework for some
of the Annual Fall Survey data sets, a non-
parametric treatment, Friedman’s Two-Way
Rank Sum Test, was used (Hollander and
Wolfe 1973). This procedure, along with an
associated multiple-range test, allowed
among-year comparisons for several
parameters. Additionally, mean rank data
can be viewed as annual indices, thereby
allowing temporal patterns to emerge.
Friedman’s Two-Way Rank Sum Test, an
analog of the normal scores general Q
statistic (Hájek and Šidák 1967), is an
expansion of paired replicate tests (e.g.
Wilcoxon’s Signed Rank Test or Fisher’s
Sign Test). Friedman’s Test differs
substantively from a Two-Way ANOVA, in
that interactions between blocks and
treatments are not allowed by the
computational model (See Lehman 1963 for
a more general model that allows such
interactions). The lack of block-treatment
interaction terms is crucial in the application
of Friedman’s Test to the various sets of Fall
Survey oyster data, since it eliminates
nuisance effects associated with intrinsic,
site-specific characteristics. That is, since
rankings are assigned across treatments (in
this report - years), but rank summations are
made along blocks (oyster bars), intrinsic
differences among oyster bars are not an
element in the test result. All Friedman’s
Test results in this report were evaluated at α
= 0.05.
To quantify annual relationships, a
distribution-free multiple comparison
procedure, based on Friedman’s Rank Sum
Test, was used to produce the “tiers”
discussed in this report. Each tier consists of
a set of annual mean ranks that are
statistically similar to one another. This
procedure (McDonald and Thompson 1967)
is relatively robust, very efficient, and,
unlike many multiple comparison tests,
allows the results to be interpreted as
hypothesis tests. Multiple comparisons were
evaluated using “yardsticks” developed from
experimental error rates of α = 0.15.
Harvest Records
Two data sources are used to estimate
seasonal oyster harvests - dealer reports
(also called Buy Tickets) and harvester
reports. The volume of oysters in Maryland
bushels caught each day by each license
holder is reported to the Department of
Natural Resources on both forms (Appendix
2). Dealer reports are submitted weekly by
licensed dealers who buy oysters directly
from harvesters on the day of catch.
Reported on each buy ticket is the catch per
day along with effort information, gear type,
and location of catch. Both the dealer and
the harvester must sign the buy ticket and
include their license numbers. Each dealer is
also responsible for paying a one dollar per

10
bushel tax and an additional thirty cents tax
on each bushel exported. Harvester reports
are submitted monthly by each license
holder authorized to catch oysters and
include the catch each day along with effort
information, gear type, and location of
catch.
Buy ticket records are available from 1989
to present and harvester reports are available
from 2009 to present. Although the area or
river system was often recorded on buy
tickets for much of the time series, the
completeness of oyster bar- and gear-
specific information is much more variable.
Generally, harvester reports are more
complete with regard to gear type and oyster
bar name. Due to the longer time series
available from the buy ticket record, this is
the standard data source for long-term trends
in harvest. For applications where gear or
oyster bar name is considered critical, the
harvester report data source is often used
instead.
RESULTS FRESHWATER DISCHARGE
CONDITIONS
Salinity is a key quantifiable factor
influencing oyster reproduction and
recruitment, disease, and mortality. Whereas
salinity is a site-specific measurement which
varies widely throughout the Maryland
oyster grounds, freshwater flow, which
influences salinity, provides a more synoptic
view of baywide conditions and is therefore
used as a surrogate for salinity.
According to the U.S. Geological Survey,
2015 was considered to be a dry year, with
the annual streamflow into the Maryland
portion of Chesapeake Bay below the 25th
percentile over 78 years (Sec. “C” in Bue
1968). This is only the second year since the
1999-2002 drought that streamflows have
been below the normal range, and it follows
three consecutive years of near average
flows (USGS 2015). Annual streamflows in
eight of the past eleven years were within
the normal range, in contrast to the
sometimes extreme interannual variations in
streamflow witnessed during the 1990s and
early 2000s, including an extended drought
from 1999 to 2002 followed by near-record
high flows in 2003 and 2004 (Figure 2a).
Annual Streamflow Into Md. Chesapeake Bay
0
20,000
40,000
60,000
80,000
100,000
120,000
19
85
19
86
19
87
19
88
19
89
19
90
19
91
19
92
19
93
19
94
19
95
19
96
19
97
19
98
19
99
20
00
20
01
20
02
20
03
20
04
20
05
20
06
20
07
20
08
20
09
20
10
20
11
20
12
20
13
20
14
20
15D
isc
ha
rge
(c
ub
ic f
ee
t/s
ec
on
d)
Mean Monthly Flow Monthly Mean (1937-2015)
Figure 2a. Annual mean monthly freshwater flow
into Chesapeake Bay, 1985-2015. USGS Section C:
all Maryland tributaries and the Potomac River.
Below average monthly discharges, which
began in September 2014, persisted through
the following March (Figure 2b). Flows in
February were only 33% of the 71-year
mean for that month. For the year, nine of
twelve months had lower than mean
freshwater input. The primary exception to
this trend was during July, when flows were
2.5 times above average, but they fell off
steeply in August and by September were
only 55% of the mean.
2015 Monthly Streamflow into Md. Chesapeake Bay
0
20000
40000
60000
80000
100000
120000
140000
Jan Feb Mar Apr May Jun Jul Aug Sep Oct Nov Dec
Dis
ch
arg
e (
cu
ft/
se
c)
2015 71-yr Avg
Figure 2b. Monthly average freshwater flow into
Chesapeake Bay (Section C) during 2015,
including the long-term monthly average.
Monthly surface salinities, as seen in the
following two examples, reflect the
influence of streamflow to varying degrees

11
depending on location. As a consequence of
the low freshwater flows, salinities were
generally higher than average (CBP Data
Hub). At CB4.2C, a mid-bay station off the
mouth of the Choptank River, salinities over
the year varied by as much as 8.3 ppt
(Figure 4c). Salinities were above average
into April, then plunged in May after high
April flows. They remained below average
in July and August following a strong
freshwater pulse in July, then climbed
upward again, peaking at 17 ppt in
November. One important point is the
salinities were above 12 ppt for nine months,
five of which had salinities over 15 ppt,
which are critical minimum values for the
spread and virulence of MSX disease. On
average, the highest salinity for this station
is 15 ppt in October.
2015 Surface Salinity at CB4.2C - Mid-Bay
0
2
4
6
8
10
12
14
16
18
Jan Feb Mar Apr May Jun Jul Aug Sep Oct Nov Dec
Sa
lin
ity
(p
pt)
2015 Salinity Mean
Figure 2c. Monthly surface salinities during 2015
at Station CB4.2C in mid-Chesapeake Bay off the
mouth of the Choptank River.
The South Tangier Sound station (EE3.2)
experienced much lower intra-annual
variation in salinities, ranging from 16.2 ppt
to 19.9 ppt (Figure 4d). For the most part,
salinities remained above average save in
August and September, when they dipped
slightly as a result of July’s high flows.
2015 Surface Salinity at EE3.2 - S. Tangier Sound
0
5
10
15
20
25
Jan Feb Mar Apr May Jun Jul Aug Sep Oct Nov Dec
Sa
lin
ity
(p
pt)
2015 Sal. Mean
Figure 2d. Monthly surface salinities during 2015
at Station EE3.2 in south Tangier Sound.
SPATFALL INTENSITY
This was a mixed year for recruitment. The
2015 Spatfall Intensity Index, a measure of
recruitment success and potential increase of
the population, was 34.2 spat per bushel,
triple the previous year’s index and about
1.5 times the 31-year median index.
Although the 2015 spat index seems
favorable, over a third of the index is
attributable to a single bar, thus ranking it in
the same statistical tier as the 2014 index.
This is the third lowest statistical grouping
out of six for the period from 1985 to 2015
(Figure 3a).
Spatfall Intensity Index, 1985-2015
0
50
100
150
200
250
300
19
85
19
86
19
87
19
88
19
89
19
90
19
91
19
92
19
93
19
94
19
95
19
96
19
97
19
98
19
99
20
00
20
01
20
02
20
03
20
04
20
05
20
06
20
07
20
08
20
09
20
10
20
11
20
12
20
13
20
14
20
15
Sp
at/
Bu
sh
el
Tier 1 Tier 2 Tier 3 Tier 4 Tier 5 Tier 6 31-Yr Median
Figure 3a. Spatfall intensity (spat per bushel of
cultch) on Maryland “Key Bars” for spat
monitoring, including rankings of statistically
similar indices.
12
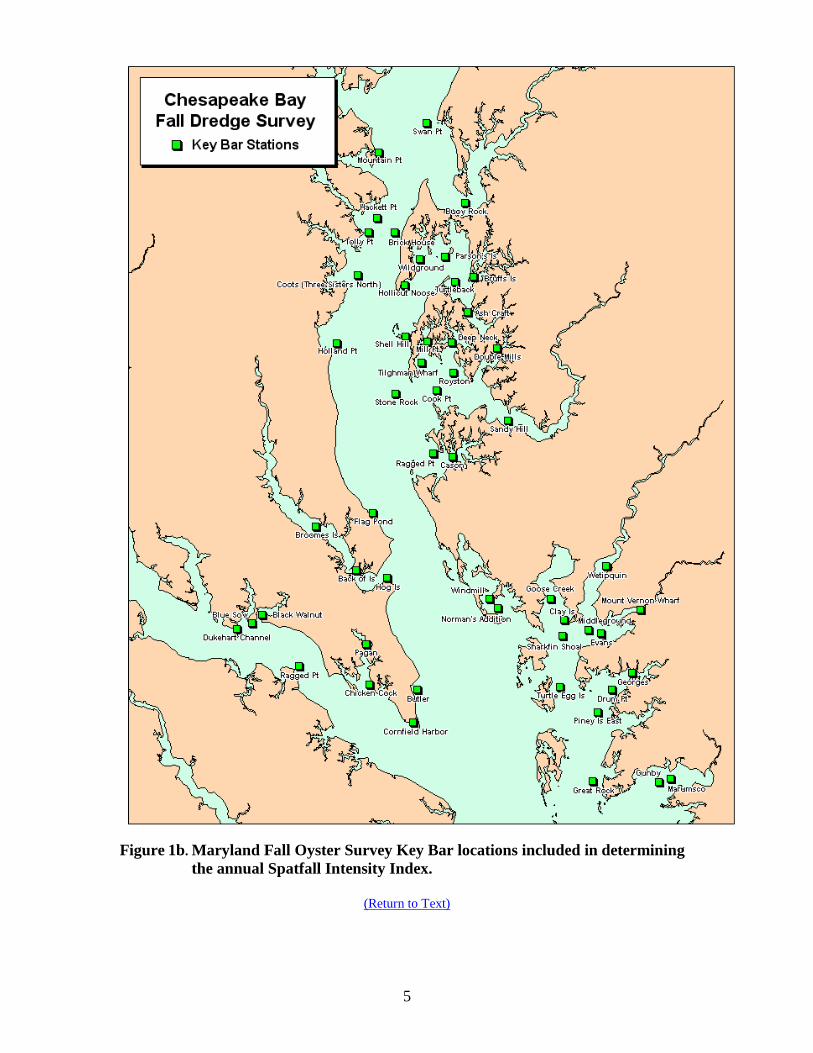
Two of the previous five years (2010, 2012)
have had strong year classes which boosted
the population and increased commercial
landings; the average 2013 and poor 2014
spatfalls may have implications for
population abundance, possibly leading to
declining harvests in the upcoming years
until the 2015 year class enters the fishery
(Figure 3b).
Maryland Spatfall Index, 1998-2015
0
10
20
30
40
50
60
70
80
90
19
98
19
99
20
00
20
01
20
02
20
03
20
04
20
05
20
06
20
07
20
08
20
09
20
10
20
11
20
12
20
13
20
14
20
15
Sp
at/
Bu
sh
el
Spat Index 31-Yr Median
Figure 3b. Recent Maryland spatfall indices, 1998-2015.
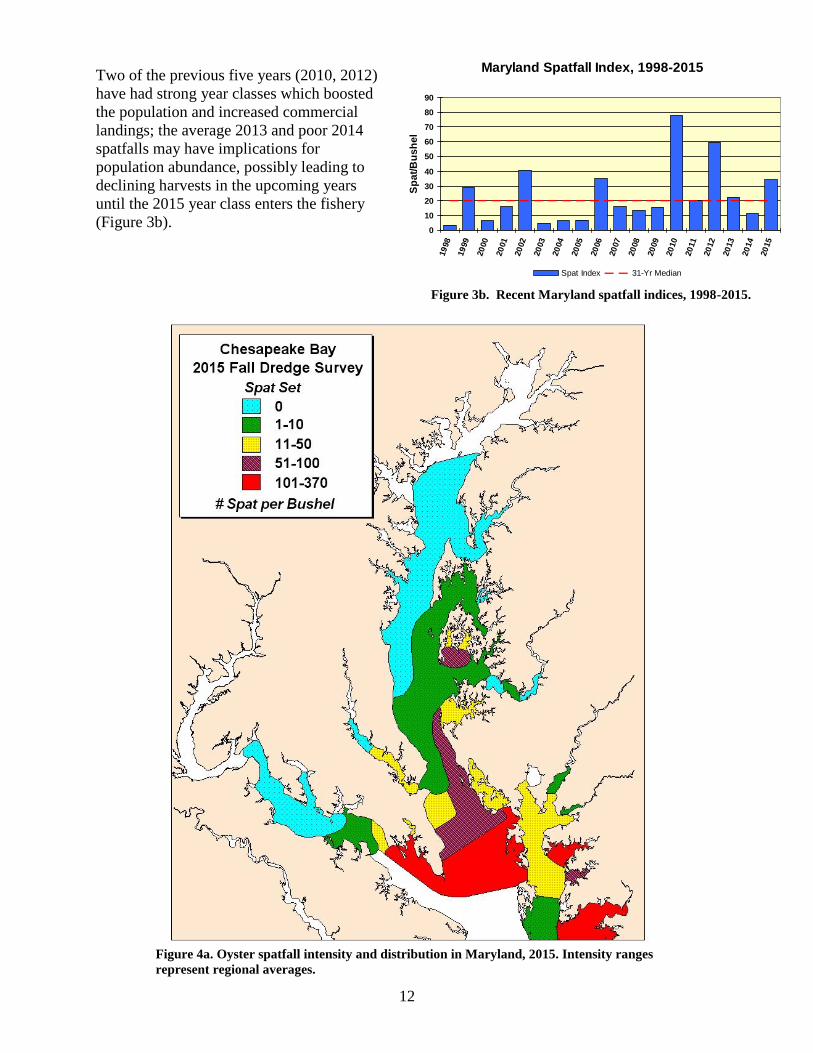
Figure 4a. Oyster spatfall intensity and distribution in Maryland, 2015. Intensity ranges
represent regional averages.

13
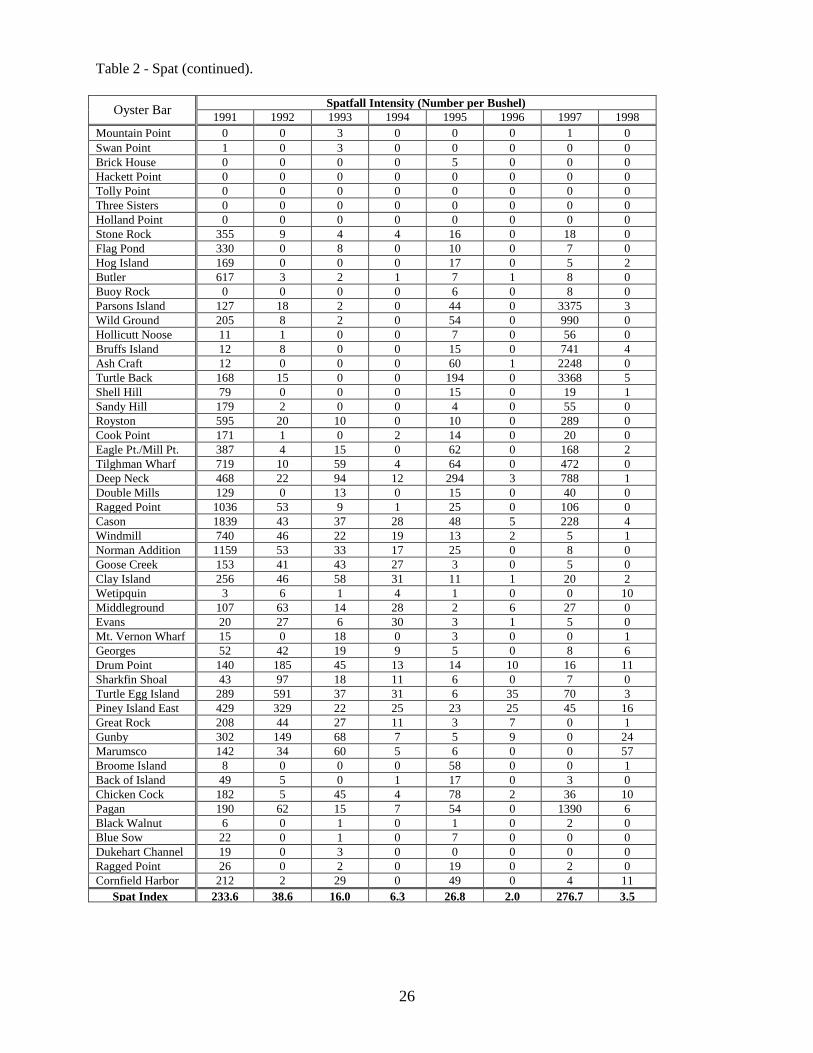
Spatfall was widely but unevenly distributed
among the Key Bars in 2015. Spat were
observed on 40 of the 53 Key Bars vs. 33
bars in 2013 (Table 2). However, only three
bars accounted for 53% of the index, with
mediocre counts on the remaining bars
having spat. Nine bars contributed 75% of
the spat index, while 23 sites were needed to
reach 95% of the spat index. Two of the top-
five Key Bars for spat counts in 2015 were
in the Lower Potomac region, including
Cornfield Harbor in the mouth of the
Potomac, and Chicken Cock in the St.
Marys River, which with 712 spat/bu. had
the highest Key Bar spat count (Table 2).
Two of the other top-five Key Bars were in
Pocomoke Sound (Marumsco, Gunby),
while the fifth was Deep Neck in Broad
Creek.
When considering all bars surveyed in
addition to the Key Bars, the heaviest
spatfall occurred in southern Maryland,
where the north shore of the lower Potomac
River experienced the best recruitment in
nearly a third of a century (Figure 4a,b).
Other high spat concentrations were found
in the lower mainstem of the bay, Pocomoke
Sound, and the Manokin River sanctuary.
However, spatfall was extremely patchy,
especially in Tangier Sound, where the
overall average was below normal despite
some high counts, ranging from 0 to 518
spat/bu (Figure 4c). Likewise, in the lower
Potomac region, the normally high
recruitment area of the upper St. Marys
River had below average spat sets, while
counts in the mouth of the river were
extraordinarily high (Figure 4b). The
Choptank River in the vicinity of Harris and
Broad creeks had a moderate spatfall;
otherwise recruitment was generally average
to poor upbay from about the Patuxent
River, with large expanses of the upper and
middle bay and upper Potomac River
receiving no spat whatsoever (Figure 4a).
A final comment on the annual Spatfall
Intensity Index: this index is an arithmetic
mean that does not take into account
geographic distribution, whereas the
statistical tiers do. For example, the near-
record high spatfall intensity in 1997 was
actually limited in extent, being
concentrated in the eastern portion of
Eastern Bay, the northeast portion of the
lower Choptank River, and to a lesser
extent, in parts of the Little Choptank and
St. Marys rivers (Homer & Scott 2001).
Over 75% of the 1997 index was accounted
for by only five of the 53 Key Bars, while
ten contributed nearly 95% (Table 2). As a
result, the 1997 spat index fell into the third
statistical tier despite being the second
highest index on record and an order of
magnitude higher than other Tier 3 indexes.
In contrast, the 1991 spatfall (the third
highest on record) was far more widespread.
Fifteen Key Bars comprised 75% of the
index that year, while 28 sites were needed
to attain 95% of the spatfall intensity index,
placing it in the first statistical tier
notwithstanding having a lower spatfall
index than 1997. The uneven spatfall
distribution accounts for the 2015 index
falling into the same statistical Tier 4 as the
2014 index, despite being three times as
high (Figure 3a).

14
Figure 4b. Spat counts per bushel at individual stations in the lower Potomac region, 2015.
Figure 4c. Spat counts per bushel at individual stations in the lower Tangier Sound region, 2015.

15
OYSTER DISEASES Dermo disease remained below long-term
average levels, continuing a trend that began
in 2003. Oysters at all but two of the
standard disease monitoring sites were
infected with Perkinsus marinus, the
parasite which causes dermo disease. Some
oyster populations, especially on bars from
the Choptank River and south, had elevated
intensities that may be cause for concern in
the future. MSX disease showed a
prevalence increase while expanding its
range upbay, reaching as far north as Eastern
Bay and the Miles River, although at very
low prevalences.
Dermo disease was detected in oysters on
95% of the Disease Bars (Table 3). The
overall mean infection prevalence in oysters
sampled on the Disease Bars was 61%, an
increase from 2014 (52%) and the highest
since 2007, but substantially below the
record-high 2002 mean prevalence of 94%,
ranking 2015 in the second lowest statistical
grouping for prevalence (Figure 5). Twelve
of the past thirteen years have had dermo
disease mean prevalences below the 26-year
average.
Dermo Disease Prevalence
0
10
20
30
40
50
60
70
80
90
100
19
90
19
91
19
92
19
93
19
94
19
95
19
96
19
97
19
98
19
99
20
00
20
01
20
02
20
03
20
04
20
05
20
06
20
07
20
08
20
09
20
10
20
11
20
12
20
13
20
14
20
15
Me
an
Pre
va
len
ce
(%
)
Rank Tier 1 Rank Tier 2 Rank Tier 3 Rank Tier 4 Rank Tier 5 26-Yr Avg Figure 5. Annual mean P. marinus prevalences
and statistical groupings from Maryland disease
monitoring bars.
The geographic distribution of high
prevalences (>60%) included the lower bay,
the Patuxent and St. Marys rivers on the
lower Western Shore, and all of the Eastern
Figure 6. Geographic extent and prevalence of
dermo disease in Maryland, 2015.
Shore tributaries from the Eastern Bay
region southward, including Tangier and
Pocomoke sounds (Figure 6). The only
disease monitoring bars where dermo
disease was not detected among tested
oysters were Ragged Point in the Potomac
River and Holland Point (n=7) on the mid-
Western Shore. Outside of the regular
disease monitoring sites, dermo disease was
detected at low levels (13% prevalence, 0.2
intensity) as far north as Deep Shoal, an
upper Bay bar heavily impacted by the 2011
freshets. In addition, oysters on Beacon bar
in the upper reaches of the Potomac River
oyster grounds have shown persistently low
levels of dermo disease (13% prevalence,
0.1 intensity) over the past four years, after
the disease was undetected there in 2011.

16
The 2015 annual mean infection intensity of
2.1 was somewhat higher than in 2014
(Table 3), but still within the second lowest
statistical grouping (of five tiers) for dermo
disease intensity (Figure 7). This is in
contrast to the record high 2001 mean
intensity of 3.8. The average intensity index
over the thirteen years since the end of the
1999-2002 drought is 1.9, similar to another
extended period of low to moderate dermo
disease levels from 1994 to 1998 when
annual mean infection intensities averaged
1.7. In comparison, the drought period of
1999-2002 had mean annual intensities that
averaged 3.4.
Dermo Disease Intensity
0.0
0.5
1.0
1.5
2.0
2.5
3.0
3.5
4.0
19
90
19
91
19
92
19
93
19
94
19
95
19
96
19
97
19
98
19
99
20
00
20
01
20
02
20
03
20
04
20
05
20
06
20
07
20
08
20
09
20
10
20
11
20
12
20
13
20
14
20
15
Me
an
In
ten
sit
y (
0-7
sc
ale
)
Rank Tier 1 Rank Tier 2 Rank Tier 3 Rank Tier 4 Rank Tier 5 26-Yr Avg Figure 7. Annual P. marinus infection intensities
on a scale of 0-7 in oysters from Maryland disease
monitoring bars. Rankings are based on
statistically similar years.
The frequency distributions of sample mean
infection intensities shifted somewhat in
2015, with an increase of the highest
intensity ranges from the previous year
(Figure 8).
Mean Dermo Disease Infections by Intensity Range
0%
20%
40%
60%
80%
100%
1990
1991
1992
1993
1994
1995
1996
1997
1998
1999
2000
2001
2002
2003
2004
2005
2006
2007
2008
2009
2010
2011
2012
2013
2014
2015
Pe
rce
nt
Fre
qu
en
cy
<1.0 1.0-<3.0 3.0-7.0 Figure 8. Perkinsus marinus infection intensity
ranges (percent frequency by range and year) in
oysters from Maryland disease monitoring bars.
In 2015, 26% of the Disease Bar samples
had mean infection intensities of less than
1.0, compared with 49% in 2011, the lowest
intensity year of the 25-year time series.
Twelve bars (28%) had mean intensities of
3.0 or greater and two bars (Stone Rock,
Turtle Back) were over 4.0. In contrast, 81%
of the dermo disease intensities were ≥3.0
and 51% were ≥4.0 during the peak
infection intensity year of 2001. Infection
intensities in individual oysters that are ≥5
on a 0–7 scale are considered lethal; such
infection intensities were detected in 17.8%
of oysters sampled in 2015, an increasing
trend from 2013 (14.8%) and 2014 (15.3%).
The highest mean intensities in 2015 were
scattered along the Eastern Shore from the
Miles River to Pocomoke Sound (Table 3).
MSX disease, resulting from the parasite
Haplosporidium nelsoni, is another
potentially devastating oyster disease. This
parasite can cause rapid mortality in oysters
and generally kills a wide range of year
classes, including younger oysters, over a
long seasonal period.
For the second consecutive year, MSX
disease showed an increase in prevalence
while expanding its range upbay, reaching
as far north as the Eastern Bay and the Miles
River. This was the furthest upbay MSX has
been detected since 2009 (Figure 9).
Haplosporidium nelsoni was detected at 25
(21%) of the Disease Bars, 2.5 times the
frequency of the previous year (Table 4). In
contrast, the parasite was found on 90% of
the bars in 2002. For the 43 disease
monitoring bars, the average percentage of
oysters infected with MSX disease was
7.0%, a tripling from 2014 (Figure 10, Table
4).
The abatement of MSX disease in 2003-
2004 signified the end of the most severe H.
nelsoni epizootic on record in Maryland
waters. The 2002 epizootic set record high
levels for both the frequency of affected
disease monitoring bars (90%) and the mean
annual prevalence within the oyster

17
Figure 9. Geographic expansion of MSX disease in Maryland waters between 2013 and 2015.
populations (28%), leaving in its wake
observed oyster mortalities approaching
60%. Since 1990, there have been four H.
nelsoni epizootics: 1991-92, 1995, 1999-
2002, and 2009, the first three associated
with spikes in observed mortalities (Figure
10).
MSX Disease vs. Oyster Mortalities
0
5
10
15
20
25
30
35
19
90
19
91
19
92
19
93
19
94
19
95
19
96
19
97
19
98
19
99
20
00
20
01
20
02
20
03
20
04
20
05
20
06
20
07
20
08
20
09
20
10
20
11
20
12
20
13
20
14
20
15
MS
X P
rev
ale
nc
e (
%)
0
10
20
30
40
50
60
Ob
se
rve
d M
ort
alt
iy (
%)
MSX Prev Obs Mort
Figure 10. Percentage of Maryland oysters with
MSX disease compared to annual means for
observed mortalities on the disease monitoring
bars from 1990-2015.
All four of these epizootics coincided with
dry years (Figure 2a). These were followed
closely by periods of unusually high
freshwater inputs into parts of Chesapeake
Bay, which resulted in the purging of H.
nelsoni infections from most Maryland
oyster populations (Homer & Scott 2001;
Tarnowski 2005, 2011). The current
increase in H. nelsoni infections is
associated with below normal streamflows
since the latter portion of 2014.
OBSERVED MORTALITY Despite an uptick in oyster mortalities, the
Mortality Index of 14% remained below the
31-year mean, continuing a 12-year trend as
a consequence of low to moderate disease
pressure (Table 5). For the 43 disease
monitoring bar subset, the average observed
mortality of 13.6% over the last 12 years
approaches the background mortality levels
of 10% or less found prior to the mid-1980s
disease epizootics (MDNR, unpubl. data).
Because of the increase, the 2015 observed
mortality on the Disease Bars was ranked in
the second lowest statistical grouping over
18
Total Observed Mortality
0
10
20
30
40
50
60
19
85
19
86
19
87
19
88
19
89
19
90
19
91
19
92
19
93
19
94
19
95
19
96
19
97
19
98
19
99
20
00
20
01
20
02
20
03
20
04
20
05
20
06
20
07
20
08
20
09
20
10
20
11
20
12
20
13
20
14
20
15
Ob
se
rve
d M
ort
ality
(%
)
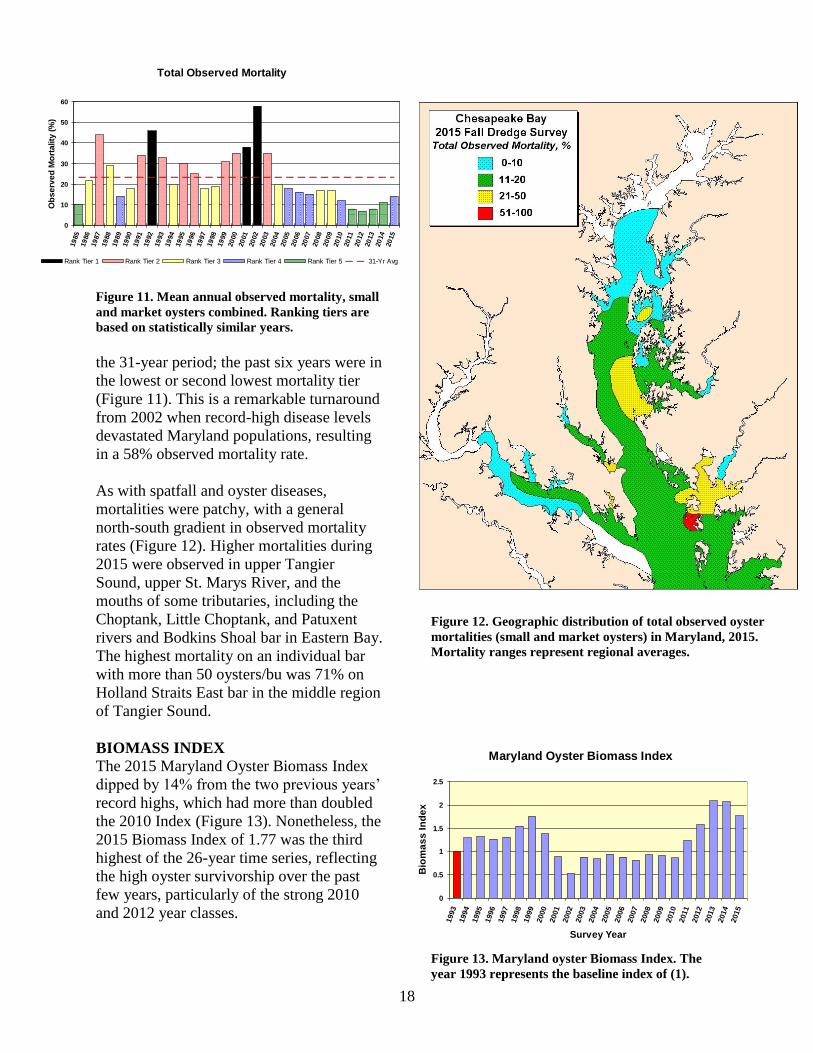
Rank Tier 1 Rank Tier 2 Rank Tier 3 Rank Tier 4 Rank Tier 5 31-Yr Avg Figure 11. Mean annual observed mortality, small
and market oysters combined. Ranking tiers are
based on statistically similar years.
the 31-year period; the past six years were in
the lowest or second lowest mortality tier
(Figure 11). This is a remarkable turnaround
from 2002 when record-high disease levels
devastated Maryland populations, resulting
in a 58% observed mortality rate.
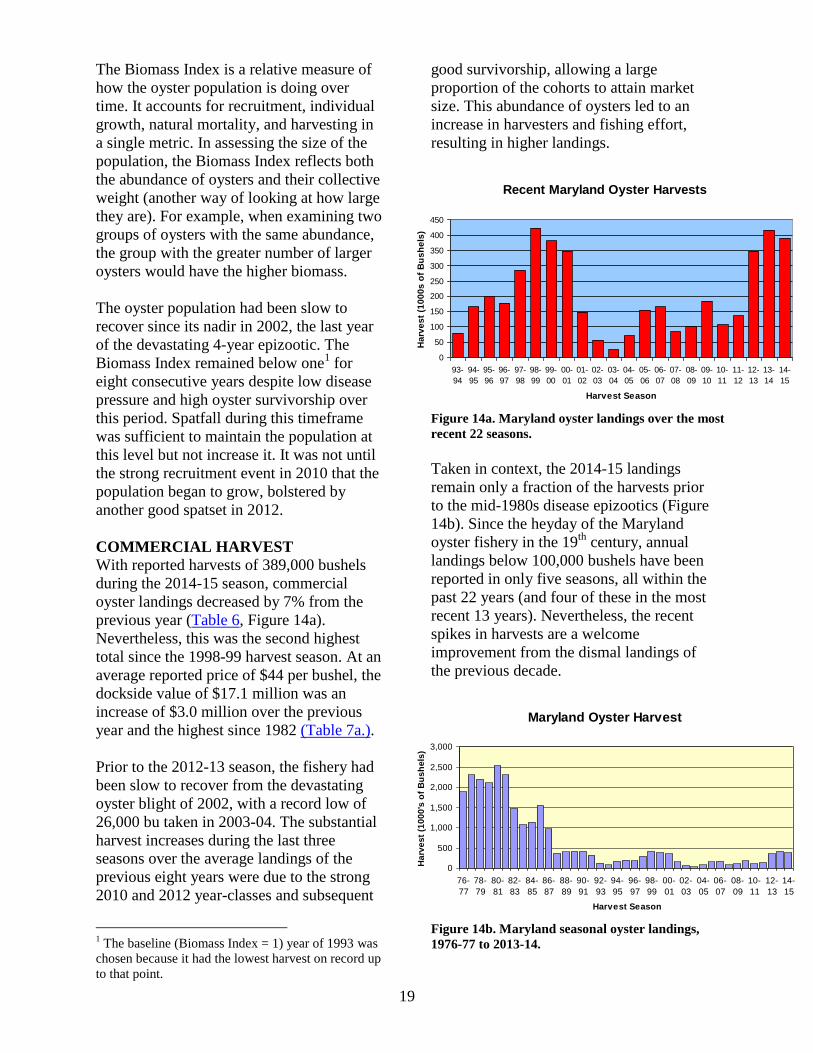
As with spatfall and oyster diseases,
mortalities were patchy, with a general
north-south gradient in observed mortality
rates (Figure 12). Higher mortalities during
2015 were observed in upper Tangier
Sound, upper St. Marys River, and the
mouths of some tributaries, including the
Choptank, Little Choptank, and Patuxent
rivers and Bodkins Shoal bar in Eastern Bay.
The highest mortality on an individual bar
with more than 50 oysters/bu was 71% on
Holland Straits East bar in the middle region
of Tangier Sound.
Figure 12. Geographic distribution of total observed oyster
mortalities (small and market oysters) in Maryland, 2015.
Mortality ranges represent regional averages.
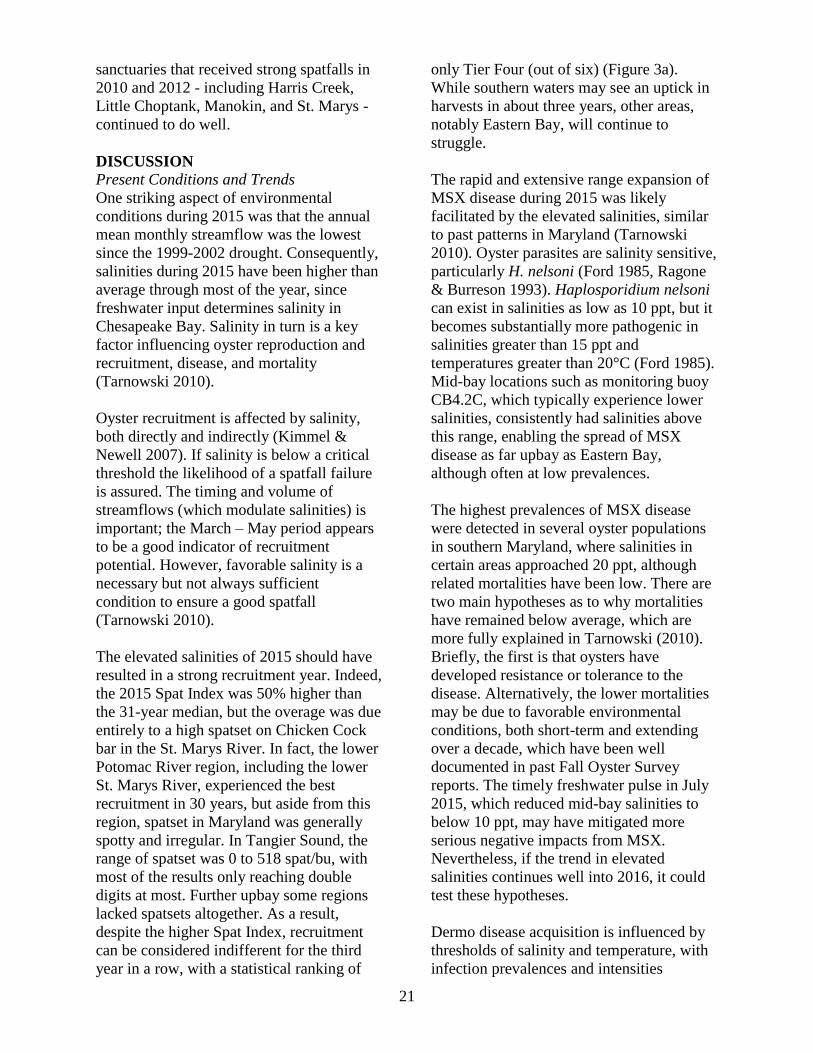
BIOMASS INDEX
The 2015 Maryland Oyster Biomass Index
dipped by 14% from the two previous years’
record highs, which had more than doubled
the 2010 Index (Figure 13). Nonetheless, the
2015 Biomass Index of 1.77 was the third
highest of the 26-year time series, reflecting
the high oyster survivorship over the past
few years, particularly of the strong 2010
and 2012 year classes.
Maryland Oyster Biomass Index
0
0.5
1
1.5
2
2.5
1993
1994
1995
1996
1997
1998
1999
2000
2001
2002
2003
2004
2005
2006
2007
2008
2009
2010
2011
2012
2013
2014
2015
Survey Year
Bio
ma
ss
In
de
x
Figure 13. Maryland oyster Biomass Index. The
year 1993 represents the baseline index of (1).
19
The Biomass Index is a relative measure of
how the oyster population is doing over
time. It accounts for recruitment, individual
growth, natural mortality, and harvesting in
a single metric. In assessing the size of the
population, the Biomass Index reflects both
the abundance of oysters and their collective
weight (another way of looking at how large
they are). For example, when examining two
groups of oysters with the same abundance,
the group with the greater number of larger
oysters would have the higher biomass.
The oyster population had been slow to
recover since its nadir in 2002, the last year
of the devastating 4-year epizootic. The
Biomass Index remained below one1 for
eight consecutive years despite low disease
pressure and high oyster survivorship over
this period. Spatfall during this timeframe
was sufficient to maintain the population at
this level but not increase it. It was not until
the strong recruitment event in 2010 that the
population began to grow, bolstered by
another good spatset in 2012.
COMMERCIAL HARVEST With reported harvests of 389,000 bushels
during the 2014-15 season, commercial
oyster landings decreased by 7% from the
previous year (Table 6, Figure 14a).
Nevertheless, this was the second highest
total since the 1998-99 harvest season. At an
average reported price of $44 per bushel, the
dockside value of $17.1 million was an
increase of $3.0 million over the previous
year and the highest since 1982 (Table 7a.).
Prior to the 2012-13 season, the fishery had
been slow to recover from the devastating
oyster blight of 2002, with a record low of
26,000 bu taken in 2003-04. The substantial
harvest increases during the last three
seasons over the average landings of the
previous eight years were due to the strong
2010 and 2012 year-classes and subsequent
1 The baseline (Biomass Index = 1) year of 1993 was
chosen because it had the lowest harvest on record up
to that point.
good survivorship, allowing a large
proportion of the cohorts to attain market
size. This abundance of oysters led to an
increase in harvesters and fishing effort,
resulting in higher landings.
Recent Maryland Oyster Harvests
0
50
100
150
200
250
300
350
400
450
93-
94
94-
95
95-
96
96-
97
97-
98
98-
99
99-
00
00-
01
01-
02
02-
03
03-
04
04-
05
05-
06
06-
07
07-
08
08-
09
09-
10
10-
11
11-
12
12-
13
13-
14
14-
15
Harvest Season
Ha
rve
st
(10
00
s o
f B
us
he
ls)
Figure 14a. Maryland oyster landings over the most
recent 22 seasons.
Taken in context, the 2014-15 landings
remain only a fraction of the harvests prior
to the mid-1980s disease epizootics (Figure
14b). Since the heyday of the Maryland
oyster fishery in the 19th
century, annual
landings below 100,000 bushels have been
reported in only five seasons, all within the
past 22 years (and four of these in the most
recent 13 years). Nevertheless, the recent
spikes in harvests are a welcome
improvement from the dismal landings of
the previous decade.
Maryland Oyster Harvest
0
500
1,000
1,500
2,000
2,500
3,000
76-
77
78-
79
80-
81
82-
83
84-
85
86-
87
88-
89
90-
91
92-
93
94-
95
96-
97
98-
99
00-
01
02-
03
04-
05
06-
07
08-
09
10-
11
12-
13
14-
15
Harvest Season
Ha
rve
st
(10
00
's o
f B
us
he
ls)
Figure 14b. Maryland seasonal oyster landings,
1976-77 to 2013-14.

20
Although the region’s share declined from
the previous season, the Tangier
Sound/Lower Mainstem region, including
the Nanticoke, Wicomico and Honga rivers,
Pocomoke Sound and Fishing Bay, was
again the dominant harvest area, accounting
for nearly 50% of the 2014-15 landings
(Table 6). Outside of Tangier Sound proper,
which contributed 20.3% of the landings, the
highest percentage of the harvests (16.1%)
came from Broad Creek, a tributary of the
Choptank River with a much smaller area.
The regions experiencing harvest increases
or decreases were almost evenly split, but
the losses in a given region were more
substantial than the gains. The most
substantial changes in Maryland landings
between the 2013-14 and 2014-15 seasons
were:
Tangier Sound
-decreased 24,224 bushels (-23%)
Fishing Bay
-decreased 22,855 bushels (-37%)
Pocomoke Sound
-decreased 15,081 bushels (-45%)
Broad Creek
-decreased 13,689 bushels (-18%)
Lower Choptank River
-increased 13,074 bushels (+101%)
Patuxent River
-increased 25,797 bushels (+129%)
The combined harvests in the Tangier Sound
region decreased by 55,631 bushels or
23.5%. The northern portion of the
mainstem and associated tributaries
continued to perform poorly due to a lack of
recruitment and repletion activity. For
example, the combined percentage of
landings from the upper bay and Chester
River, which in some years accounted for
over half of Maryland’s total landings, was a
mere 1.1% (Table 6).
For the seventh consecutive season, power
dredging was the predominant method of
harvesting, accounting for 42% of the total
landings, a sharp decline from the previous
year (Table 7b). This activity was mainly in
the Lower Eastern Shore and Choptank
regions. Hand tonging remained at 16% of
the total harvests, primarily from Broad
Creek, though still well below 74% of the
landings during the 1996-97 season. Patent
tonging showed a strong increase to 27% of
the total, while sail dredging and diving
trailed with single-digit percentages.
OYSTER SANCTUARIES
A total of 87 oyster bars within 33
sanctuaries were sampled during 2015 the
Fall Survey (Table 8). Recruitment within
sanctuaries generally followed the same
pattern as adjacent harvest areas. The mean
spatfall in the Manokin Sanctuary was
higher than in the adjacent Tangier Sound,
averaging 121 spat/bu despite relatively low
counts on its two Key Bars (Figure 4, Table
2), and with a high count of 350 spat/bu on
Marshy Island bar. This compares with 71
spat/bu in the open harvest area of Tangier
Sound. Dermo disease levels in most of the
sanctuaries increased somewhat from 2014
(Table 3). Of the 13 Disease Bars within
oyster sanctuaries, dermo disease
prevalences increased at eight bars and were
above the 26-year average at six bars;
intensities increased at 9 bars and were
above the 26-year average at six bars. Most
of the increases were modest, with a few
exceptions (e.g. Bruffs Island, Sandy Hill,
Oyster Shell Point). MSX disease was
detected at only five of the Disease Index
Bars within sanctuaries (Table 4), as well as
three non-Index bars in sanctuaries. In two
of the three sanctuary/restoration areas,
Harris Creek and the Tred Avon River, there
was no evidence of MSX. It was found at
low prevalence in Broad Creek, which is an
open harvest tributary located between those
two sanctuaries. MSX was detected at an
elevated prevalence level in the Little
Choptank River, the third of the
sanctuary/restoration areas. Mortality rates
for the most part continue to be well below
the long-term averages (Table 5), including
in the Manokin River sanctuary, where
anecdotal reports of high oyster mortalities
were not confirmed. Overall, oysters in
21
sanctuaries that received strong spatfalls in
2010 and 2012 - including Harris Creek,
Little Choptank, Manokin, and St. Marys -
continued to do well.
DISCUSSION
Present Conditions and Trends
One striking aspect of environmental
conditions during 2015 was that the annual
mean monthly streamflow was the lowest
since the 1999-2002 drought. Consequently,
salinities during 2015 have been higher than
average through most of the year, since
freshwater input determines salinity in
Chesapeake Bay. Salinity in turn is a key
factor influencing oyster reproduction and
recruitment, disease, and mortality
(Tarnowski 2010).
Oyster recruitment is affected by salinity,
both directly and indirectly (Kimmel &
Newell 2007). If salinity is below a critical
threshold the likelihood of a spatfall failure
is assured. The timing and volume of
streamflows (which modulate salinities) is
important; the March – May period appears
to be a good indicator of recruitment
potential. However, favorable salinity is a
necessary but not always sufficient
condition to ensure a good spatfall
(Tarnowski 2010).
The elevated salinities of 2015 should have
resulted in a strong recruitment year. Indeed,
the 2015 Spat Index was 50% higher than
the 31-year median, but the overage was due
entirely to a high spatset on Chicken Cock
bar in the St. Marys River. In fact, the lower
Potomac River region, including the lower
St. Marys River, experienced the best
recruitment in 30 years, but aside from this
region, spatset in Maryland was generally
spotty and irregular. In Tangier Sound, the
range of spatset was 0 to 518 spat/bu, with
most of the results only reaching double
digits at most. Further upbay some regions
lacked spatsets altogether. As a result,
despite the higher Spat Index, recruitment
can be considered indifferent for the third
year in a row, with a statistical ranking of
only Tier Four (out of six) (Figure 3a).
While southern waters may see an uptick in
harvests in about three years, other areas,
notably Eastern Bay, will continue to
struggle.
The rapid and extensive range expansion of
MSX disease during 2015 was likely
facilitated by the elevated salinities, similar
to past patterns in Maryland (Tarnowski
2010). Oyster parasites are salinity sensitive,
particularly H. nelsoni (Ford 1985, Ragone
& Burreson 1993). Haplosporidium nelsoni
can exist in salinities as low as 10 ppt, but it
becomes substantially more pathogenic in
salinities greater than 15 ppt and
temperatures greater than 20°C (Ford 1985).
Mid-bay locations such as monitoring buoy
CB4.2C, which typically experience lower
salinities, consistently had salinities above
this range, enabling the spread of MSX
disease as far upbay as Eastern Bay,
although often at low prevalences.
The highest prevalences of MSX disease
were detected in several oyster populations
in southern Maryland, where salinities in
certain areas approached 20 ppt, although
related mortalities have been low. There are
two main hypotheses as to why mortalities
have remained below average, which are
more fully explained in Tarnowski (2010).
Briefly, the first is that oysters have
developed resistance or tolerance to the
disease. Alternatively, the lower mortalities
may be due to favorable environmental
conditions, both short-term and extending
over a decade, which have been well
documented in past Fall Oyster Survey
reports. The timely freshwater pulse in July
2015, which reduced mid-bay salinities to
below 10 ppt, may have mitigated more
serious negative impacts from MSX.
Nevertheless, if the trend in elevated
salinities continues well into 2016, it could
test these hypotheses.
Dermo disease acquisition is influenced by
thresholds of salinity and temperature, with
infection prevalences and intensities

22
typically rising with increases in these
conditions (McCollough et al. 2007). While
dermo disease is considered enzootic in
Chesapeake Bay, not all infections are lethal
or progress to lethal intensities.
Environmental conditions mitigate or
promote infection intensities. Increasing
salinities and temperatures create favorable
conditions for infection intensification,
particularly in areas where otherwise
typically lower salinities hold the progress
of the disease in check. Both the percentage
of moderate to high infection intensities and
the percentage of lethal infections increased
in 2015. The sample collected from Stone
Rock exhibited the highest mean infection
intensity on record (Table 3). Should higher
salinities persist into the summer of 2016, P.
marinus may contribute significantly to
oyster mortality throughout the bay. Those
populations in higher salinity areas may well
experience twin stresses from both dermo
and MSX disease combined.
The positive trend in the Chesapeake oyster
populations over the past dozen years likely
can be attributed to the generally favorable
salinities during this period. The record-high
disease-related mortalities at the turn of the
millennium subsided during the high
streamflow years of 2003-2004, dropping to
pre-disease levels and has remained below
the long-term average up to the present
(Figure 11, Table 5). This allowed oyster
stocks to rebuild, slowly during the first few
years then explosively, driven by strong year
classes in 2010 and 2012 (Figure 13). The
resulting increase in landings is likely short-
lived due to indifferent spatsets following
2012 and a downturn is expected
(Tarnowski 2015).
As already mentioned, one of the most
critical physical factors influencing oyster
populations is salinity. But salinity is
dependent on highly variable circumstances,
including the frequency, intensity and timing
of storm systems as well as accumulated
snowpack and the rate at which it melts.
Therefore, offering reliable predictions
about recruitment and disease-related
mortality become more difficult the further
into the future a projection is made. An
additional complication is the variety of
other factors, some probably unknown, that
can account for successful recruitment when
salinities are adequate (Tarnowski 2010).
The relationship between salinity and oyster
diseases is more straightforward, but a
random event such as a well-timed tropical
storm can lower salinities over a brief
duration, lessening disease pressure on the
oyster populations. Because of the highly
variable nature of the conditions influencing
these key population properties, the ability
to predict them dwindles to nil over a
relatively short period into the future.
A key role of the Fall Oyster Survey and
associated reports such as this is to gather
and disseminate data about Maryland’s
oyster populations for informed, timely, and
proactive management decisions. For
example, based on the findings from the
2015 Survey, the Potomac River Fisheries
Commission shut down the lower Potomac
fishery to protect the exceptional spatset that
year from dredging-related mortality. But no
survey can predict what the future may
bring, whether an abundance of oysters to
harvest in a few years or a disease-ravaged
population. This will be left to the vagaries
of nature.
LITERATURE CITED
Bue, C.D. 1968. Monthly surface-water
inflow to Chesapeake Bay: U.S. Geological
Survey Open-File Report, Arlington, Va.,
October 1968, 45 pp.
Chesapeake Bay Program Data Hub. CBP
Water Quality Database (1984-present).
http://www.chesapeakebay.net/data
Ford, S.E. 1985. Effects of salinity on
survival of the MSX parasite
Haplosporidium nelsoni (Haskin, Stauber,
and Mackin) in oysters. J. Shellfish Res. 5:
85-90.

23
Ford, S. and M.R. Tripp. 1996. Chapter 17.
Diseases and defense mechanisms. In: V.S.
Kennedy, R.I.E. Newell, and A.F. Eble
(eds.). The Eastern Oyster, Crassostrea
virginica, p. 581-660. Md. Sea Grant Publ.
UM-SG-TS-96-01. College Park, Md.
Gieseker, C.M. 2001. Year 2000 Maryland
Oyster Disease Status Report. MDNR,
Cooperative Oxford Lab. FS-SCOL-01-1.
Oxford, Md. 27 pp.
Hájek, J. and Z. Šidák. 1967. Theory of
Rank Tests. Academic Press, New York.
Hollander, M. and D.A. Wolfe. 1973.
Nonparametric Statistical Methods. John
Wiley and Sons, New York, N.Y.
Homer, M. and R. Scott. 2001. Maryland
Oyster Population Status Report. 1996-2000
Fall Surveys. Md. Dept. of Natural
Resources, Annapolis, Md.
Jordan, S.J., K.N. Greenhawk, C.B.
McCollough, J. Vanisko, and M.L. Homer.
2002. Oyster biomass, abundance, and
harvest in northern Chesapeake Bay: Trends
and forecasts. J. Shellfish Res. 21: 733-741.
Kimmel, D. G., and R. I. E. Newell. 2007.
The influence of climate variation on eastern
oyster (Crassostrea virginica) juvenile
abundance in Chesapeake Bay. Limnology
and Oceanography. 52: 959-965.
Krantz, G.E. and D.W. Webster. 1980.
Maryland Oyster Spat Survey – Fall 1979.
Md. Sea Grant Prog. Tech. Rept. No. UM-
SG-TS-80-01. College Park, Md.
Lehman, E.L. 1963. Asymptotically
nonparametric inference in some linear
models with one observation per cell. Ann.
Math. Statist. 34: 1494-1506.
McCollough, C. B., B. W. Albright, G. R.
Abbe, L. S. Barker & C. F. Dungan. 2007.
Acquisition and progression of Perkinsus
marinus infections by specific-pathogen-free
juvenile oysters (Crassostrea virginica
Gmelin) in a mesohaline Chesapeake Bay
tributary. J. Shellfish Res. 26:465–477.
McDonald, B.J. and W.A. Thompson, Jr.
1967. Rank sum multiple comparisons in
one- and two-way classifications.
Biometrika. 54: 487-497.
Ragone, L.M. and E.M. Burreson. 1993.
Effect of salinity on infection progression
and pathogenicity of Perkinsus marinus in
the eastern oyster, Crassostrea virginica
(Gmelin). J. Shellfish Res. 12: 1-7.
Tarnowski, M. 2005. Maryland Oyster
Population Status Report – 2003 and 2004
Fall Surveys. MDNR Publ. No. 17-
1072005-62. Annapolis, Md. 33 pp.
http://dnr.maryland.gov/fisheries/Pages/shell
fish-monitoring/reports.aspx
Tarnowski, M. 2010. Maryland Oyster
Population Status Report – 2009 Fall
Survey. MDNR Publ. No. 17-8172010-471.
Annapolis, Md. 43 pp.
http://dnr.maryland.gov/fisheries/Pages/shell
fish-monitoring/reports.aspx
Tarnowski, M. 2011. Maryland Oyster
Population Status Report – 2010 Fall
Survey. MDNR Publ. No. 17-7292011-517.
Annapolis, Md. 47 pp.
http://dnr.maryland.gov/fisheries/Pages/shell
fish-monitoring/reports.aspx
Tarnowski, M. 2015. Maryland Oyster
Population Status Report – 2014 Fall
Survey. MDNR Publ. No. 17-782015-769.
Annapolis, Md. 68 pp.
http://dnr.maryland.gov/fisheries/Pages/shell
fish-monitoring/reports.aspx
USGS. 2015. Estimated streamflow entering
Chesapeake Bay above selected cross
sections. United States Geological Survey
Inflow Database.
http://md.water.usgs.gov/waterdata/chesinfl
ow/
24
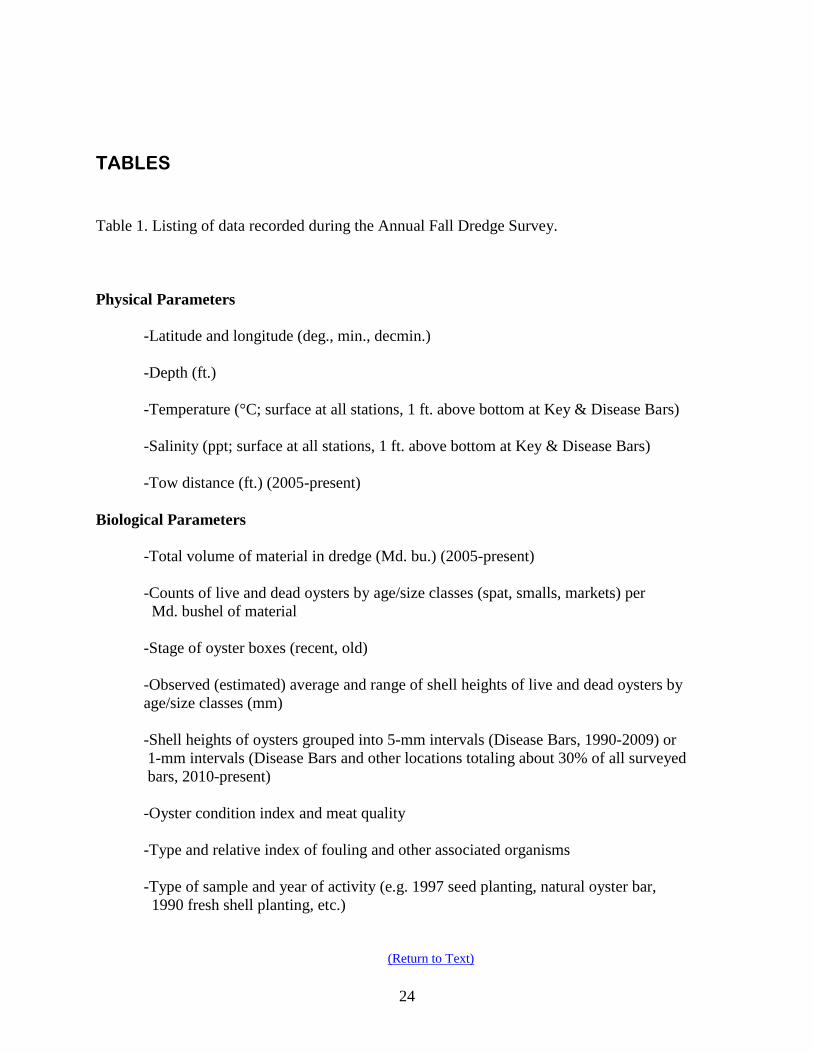
TABLES Table 1. Listing of data recorded during the Annual Fall Dredge Survey.
Physical Parameters
-Latitude and longitude (deg., min., decmin.)
-Depth (ft.)
-Temperature (°C; surface at all stations, 1 ft. above bottom at Key & Disease Bars)
-Salinity (ppt; surface at all stations, 1 ft. above bottom at Key & Disease Bars)
-Tow distance (ft.) (2005-present)
Biological Parameters
-Total volume of material in dredge (Md. bu.) (2005-present)
-Counts of live and dead oysters by age/size classes (spat, smalls, markets) per
Md. bushel of material
-Stage of oyster boxes (recent, old)
-Observed (estimated) average and range of shell heights of live and dead oysters by
age/size classes (mm)
-Shell heights of oysters grouped into 5-mm intervals (Disease Bars, 1990-2009) or
1-mm intervals (Disease Bars and other locations totaling about 30% of all surveyed
bars, 2010-present)
-Oyster condition index and meat quality
-Type and relative index of fouling and other associated organisms
-Type of sample and year of activity (e.g. 1997 seed planting, natural oyster bar,
1990 fresh shell planting, etc.)
(Return to Text)

25
Table 2. Spatfall intensity (spat per bushel of cultch) from the 53 “Key” spat monitoring bars, 1985-2015.
Region Oyster Bar Spatfall Intensity (Number per Bushel)
1985 1986 1987 1988 1989 1990
Upper Bay Mountain Point 6 0 0 0 0 0
Swan Point 4 0 2 2 0 0
Middle Bay
Brick House 78 0 4 8 0 3
Hackett Point 0 4 0 0 0 0
Tolly Point 2 2 2 0 0 0
Three Sisters 10 2 8 0 0 0
Holland Point 6 5 0 0 0 0
Stone Rock 136 20 0 50 22 37
Flag Pond 52 144 128 0 0 4
Lower Bay Hog Island 116 32 58 29 4 7
Butler nd 197 142 16 2 24
Chester River Buoy Rock 16 0 6 0 0 1
Eastern Bay
Parsons Island 78 4 4 2 0 7
Wild Ground 46 8 4 8 0 18
Hollicutt Noose 24 8 12 6 0 2
Wye River Bruffs Island 82 0 0 2 0 2
Miles River Ash Craft 10 2 0 10 0 2
Turtle Back 382 40 12 52 6 11
Poplar I. Narrows Shell Hill 50 6 0 6 0 48
Choptank River
Sandy Hill 74 16 2 0 0 28
Royston 440 8 8 0 0 57
Cook Point 66 82 4 28 0 17
Harris Creek Eagle Pt./Mill Pt. 258 92 2 6 6 18
Tilghman Wharf 156 28 38 4 4 109
Broad Creek Deep Neck 566 114 6 22 4 48
Tred Avon River Double Mills 332 24 2 0 0 1
Little Choptank R. Ragged Point 134 82 34 112 0 65
Cason 102 24 46 50 0 143
Honga River Windmill 34 112 28 22 16 155
Norman Addition 56 214 38 17 34 82
Fishing Bay Goose Creek 34 97 16 18 4 4
Clay Island 4 78 14 48 18 19
Nanticoke River
Wetipquin 34 10 0 0 0 3
Middleground 8 12 26 9 16 40
Evans 18 10 12 17 2 13
Wicomico River Mt. Vernon Wharf nd 0 0 0 0 0
Manokin River Georges 26 98 14 4 16 4
Drum Point 48 186 48 90 78 16
Tangier Sound
Sharkfin Shoal 18 44 22 24 2 16
Turtle Egg Island 154 90 12 26 26 204
Piney Island East 182 192 194 160 82 64
Great Rock 2 6 4 6 10 66
Pocomoke Sound Gunby 124 24 50 4 8 21
Marumsco 26 50 18 5 12 6
Patuxent River Broome Island 15 0 0 0 0 3
Back of Island 42 0 8 4 4 15
St. Mary’s River Chicken Cock 620 298 96 62 18 29
Pagan 140 34 52 36 6 613
Breton Bay Black Walnut 16 12 0 0 0 1
Blue Sow 55 40 0 0 0 1
St. Clement Bay Dukehart Channel 20 7 0 0 0 1
Potomac River Ragged Point 69 35 4 0 0 2
Cornfield Harbor 383 908 362 28 14 36
Spat Index 103.8 66.1 29.1 18.7 7.8 39.0
26
Table 2 - Spat (continued).
Oyster Bar Spatfall Intensity (Number per Bushel)
1991 1992 1993 1994 1995 1996 1997 1998
Mountain Point 0 0 3 0 0 0 1 0
Swan Point 1 0 3 0 0 0 0 0
Brick House 0 0 0 0 5 0 0 0
Hackett Point 0 0 0 0 0 0 0 0
Tolly Point 0 0 0 0 0 0 0 0
Three Sisters 0 0 0 0 0 0 0 0
Holland Point 0 0 0 0 0 0 0 0
Stone Rock 355 9 4 4 16 0 18 0
Flag Pond 330 0 8 0 10 0 7 0
Hog Island 169 0 0 0 17 0 5 2
Butler 617 3 2 1 7 1 8 0
Buoy Rock 0 0 0 0 6 0 8 0
Parsons Island 127 18 2 0 44 0 3375 3
Wild Ground 205 8 2 0 54 0 990 0
Hollicutt Noose 11 1 0 0 7 0 56 0
Bruffs Island 12 8 0 0 15 0 741 4
Ash Craft 12 0 0 0 60 1 2248 0
Turtle Back 168 15 0 0 194 0 3368 5
Shell Hill 79 0 0 0 15 0 19 1
Sandy Hill 179 2 0 0 4 0 55 0
Royston 595 20 10 0 10 0 289 0
Cook Point 171 1 0 2 14 0 20 0
Eagle Pt./Mill Pt. 387 4 15 0 62 0 168 2
Tilghman Wharf 719 10 59 4 64 0 472 0
Deep Neck 468 22 94 12 294 3 788 1
Double Mills 129 0 13 0 15 0 40 0
Ragged Point 1036 53 9 1 25 0 106 0
Cason 1839 43 37 28 48 5 228 4
Windmill 740 46 22 19 13 2 5 1
Norman Addition 1159 53 33 17 25 0 8 0
Goose Creek 153 41 43 27 3 0 5 0
Clay Island 256 46 58 31 11 1 20 2
Wetipquin 3 6 1 4 1 0 0 10
Middleground 107 63 14 28 2 6 27 0
Evans 20 27 6 30 3 1 5 0
Mt. Vernon Wharf 15 0 18 0 3 0 0 1
Georges 52 42 19 9 5 0 8 6
Drum Point 140 185 45 13 14 10 16 11
Sharkfin Shoal 43 97 18 11 6 0 7 0
Turtle Egg Island 289 591 37 31 6 35 70 3
Piney Island East 429 329 22 25 23 25 45 16
Great Rock 208 44 27 11 3 7 0 1
Gunby 302 149 68 7 5 9 0 24
Marumsco 142 34 60 5 6 0 0 57
Broome Island 8 0 0 0 58 0 0 1
Back of Island 49 5 0 1 17 0 3 0
Chicken Cock 182 5 45 4 78 2 36 10
Pagan 190 62 15 7 54 0 1390 6
Black Walnut 6 0 1 0 1 0 2 0
Blue Sow 22 0 1 0 7 0 0 0
Dukehart Channel 19 0 3 0 0 0 0 0
Ragged Point 26 0 2 0 19 0 2 0
Cornfield Harbor 212 2 29 0 49 0 4 11
Spat Index 233.6 38.6 16.0 6.3 26.8 2.0 276.7 3.5

27
Table 2 - Spat (continued).
Oyster Bar Spatfall Intensity (Number per Bushel)
1999 2000 2001 2002 2003 2004 2005 2006
Mountain Point 0 0 0 1 0 0 0 0
Swan Point 0 0 0 0 0 0 0 0
Brick House 1 1 3 97 0 0 0 0
Hackett Point 0 1 0 13 0 0 0 0
Tolly Point 2 2 1 10 0 0 0 0
Three Sisters 0 0 1 0 0 0 0 0
Holland Point 0 0 1 4 0 0 0 0
Stone Rock 3 34 2 17 1 0 0 3
Flag Pond 1 5 5 7 0 0 0 4
Hog Island 6 1 28 10 5 1 6 1
Butler 6 1 27 33 3 0 3 7
Buoy Rock 0 0 2 1 1 1 0 0
Parsons Island 6 6 6 5 2 0 3 0
Wild Ground 2 5 5 6 4 0 1 0
Hollicutt Noose 6 2 1 15 3 0 0 0
Bruffs Island 5 9 6 0 4 0 0 0
Ash Craft 14 2 10 0 8 0 0 0
Turtle Back 13 4 45 9 72 1 5 0
Shell Hill 4 4 0 0 0 0 0 0
Sandy Hill 4 0 1 1 0 2 0 5
Royston 39 0 3 10 0 14 0 44
Cook Point 1 5 5 3 1 4 0 9
Eagle Pt./Mill Pt. 16 0 5 4 1 12 0 19
Tilghman Wharf 49 1 1 4 0 15 0 22
Deep Neck 211 3 11 31 1 167 0 30
Double Mills 1 0 0 0 0 3 0 3
Ragged Point 43 3 5 0 1 2 0 6
Cason 53 5 2 9 1 5 1 93
Windmill 37 0 21 9 0 0 0 21
Norman Addition 31 1 30 33 2 0 6 80
Goose Creek 0 0 0 1 0 0 0 73
Clay Island 5 4 8 16 0 0 0 139
Wetipquin 0 0 0 3 1 0 0 6
Middleground 9 1 0 14 0 0 1 54
Evans 1 0 0 12 0 1 0 13
Mt. Vernon Wharf 0 0 0 0 0 0 0 0
Georges 50 6 1 280 15 4 5 75
Drum Point 157 27 44 124 13 8 40 202
Sharkfin Shoal 9 5 0 57 0 2 4 63
Turtle Egg Island 180 33 33 207 25 7 90 181
Piney Island East 118 28 167 127 1 27 116 420
Great Rock 82 6 140 1 3 19 28 92
Gunby 54 32 6 108 0 29 24 36
Marumsco 27 27 4 89 0 14 11 22
Broome Island 7 0 1 15 1 0 3 4
Back of Island 22 9 44 27 11 0 0 1
Chicken Cock 132 16 12 151 56 2 2 6
Pagan 95 42 117 535 9 6 10 125
Black Walnut 3 0 1 2 0 0 0 0
Blue Sow 11 0 2 4 1 0 0 0
Dukehart Channel 1 0 0 1 0 0 0 1
Ragged Point 1 1 0 1 0 0 0 1
Cornfield Harbor 25 5 35 31 9 0 8 6
Spat Index 29.1 6.4 15.9 40.3 4.8 6.5 6.9 35.2

28
Table 2 - Spat (continued).
Oyster Bar Spatfall Intensity (Number per Bushel)
2007 2008 2009 2010 2011 2012 2013 2014
Mountain Point 0 0 0 0 0 0 0 0
Swan Point 0 0 0 0 0 1 0 0
Brick House 0 0 6 4 1 7 0 0
Hackett Point 0 0 0 5 0 0 0 1
Tolly Point 0 0 0 2 0 1 0 0
Three Sisters 0 0 0 3 0 0 0 0
Holland Point 0 0 0 1 0 0 0 0
Stone Rock 0 1 4 22 1 46 2 1
Flag Pond 0 0 0 15 4 8 2 6
Hog Island 1 1 4 4 8 42 11 3
Butler 1 8 1 15 3 7 0 14
Buoy Rock 0 0 0 3 0 1 0 0
Parsons Island 0 0 8 2 0 13 0 1
Wild Ground 0 1 1 3 0 7 0 2
Hollicutt Noose 0 0 0 5 0 8 0 0
Bruffs Island 0 0 0 3 0 18 0 0
Ash Craft 0 0 2 39 0 1 3 0
Turtle Back 0 0 13 13 0 16 1 1
Shell Hill 0 0 0 1 0 4 0 0
Sandy Hill 3 1 5 5 0 6 1 1
Royston 2 5 20 27 0 46 9 19
Cook Point 1 10 18 37 2 41 6 1
Eagle Pt./Mill Pt. 0 2 17 44 0 29 4 1
Tilghman Wharf 0 6 15 72 0 183 20 46
Deep Neck 1 23 100 144 1 331 14 9
Double Mills 1 3 11 4 0 5 2 1
Ragged Point 0 2 12 33 0 14 5 2
Cason 0 13 9 50 0 65 14 4
Windmill 4 79 7 85 12 88 114 19
Norman Addition 0 102 6 155 27 138 145 38
Goose Creek 0 35 20 75 83 98 128 8
Clay Island 1 94 29 342 26 103 56 6
Wetipquin 0 2 2 8 4 8 5 22
Middleground 0 21 6 92 23 78 59 7
Evans 0 14 9 27 10 98 3 1
Mt. Vernon Wharf 0 0 8 2 4 16 0 9
Georges 5 28 22 753 243 133 117 35
Drum Point 56 124 34 524 248 219 92 58
Sharkfin Shoal 1 16 14 169 23 65 46 24
Turtle Egg Island 7 32 17 202 23 153 47 24
Piney Island East 44 23 0 160 109 199 6 14
Great Rock 64 38 5 12 5 111 0 2
Gunby 4 5 24 317 25 251 20 43
Marumsco 14 12 24 261 44 81 43 19
Broome Island 0 3 5 52 2 8 4 2
Back of Island 2 7 8 47 7 70 6 3
Chicken Cock 9 1 16 37 11 27 15 38
Pagan 616 0 321 227 110 325 196 64
Black Walnut 0 0 0 1 0 0 0 0
Blue Sow 0 0 3 0 0 0 0 0
Dukehart Channel 0 0 1 0 0 1 0 0
Ragged Point 2 1 2 0 1 0 0 2
Cornfield Harbor 7 1 1 28 3 7 7 46
Spat Index 15.9 13.5 15.7 78.0 20.1 59.9 22.7 11.3

29
Table 2 - Spat (continued).
Oyster Bar Spatfall Intensity (Number per Bushel)
2015 31-Yr Avg
AAvg
Mountain Point 0 0.4
Swan Point 0 0.4
Brick House 0 7.0
Hackett Point 0 0.8
Tolly Point 0 0.8
Three Sisters 0 0.8
Holland Point 0 0.5
Stone Rock 2 26.1
Flag Pond 10 24.2
Hog Island 9 18.7
Butler 68 40.6
Buoy Rock 0 1.5
Parsons Island 8 120.1
Wild Ground 15 45.0
Hollicutt Noose 1 5.4
Bruffs Island 0 29.4
Ash Craft 0 78.2
Turtle Back 13 143.8
Shell Hill 4 7.8
Sandy Hill 0 12.7
Royston 21 54.7
Cook Point 1 17.7
Eagle Pt./Mill Pt. 34 39.0
Tilghman Wharf 45 69.2
Deep Neck 83 116.2
Double Mills 9 19.3
Ragged Point 19 58.2
Cason 11 94.6
Windmill 16 55.7
Norman Addition 34 82.7
Goose Creek 11 31.5
Clay Island 43 47.7
Wetipquin 2 4.4
Middleground 12 23.7
Evans 14 11.8
Mt. Vernon Wharf 1 2.6
Georges 29 67.9
Drum Point 59 94.5
Sharkfin Shoal 57 27.8
Turtle Egg Island 64 93.5
Piney Island East 3 108.1
Great Rock 13 32.8
Gunby 95 60.3
Marumsco 141 40.5
Broome Island 6 6.4
Back of Island 18 13.9
Chicken Cock 712 88.0
Pagan 24 175.1
Black Walnut 3 1.6
Blue Sow 0 4.7
Dukehart Channel 0 1.8
Ragged Point 1 5.5
Cornfield Harbor 100 76.0
Spat Index 34.2 41.4
(Return to Text)

30
Table 3. Perkinsus marinus prevalence and intensity (scale of 0-7) in oysters from the 43 disease
monitoring bars, 1990-2015. NA = insufficient quantity of oysters for analytical sample. (S) = bar
within an oyster sanctuary.
Region Oyster Bar Perkinsus marinus Prevalence (%) and Mean Intensity (I)
1990 1991 1992 1993 1994
% I % I % I % I % I
Upper Bay Swan Point 7 0.1 27 0.7 23 0.4 37 0.8 3 0.1
Middle Bay
Hackett Point 0 0.0 27 0.8 57 1.2 97 3.2 23 0.5
Holland Point (S) 20 0.5 47 1.1 80 2.4 93 3.0 36 1.1
Stone Rock 47 0.5 27 0.9 100 4.4 100 3.5 90 2.5
Flag Pond (S) 30 0.8 97 2.6 97 5.7 88 2.7 30 0.8
Lower Bay Hog Island 90 3.0 97 4.5 100 4.2 93 2.4 37 1.0
Butler 100 4.0 100 4.0 81 2.4 97 3.3 80 2.1
Chester River Buoy Rock 23 0.5 80 2.5 97 2.8 93 3.3 10 0.3
Old Field (S) 17 0.2 20 0.5 37 0.9 83 2.4 20 0.6
Eastern Bay
Bugby 100 3.4 100 4.0 73 1.8 100 3.0 43 0.8
Parsons Island 20 0.5 97 3.6 80 2.1 100 3.3 93 3.1
Hollicutt Noose 30 0.3 73 2.0 82 2.1 97 2.7 70 1.7
Wye River Bruffs Island (S) 83 2.8 83 2.8 93 3.0 83 2.6 63 1.3
Miles River Turtle Back 100 3.8 100 3.3 77 1.6 100 3.3 60 1.2
Long Point (S) 73 2.3 94 4.3 86 3.0 77 2.6 60 2.0
Choptank River
Cook Point (S) 17 0.2 23 0.3 87 3.7 97 4.2 90 3.0
Royston NA NA 100 4.5 97 4.8 100 3.3 80 2.0
Lighthouse 90 2.3 100 4.0 100 4.6 93 3.2 47 1.2
Sandy Hill (S) 100 5.0 100 5.7 100 4.2 100 3.8 83 2.3
Oyster Shell Pt. (S) 3 0.1 60 1.7 100 3.9 93 2.8 10 0.3
Harris Creek Tilghman Wharf 100 3.2 97 3.0 100 3.4 100 3.2 63 1.9
Broad Creek Deep Neck 100 4.9 100 5.6 100 3.7 100 3.8 67 2.3
Tred Avon River Double Mills (S) 97 3.6 100 4.9 100 4.1 100 3.8 90 2.0
Little Choptank R. Cason (S) 100 3.4 100 4.4 90 2.6 93 2.8 83 2.2
Ragged Point 100 4.8 100 4.6 100 5.0 100 3.9 87 2.3
Honga River Norman Addition 100 4.2 100 3.4 83 2.0 96 3.6 93 3.3
Fishing Bay Goose Creek 60 1.8 100 3.1 100 3.6 87 2.1 53 1.1
Nanticoke River Wilson Shoals (S) 93 2.9 100 2.8 90 2.5 83 1.6 40 0.9
Manokin River Georges (S) 83 1.9 93 2.9 58 1.4 30 0.7 50 1.2
Holland Straits Holland Straits 100 4.2 100 4.0 100 3.4 76 2.3 57 1.6
Tangier Sound
Sharkfin Shoal 23 0.3 60 1.2 97 2.8 93 2.2 63 1.4
Back Cove 100 2.7 100 4.2 97 3.3 36 1.0 80 2.2
Piney Island East 93 2.7 97 3.1 87 2.7 83 2.2 87 3.1
Old Woman’s Leg 57 1.1 100 4.5 100 4.0 82 2.0 73 2.1
Pocomoke Sound Marumsco 97 3.5 93 3.3 60 1.3 87 2.5 72 1.6
Patuxent River Broome Island 97 3.4 100 2.8 63 1.5 87 3.0 40 0.6
St. Mary’s River Chicken Cock 100 4.2 97 3.1 93 3.2 96 2.6 40 1.0
Pagan (S) 93 3.3 97 2.3 100 3.0 93 2.1 10 0.3
Wicomico R. (west) Lancaster 97 3.6 97 2.8 67 1.4 67 1.6 20 0.2
Mills West 13 0.2 80 2.0 90 2.9 63 1.8 20 0.2
Potomac River
Cornfield Harbor 97 3.4 83 2.3 100 3.8 93 2.9 77 1.9
Ragged Point 97 3.8 90 2.8 40 0.9 50 1.4 10 0.2
Lower Cedar Point 40 0.7 10 0.3 23 0.6 7 0.1 7 0.1
Annual Means 70 2.3 83 3.0 83 2.8 84 2.6 54 1.4
Frequency of Positive Bars (%) 98 100 100 100 100

31
Table 3 - Dermo (continued).
Oyster Bar Perkinsus marinus Prevalence (%) and Mean Intensity (I)
1995 1996 1997 1998 1999 2000
% I % I % I % I % I % I
Swan Point 20 0.2 0 0.0 3 0.1 43 1.2 97 3.4 80 1.2
Hackett Point 90 2.5 30 0.7 43 1.3 43 1.1 97 3.3 97 3.7
Holland Point (S) 87 2.9 47 1.4 37 1.1 37 0.9 93 2.8 87 3.4
Stone Rock 87 2.2 93 2.7 90 2.3 100 3.5 100 4.0 93 3.6
Flag Pond (S) 87 3.3 63 2.0 53 1.2 73 2.3 NA NA NA NA
Hog Island 93 2.7 43 1.2 47 1.3 97 3.2 93 5.5 83 3.9
Butler 87 2.5 60 1.6 57 1.0 97 3.3 93 3.2 83 2.7
Buoy Rock 67 1.7 13 0.4 7 0.7 33 0.9 93 3.0 97 3.5
Old Field (S) 83 2.3 0 0.0 10 0.2 33 0.8 97 3.0 93 3.0
Bugby 83 2.6 80 2.0 70 1.8 60 1.4 100 3.9 100 4.0
Parsons Island 70 2.1 73 2.8 63 1.4 80 2.5 100 4.7 100 3.5
Hollicutt Noose 90 2.8 60 1.4 50 1.0 83 2.5 90 3.0 100 4.1
Bruffs Island (S) 73 2.1 67 1.4 17 0.2 57 1.6 100 3.7 97 3.2
Turtle Back 100 2.8 83 2.1 83 1.8 50 1.6 100 4.3 97 3.1
Long Point (S) 67 2.2 20 0.4 23 0.6 100 2.7 100 3.6 97 3.3
Cook Point (S) NA NA 60 1.5 70 2.4 87 2.8 93 3.4 40 1.2
Royston 63 2.0 50 1.1 67 1.5 90 2.5 97 3.5 97 4.7
Lighthouse 90 3.3 77 1.8 57 1.5 43 1.5 87 2.3 100 3.4
Sandy Hill (S) 89 3.4 30 0.7 60 1.3 40 1.0 97 3.4 87 3.6
Oyster Shell Pt. (S) 68 1.8 13 0.2 50 0.9 20 0.3 83 2.3 73 2.2
Tilghman Wharf 93 2.5 67 1.3 60 1.0 67 2.0 87 2.5 93 3.4
Deep Neck 97 3.0 83 2.1 100 2.6 97 2.9 97 4.5 100 4.0
Double Mills (S) 75 2.5 70 1.2 83 2.0 100 3.0 100 4.8 100 4.7
Cason (S) 93 2.3 87 1.9 93 2.4 50 1.4 97 3.8 100 3.6
Ragged Point 93 2.5 97 2.6 97 2.1 87 1.4 100 4.0 97 3.7
Norman Addition 87 2.8 93 2.4 73 1.6 73 2.3 93 3.5 80 3.4
Goose Creek 87 2.5 97 4.0 83 2.0 100 3.0 100 5.4 97 3.1
Wilson Shoals (S) 63 1.1 83 1.8 80 1.9 70 1.6 100 4.3 70 2.1
Georges (S) 87 2.8 93 2.0 93 2.2 83 2.4 93 3.5 80 2.3
Holland Straits 93 3.1 83 2.0 67 1.8 57 1.2 80 2.5 30 0.9
Sharkfin Shoal 90 3.0 97 2.1 93 2.6 80 2.7 100 4.3 80 2.3
Back Cove 83 3.0 97 3.2 93 2.9 90 2.3 100 5.5 40 1.2
Piney Island East 93 2.5 63 1.7 73 2.2 83 1.9 63 2.4 86 2.3
Old Woman’s Leg 100 4.2 80 2.3 57 1.3 90 3.2 87 3.9 70 1.7
Marumsco 100 4.2 90 2.4 61 2.1 80 2.8 90 3.4 93 2.7
Broome Island 43 1.0 17 0.4 83 2.1 83 3.0 100 4.6 93 4.0
Chicken Cock 83 1.9 77 1.4 73 1.7 80 1.7 100 5.0 63 1.8
Pagan (S) 93 2.2 82 1.4 86 1.7 73 1.7 97 3.4 68 1.6
Lancaster 27 0.6 56 1.2 80 1.6 37 0.7 83 2.5 90 2.7
Mills West 57 1.4 60 1.2 60 1.2 20 0.4 90 3.2 97 3.6
Cornfield Harbor 93 2.5 87 2.0 83 1.8 83 2.0 97 3.9 80 2.1
Ragged Point 33 0.8 7 0.2 0 0.0 0 0.0
00
17 0.5 13 0.7
Lower Cedar Point 13 0.2 3 0.3 0 0.0 0 0.0 0 0.0 17 0.5
Annual Means 78 2.3 61 1.5 62 1.5 67 1.9 90 3.5 81 2.9
Bar Freq. (%) 100 95 95 95 98 100

32
Table 3 - Dermo (continued).
Oyster Bar Perkinsus marinus Prevalence (%) and Mean Intensity (I)
2001 2002 2003 2004 2005 2006
% I % I % I % I % I % I
Swan Point 93 3.3 97 2.7 33 1.0 33 0.7 47 1.2 20 0.6
Hackett Point 97 3.4 100 3.3 33 1.1 30 0.8 13 0.4 70 1.3
Holland Point (S) 93 3.2 100 3.6 33 1.1 30 0.6 53 1.6 10 0.4
Stone Rock 83 2.8 100 2.3 77 2.4 10 0.2 50 1.3 77 1.9
Flag Pond (S) NA NA 37 0.5 0 0.0 3 0.03 13 0.3 43 0.9
Hog Island 93 3.4 87 2.9 53 2.3 53 1.4 93 3.4 93 4.4
Butler 80 2.4 80 1.4 10 0.3 7 0.1 30 1.1 40 1.2
Buoy Rock 93 3.5 100 2.6 97 3.7 50 1.5 77 2.4 63 1.8
Old Field (S) 100 3.3 97 2.5 80 2.5 33 0.7 57 1.1 63 1.4
Bugby 100 4.6 97 3.1 97 3.4 63 1.7 53 1.8 87 2.7
Parsons Island 100 4.5 100 4.4 90 3.3 93 2.8 87 2.6 87 2.1
Hollicutt Noose 100 4.8 100 3.6 80 2.7 40 1.5 40 1.0 83 2.9
Bruffs Island (S) 100 3.8 100 3.6 73 1.8 80 2.5 73 1.8 53 1.6
Turtle Back 100 4.2 100 4.7 100 3.6 80 2.8 100 3.3 97 3.8
Long Point (S) 100 4.2 100 3.1 97 2.8 97 3.2 90 2.7 80 2.1
Cook Point (S) 77 2.2 NA NA 66 2.1 0 0.0 13 0.3 40 0.5
Royston 100 5.2 100 4.2 48 1.8 13 0.3 3 0.2 47 0.9
Lighthouse 100 3.3 100 4.6 20 0.6 43 1.2 27 0.6 30 0.4
Sandy Hill (S) 100 4.5 100 5.0 93 3.5 87 3.3 80 2.5 70 2.3
Oyster Shell Pt. (S) 100 3.6 100 3.0 43 1.0 43 0.8 17 0.3 30 1.1
Tilghman Wharf 100 3.5 90 3.2 87 2.4 43 0.8 0 0.0 50 0.7
Deep Neck 97 4.8 100 3.2 97 3.7 27 0.5 20 0.4 50 1.1
Double Mills (S) 100 5.5 97 2.9 53 1.7 53 2.1 53 1.6 40 1.1
Cason (S) 100 4.3 94 4.4 17 0.4 3 0.03 33 0.5 23 0.4
Ragged Point 100 4.3 100 3.5 43 1.0 13 0.2 10 0.3 23 0.4
Norman Addition 90 3.0 67 1.9 37 1.3 93 3.3 90 3.8 57 2.0
Goose Creek 100 4.1 93 4.0 57 2.0 77 2.0 63 2.2 8 0.3
Wilson Shoals (S) 100 4.0 100 3.6 83 2.3 97 2.3 90 3.0 93 3.7
Georges (S) 100 5.2 100 4.0 83 2.6 100 4.2 90 3.3 97 3.8
Holland Straits 43 1.4 50 1.1 40 0.7 70 1.7 83 3.0 83 2.1
Sharkfin Shoal 90 3.7 97 3.6 47 3.4 100 4.4 87 3.2 83 3.4
Back Cove 100 5.0 97 3.8 100 4.6 97 3.7 100 3.1 77 2.5
Piney Island East 60 1.5 100 3.1 100 3.9 100 3.9 100 3.7 80 3.4
Old Woman’s Leg 100 5.0 100 3.7 100 4.4 93 3.7 80 2.4 57 1.8
Marumsco 100 5.0 97 4.1 90 2.3 87 2.8 93 3.3 67 2.8
Broome Island 100 4.8 97 3.8 47 1.3 47 1.4 37 0.9 77 2.5
Chicken Cock 93 3.6 100 2.9 23 0.7 40 0.9 87 3.5 90 3.4
Pagan (S) 100 4.6 93 4.0 60 1.3 83 2.3 83 2.9 80 3.1
Lancaster 100 4.5 97 2.7 50 1.5 37 0.9 57 1.5 73 2.2
Mills West 100 4.8 93 3.1 60 1.6 57 1.5 50 1.3 87 2.6
Cornfield Harbor 80 2.9 97 1.7 27 0.7 30 0.5 80 2.6 100 3.3
Ragged Point 33 0.5 93 2.6 24 0.7 9 0.1 37 0.9 0 0.0
Lower Cedar Point 90 2.3 97 2.5 13 0.5 17 0.4 13 0.2 10 0.1
Annual Means 93 3.8 94 3.2 60 2.0 53 1.6 57 1.8 60 1.9
Bar Freq. (%) 100 100 98 98 98 98

33
Table 3 - Dermo (continued).
Oyster Bar Perkinsus marinus Prevalence (%) and Mean Intensity (I)
2007 2008 2009 2010 2011 2012
% I % I % I % I % I % I
Swan Point 17 0.4 20 0.6 23 0.4 3 0.1 7 0.1 3 0.03
Hackett Point 87 2.9 80 2.7 73 1.9 63 1.3 33 1.0 33 0.8
Holland Point (S) 33 0.6 23 0.8 33 0.8 13 0.4 17 0.4 0 0.0
Stone Rock 93 3.5 47 1.3 30 0.9 53 1.2 17 0.4 57 2.0
Flag Pond (S) 87 2.0 67 2.3 57 2.1 33 1.2 38 0.9 53 1.5
Hog Island 80 3.1 50 2.0 67 2.7 70 2.0 40 1.0 77 2.2
Butler 77 1.7 43 1.2 43 1.3 77 2.7 60 1.9 90 3.4
Buoy Rock 80 3.2 70 2.2 64 1.5 65 2.2 20 0.5 10 0.3
Old Field (S) 100 4.0 90 3.3 87 3.3 70 2.2 40 0.8 67 2.2
Bugby 100 3.9 93 2.9 100 3.8 67 2.0 27 0.6 73 2.3
Parsons Island 97 4.0 87 3.1 100 2.5 60 1.8 10 0.4 23 0.7
Hollicutt Noose 87 3.0 93 3.3 43 1.4 53 1.4 20 0.9 13 0.3
Bruffs Island (S) 100 3.8 93 3.0 83 2.6 73 1.6 47 1.1 33 0.9
Turtle Back 100 4.4 100 4.1 97 2.9 73 1.8 23 0.6 50 0.9
Long Point (S) 93 3.8 87 3.1 46 1.6 50 1.3 31 0.7 46 1.5
Cook Point (S) 17 0.3 13 0.4 7 0.1 43 1.0 40 1.0 93 3.2
Royston 23 0.7 17 0.4 27 0.7 3 0.1 13 0.4 27 0.8
Lighthouse 0 0.0 0 0.0 10 0.1 10 0.1 0 0.0 13 0.2
Sandy Hill (S) 87 2.5 17 0.5 13 0.2 30 0.7 40 1.5 80 2.5
Oyster Shell Pt. (S) 27 0.7 0 0.0 0 0.0 0 0.0 3 0.1 0 0.0
Tilghman Wharf 23 0.5 3 0.1 10 0.2 3 0.1 0 0.0 0 0.0
Deep Neck 90 2.7 67 2.2 70 2.4 67 1.9 43 1.1 100 3.2
Double Mills (S) 87 2.9 67 2.2 80 2.1 63 1.5 53 1.7 83 3.4
Cason (S) 60 1.9 100 2.9 100 3.2 97 3.8 70 2.2 93 3.3
Ragged Point 93 2.7 37 1.0 80 2.5 83 2.3 60 1.7 93 3.1
Norman Addition 23 0.9 37 0.7 57 1.8 100 3.9 87 3.3 100 4.3
Goose Creek 0 0.0 20 0.2 0 0.0 10 0.2 10 0.3 50 1.3
Wilson Shoals (S) 93 2.7 80 2.3 87 2.9 80 1.9 62 2.0 97 4.1
Georges (S) 83 3.8 57 2.2 57 1.6 73 2.4 50 1.2 100 3.9
Holland Straits 80 3.0 50 2.0 47 1.5 70 2.2 37 1.4 83 3.0
Sharkfin Shoal 70 1.9 70 1.7 90 3.6 97 3.6 90 3.3 100 4.2
Back Cove 93 3.2 80 2.6 87 3.3 93 3.6 80 2.7 90 3.0
Piney Island East 67 2.5 90 3.3 90 3.4 97 4.1 70 2.7 80 2.5
Old Woman’s Leg 73 2.2 90 2.8 97 4.7 70 3.0 47 1.9 77 2.7
Marumsco 37 1.1 57 1.7 90 3.0 73 2.7 67 2.5 97 3.2
Broome Island 97 3.6 93 2.5 100 4.2 90 3.3 67 2.3 87 3.0
Chicken Cock 90 4.0 40 1.3 90 3.5 83 3.3 20 0.6 50 1.3
Pagan (S) 90 2.5 57 1.8 93 2.7 97 3.9 53 2.0 87 2.8
Lancaster 97 4.2 77 2.1 73 2.4 60 2.0 37 0.8 47 1.1
Mills West 47 1.6 57 1.9 50 1.3 27 0.9 27 0.5 80 2.5
Cornfield Harbor 97 3.5 73 2.6 87 3.7 83 2.5 40 1.3 83 3.0
Ragged Point 0 0.0 8 0.1 0 0.0 4 0.1 0 0.0 3 0.03
Lower Cedar Point 30 0.6 7 0.1 10 0.3 40 0.9 20 0.4 20 0.3
Annual Means 68 2.3 56 1.8 59 2.0 57 1.8 38 1.2 59 2.0
Bar Freq. (%) 93 95 93 98 93 93

34
Table 3 - Dermo (continued).
Oyster Bar Perkinsus marinus Prevalence (%) and Mean Intensity (I)
2013 2014 2015 26-Yr Avg
% I % I % I % I
Swan Point 27 0.4 3 0.0 33 0.3 30.7 0.8
Hackett Point 13 0.6 0 0.0 10 0.3 51.5 1.5
Holland Point (S) 5 0.1 0 0.0 0 0.0 42.6 1.3
Stone Rock 67 2.0 100 4.0 93 4.5 72.3 2.3
Flag Pond (S) 23 0.8 10 0.3 18 0.5 47.8 1.5
Hog Island 27 0.9 43 1.2 87 3.0 72.5 2.6
Butler 70 2.4 73 2.4 60 2.0 68.3 2.1
Buoy Rock 27 0.6 13 0.4 17 0.2 56.1 1.8
Old Field (S) 57 1.5 47 1.5 57 1.7 59.2 1.8
Bugby 73 2.5 83 2.8 87 3.3 81.1 2.7
Parsons Island 30 0.9 15 0.4 53 1.3 73.4 2.5
Hollicutt Noose 13 0.4 23 0.6 33 0.7 63.3 2.0
Bruffs Island (S) 37 1.2 23 0.7 77 2.0 71.6 2.2
Turtle Back 63 2.2 80 2.5 100 4.2 85.1 2.9
Long Point (S) 37 1.2 10 0.4 20 0.5 68.5 2.3
Cook Point (S) 97 3.2 80 3.1 90 3.3 55.8 1.8
Royston 60 2.0 60 2.0 63 2.1 57.8 2.1
Lighthouse 10 0.3 10 0.3 23 0.5 49.2 1.6
Sandy Hill (S) 93 2.8 77 2.4 93 3.3 74.8 2.8
Oyster Shell Pt. (S) 7 0.2 3 0.0 40 1.0 37.9 1.1
Tilghman Wharf 10 0.2 7 0.1 20 0.6 52.8 1.5
Deep Neck 80 3.1 67 1.8 93 2.9 81.1 2.9
Double Mills (S) 83 3.1 73 2.6 70 2.9 79.6 2.8
Cason (S) 80 2.8 90 2.8 93 2.8 78.4 2.6
Ragged Point 97 3.0 83 2.3 100 3.2 79.7 2.6
Norman Addition 80 3.1 87 3.7 77 2.7 79.0 2.8
Goose Creek 80 2.6 83 2.5 100 3.4 66.0 2.2
Wilson Shoals (S) 93 3.0 90 3.4 80 2.8 84.5 2.6
Georges (S) 83 3.4 97 3.9 93 3.9 81.0 2.8
Holland Straits 90 3.7 80 3.6 83 3.0 70.5 2.3
Sharkfin Shoal 93 3.5 90 3.4 77 2.8 83.0 2.9
Back Cove 93 3.9 80 3.1 77 3.2 86.9 3.2
Piney Island East 63 2.0 40 1.4 53 1.8 80.7 2.7
Old Woman’s Leg 52 1.3 60 2.6 67 2.1 79.2 2.9
Marumsco 100 4.4 80 3.5 90 3.6 82.6 2.9
Broome Island 93 3.2 70 1.9 80 2.6 76.5 2.6
Chicken Cock 50 1.2 67 1.9 67 2.1 72.8 2.4
Pagan (S) 77 2.4 83 2.1 83 2.9 81.2 2.5
Lancaster 30 1.2 20 0.8 3 0.2 60.7 1.8
Mills West 70 2.1 53 1.8 57 1.7 60.2 1.8
Cornfield Harbor 90 3.1 80 3.1 57 1.8 79.9 2.5
Ragged Point 0 0.0 3 0.0 0 0.0 22.0 0.6
Lower Cedar Point 20 0.4 3 0.1 55 1.6 21.7 0.5
Annual Means 57 1.9 52 1.8 61 2.1 66.8 2.2
Bar Freq. (%) 98 95 95 97.2
(Return to Text)

35
Table 4. Prevalence of Haplosporidium nelsoni in oysters from the 43 disease monitoring bars,
1990-2015. NA=insufficient quantity of oysters for analytical sample. ND= sample collected but
diagnostics not performed; prevalence assumed to be 0. (S) = bar within an oyster sanctuary.
Region Oyster Bar Haplosporidium nelsoni Prevalence (%)
1990 1991 1992 1993 1994 1995 1996 1997
Upper Bay Swan Point 0 0 0 0 ND 0 0 0
Middle Bay
Hackett Point 0 0 3 0 0 0 0 0
Holland Point (S) 0 3 13 0 0 0 0 0
Stone Rock 0 0 43 0 0 3 0 0
Flag Pond (S) 0 0 53 0 0 27 0 0
Lower Bay Hog Island 0 0 43 0 0 14 0 0
Butler 0 0 50 0 0 23 0 7
Chester River Buoy Rock ND 0 0 0 ND 0 0 0
Old Field (S) ND 0 0 0 ND 0 0 0
Eastern Bay
Bugby 0 7 3 0 0 0 0 0
Parsons Island ND 0 7 0 0 0 0 0
Hollicutt Noose 0 0 17 0 0 0 0 0
Wye River Bruffs Island (S) 0 0 0 0 0 0 0 0
Miles River Turtle Back 0 0 0 0 0 23 0 0
Long Point (S) 0 0 0 0 0 0 0 0
Choptank River
Cook Point (S) 0 7 73 0 0 NA 0 3
Royston NA 0 33 0 0 0 0 0
Lighthouse 0 0 53 0 0 0 0 0
Sandy Hill (S) 0 0 13 0 ND 0 0 0
Oyster Shell Pt. (S) 0 0 30 0 ND 0 0 0
Harris Creek Tilghman Wharf 0 0 40 0 0 0 0 0
Broad Creek Deep Neck 0 0 30 0 0 0 0 0
Tred Avon River Double Mills (S) 0 0 17 0 0 0 0 0
Little Choptank R. Cason (S) 0 0 43 0 0 0 0 0
Ragged Point 0 20 57 0 0 0 0 0
Honga River Norman Addition 3 0 53 0 0 33 0 0
Fishing Bay Goose Creek 0 10 27 7 0 20 0 0
Nanticoke River Wilson Shoals (S) 0 0 57 0 ND 7 0 0
Manokin River Georges (S) 10 7 23 0 0 33 0 0
Holland Straits Holland Straits 0 20 13 13 0 52 0 10
Tangier Sound
Sharkfin Shoal 20 43 40 17 0 33 0 0
Back Cove 0 17 27 33 7 20 3 3
Piney Island East 7 23 17 20 13 10 7 13
Old Woman’s Leg 0 33 23 30 10 43 20 4
Pocomoke Sound Marumsco 0 20 20 0 0 20 0 11
Patuxent River Broome Island 0 ND 20 0 0 0 0 0
St. Mary’s River Chicken Cock 0 0 57 0 ND 0 0 0
Pagan (S) 0 0 0 0 ND 0 0 0
Wicomico R.
(west)
Lancaster 0 0 0 0 ND 0 0 0
Mills West 0 0 0 0 ND 0 0 0
Potomac River
Cornfield Harbor 0 0 57 0 0 37 0 0
Ragged Point 0 0 0 0 0 0 0 0
Lower Cedar Point ND ND 0 0 ND 0 0 0
Frequency of Positive Bars (%) 9 28 74 14 7 40 7 16
Average Prevalence (%) 1.1 5.1 24.5 2.8 0.9 9.5 0.7 1.2
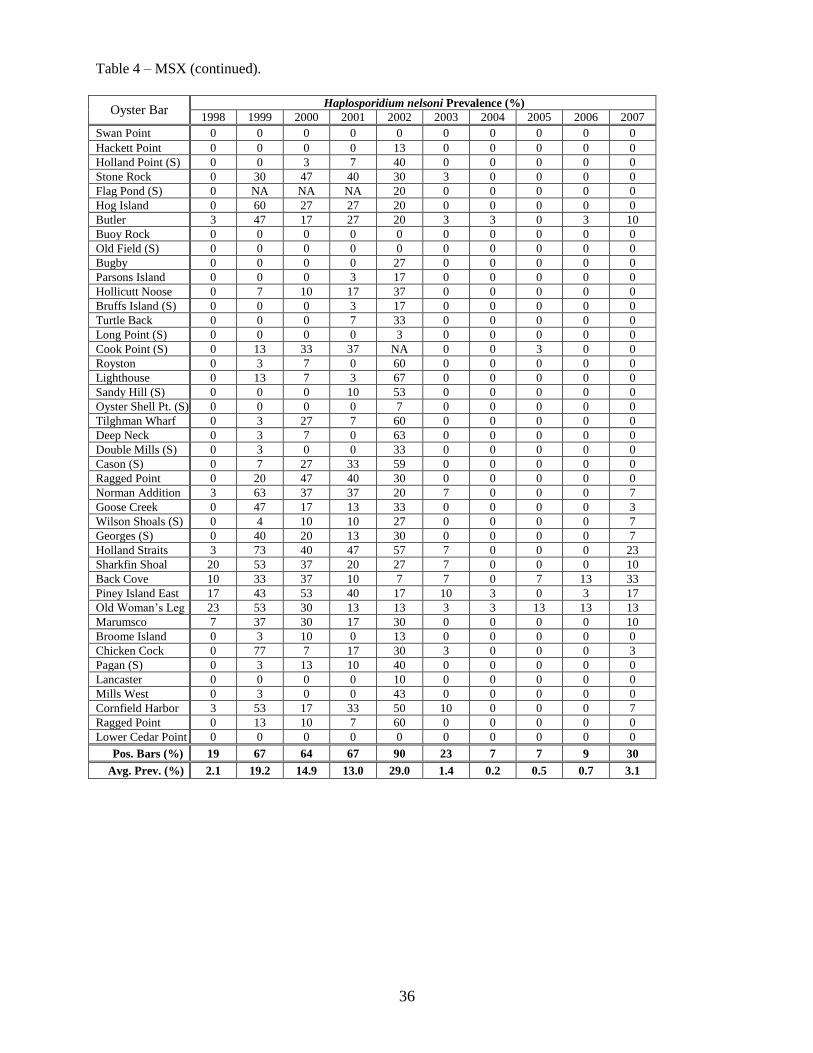
36
Table 4 – MSX (continued).
Oyster Bar Haplosporidium nelsoni Prevalence (%)
1998 1999 2000 2001 2002 2003 2004 2005 2006 2007
Swan Point 0 0 0 0 0 0 0 0 0 0 Hackett Point 0 0 0 0 13 0 0 0 0 0 Holland Point (S) 0 0 3 7 40 0 0 0 0 0 Stone Rock 0 30 47 40 30 3 0 0 0 0 Flag Pond (S) 0 NA NA NA 20 0 0 0 0 0 Hog Island 0 60 27 27 20 0 0 0 0 0 Butler 3 47 17 27 20 3 3 0 3 10 Buoy Rock 0 0 0 0 0 0 0 0 0 0 Old Field (S) 0 0 0 0 0 0 0 0 0 0 Bugby 0 0 0 0 27 0 0 0 0 0 Parsons Island 0 0 0 3 17 0 0 0 0 0 Hollicutt Noose 0 7 10 17 37 0 0 0 0 0 Bruffs Island (S) 0 0 0 3 17 0 0 0 0 0 Turtle Back 0 0 0 7 33 0 0 0 0 0 Long Point (S) 0 0 0 0 3 0 0 0 0 0 Cook Point (S) 0 13 33 37 NA 0 0 3 0 0 Royston 0 3 7 0 60 0 0 0 0 0 Lighthouse 0 13 7 3 67 0 0 0 0 0 Sandy Hill (S) 0 0 0 10 53 0 0 0 0 0 Oyster Shell Pt. (S) 0 0 0 0 7 0 0 0 0 0 Tilghman Wharf 0 3 27 7 60 0 0 0 0 0 Deep Neck 0 3 7 0 63 0 0 0 0 0 Double Mills (S) 0 3 0 0 33 0 0 0 0 0 Cason (S) 0 7 27 33 59 0 0 0 0 0 Ragged Point 0 20 47 40 30 0 0 0 0 0 Norman Addition 3 63 37 37 20 7 0 0 0 7 Goose Creek 0 47 17 13 33 0 0 0 0 3 Wilson Shoals (S) 0 4 10 10 27 0 0 0 0 7 Georges (S) 0 40 20 13 30 0 0 0 0 7
Holland Straits 3 73 40 47 57 7 0 0 0 23 Sharkfin Shoal 20 53 37 20 27 7 0 0 0 10 Back Cove 10 33 37 10 7 7 0 7 13 33 Piney Island East 17 43 53 40 17 10 3 0 3 17 Old Woman’s Leg 23 53 30 13 13 3 3 13 13 13 Marumsco 7 37 30 17 30 0 0 0 0 10 Broome Island 0 3 10 0 13 0 0 0 0 0
Chicken Cock 0 77 7 17 30 3 0 0 0 3
Pagan (S) 0 3 13 10 40 0 0 0 0 0
Lancaster 0 0 0 0 10 0 0 0 0 0
Mills West 0 3 0 0 43 0 0 0 0 0
Cornfield Harbor 3 53 17 33 50 10 0 0 0 7
Ragged Point 0 13 10 7 60 0 0 0 0 0
Lower Cedar Point 0 0 0 0 0 0 0 0 0 0
Pos. Bars (%) 19 67 64 67 90 23 7 7 9 30
Avg. Prev. (%) 2.1 19.2 14.9 13.0 29.0 1.4 0.2 0.5 0.7 3.1
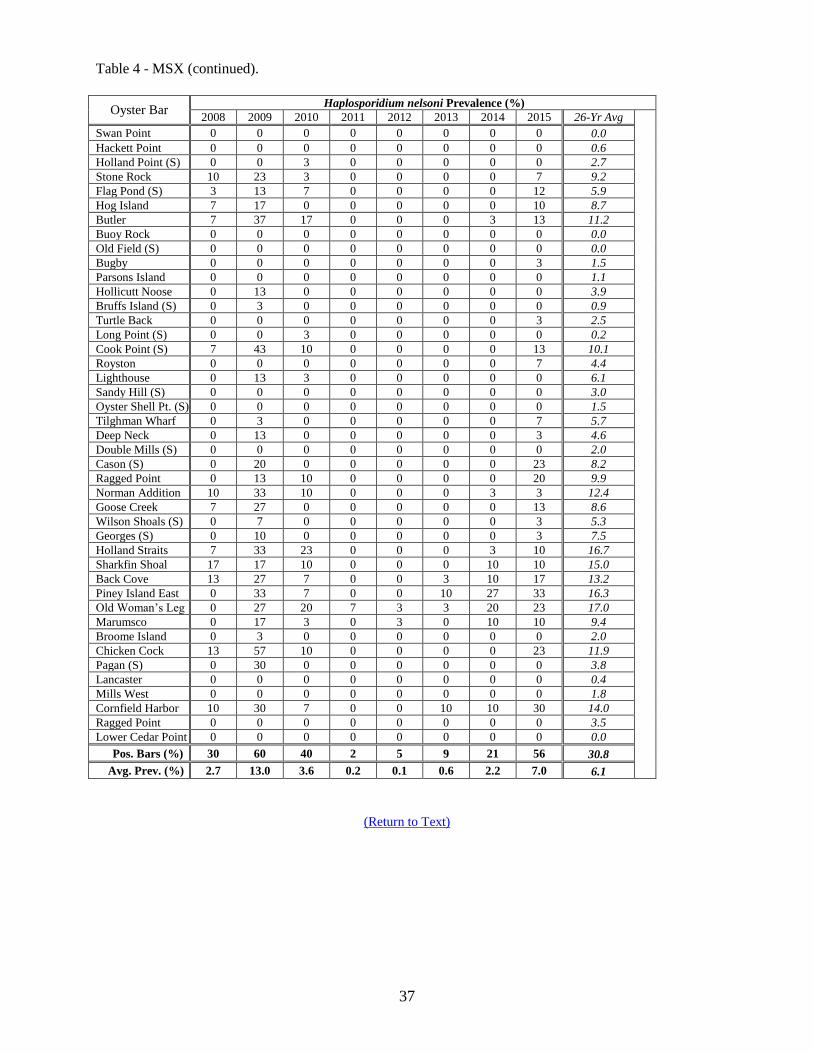
37
Table 4 - MSX (continued).
Oyster Bar Haplosporidium nelsoni Prevalence (%)
2008 2009 2010 2011 2012 2013 2014 2015 26-Yr Avg
Swan Point 0 0 0 0 0 0 0 0 0.0 Hackett Point 0 0 0 0 0 0 0 0 0.6 Holland Point (S) 0 0 3 0 0 0 0 0 2.7 Stone Rock 10 23 3 0 0 0 0 7 9.2 Flag Pond (S) 3 13 7 0 0 0 0 12 5.9 Hog Island 7 17 0 0 0 0 0 10 8.7 Butler 7 37 17 0 0 0 3 13 11.2 Buoy Rock 0 0 0 0 0 0 0 0 0.0 Old Field (S) 0 0 0 0 0 0 0 0 0.0 Bugby 0 0 0 0 0 0 0 3 1.5 Parsons Island 0 0 0 0 0 0 0 0 1.1 Hollicutt Noose 0 13 0 0 0 0 0 0 3.9 Bruffs Island (S) 0 3 0 0 0 0 0 0 0.9 Turtle Back 0 0 0 0 0 0 0 3 2.5 Long Point (S) 0 0 3 0 0 0 0 0 0.2 Cook Point (S) 7 43 10 0 0 0 0 13 10.1 Royston 0 0 0 0 0 0 0 7 4.4 Lighthouse 0 13 3 0 0 0 0 0 6.1 Sandy Hill (S) 0 0 0 0 0 0 0 0 3.0 Oyster Shell Pt. (S) 0 0 0 0 0 0 0 0 1.5 Tilghman Wharf 0 3 0 0 0 0 0 7 5.7 Deep Neck 0 13 0 0 0 0 0 3 4.6 Double Mills (S) 0 0 0 0 0 0 0 0 2.0 Cason (S) 0 20 0 0 0 0 0 23 8.2 Ragged Point 0 13 10 0 0 0 0 20 9.9 Norman Addition 10 33 10 0 0 0 3 3 12.4 Goose Creek 7 27 0 0 0 0 0 13 8.6 Wilson Shoals (S) 0 7 0 0 0 0 0 3 5.3 Georges (S) 0 10 0 0 0 0 0 3 7.5
Holland Straits 7 33 23 0 0 0 3 10 16.7 Sharkfin Shoal 17 17 10 0 0 0 10 10 15.0 Back Cove 13 27 7 0 0 3 10 17 13.2 Piney Island East 0 33 7 0 0 10 27 33 16.3 Old Woman’s Leg 0 27 20 7 3 3 20 23 17.0 Marumsco 0 17 3 0 3 0 10 10 9.4 Broome Island 0 3 0 0 0 0 0 0 2.0
Chicken Cock 13 57 10 0 0 0 0 23 11.9
Pagan (S) 0 30 0 0 0 0 0 0 3.8
Lancaster 0 0 0 0 0 0 0 0 0.4
Mills West 0 0 0 0 0 0 0 0 1.8
Cornfield Harbor 10 30 7 0 0 10 10 30 14.0
Ragged Point 0 0 0 0 0 0 0 0 3.5
Lower Cedar Point 0 0 0 0 0 0 0 0 0.0
Pos. Bars (%) 30 60 40 2 5 9 21 56 30.8
Avg. Prev. (%) 2.7 13.0 3.6 0.2 0.1 0.6 2.2 7.0 6.1
(Return to Text)
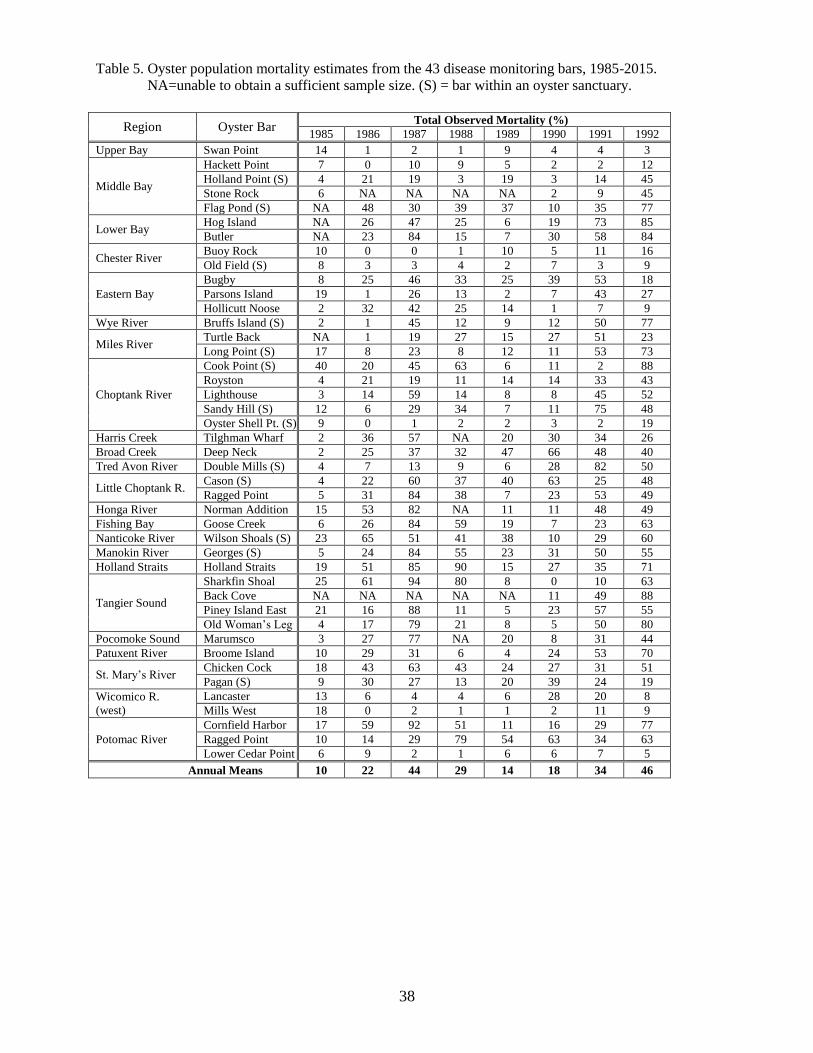
38
Table 5. Oyster population mortality estimates from the 43 disease monitoring bars, 1985-2015.
NA=unable to obtain a sufficient sample size. (S) = bar within an oyster sanctuary.
Region Oyster Bar Total Observed Mortality (%)
1985 1986 1987 1988 1989 1990 1991 1992
Upper Bay Swan Point 14 1 2 1 9 4 4 3
Middle Bay
Hackett Point 7 0 10 9 5 2 2 12
Holland Point (S) 4 21 19 3 19 3 14 45
Stone Rock 6 NA NA NA NA 2 9 45
Flag Pond (S) NA 48 30 39 37 10 35 77
Lower Bay Hog Island NA 26 47 25 6 19 73 85
Butler NA 23 84 15 7 30 58 84
Chester River Buoy Rock 10 0 0 1 10 5 11 16
Old Field (S) 8 3 3 4 2 7 3 9
Eastern Bay
Bugby 8 25 46 33 25 39 53 18
Parsons Island 19 1 26 13 2 7 43 27
Hollicutt Noose 2 32 42 25 14 1 7 9
Wye River Bruffs Island (S) 2 1 45 12 9 12 50 77
Miles River Turtle Back NA 1 19 27 15 27 51 23
Long Point (S) 17 8 23 8 12 11 53 73
Choptank River
Cook Point (S) 40 20 45 63 6 11 2 88
Royston 4 21 19 11 14 14 33 43
Lighthouse 3 14 59 14 8 8 45 52
Sandy Hill (S) 12 6 29 34 7 11 75 48
Oyster Shell Pt. (S) 9 0 1 2 2 3 2 19
Harris Creek Tilghman Wharf 2 36 57 NA 20 30 34 26
Broad Creek Deep Neck 2 25 37 32 47 66 48 40
Tred Avon River Double Mills (S) 4 7 13 9 6 28 82 50
Little Choptank R. Cason (S) 4 22 60 37 40 63 25 48
Ragged Point 5 31 84 38 7 23 53 49
Honga River Norman Addition 15 53 82 NA 11 11 48 49
Fishing Bay Goose Creek 6 26 84 59 19 7 23 63
Nanticoke River Wilson Shoals (S) 23 65 51 41 38 10 29 60
Manokin River Georges (S) 5 24 84 55 23 31 50 55
Holland Straits Holland Straits 19 51 85 90 15 27 35 71
Tangier Sound
Sharkfin Shoal 25 61 94 80 8 0 10 63
Back Cove NA NA NA NA NA 11 49 88
Piney Island East 21 16 88 11 5 23 57 55
Old Woman’s Leg 4 17 79 21 8 5 50 80
Pocomoke Sound Marumsco 3 27 77 NA 20 8 31 44
Patuxent River Broome Island 10 29 31 6 4 24 53 70
St. Mary’s River Chicken Cock 18 43 63 43 24 27 31 51
Pagan (S) 9 30 27 13 20 39 24 19
Wicomico R.
(west)
Lancaster 13 6 4 4 6 28 20 8
Mills West 18 0 2 1 1 2 11 9
Potomac River
Cornfield Harbor 17 59 92 51 11 16 29 77
Ragged Point 10 14 29 79 54 63 34 63
Lower Cedar Point 6 9 2 1 6 6 7 5
Annual Means 10 22 44 29 14 18 34 46

39
Table 5 - Mortality (continued).
Oyster Bar Total Observed Mortality (%)
1993 1994 1995 1996 1997 1998 1999 2000 2001 2002
Swan Point 5 35 18 43 20 3 7 13 12 14
Hackett Point 18 30 30 16 10 26 22 13 30 60
Holland Point (S) 43 42 35 49 36 36 8 33 42 67
Stone Rock 30 29 40 25 15 33 46 66 30 86
Flag Pond (S) 43 28 24 16 13 33 50 NA NA 23
Hog Island 76 16 45 20 16 33 67 67 14 31
Butler 66 37 63 17 20 20 48 67 32 11
Buoy Rock 51 33 22 17 7 7 6 25 43 61
Old Field (S) 8 12 8 17 8 5 8 21 36 47
Bugby 29 18 18 27 15 8 5 29 48 63
Parsons Island 29 18 36 22 25 8 16 29 60 59
Hollicutt Noose 29 32 30 13 15 14 13 38 55 85
Bruffs Island (S) 47 47 33 6 6 11 16 33 44 50
Turtle Back 24 40 51 21 9 9 26 38 48 54
Long Point (S) 44 8 28 8 3 9 14 33 34 66
Cook Point (S) 63 40 22 16 11 20 35 63 28 100
Royston 37 10 17 9 9 6 32 31 51 91
Lighthouse 57 27 18 15 5 6 20 33 44 92
Sandy Hill (S) 45 36 29 23 22 4 15 27 50 77
Oyster Shell Pt. (S) 20 14 18 25 6 2 1 15 28 55
Tilghman Wharf 36 6 10 9 15 6 12 19 34 85
Deep Neck 32 1 23 14 8 13 37 23 37 85
Double Mills (S) 24 10 20 9 8 10 38 40 50 85
Cason (S) 53 6 7 12 11 18 28 32 62 98
Ragged Point 71 17 16 12 13 19 34 37 70 94
Norman Addition 51 28 39 55 31 54 35 38 29 29
Goose Creek 38 7 38 69 64 20 64 63 81 85
Wilson Shoals (S) 23 10 17 11 11 9 29 25 26 52
Georges (S) 16 0 55 33 36 12 32 60 50 44
Holland Straits 18 16 45 43 20 18 35 35 17 12
Sharkfin Shoal 16 7 66 59 47 28 62 61 39 61
Back Cove 4 6 46 33 29 50 59 20 46 38
Piney Island East 13 20 65 56 49 67 38 27 12 20
Old Woman’s Leg 15 25 63 46 33 38 42 15 53 27
Marumsco 21 8 78 53 49 26 40 22 35 45
Broome Island 53 27 8 0 13 11 44 25 59 72
Chicken Cock 33 28 15 10 7 24 82 63 28 63
Pagan (S) 17 11 9 27 15 3 14 35 51 84
Lancaster 7 4 19 25 8 8 18 48 58 52
Mills West 2 4 21 18 17 16 24 36 40 75
Cornfield Harbor 47 25 56 24 7 27 78 62 44 33
Ragged Point 28 35 8 11 4 25 10 8 33 NA
Lower Cedar Point 47 28 5 23 3 26 8 0 3 44
Annual Means 33 20 30 25 18 19 31 35 38 58

40
Table 5 - Mortality (continued).
Oyster Bar Total Observed Mortality (%)
2003 2004 2005 2006 2007 2008 2009 2010 2011 2012
Swan Point 13 10 11 8 10 9 33 20 27 1
Hackett Point 17 10 2 5 11 26 15 14 0 13
Holland Point (S) 50 29 5 0 0 11 0 8 50 7
Stone Rock 13 5 5 20 5 25 16 8 2 2
Flag Pond (S) 0 0 2 4 0 14 26 20 11 0
Hog Island 11 6 12 25 42 14 18 12 8 14
Butler 9 2 3 23 0 9 8 8 12 4
Buoy Rock 41 28 6 21 20 24 43 8 4 2
Old Field (S) 34 10 38 12 12 17 17 11 21 12
Bugby 50 14 2 20 52 42 50 12 4 9
Parsons Island 37 11 8 35 50 34 36 16 10 4
Hollicutt Noose 25 3 6 48 43 27 12 23 0 0
Bruffs Island (S) 50 12 5 4 12 36 33 28 0 7
Turtle Back 43 11 12 51 57 55 34 5 11 4
Long Point (S) 54 10 10 14 38 46 17 33 0 33
Cook Point (S) 21 0 0 0 12 22 7 8 6 5
Royston 69 14 0 0 9 5 10 0 1 3
Lighthouse 89 47 0 0 0 0 4 1 3 4
Sandy Hill (S) 88 59 44 24 4 5 5 0 8 6
Oyster Shell Pt. (S) 48 20 0 4 0 4 4 2 1 3
Tilghman Wharf 62 17 0 1 10 14 2 2 3 0
Deep Neck 54 14 1 3 8 9 3 6 4 3
Double Mills (S) 59 23 8 0 7 4 19 6 4 14
Cason (S) 57 4 0 2 4 16 17 33 10 13
Ragged Point 52 5 4 13 13 2 22 15 4 2
Norman Addition 9 14 40 5 3 2 6 15 9 10
Goose Creek 53 59 50 50 1 2 6 0 3 1
Wilson Shoals (S) 19 27 7 21 7 30 10 3 5 8
Georges (S) 4 24 44 76 16 48 10 12 2 11
Holland Straits 11 18 43 48 17 27 12 14 5 7
Sharkfin Shoal 23 32 54 22 10 3 18 20 12 13
Back Cove 22 23 32 12 5 8 6 15 4 10
Piney Island East 28 48 50 23 6 18 20 26 17 11
Old Woman’s Leg 35 56 26 0 12 14 37 38 26 0
Marumsco 4 11 29 20 10 21 7 13 4 15
Broome Island 14 19 6 6 20 20 11 14 3 6
Chicken Cock 2 38 50 20 20 7 27 22 11 1
Pagan (S) 7 29 66 9 4 11 29 13 5 11
Lancaster 35 27 14 7 31 17 24 0 0 0
Mills West 48 11 0 7 33 0 16 10 11 12
Cornfield Harbor 1 7 20 2 9 25 44 16 9 8
Ragged Point 76 NA NA NA 0 0 0 0 0 10
Lower Cedar Point 55 22 17 3 11 5 4 7 14 10
Annual Means 35 20 17 16 15 17 17 12 8 7

41
Table 5 - Mortality (continued).
Oyster Bar Total Observed Mortality (%)
2013 2014 2015 31-Yr Avg
Swan Point 4 0 3 11.5
Hackett Point 0 0 0 13.4
Holland Point (S) 12 40 29 24.5
Stone Rock 2 5 31 22.3
Flag Pond (S) 15 13 5 22.0
Hog Island 2 2 12 28.1
Butler 7 7 10 26.1
Buoy Rock 5 9 3 17.4
Old Field (S) 0 3 0 12.8
Bugby 8 31 21 26.5
Parsons Island 2 4 15 22.6
Hollicutt Noose 1 9 6 21.3
Bruffs Island (S) 0 4 5 22.5
Turtle Back 0 8 14 26.3
Long Point (S) 20 0 0 23.5
Cook Point (S) 9 12 16 25.5
Royston 1 6 9 18.7
Lighthouse 1 1 2 21.7
Sandy Hill (S) 3 13 11 26.5
Oyster Shell Pt. (S) 2 5 2 10.2
Tilghman Wharf 5 1 5 18.6
Deep Neck 5 7 16 22.7
Double Mills (S) 11 12 10 21.6
Cason (S) 11 8 17 26.4
Ragged Point 15 13 21 27.5
Norman Addition 9 7 13 26.7
Goose Creek 5 15 22 34.9
Wilson Shoals (S) 5 4 7 22.0
Georges (S) 15 5 8 30.3
Holland Straits 9 48 71 31.7
Sharkfin Shoal 16 18 24 33.9
Back Cove 11 19 14 25.4
Piney Island East 7 10 9 29.5
Old Woman’s Leg 50 75 15 32.4
Marumsco 13 13 17 25.5
Broome Island 7 8 14 22.2
Chicken Cock 1 7 16 28.2
Pagan (S) 4 13 22 21.6
Lancaster 13 0 3 16.4
Mills West 20 9 5 15.5
Cornfield Harbor 10 16 10 30.1
Ragged Point 0 0 50 23.9
Lower Cedar Point 0 0 6 12.4
Annual Means 8 11 14 23.3
(Return to Text)
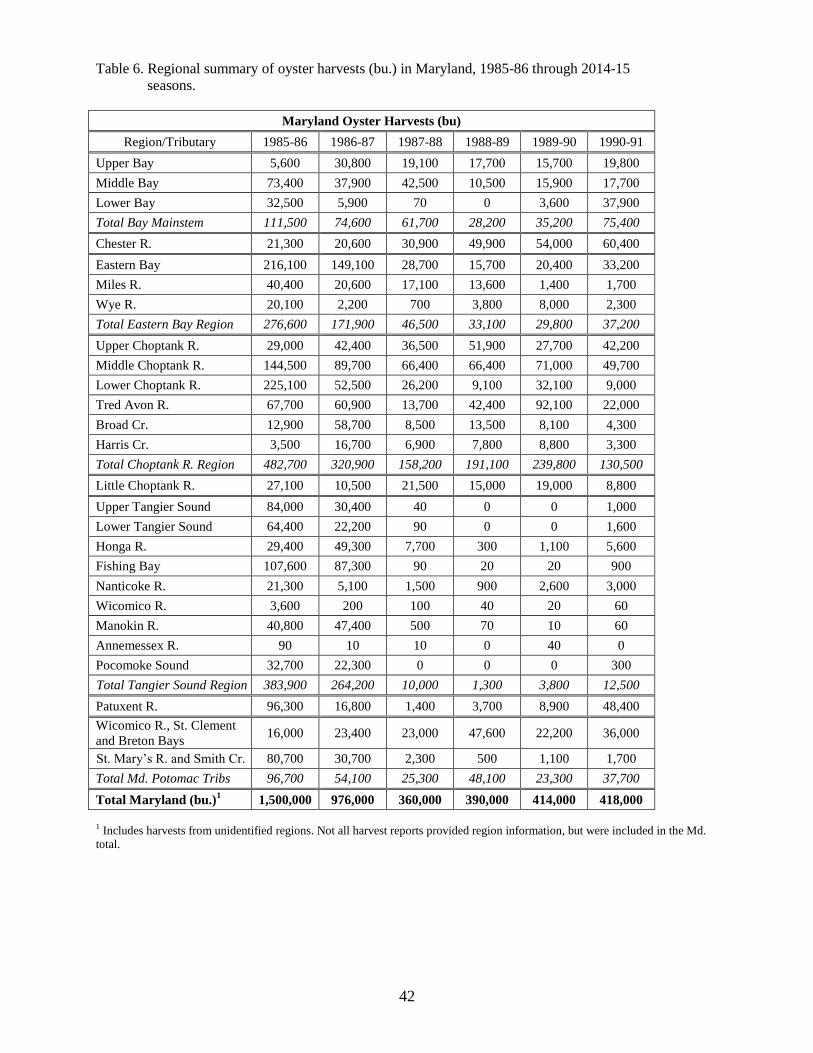
42
Table 6. Regional summary of oyster harvests (bu.) in Maryland, 1985-86 through 2014-15
seasons.
Maryland Oyster Harvests (bu)
Region/Tributary 1985-86 1986-87 1987-88 1988-89 1989-90 1990-91
Upper Bay 5,600 30,800 19,100 17,700 15,700 19,800
Middle Bay 73,400 37,900 42,500 10,500 15,900 17,700
Lower Bay 32,500 5,900 70 0 3,600 37,900
Total Bay Mainstem 111,500 74,600 61,700 28,200 35,200 75,400
Chester R. 21,300 20,600 30,900 49,900 54,000 60,400
Eastern Bay 216,100 149,100 28,700 15,700 20,400 33,200
Miles R. 40,400 20,600 17,100 13,600 1,400 1,700
Wye R. 20,100 2,200 700 3,800 8,000 2,300
Total Eastern Bay Region 276,600 171,900 46,500 33,100 29,800 37,200
Upper Choptank R. 29,000 42,400 36,500 51,900 27,700 42,200
Middle Choptank R. 144,500 89,700 66,400 66,400 71,000 49,700
Lower Choptank R. 225,100 52,500 26,200 9,100 32,100 9,000
Tred Avon R. 67,700 60,900 13,700 42,400 92,100 22,000
Broad Cr. 12,900 58,700 8,500 13,500 8,100 4,300
Harris Cr. 3,500 16,700 6,900 7,800 8,800 3,300
Total Choptank R. Region 482,700 320,900 158,200 191,100 239,800 130,500
Little Choptank R. 27,100 10,500 21,500 15,000 19,000 8,800
Upper Tangier Sound 84,000 30,400 40 0 0 1,000
Lower Tangier Sound 64,400 22,200 90 0 0 1,600
Honga R. 29,400 49,300 7,700 300 1,100 5,600
Fishing Bay 107,600 87,300 90 20 20 900
Nanticoke R. 21,300 5,100 1,500 900 2,600 3,000
Wicomico R. 3,600 200 100 40 20 60
Manokin R. 40,800 47,400 500 70 10 60
Annemessex R. 90 10 10 0 40 0
Pocomoke Sound 32,700 22,300 0 0 0 300
Total Tangier Sound Region 383,900 264,200 10,000 1,300 3,800 12,500
Patuxent R. 96,300 16,800 1,400 3,700 8,900 48,400
Wicomico R., St. Clement
and Breton Bays 16,000 23,400 23,000 47,600 22,200 36,000
St. Mary’s R. and Smith Cr. 80,700 30,700 2,300 500 1,100 1,700
Total Md. Potomac Tribs 96,700 54,100 25,300 48,100 23,300 37,700
Total Maryland (bu.)1 1,500,000 976,000 360,000 390,000 414,000 418,000
1 Includes harvests from unidentified regions. Not all harvest reports provided region information, but were included in the Md.
total.

43
Table 6 - Landings (continued).
Maryland Oyster Harvests (bu)
Region/Tributary 1991-92 1992-93 1993-94 1994-95 1995-96 1996-97
Upper Bay 35,200 18,200 8,900 7,800 26,600 2,600
Middle Bay 39,200 9,000 4,400 4,900 12,600 20,000
Lower Bay 9,300 90 0 1,100 800 300
Total Bay Mainstem 83,800 27,300 13,300 13,800 40,000 22,800
Chester R. 55,100 53,800 51,300 29,100 42,600 5,400
Eastern Bay 20,600 3,600 2,400 3,700 1,500 1,100
Miles R. 100 300 0 200 200 500
Wye R. 300 20 30 50 0 0
Total Eastern Bay Region 21,000 3,900 2,400 4,000 1,700 1,600
Upper Choptank R. 29,200 9,500 2,600 2,500 11,600 3,200
Middle Choptank R. 25,000 3,100 1,600 4,900 15,000 4,700
Lower Choptank R. 14,200 1,700 900 600 900 300
Tred Avon R. 800 0 0 5,900 1,300 3,800
Broad Cr. 40 50 10 400 1,000 4,000
Harris Cr. 100 20 0 14,200 5,000 13,600
Total Choptank R. Region 69,300 14,400 5,100 28,500 34,800 29,600
Little Choptank R. 3,800 50 300 19,300 1,900 40,800
Upper Tangier Sound 11,300 70 0 17,600 12,100 8,100
Lower Tangier Sound 1,700 40 0 5,400 500 10,100
Honga R. 600 20 100 1,700 400 200
Fishing Bay 6,400 500 30 11,900 20,900 8,800
Nanticoke R. 12,500 7,700 2,500 10,500 15,200 23,000
Wicomico R. 600 500 500 80 100 1,400
Manokin R. 200 40 10 100 0 900
Annemessex R. 10 0 0 0 0 0
Pocomoke Sound 500 0 0 100 0 300
Total Tangier Sound Region 33,800 8,900 3,100 47,400 49,200 52,800
Patuxent R. 24,500 0 0 30 100 20
Wicomico R., St. Clement
and Breton Bays 29,600 14,900 4,000 18,200 27,500 7,300
St. Mary’s R. and Smith Cr. 100 60 30 3,900 900 16,200
Total Potomac Md. Tribs 29,000 15,000 4,000 22,100 28,400 23,500
Total Maryland (bu.)1 323,000 124,000 80,000 165,000 200,000 178,000
1 Includes harvests from unidentified regions.

44
Table 6 - Landings (continued).
Maryland Oyster Harvests (bu)
Region/Tributary 1997-98 1998-99 1999-00 2000-01 2001-02 2002-03
Upper Bay 18,800 13,100 28,100 31,150 16,100 18,930
Middle Bay 15,300 55,800 31,500 16,400 4,550 2,410
Lower Bay 4,800 8,300 3,800 2,050 600 50
Total Bay Mainstem 38,900 77,200 63,400 49,600 21,250 21,390
Chester R. 43,000 21,000 70,100 20,800 29,450 11,830
Eastern Bay 3,800 30,900 75,800 120,500 33,400 4,650
Miles R. 30 800 35,700 20,150 6,600 50
Wye R. 400 900 9,400 11,300 1,800 60
Total Eastern Bay Region 4,200 32,600 120,900 151,950 41,800 4,760
Upper Choptank R. 4,800 3,100 7,100 1,100 7,450 10
Middle Choptank R. 5,600 2,800 1,900 8,150 5,600 520
Lower Choptank R. 200 2,400 8,300 350 1,500 40
Tred Avon R. 6,900 11,700 3,700 8,950 1,000 40
Broad Cr. 27,600 46,200 18,200 36,850 4,900 700
Harris Cr. 21,400 67,000 18,200 26,200 3,300 30
Total Choptank R. Region 66,500 133,200 57,400 81,600 23,750 1,340
Little Choptank R. 36,100 84,100 33,600 27,850 2,400 190
Upper Tangier Sound 6,000 3,500 1,500 100 5,050 3,570
Lower Tangier Sound 4,200 8,500 2,800 1,450 13,200 5,960
Honga R. 1,300 300 50 0 50 590
Fishing Bay 3,800 700 90 0 0 390
Nanticoke R. 30,300 21,700 8,800 600 2,700 540
Wicomico R. 2,200 1,400 500 50 50 10
Manokin R. 600 300 90 200 1,850 970
Annemessex R. 0 0 200 0 0 0
Pocomoke Sound 400 80 100 10 20 0
Total Tangier Sound Region 48,800 36,500 14,100 2,400 22,920 12,030
Patuxent R. 60 5,600 2,000 10 0 0
Wicomico R., St. Clement
and Breton Bays 10,200 13,700 8,800 2,600 1,400 220
St. Mary’s R. and Smith Cr. 36,700 16,400 4,500 6,150 1,650 0
Total Potomac Md. Tribs 46,900 30,100 13,300 8,750 3,050 220
Total Maryland (bu.)1 285,000 423,000 381,000 348,000 148,000 56,000
1 Includes harvests from unidentified regions.

45
Table 6 - Landings (continued).
Maryland Oyster Harvests (bu)
Region/Tributary 2003-04 2004-05 2005-06 2006-07 2007-08 2008-09
Upper Bay 2,210 1,632 17,420 14,052 13,601 7,020
Middle Bay 750 295 17,346 17,004 3,728 1,870
Lower Bay 187 1,801 269 642 2,077 5,554
Total Bay Mainstem 3,147 3,728 35,035 31,698 19,406 14.444
Chester R. 557 3,239 4,385 7,201 4,685 4,826
Eastern Bay 5,446 16,767 49,120 36,268 8,582 7,390
Miles R. 56 353 3,660 1,133 27 910
Wye R. 0 173 122 0 0 12
Total Eastern Bay Region 5,502 17,293 52,902 37,401 8,609 8,312
Upper Choptank R. 0 78 591 11 95 15
Middle Choptank R. 30 67 967 2,510 597 597
Lower Choptank R. 0 267 1,250 3,037 2,426 2,535
Tred Avon R. 0 139 149 157 61 112
Broad Cr. 954 1,342 14,006 53,577 20,413 6,097
Harris Cr. 12 71 4,429 5,342 3,308 1,900
Total Choptank R. Region 996 1,964 21,392 64,634 26,900 11,256
Little Choptank R. 1,150 144 3,534 4,218 1,516 1,163
Upper Tangier Sound 7,630 13,658 2,874 3,856 4,614 12,454
Lower Tangier Sound 5,162 15,648 5,828 1,996 8,970 19,600
Honga R. 378 2,744 270 154 860 17,305
Fishing Bay 24 106 6 0 197 3,320
Nanticoke R. 57 965 387 97 97 134
Wicomico R. 0 0 0 30 11 118
Manokin R. 1,638 2,816 737 91 364 184
Annemessex R. 0 5 108 17 5 13
Pocomoke Sound 0 2,676 1,071 277 1,051 765
Total Tangier Sound Region 14,889 38,618 11,281 6,518 16,169 53,893
Patuxent R. 0 466 17,808 7,316 831 1,258
Wicomico R., St. Clement
and Breton Bays 13 18 1,414 80 698 808
St. Mary’s R. and Smith Cr. 0 91 1,863 2,069 1,252 1,643
Total Potomac Md. Tribs 13 109 3,277 2,149 1,950 2,451
Total Maryland (bu.)1 26,000 72,000 154,000 165,000 83,000 101,000
1 Includes harvests from unidentified regions.

46
Table 6 - Landings (continued).
Maryland Oyster Harvests (bu)
Region/Tributary 2009-10 2010-11 2011-12 2012-13 2013-14 2014-15 30-yr Avg.
Upper Bay 8,723 6,310 297 19 45 606 13,537
Middle Bay 4,012 2,054 439 4,310 9,218 7,321 16,077
Lower Bay 14,927 2,759 2,249 8,134 13,670 12,298 5,858
Total Bay Mainstem 27,662 11,123 2,985 12,463 22,933 20,224 34,992
Chester R. 2,874 5,290 119 102 556 3,493 23,597
Eastern Bay 2,662 1,957 221 4,966 15,650 8,763 30,765
Miles R. 11 12 81 82 727 1,871 5,612
Wye R. 227 0 9 0 0 73 2,066
Total Eastern Bay Region 2,900 1,969 311 5,048 16,377 10,707 38,441
Upper Choptank R. 42 412 0 149 213 73 10,451
Middle Choptank R. 661 523 1,598 1,725 4,032 5,548 19,514
Lower Choptank R. 3,424 3,534 3,402 11,336 12,934 26,008 15,185
Tred Avon R. 0 68 402 1,095 2,038 2,850 11,665
Broad Cr. 5,328 7,646 11,382 72,643 76,125 62,436 19,263
Harris Cr. 1,227 191 100 3,043 3,353 8,112 8,238
Total Choptank R. Region 10,682 12,374 16,884 89,991 98,695 105,028 84,316
Little Choptank R. 923 0 568 1,216 2,137 5,044 12,463
Upper Tangier Sound 24,553 19,098 24,076 40,143 57,853 53,270 14,947
Lower Tangier Sound 61,771 27,849 29,578 38,802 45,301 25,660 14,277
Honga R. 24,696 10,213 10,391 20,182 24,594 22,122 7,754
Fishing Bay 14,949 10,174 13,852 51,038 61,909 39,054 14,802
Nanticoke R. 2,168 5,300 10,121 8,385 6,558 14,924 7,321
Wicomico R. 109 1,140 3,587 5,551 4,253 3,748 999
Manokin R. 888 1,477 1,731 84 1,863 3,158 3,638
Annemessex R. 0 1,036 546 79 730 576 116
Pocomoke Sound 1,165 855 3,859 35,193 33,343 18,262 5,178
Total Tangier Sound Region 130,299 77,142 97,741 199,457 236,404 180,773 69,028
Patuxent R. 3,456 6,535 8,419 13,764 19,984 45,781 11,115
Wicomico R., St. Clement
and Breton Bays 712 2,132 1,931 4,504 6,383 3,822 10,971
St. Mary’s R. and Smith Cr. 3,186 2,275 1,454 11,345 7,909 10,775 8,248
Total Potomac Md. Tribs 3,898 4,407 3,385 15,849 14,292 14,597 19,197
Total Maryland (bu.)1 185,245 123,613 137,317 341,232 416,578 388,658 298,755
. 1 Includes harvests from unidentified regions.
(Return to Text)

47
Table 7a. Bushels of oyster harvest by gear type in Maryland, 1989-90 through 2014-15 seasons.
Dockside value is in millions of dollars.
Season Hand Tongs Diver Patent
Tongs
Power
Dredge Skipjack
Total
Harvest1
Dockside
Value
1989-90 309,723 47,861 31,307 11,424 14,007 414,445 $ 9.9 M
1990-91 219,510 74,333 105,825 4,080 14,555 418,393 $ 9.4 M 1991-92 124,038 53,232 108,123 6,344 31,165 323,189 $ 6.4 M 1992-93 71,929 24,968 18,074 1,997 8,821 123,618 $ 2.6 M 1993-94 47,309 19,589 11,644 787 133 79,618 $ 1.4 M 1994-95 99,853 29,073 31,388 1,816 2,410 164,641 $ 3.2 M 1995-96 115,677 25,657 46,040 6,347 7,630 199,798 $ 3.2 M 1996-97 130,861 16,780 15,716 8,448 6,088 177,600 $ 3.8 M 1997-98 191,079 37,477 30,340 14,937 10,543 284,980 $ 5.7 M 1998-99 294,342 58,837 36,151 25,541 8,773 423,219 $ 7.8 M 1999-2000 237,892 60,547 44,524 18,131 12,194 380,675 $ 7.2 M 2000-01 193,259 75,535 43,233 18,336 8,820 347,968 $ 6.8 M 2001-02 62,358 30,284 26,848 17,574 8,322 148,155 $ 2.9 M 2002-03 11,508 9,745 18,627 12,386 2,432 55,840 $ 1.6 M 2003-04 1,561 5,422 3,867 13,436 1,728 26,471 $ 0.7 M 2004-05 5,438 14,258 6,548 37,641 4,000 72,218 $ 1.1 M 2005-06 28,098 38,460 49,227 30,824 3,576 154,436 $ 4.7 M 2006-07 55,906 36,271 31,535 35,125 3,250 165,059 $ 5.0 M 2007-08 24,175 11,745 15,997 25,324 4,243 82,958 $ 2.6 M 2008-09 11,274 9,941 15,833 50,628 5,370 101,141 $ 2.7 M
2009-10 7,697 6,609 48,969 107,952 12,479 185,245 $4.5 M
2010-11 13,234 5,927 27,780 65,445 10,550 123,613 $4.3 M
2011-12 4,885 12,382 22,675 84,950 11,305 137,317 $4.6M
2012-13 53,622 8,107 48,095 212,837 18,471 341,132 $10.9 M
2013-14 67,093 21,510 75,937 242,964 9,074 416,578 $14.1 M
2014-15 57,289 25,126 98,187 154,716 33,518 388,658 $17.1 M
1 Harvest reports without gear information were not included in harvest by gear type totals but were included in total harvest.
(Return to Text)

48
Table 7b. Percent of oyster harvest by gear type in Maryland, 1989-90 through 2014-15 seasons.
Some years may not total 100% due to incomplete data.
Season Hand Tongs Diver Patent Tongs Power Dredge Skipjack
1989-90 75 12 8 3 3
1990-91 52 18 25 1 3
1991-92 38 16 33 2 10
1992-93 57 20 14 2 7
1993-94 60 25 15 <1 <1
1994-95 61 18 19 1 1
1995-96 57 13 23 3 4
1996-97 74 9 9 5 3
1997-98 67 13 11 5 4
1998-99 69 14 9 6 2
1999-2000 62 16 12 5 3
2000-01 56 22 12 5 3
2001-02 41 20 18 12 6
2002-03 21 17 33 22 4
2003-04 6 20 15 51 7
2004-05 8 20 9 52 6
2005-06 18 25 32 20 2
2006-07 34 22 19 21 2
2007-08 29 14 19 30 5
2008-09 12 11 17 54 6
2009-10 4 4 26 58 7
2010-11 11 5 23 53 8
2011-12 4 9 17 62 8
2012-13 16 2 14 62 5
2013-14 16 5 18 58 2
2014-15 16 7 27 42 9
(Return to Text)

49
Table 8. Oyster bars within sanctuaries sampled during the 2015 Fall Survey.
Region Oyster Sanctuary Surveyed Bars Within Sanctuary Upper Bay Man O War/Gales Lump Man O War Shoals
Middle Bay
Poplar Island Poplar I.
Herring Bay Holland Pt.1,2
Calvert Shore Flag Pond1,2
Lower Bay
Lower Mainstem East Northwest Middleground
Cedar Point Cedar Point Hollow
Point Lookout Pt. Lookout
Chester River
Lower Chester River Love Pt., Strong Bay, Wickes Beach
Upper Chester River Boathouse, Cliff, Drum Pt., Ebb Pt., Emory Hollow, Old
Field2, Sheep
Chester ORA Zone A Shippen Creek
Eastern Bay Mill Hill Mill Hill
Cox Creek Ringold Middleground
Wye River Wye River Bruffs I.
1,2, Mills, Race Horse, Whetstone, Wye River
Middleground
Miles River Miles River Long Pt. 2
Choptank River
Cook Point Cook Pt. 1,2
Lower Choptank River Chlora Pt.
Sandy Hill Hambrooks, Sandy Hill1,2
Howell Point - Beacons Beacons
States Bank Green Marsh, Shoal Creek
Upper Choptank River Bolingbroke Sand, The Black Buoy, Oyster Shell Pt. 2
Choptank ORA Zone A Dixon, Mill Dam, Tanners Patch, Cabin Creek, Drum Pt.
Harris Creek Harris Creek Change, Mill Pt. 1, Seths Pt., Walnut, Little Neck, Rabbit I.
Tred Avon River Tred Avon River Pecks Pt., Mares Pt., Louis Cove, Orem, Double Mills
1,2,
Maxmore Add. 1
Little Choptank
River
Little Choptank River Susquehanna, Cason1,2
, Butterpot, McKeils Pt., Grapevine,
Town, Pattison
Hooper Straits Hooper Straits Applegarth, Lighthouse
Nanticoke River Nanticoke River Roaring Pt. East, Wilson Shoals
2, Bean Shoal, Cherry Tree,
Cedar Shoal, Old Woman’s Patch, Hickory Nut, Wetipquin1
Manokin River Manokin River Piney I. Swash, Mine Creek, Marshy I., Drum Pt. 1, Georges
1,2
Tangier Sound Somerset Piney I. East Add. 1
Severn River Severn River Chinks Pt.
Patuxent River Upper Patuxent Thomas, Broad Neck, Trent Hall, Buzzard I., Holland Pt.
Neal Addition Neale
St. Marys River St. Marys River Pagan1,2
, Horseshoe
Breton Bay Breton Bay Black Walnut1, Blue Sow
1
1 Key Spat Bar
2 Disease Bar
(Return to Text)

50
APPENDIX 1 OYSTER HOST & OYSTER PATHOGENS
Chris Dungan, Maryland DNR
Oysters The eastern oyster Crassostrea virginica is found in waters with temperatures of -2°C to 36°C
(28 - 97°F) and sustained salinities of 4‰ to 40‰ (ppt), where ocean water has 35‰ salinity.
Oysters reproduce when both sexes simultaneously spawn their gametes into Chesapeake Bay
waters. Spawning occurs from May - September, and peaks during June - July. Externally
fertilized eggs develop into swimming planktonic larvae that are transported by water currents
for 2-3 weeks, while feeding on phytoplankton as they grow and develop. Mature larvae seek
solid benthic substrates, preferably oyster shells, to which they attach as they metamorphose to
become sessile juvenile oysters. Unlike fishes and other vertebrates, oysters do not regulate the
salt content of their tissues; instead, the salt content of oyster tissues conforms to the broad and
variable range of salinities in oyster habitats. Thus, oyster parasites with narrow salinity
requirements may be exposed to low environmental salinities when shed into environmental
waters, as well as while infecting oysters in low-salinity waters. At death, an oyster’s shell valves
spring open passively, exposing its tissues to predators and scavengers. However, the resilient
hinge ligament holds the articulated valves together for months after death. Vacant, articulated
oyster shells (boxes) in our samples are interpreted to represent oysters that died during the
previous year, and the numbers of dead and dying (gaper) oysters are compared to those of live
oysters in dredge samples, to estimate proportions for natural mortalities in oyster samples and
populations.
Dermo disease Although the protozoan parasite that causes dermo disease is now known as Perkinsus marinus,
it was first described as Dermocystidium marinum in Gulf of Mexico oysters (Mackin, Owen & Collier 1950), and its name was colloquially abbreviated then as ‘dermo’. Almost immediately,
dermo disease was also reported in Chesapeake Bay oysters (Mackin 1951). Perkinsus marinus
is transmitted through the water to uninfected oysters in as few as three days, and such infections
Ciliated oyster stomach epithelium infected by clusters
of proliferating P. marinus cells (<).
may prove fatal in as few as 18 days. Heavily
infected oysters are emaciated; showing reduced
growth and reproduction (Ray & Chandler 1955).
Although P. marinus survives low temperatures
and low salinities, its proliferation is highest in the
broad range of temperatures (15-35°C) and
salinities (10-30‰) that are typical of Chesapeake
Bay waters during oyster dermo disease mortality
peaks (Dungan & Hamilton 1995). Over several
years of drought during the 1980s, P. marinus
expanded its Chesapeake Bay distribution into
upstream areas where it had been previously rare
or absent (Burreson & Ragone Calvo 1996). Since
1990, at least some oysters in 93-100% of all
regularly tested Maryland populations have been
infected. Annual mean prevalences for dermo
disease have ranged at 38-94% of all tested
oysters, with a 26-year average of 68%.

51
MSX disease The high-salinity protozoan oyster pathogen Haplosporidium nelsoni was first detected and
described as a multinucleated sphere unknown (MSX) from diseased and dying Delaware Bay
Oyster gill vein with large Haplosporidium nelsoni
(MSX) multinucleate plasmodia (>) circulating with
smaller hemocyte blood cells.
oysters during 1957 (Haskin et al. 1966), and it
also infected oysters in lower Chesapeake Bay
during 1959 (Andrews 1968). Although the
common location of lightest H. nelsoni
infections in oyster gill tissues suggests
waterborne transmission of infectious pathogen
cells, the complete life cycle and actual
infection mechanism of the MSX parasite
remain unknown.
Despite numerous experimental attempts,
MSX disease has rarely been transmitted to
uninfected oysters in laboratories. However,
captive experimental oysters reared in enzootic
waters above 14‰ salinity are frequently
infected, and may die within 3-6 weeks. In
Chesapeake Bay, MSX disease is most active
in higher salinity waters with temperatures of
5-20°C (Ewart & Ford 1993). MSX disease
prevalences typically peak during June, and
deaths from such infections peak during
August. In Maryland waters, annual average
prevalences for MSX disease have ranged at
0.1-28%, with a 26-year mean of 6%.
Since MSX disease is rare in oysters from waters below 9‰ salinity, the distribution of H.
nelsoni in Chesapeake Bay varies as salinities change with variable freshwater inflows. During a
recent 1999-2002 drought, consistently low freshwater inflows raised salinities of Chesapeake
Bay waters to foster upstream range expansions by MSX disease during each successive drought
year (Tarnowski 2003). The geographic range for MSX disease also expanded widely during a
recent 2009 epizootic. During 2003-2008 and 2010-2012, freshwater inflows near or above
historic averages reduced salinities of upstream Chesapeake Bay waters to dramatically limit the
geographic range and effects of MSX disease (Tarnowski 2014). Since 2013, the geographic
range of MSX disease has expanded further upstream each year, and its mean annual prevalence
has approximately doubled during successive years.
References
Andrews, J.D. 1968. Oyster mortality studies in Virginia VII. Review of epizootiology and
origin of Minchinia nelsoni. Proc. Natl. Shellfish. Assn. 58:23-36.
Burreson, E.M. and L.M. Ragone Calvo. 1996. Epizootiology of Perkinsus marinus disease in
Chesapeake Bay, with emphasis on data since 1985. J. Shellfish Res. 15:17-34.
Dungan, C.F. and R.M. Hamilton. 1995. Use of a tetrazolium-based cell proliferation assay to
measure effects of in vitro conditions on Perkinsus marinus (Apicomplexa) proliferation.
J. Eukaryot. Microbiol. 42:379-388.
Ewart, J.W. and S.E. Ford. 1993. History and impact of MSX and dermo diseases on oyster
stocks in the Northeast region. NRAC Fact Sheet No. 200, 8 pp. Univ. of Massachusetts,
North Dartmouth, Ma.

52
Haskin, H.H., L.A. Stauber, and J.G. Mackin. 1966. Minchinia nelsoni n. sp. (Haplosporida,
Haplosporidiidae): causative agent of the Delaware Bay oyster epizootic. Science
153:1414-1416.
Ray, S.M. and A.C. Chandler. 1955. Parasitological reviews: Dermocystidium marinum, a
parasite of oysters. Exptl. Parasitol. 4:172-200.
Mackin, J.G., H.M. Owen, and A. Collier. 1950. Preliminary note on the occurrence of a new
protistan parasite, Dermocystidium marinum n. sp. in Crassostrea virginica (Gmelin).
Science 111:328-329.44
Mackin, J.G. 1951. Histopathology of infection of Crassostrea virginica (Gmelin) by
Dermocystidium marinum Mackin, Owen, and Collier. Bull Mar. Sci. Gulf and Caribbean
1:72-87.
Tarnowski, M. 2003. Maryland Oyster Population Status Report: 2002 Fall Survey. Maryland
Department of Natural Resources, Annapolis, MD. 32 pp.
http://dnr2.maryland.gov/fisheries/Pages/shellfish-monitoring/reports.aspx
Tarnowski, M. 2014. Maryland Oyster Population Status Report: 2013 Fall Survey. Maryland
Department of Natural Resources Publ. No. 17-8192014-723. Annapolis, MD. 45 pp.
http://dnr2.maryland.gov/fisheries/Pages/shellfish-monitoring/reports.aspx

53
APPENDIX 2 GLOSSARY
box oyster Pairs of empty shells joined together by their hinge ligaments. These remain
articulated for months after the death of an oyster, providing a durable estimator
of recent oyster mortality (see gaper). Recent boxes are those with no or little
fouling or sedimentation inside the shells, generally considered to have died
within the previous two to four weeks. Old boxes have heavier fouling or
sedimentation inside the shells and the hinge ligament is generally weaker.
bushel Unit of volume used to measure oyster catches. The official Maryland bushel is
equal to 2,800.9 cu. in., or 1.0194 times the U.S. standard bushel (heaped) and
1.3025 times the U.S. standard bushel (level). (Return to Text)
cultch Hard substrate, such as oyster shells, spread on oyster grounds for the attachment
of spat.
dermo disease The oyster disease caused by the protozoan pathogen Perkinsus marinus.
dredged shell Oyster shell dredged from buried ancient (3000+ years old) shell deposits. Since
1960 this shell has been the backbone of the Maryland shell planting efforts to
produce seed oysters and restore oyster bars.
fresh shell Oyster shells from shucked oysters. It is used to supplement the dredged shell
plantings.
gaper Dead or moribund oyster with gaping valves and tissue still present (see box
oyster).
Haplosporidium The protozoan oyster parasite that causes MSX disease.
nelsoni
infection intensity, Perkinsus sp. parasite burdens of individual oysters, estimated by RFTM
individual assays and categorized on an eight-point scale. Uninfected oysters are ranked 0,
heaviest infections are ranked 7, and intermediate-intensity infections are ranked
1-6. Oysters with infection intensities of 5 or greater are predicted to die
imminently.
infection intensity, Averaged categorical infection intensity for all oysters in a sample:
mean sample sum of all categorical infection intensities (0-7) ÷
number of sample oysters
Oyster populations whose samples show mean infection intensities of 3.0 or
greater are predicted to experience significant near-term mortalities.
infection intensity, Average of mean intensities for annual survey samples from constant mean
annual sites:
sum of all sample mean intensities ÷ number of annual samples
intensity index, Categorical infection intensities averaged only for infected oysters:
sample sum of individual infection intensities(1-7) ÷
number of infected oysters

54
intensity index, Categorical infection intensities averaged for all infected survey oysters:
annual sum of all sample intensity indices ÷ number of annual samples
market oyster An oyster measuring 3 inches or more from hinge to mouth (ventral margin).
mortality Percent proportion of annual, natural oyster population mortality
(observed), sample estimated by dividing the number of dead oysters (boxes and gapers) by the sum
of live and dead oysters in a sample:
100 x [number of boxes and gapers ÷
(number of boxes and gapers + number of live)]
mortality Percent proportion of annual, bay-wide, natural oyster mortality
(observed), annual estimated by averaging population mortality estimates from the 43 Disease Bar
(DB) samples collected during an annual survey:
sum of sample mortality estimates ÷ 43 DB samples
MSX disease The oyster disease caused by the protozoan pathogen Haplosporidium nelsoni.
MSX % frequency, Percent proportion of sampled populations infected by H. nelsoni
annual (MSX):
100 x (number of sample with MSX infections ÷ total sample number)
Perkinsus marinus The protozoan oyster parasite that causes dermo disease.
prevalence, Percent proportion of infected oysters in a sample:
sample 100 x (number infected ÷ number examined)
prevalence, Percent proportion of infected oysters in an annual survey:
mean annual sum of sample percent prevalences ÷ number of samples
RFTM assay Ray’s fluid thioglycollate medium assay. Method for enlargement, detection, and
enumeration of Perkinsus marinus cells in oyster tissue samples. This diagnostic
assay for dermo disease has been widely used and refined for over sixty years to
date.
seed oysters Young oysters produced by planting shell as a substrate for oyster larvae to settle
on in historically productive areas. If the spatfall is adequate, the seed oysters are
subsequently transplanted to growout (seed planting) areas, generally during the
following spring.
small oyster An oyster equal to or greater than one year old but less than 3 inches (see market
oyster, spat).
spat Oysters younger than one year old.
spatfall, spatset, The process by which swimming oyster larvae attach to a hard
set substrate such as oyster shell. During this process the larvae undergo
metamorphosis, adopting the adult form and habit.
spatfall intensity, The number of spat per bushel of cultch. This is a relative measure of
sample site density used to calculate the spat index.
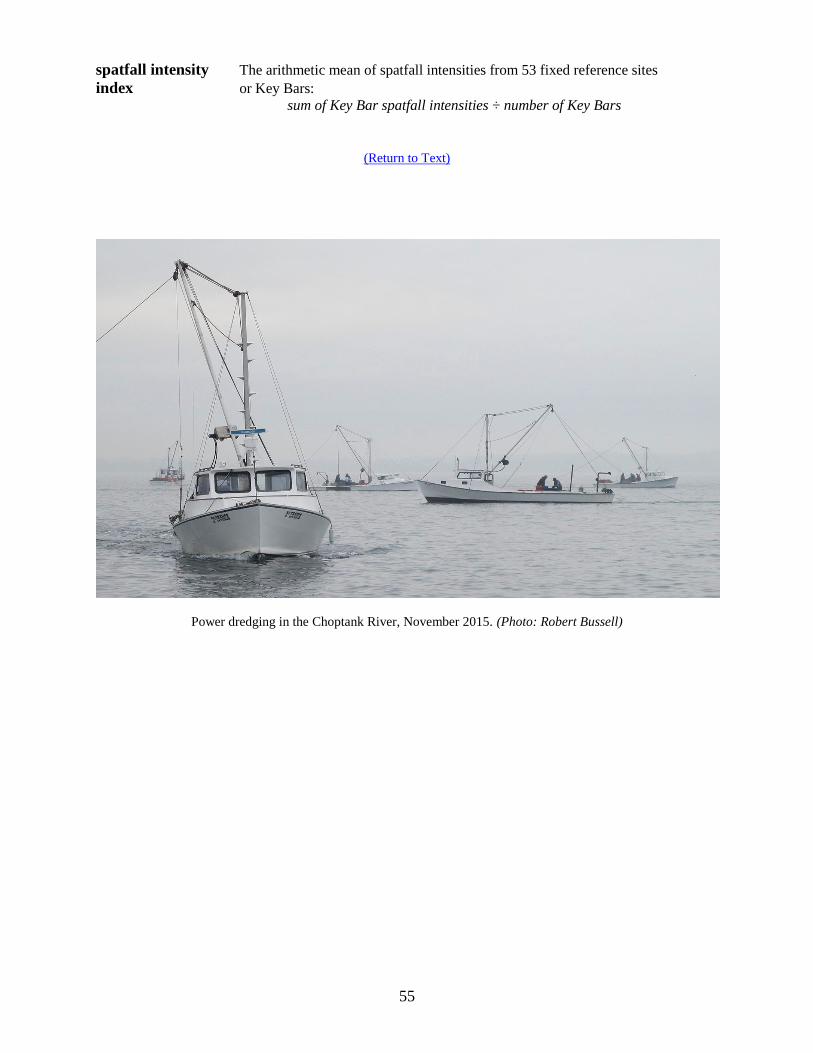
55
spatfall intensity The arithmetic mean of spatfall intensities from 53 fixed reference sites
index or Key Bars:
sum of Key Bar spatfall intensities ÷ number of Key Bars
(Return to Text)
Power dredging in the Choptank River, November 2015. (Photo: Robert Bussell)