maryland voluntary market - maryland workers … largest workers comp writers 17 ... ncci key...
TRANSCRIPT

MARYLAND
Voluntary Market
PURE PREMIUMS and RATING VALUES PROPOSED EFFECTIVE NOVEMBER 1, 2003

© 2003 National Council on Compensation Insurance, Inc.
© 2003 National Council on Compensation Insurance, Inc. The enclosed materials are copyrighted materials of the National Council on Compensation Insurance, Inc. ("NCCI") The use of these materials may be governed by a separate contractual agreement between NCCI and its licensees such as an affiliation agreement between you and NCCI. Unless permitted by NCCI, you may not copy, create derivative works, (by way of example, create or supplement your own works, databases, software, publications, manuals, or other materials) display, perform, or use the materials, in whole or in part, in any media. Such actions taken by you, or by your direction, may be in violation of federal copyright and other commercial laws. NCCI does not permit or acquiesce such use of its materials. In the event such use is contemplated or desired, please contact NCCI's Legal Department for permission.

Maryland
© 2003 National Council on Compensation Insurance, Inc.
TABLE OF CONTENTS
BACKGROUND AND FILING PROCEDURE 1
SUMMARY OF PROPOSED CHANGE IN LOSS COSTS 2
KEY COMPONENT – EXPERIENCE, TREND AND BENEFITS 3
EXPERIENCE 3
TREND 4
BENEFITS 11
CONCLUSION 12
EXHIBITS 13
HISTORICAL LOSS COST CHANGES 13
RECENT KEY LEGISLATION 14
MARYLAND WRITTEN PREMIUM 16
MARYLAND LARGEST WORKERS COMP WRITERS 17
PROPOSED LOSS COSTS AND RATING VALUES
NCCI KEY CONTACTS APPENDIX – NCCI AFFILIATES

Maryland
© 2003 National Council on Compensation Insurance, Inc. 1
BACKGROUND AND FILING PROCEDURE The workers compensation benefit system in Maryland is designed to cover medical costs associated with workplace injuries, as well as provide wage replacement (indemnity) benefits to injured workers for lost work time. The National Council on Compensation Insurance, Inc. (NCCI) collects an extensive amount of information regarding the workers compensation system in Maryland, and submits proposed advisory prospective loss costs for review and approval by the Maryland Commissioner of Insurance. These advisory prospective loss costs are intended to cover the indemnity and medical benefits provided under the system. They do not, however, contemplate any other costs associated with providing workers compensation insurance (such as commissions, taxes, etc.), or the expenses associated with providing these benefits (loss adjustment expenses). Each insurance company offering workers compensation insurance in Maryland must file a loss cost multiplier to be applied to the approved advisory prospective loss costs in order to compute the final workers compensation rates that they intend to charge. This multiplier is intended to cover the other costs associated with providing workers compensation insurance that are not already part of the advisory prospective loss costs. Alternatively, insurance companies may opt to not adopt these loss costs and make an independent filing instead. In this filing, NCCI is proposing that the Commissioner of Insurance approves a 4.7% decrease in the current loss costs (which went into effect on January 1, 2003), and that the new loss costs take effect on November 1, 2003. This document will explain why this decrease is necessary. NCCI separately determines loss costs for each workers compensation classification. In this filing, the actual change from the current loss cost is different depending on the classification. In fact, the loss costs for some classifications would increase if this filing is approved. Employers unable to secure coverage in the voluntary market can apply for such coverage from the Injured Workers’ Insurance Fund in Maryland.

Maryland
© 2003 National Council on Compensation Insurance, Inc. 2
SUMMARY OF PROPOSED CHANGE IN LOSS COSTS Key Components Percentage Change Experience, Trend and Benefits -9.4% Impact of Attorney fee Change +3.1% Impact of Harris vs. Board of Educ.of Howard County +2.0% Overall Change Requested -4.7% A brief discussion of each of these key components follows this page. The change in loss costs varies depending on the classification. Each classification belongs to one of five industry groups. The average change proposed for each of these five groups is displayed below, as well as the largest increase and largest decrease possible for a classification in each of those groups.
OVERALL CHANGE -4.7%
CONTRACTING -0.5%
Maximum Increase +25% Maximum Decrease -25%
MANUFACTURING -10.3%
Maximum Increase +15% Maximum Decrease -35%
OFFICE & CLERICAL -6.7%
Maximum Increase +18% Maximum Decrease -32%
MISCELLANEOUS -6.2%
Maximum Increase +19% Maximum Decrease -31%
GOODS & SERVICES -5.3%
Maximum Increase +20% Maximum Decrease -30%

Maryland
© 2003 National Council on Compensation Insurance, Inc. 3
KEY COMPONENT – EXPERIENCE, TREND AND BENEFITS This key component has three main parts. EXPERIENCE NCCI reviewed the emerging experience of Maryland workers compensation policies in recent years. The primary focus of our review was on premiums and losses from Policy Years 2000 and 2001, evaluated as of December 31, 2002. A policy year captures the premiums and losses from the block of policies that have effective dates during a given year. Policy Year 2001 is the most recently available policy year, since the last policy had an effective date of December 31, 2001 and did not expire until December 31, 2002. The use of the two most recently available policy years is consistent with the filings made in the past several years by NCCI in Maryland. Calendar-Accident Year 2002 experience was also examined for the purposes of this filing. A calendar-accident year captures the premiums earned during a given year, together with the losses associated with workplace accidents taking place during the same year. This information is useful in analyzing whether the pattern observed in recent years can be expected to continue in the same direction into future time periods. It should be noted that NCCI adjusts the historical policy and calendar-accident year experience to reflect both loss cost changes approved and statutory benefit changes implemented since that time period. The specific loss experience used by NCCI in this filing is paid which is benefit amounts already paid by insurers on reported claims. The use of paid loss experience is also consistent with NCCI’s filings in the past several years in Maryland. From these losses, NCCI has computed loss development factors. They are needed since there is substantial lag between the time a claim is reported and the time the claim is finally settled. The factors are based on how pattern of loss payments changed over time for claims from older years. In the 11/01/2003 filing, NCCI relied on the average change in paid estimates over the last three years from the first report to the nineteenth report. The loss development factor from 19th report to ultimate, herein called the tail factor, has been selected based on five years average excluding high and low.

Maryland
© 2003 National Council on Compensation Insurance, Inc. 4
TREND As noted above, the filing relies primarily on the experience from Policy Years 2000 and 2001. However, the proposed loss costs are intended for use with policies with effective dates starting on November 1, 2003. Therefore, it is necessary to use trend factors that forecast how much the future Maryland workers compensation experience will differ from the past. These trend factors measure anticipated changes in the amount of indemnity and medical benefits as compared to anticipated changes in the amount of workers’ wages. For example, if benefit costs are expected to grow faster than wages, then a trend factor greater than zero should be applied. Conversely, if wages are expected to grow faster than benefit costs, then a trend factor less than zero is indicated. The chart below shows the history of indemnity loss ratios for the past 19 years. An indemnity loss ratio represents the proportion of premium dollars that are necessary to cover indemnity benefits (the figures in the chart reflect premiums at today’s loss costs and losses at today’s statutory benefit levels).
Maryland Indemnity Loss Ratio History
0.4
0.5
0.6
0.7
0.8
0.9
1.0
1.1
1.2
1983
1984
1985
1986
1987
1988
1989
1990
1991
1992
1993
1994
1995
1996
1997
1998
1999
2000
2001
Year
Ind
emn
ity
Lo
ss R
atio
Policy Year
Maryland’s indemnity loss ratio continued to decline in policy year 2001.

Maryland
© 2003 National Council on Compensation Insurance, Inc. 5
Underlying these loss ratios are the number of workplace injuries (claim frequency) and the average cost of each of these injuries. The chart below summarizes the recent history of lost-time claims (i.e., those claims where a worker missed work time due to a workplace injury) in Maryland.
Maryland Frequency
25.0
30.0
35.0
40.0
45.0
1994 1995 1996 1997 1998 1999 2000 2001
Year
Freq
uenc
y pe
r M
illio
n of
On-
Leve
led
Pre
miu
m
Policy Year
Maryland claim frequency continued to decline in policy year 2001.

Maryland
© 2003 National Council on Compensation Insurance, Inc. 6
For these workplace injuries, the average indemnity cost over time can be tracked by observing the following chart.
Maryland Indemnity Cost Per Case
12,000
12,500
13,000
13,500
14,000
14,500
15,000
15,500
16,000
16,500
17,000
1994 1995 1996 1997 1998 1999 2000 2001
Year
Ave
rag
e C
ost
Per
Cas
e
Policy Year
Indemnity average cost per case experienced a modest increase in policy year 2001, its fifth consecutive year of increase.

Maryland
© 2003 National Council on Compensation Insurance, Inc. 7
After removing the impact of the growth in workers wages that occurred over this time period, the average indemnity cost per case in excess of wage growth is shown in the following chart.
Maryland Indemnity Cost Per Case
15,000
15,500
16,000
16,500
17,000
17,500
18,000
1994 1995 1996 1997 1998 1999 2000 2001
Year
Ave
rage
Cos
t Per
Cas
e
Policy Year
After 3 consecutive years of increases, Maryland’s indemnity average cost per case (in excess of wage growth) showed a decline in the latest policy year. However, early indications from accident year 2002 show an average indemnity cost per case that is comparable to the policy year 2000 level. In last year’s Maryland filing, NCCI proposed an indemnity trend factor of -1% per year. Based on our analysis this year, we are proposing an indemnity trend factor of –1% per year. This means that indemnity benefits are expected to increase at a slower pace than workers’ wages.
Maryland
© 2003 National Council on Compensation Insurance, Inc. 8
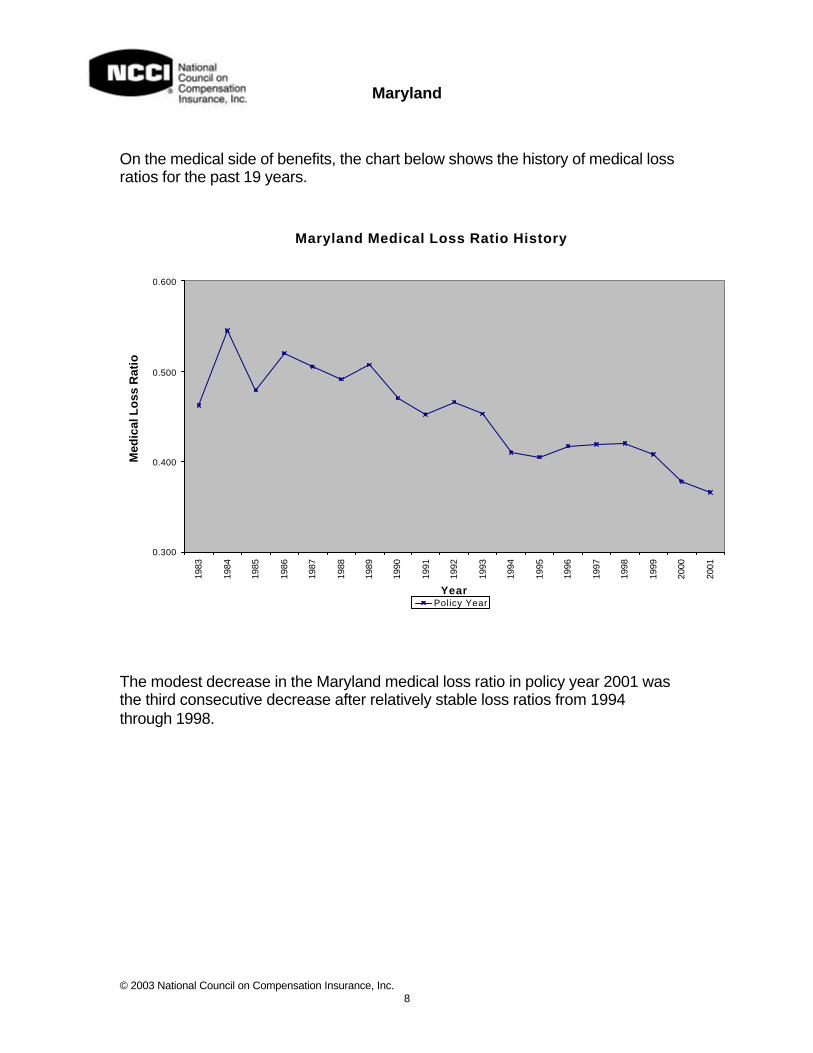
On the medical side of benefits, the chart below shows the history of medical loss ratios for the past 19 years.
Maryland Medical Loss Ratio History
0.300
0.400
0.500
0.600
1983
1984
1985
1986
1987
1988
1989
1990
1991
1992
1993
1994
1995
1996
1997
1998
1999
2000
2001
Year
Med
ical
Lo
ss R
atio
Policy Year
The modest decrease in the Maryland medical loss ratio in policy year 2001 was the third consecutive decrease after relatively stable loss ratios from 1994 through 1998.

Maryland
© 2003 National Council on Compensation Insurance, Inc. 9
As with indemnity, underlying these loss ratios are the number of workplace injuries (claim frequency) and the average cost of each of these injuries. The frequency chart discussed earlier is also a primary driver of medical costs. For these workplace injuries, the average medical cost over time is tracked in the following chart.
Maryland Medical Cost Per Case
7,000
7,500
8,000
8,500
9,000
9,500
10,000
10,500
11,000
11,500
12,000
12,500
13,000
13,500
1994 1995 1996 1997 1998 1999 2000 2001
Year
Ave
rage
Cos
t Per
Cas
e
Policy Year
Maryland’s medical cost per case continued to increase in policy year 2001. .

Maryland
© 2003 National Council on Compensation Insurance, Inc. 10
After removing the impact of the growth in workers wages that occurred over this time period, the average medical cost per case in excess of wage growth is shown in the following chart:
Maryland Medical Cost Per Case
9,000
9,500
10,000
10,500
11,000
11,500
12,000
12,500
13,000
13,500
1994 1995 1996 1997 1998 1999 2000 2001
Year
Ave
rag
e C
ost
Per
Cas
e
Policy Year
Maryland’s medical average cost per case in excess of wage growth has risen steadily since 1994 and experienced a particularly large increase in the latest policy period. In last year’s Maryland filing, NCCI proposed a medical trend factor of 1.5% per year. Based on our analysis this year, we are again proposing a medical trend factor of 1.5% per year. This means that medical benefits are expected to increase at a slightly faster pace than workers’ wages.

Maryland
© 2003 National Council on Compensation Insurance, Inc. 11
BENEFITS Workers injured in Maryland receive wage replacement (indemnity) benefits at a rate of [2/3] of their pre-injury weekly wage. These benefits are subject to a weekly minimum and maximum. Each January, the minimum and maximum weekly benefits are updated based on the most recent average weekly wage in Maryland. Since losses from Policy Years 2000 and 2001 reflect the indemnity benefits being paid at that time, it is necessary for NCCI to reflect what the level of these benefits will be starting January 1, 2004. Updating the proposed voluntary loss costs to reflect the impact of minimum and maximum benefit increases on January 1, 2004 results in a 1.8% increase for indemnity losses. Since indemnity claims comprise 57.2% of all losses, the overall impact is 1.0%. A similar adjustment for medical costs needed to be made as a result of an increase in the hospital fee schedule implemented by the Maryland Health Services Cost Review Commission. The hospital fee schedule was increased by an average of 5.1% effective July 1, 2003. The total impact on medical costs is estimated at 1.9%. Since medical claims comprise 42.8% of all losses, the estimated overall impact is 0.8%. Another adjustment was needed as a result of revisions to the attorney fee schedule in Maryland by the Workers’ Compensation Commission. Various changes and amendments to the attorney fee schedule became effective from February to April of 2003. The method used to determine certain fees and maximums varies by injury. The most significant dollar change was to fees for permanent partial (PP) and permanent total (PT) disability. The maximum fee allowed increased from $7,500 to 20 times the state average weekly wage (SAWW). Fees for most of the other indemnity injury types (except for TT and TP) and legal procedures (except for settlement agreements) also increased by almost 100%. We estimate that the cost impact on the total workers’ compensation system is an increase of +3.1%. Due to a recent decision by Maryland’s highest court, yet another adjustment was required. On June 6, 2003, Maryland’s Court of Appeals, the state’s highest court, issued a decision in Harris v. Board of Education of Howard County that changed the compensability rules under the workers’ compensation act. The court overruled a judicially created doctrine permitting denial of benefits for injuries that do not result from “unusual activity” on the part of the claimant. The court held that the unusual activity requirement is a “distinct minority view in the nation and contravenes the liberal purposes of the Workers’ Compensation Act.” We estimate an overall increase in workers’ compensation system costs in Maryland of 2% as a result of this decision.

Maryland
© 2003 National Council on Compensation Insurance, Inc. 12
CONCLUSION This filing document provides a high-level perspective on why Maryland loss costs need to decrease –4.7%. This decrease is due, in large part, to a continued decline in frequency of claims; however, medical costs continue to increase and there are early signs that indemnity costs will no longer continue in their favorable downward direction. These observations are consistent with what is being observed in the latest national data. In many states, efforts have been made to erode legislative reform, increase benefits, and weaken the exclusive remedy provision in workers compensation. Some reports also indicate that the savings from reform, managed care, and safety awareness may have begun to run dry. Therefore, continued diligence is needed by Maryland workers compensation stakeholders to ensure that the system remains strong and competitive. Following are various exhibits containing other Maryland workers compensation information that may be of interest, as well as the proposed loss costs and rating values by classification.

Maryland
© 2003 National Council on Compensation Insurance, Inc. 13
EXHIBIT I
• No Loss Cost filings were made by NCCI for 1/1/97 and 1/1/99. • 01/01/2002 increase of 1.3% was from law only filing.
After several years of filing loss cost decreases, NCCI filed increases in loss costs in 2001, 2002 (law Only) and 2003.
Maryland Historical Loss Cost Changes
-12.8%
-9.8%
-3.4%
7.6%
1.3% 1.6%
-15.0%
-13.0%
-11.0%
-9.0%
-7.0%
-5.0%
-3.0%
-1.0%
1.0%
3.0%
5.0%
7.0%
9.0%
01/01/1996 01/01/1997 01/01/1998 01/01/1999 01/01/2000 01/01/2001 01/01/2002 01/01/2003
Effective Date
Ch
ang
e in
Lo
ss C
ost

Maryland
© 2003 National Council on Compensation Insurance, Inc. 14
EXHIBIT II
RECENT KEY LEGISLATION AFFECTING WORKERS COMPENSATION
2003 Key Legislation
Effective Date
Bill Number Description Impact
10-1-03 H.B. 690
Specifies a new benefit formula and cap for wholly dependent surviving spouses who become partially self-supporting after the death of a covered employee.
minimal
7-1-03 n/a
Maryland Health Services Cost Review Commission • approved increase to hospital inpatient
services of 5.33% • approved increase to hospital outpatient
services of 4.33%
+0.8%
6-6-03 n/a
Harris v. Board of Education of Howard County -decision by state’s highest court changed the compensability rules under the workers’ compensation act. The court overruled a judicially created doctrine permitting denial of benefits for injuries that do not result from “unusual activity” on the part of the claimant.
+2.0%
2-13-03 4-08-03 n/a
Maryland Workers’ Compensation Commission revised the attorney fee schedule in Maryland. Various changes and amendments to the attorney fee schedule became effective from February to April of 2003. The method used to determine certain fees and maximums varies by injury. The most significant dollar change was to fees for permanent partial (PP) and permanent total (PT) disability.
+3.1%

Maryland
© 2003 National Council on Compensation Insurance, Inc. 15
2002 Key Legislation
Effective Date
Bill Number Description Impact
1-1-02 S.B. 371 Establishes risk based capital requirements for the Injured Workers’ Insurance Fund.
None
10-1-02 S.B. 522 Repeals sunset date of provision specifying various aspects of the workers compensation system that may be established through collective bargaining.
None
6-1-02 S.B. 772
Amends the formula for calculating the tax against each insurer for the maintenance of the Workers Compensation Commission. Establishes a workers compensation fund in the state treasury and creates an advisory committee on the Commissioner’s budget.
None
7-1-02 Maryland Health Services Cost Review Commission increase in hospital fee schedule by an average of 3.2%.
+0.6%
10-1-02 H.B. 491
Creates presumption that a sole proprietor is not a covered employee if the sole proprietor provides a certain notice to the principal contractor.
None
10-1-02 H.B. 887
Increases the maximum limit of specified death benefits payable to partly dependent survivors from $45,000 to $60,000; Modifies the calculation of the weekly death benefits payable to partly dependent survivors.
None
10-1-02 H.B. 1318
Maryland Workers Compensation Commission may not modify an award unless the modification is applied for within 5 years after the latter of: date of accident, date of disablement or last compensation payment.
None

Maryland
© 2003 National Council on Compensation Insurance, Inc. 16
EXHIBIT III
Maryland Written Premium
441.0
407.8
493.4
200.0
250.0
300.0
350.0
400.0
450.0
500.0
550.0
2000 2001 2002
Calendar Year
Wri
tten
Pre
miu
m (
$ m
illio
ns)
Maryland’s Calendar Year written premium increased significantly in 2002.

Maryland
© 2003 National Council on Compensation Insurance, Inc. 17
EXHIBIT IV
The five largest private insurance companies providing workers compensation insurance in Maryland in 2002 are shown in this chart.
Maryland Largest Workers Compensation Writers CY 2002
7.6%
6.6%
5.0% 4.9%4.5%
0.0%
2.0%
4.0%
6.0%
8.0%
10.0%
Hartford Liberty Zurich Erie AIG
Company
Mar
ket
Sh
are

PURE PREMIUMS - NOT RATES MARYLANDPure premiums exclude all expense provisions.
Exhibit V Page S1Effective November 1, 2003
CLASS LOSS D EX-MED CLASS LOSS D EX-MED CLASS LOSS D EX-MED CODE COST ELR RATIO RATIO CODE COST ELR RATIO RATIO CODE COST ELR RATIO RATIO
0005 2.20 1.18 0.23 0.32 2001 1.47 0.85 0.26 0.34 2651 1.68 0.98 0.27 0.35 0008 1.78 0.88 0.20 0.31 2002 5.46 2.53 0.24 0.38 2660 1.69 1.03 0.28 0.35 0016 4.08 2.14 0.23 0.36 2003 3.03 1.60 0.24 0.28 2670 2.06 1.26 0.28 0.33 0034 3.73 2.18 0.27 0.33 2014 4.18 1.97 0.20 0.34 2683 2.05 1.20 0.27 0.36 0035 1.74 0.96 0.25 0.35 2016 1.62 0.94 0.26 0.32 2688 1.90 1.08 0.25 0.29
0036 4.12 2.07 0.21 0.30 2021 2.49 1.32 0.22 0.27 2702 18.68 7.54 0.15 0.23 0037 2.77 1.32 0.19 0.26 2039 2.96 1.68 0.25 0.30 2710 7.28 3.63 0.22 0.34 0042 4.06 2.22 0.24 0.31 2041 2.70 1.61 0.27 0.36 2714 3.96 2.12 0.23 0.34 0050 4.49 2.29 0.21 0.29 2065 3.54 1.85 0.22 0.32 2731 4.80 2.60 0.24 0.36 0059D 0.31 0.08 0.18 – 2070 3.04 1.64 0.24 0.35 2735 3.25 1.92 0.27 0.34
0065D 0.08 0.02 0.24 – 2081 4.86 2.62 0.23 0.32 2759 4.33 2.58 0.27 0.31 0066D 0.08 0.02 0.26 – 2089 3.11 1.82 0.27 0.34 2790 1.62 0.91 0.25 0.29 0067D 0.08 0.02 0.27 – 2095 3.36 1.98 0.27 0.33 2791X 2.87 1.38 0.18 0.25 0079 2.62 1.25 0.20 0.26 2105 2.50 1.43 0.25 0.32 2802 3.01 1.67 0.24 0.32 0083 5.01 2.83 0.25 0.29 2110 2.18 1.30 0.27 0.31 2812 2.86 1.58 0.24 0.29
0106 14.75 6.40 0.19 0.39 2111 1.95 1.14 0.26 0.32 2835 1.90 1.12 0.26 0.34 0113 2.56 1.35 0.22 0.31 2112 4.62 2.86 0.28 0.28 2836 3.46 2.09 0.26 0.24 0170 4.52 2.64 0.27 0.37 2114 2.40 1.38 0.26 0.31 2841 3.59 2.22 0.29 0.36 0251 3.29 1.62 0.20 0.30 2121 2.81 1.31 0.18 0.26 2881 2.06 1.21 0.27 0.30 0400 5.99 3.11 0.22 0.30 2130 3.28 1.73 0.29 0.25 2883 2.72 1.53 0.25 0.31
0401 8.82 3.91 0.18 0.29 2131 3.77 2.30 0.28 0.25 2913 3.14 2.10 0.32 0.29 0771N 0.41 – – – 2143 2.16 1.12 0.22 0.29 2915 3.88 2.02 0.22 0.31 0908P 56.00 30.18 0.23 0.30 2150 6.10 3.57 0.26 0.31 2916 2.04 1.18 0.26 0.36 0909P 58.00 32.33 0.25 0.34 2156 3.04 1.79 0.26 0.27 2923 2.00 1.14 0.25 0.31 0912P 262.00 142.97 0.23 0.28 2157 4.45 2.36 0.23 0.32 2942 2.63 1.61 0.28 0.32
0913P 96.00 49.22 0.21 0.26 2172 1.48 0.70 0.18 0.20 2960 4.98 2.53 0.21 0.30 0917 2.85 1.71 0.28 0.37 2174 2.17 1.21 0.23 0.24 3004 4.17 2.19 0.23 0.24 1005* 8.44 1.02 0.18 0.20 2211 5.69 2.78 0.21 0.30 3018 6.22 3.75 0.27 0.25 1016* 29.09 1.94 0.15 0.07 2220 1.34 0.73 0.24 0.29 3022 2.21 1.22 0.24 0.32 1164E 5.52 1.98 0.14 0.19 2286 1.41 0.82 0.26 0.28 3027 2.03 1.14 0.25 0.33
1165E 2.19 0.94 0.17 0.26 2288 3.85 2.04 0.23 0.32 3028 2.95 1.49 0.21 0.27 1320 2.00 0.88 0.18 0.26 2300 2.28 1.31 0.25 0.31 3030 9.45 4.44 0.20 0.32 1322 11.94 4.94 0.16 0.21 2302 1.05 0.54 0.22 0.33 3040 7.01 3.35 0.21 0.37 1430 4.89 2.30 0.20 0.26 2305 2.10 1.17 0.24 0.26 3041 3.82 2.19 0.25 0.30 1438 2.43 1.15 0.20 0.27 2361 1.42 0.83 0.26 0.30 3042 2.52 1.32 0.22 0.29
1452 1.52 0.69 0.18 0.22 2362 1.48 0.82 0.24 0.30 3064 8.10 3.82 0.20 0.44 1463 8.79 4.01 0.19 0.25 2380 1.81 1.05 0.26 0.33 3066 3.49 1.88 0.23 0.32 1470 – 1.41 0.19 – 2386 1.22 0.62 0.20 0.31 3075X 3.12 1.70 0.23 0.20 1472 3.15 1.41 0.19 0.31 2388 1.69 1.13 0.32 0.28 3076 2.18 1.17 0.23 0.34 1624E 4.16 2.02 0.22 0.31 2402 2.63 1.52 0.27 0.28 3081D 4.76 2.68 0.27 0.28
1642 2.60 1.23 0.20 0.25 2413 2.48 1.49 0.27 0.26 3082D 5.44 2.74 0.24 0.38 1654 4.55 2.43 0.25 0.33 2416 1.61 0.91 0.25 0.29 3085D 2.75 1.48 0.26 0.35 1655 3.04 1.38 0.18 0.21 2417 1.59 0.86 0.23 0.29 3110 3.29 1.73 0.22 0.28 1699 2.33 1.08 0.20 0.29 2501 1.60 0.93 0.26 0.32 3111 2.20 1.20 0.24 0.29 1701 2.54 1.42 0.26 0.26 2503 1.10 0.63 0.26 0.31 3113 1.41 0.83 0.26 0.30
1710E 5.91 2.52 0.17 0.29 2534 2.40 1.47 0.28 0.33 3114 2.03 1.07 0.23 0.32 1741E 2.75 1.02 0.18 0.26 2570 4.21 2.51 0.27 0.31 3118 2.49 1.34 0.23 0.30 1747 2.01 0.89 0.18 0.22 2576 3.01 1.56 0.25 0.30 3119 1.08 0.64 0.26 0.36 1748 3.15 1.80 0.27 0.30 2578 3.93 2.34 0.27 0.33 3122 2.11 1.24 0.27 0.36 1803D 5.47 2.55 0.23 0.29 2585 2.66 1.62 0.28 0.29 3126 2.49 1.35 0.23 0.30
1852D 2.22 1.08 0.22 0.24 2586 1.10 0.59 0.23 0.30 3131 3.83 1.85 0.24 0.43 1853 3.68 2.10 0.25 0.31 2587 1.60 0.97 0.28 0.28 3132 3.11 1.63 0.24 0.29 1860 1.86 1.01 0.29 0.31 2589 1.45 0.84 0.26 0.30 3145 1.98 1.12 0.25 0.35 1924 2.15 1.24 0.26 0.31 2600 2.74 1.47 0.23 0.31 3146 3.53 2.21 0.29 0.32 1925 4.05 2.07 0.21 0.29 2623 1.59 0.86 0.23 0.27 3169 2.44 1.39 0.25 0.33
* Refer to the Footnotes Page for additional information on this class code.
© 2003 National Council on Compensation Insurance, Inc.

PURE PREMIUMS - NOT RATES MARYLANDPure premiums exclude all expense provisions.
Exhibit V Page S2Effective November 1, 2003
CLASS LOSS D EX-MED CLASS LOSS D EX-MED CLASS LOSS D EX-MED CODE COST ELR RATIO RATIO CODE COST ELR RATIO RATIO CODE COST ELR RATIO RATIO
3175D 1.26 0.65 0.22 0.27 3830 1.36 0.73 0.25 0.30 4493 2.30 1.22 0.22 0.30 3179 2.01 1.19 0.27 0.28 3851 2.32 1.29 0.24 0.31 4511 0.37 0.19 0.22 0.32 3180 1.68 1.01 0.28 0.34 3865 1.98 1.20 0.27 0.34 4536X 2.28 0.88 0.15 0.16 3188 1.59 0.94 0.27 0.35 3881 4.21 2.12 0.21 0.31 4557 1.48 0.81 0.24 0.29 3220 2.32 1.30 0.24 0.27 4000 3.54 1.66 0.20 0.25 4558 1.52 0.83 0.23 0.28
3223 2.47 1.47 0.27 0.33 4021 3.81 2.36 0.28 0.27 4561 2.10 0.95 0.17 0.21 3224 4.92 3.58 0.31 0.20 4024E 2.26 1.24 0.26 0.30 4568 1.39 0.68 0.22 0.34 3227 3.85 1.85 0.21 0.36 4034 7.03 3.52 0.22 0.30 4581 0.97 0.40 0.17 0.34 3240 2.03 1.04 0.21 0.27 4036 1.89 0.92 0.21 0.26 4583 4.64 2.29 0.22 0.36 3241 3.58 1.90 0.23 0.33 4038 3.04 1.87 0.28 0.34 4584X 0.27 0.11 0.15 0.13
3255 4.64 3.16 0.32 0.26 4053 2.29 1.18 0.22 0.36 4611 1.15 0.64 0.24 0.26 3257 2.55 1.40 0.24 0.35 4061 4.32 2.46 0.25 0.26 4635 1.74 0.75 0.19 0.30 3270 1.41 0.82 0.26 0.32 4062 2.62 1.47 0.25 0.30 4653 1.45 0.76 0.23 0.33 3300 3.22 1.85 0.25 0.33 4101 2.19 1.21 0.26 0.33 4665 5.28 2.61 0.22 0.27 3303 2.87 1.59 0.24 0.32 4111 1.77 1.04 0.26 0.33 4670 5.24 2.53 0.21 0.27
3307 4.63 2.25 0.20 0.33 4112 0.60 0.31 0.22 0.28 4683 2.07 1.20 0.26 0.30 3315 2.85 1.55 0.24 0.34 4113 1.65 0.81 0.23 0.27 4686 2.09 0.88 0.17 0.31 3334 3.03 1.39 0.17 0.25 4114 3.46 1.90 0.24 0.29 4692 0.51 0.27 0.23 0.28 3336 1.99 1.18 0.27 0.32 4130 3.63 1.99 0.24 0.31 4693 0.82 0.51 0.28 0.30 3365 7.36 3.45 0.20 0.30 4131 2.52 1.49 0.29 0.29 4703 1.30 0.70 0.23 0.29
3372 5.23 2.61 0.24 0.49 4133 2.32 1.26 0.23 0.26 4717 2.13 1.25 0.25 0.24 3373 8.30 4.51 0.23 0.30 4150 0.93 0.56 0.27 0.32 4720 1.27 0.65 0.21 0.33 3383 1.49 0.91 0.28 0.30 4206 4.11 1.95 0.19 0.29 4740 1.90 0.74 0.17 0.26 3385 1.01 0.59 0.26 0.32 4207 0.83 0.46 0.24 0.30 4741 1.62 0.88 0.23 0.29 3400 3.09 1.64 0.23 0.36 4239 4.05 1.98 0.21 0.29 4751 1.30 0.67 0.23 0.31
3507 2.53 1.37 0.23 0.31 4240 2.90 1.77 0.28 0.30 4771N 2.35 1.07 0.21 0.31 3515 2.05 1.09 0.23 0.30 4243 1.51 0.85 0.25 0.30 4777 3.17 1.33 0.16 0.24 3548 1.57 0.77 0.20 0.31 4244 3.56 1.87 0.23 0.38 4825 0.87 0.42 0.22 0.34 3559 2.01 1.08 0.23 0.34 4250 1.37 0.79 0.26 0.31 4828 0.92 0.44 0.21 0.27 3574 0.92 0.57 0.29 0.33 4251 1.67 0.96 0.25 0.29 4829 0.90 0.50 0.25 0.25
3581 0.90 0.51 0.25 0.30 4263 2.14 1.24 0.26 0.28 4902 1.84 1.12 0.28 0.33 3612 1.47 0.81 0.24 0.28 4273 1.77 1.02 0.26 0.32 4923 1.07 0.63 0.27 0.34 3620 3.07 1.44 0.20 0.27 4279 1.38 0.77 0.24 0.30 5020 8.03 3.24 0.17 0.21 3629 1.07 0.62 0.26 0.28 4282 2.01 1.19 0.26 0.25 5022 7.34 3.40 0.20 0.31 3632 2.24 1.24 0.24 0.29 4283 2.56 1.33 0.22 0.37 5037 28.19 10.92 0.16 0.28
3634 1.78 0.96 0.23 0.35 4299 1.69 0.91 0.23 0.30 5040 28.33 11.08 0.16 0.26 3635 2.02 1.14 0.25 0.33 4304X 2.18 1.21 0.24 0.29 5057 16.06 5.94 0.14 0.22 3638 1.55 0.86 0.25 0.31 4307 1.66 0.93 0.24 0.33 5059 36.18 14.71 0.18 0.30 3642 1.16 0.67 0.26 0.31 4308 1.16 0.87 0.37 0.23 5069 39.37 17.62 0.19 0.38 3643 2.07 1.15 0.24 0.30 4351X 0.87 0.37 0.16 0.19 5102 10.32 4.39 0.17 0.31
3647 1.19 0.64 0.23 0.32 4352 1.07 0.59 0.24 0.30 5146 4.33 2.17 0.22 0.24 3648 1.76 1.06 0.28 0.34 4360 1.22 0.63 0.22 0.40 5160 3.49 1.58 0.18 0.24 3681 0.57 0.30 0.23 0.33 4361 0.74 0.42 0.25 0.34 5183 4.79 2.30 0.21 0.30 3685 0.66 0.32 0.20 0.27 4362 0.61 0.33 0.24 0.29 5188 4.47 2.25 0.22 0.26 3719 2.20 0.94 0.17 0.25 4410 4.06 2.13 0.24 0.48 5190 4.51 2.12 0.20 0.29
3724 4.59 2.19 0.20 0.28 4417X 1.64 1.07 0.30 0.24 5191 0.57 0.30 0.23 0.28 3726 10.89 4.25 0.16 0.28 4420 1.99 0.98 0.21 0.22 5192 2.49 1.34 0.23 0.30 3803 3.86 1.97 0.21 0.24 4431 1.83 1.09 0.27 0.32 5213 8.61 4.00 0.20 0.31 3807 2.06 1.19 0.26 0.32 4432 1.56 0.94 0.27 0.31 5215 4.69 2.43 0.22 0.29 3808 2.78 1.49 0.22 0.22 4439 2.28 1.20 0.24 0.33 5221 4.37 2.17 0.22 0.32
3821 3.77 2.03 0.24 0.29 4452 2.49 1.42 0.26 0.36 5222 8.88 4.20 0.21 0.26 3822 3.48 2.00 0.28 0.33 4459 2.25 1.32 0.26 0.31 5223 6.70 3.72 0.26 0.28 3824 3.82 2.05 0.23 0.28 4470 1.38 0.74 0.25 0.31 5348 6.24 2.89 0.20 0.36 3826 1.39 0.73 0.23 0.40 4479X 1.55 0.79 0.20 0.27 5402 7.69 3.72 0.19 0.24 3827 1.00 0.59 0.26 0.25 4484 2.33 1.35 0.26 0.31 5403 6.80 3.29 0.21 0.33
* Refer to the Footnotes Page for additional information on this class code.
© 2003 National Council on Compensation Insurance, Inc.

PURE PREMIUMS - NOT RATES MARYLANDPure premiums exclude all expense provisions.
Exhibit V Page S3Effective November 1, 2003
CLASS LOSS D EX-MED CLASS LOSS D EX-MED CLASS LOSS D EX-MED CODE COST ELR RATIO RATIO CODE COST ELR RATIO RATIO CODE COST ELR RATIO RATIO
5437 5.52 2.65 0.21 0.28 6834 2.03 1.10 0.25 0.32 7445N 0.15 – – – 5443 4.78 2.49 0.23 0.26 6836 2.41 1.13 0.20 0.31 7453N 1.01 – – – 5445 6.80 3.13 0.20 0.30 6843F 16.15 8.55 0.18 0.38 7502 1.12 0.56 0.22 0.28 5462 10.25 4.79 0.20 0.29 6845F 12.68 6.87 0.19 0.35 7515 1.12 0.47 0.18 0.26 5472 7.25 3.28 0.20 0.37 6854 4.27 1.75 0.17 0.20 7520 2.10 1.00 0.21 0.31
5473 8.02 3.88 0.23 0.46 6872F 10.75 6.01 0.18 0.27 7538 14.61 5.58 0.17 0.41 5474 5.47 2.64 0.21 0.30 6874F 25.58 13.33 0.14 0.25 7539 0.86 0.38 0.18 0.27 5478 4.20 2.05 0.21 0.27 6882 5.90 2.18 0.14 0.17 7540 1.80 0.73 0.17 0.27 5479 8.08 3.80 0.20 0.29 6884 13.89 5.20 0.13 0.19 7580 1.18 0.56 0.20 0.26 5480 12.02 5.33 0.19 0.39 7016M 11.84 4.03 0.13 0.22 7590 2.64 1.40 0.22 0.29
5491 2.22 1.05 0.20 0.22 7024M 13.15 4.48 0.13 0.22 7600 2.20 1.15 0.24 0.34 5506 7.25 3.26 0.19 0.33 7038M 6.18 2.42 0.16 0.20 7601 7.92 3.33 0.16 0.24 5507 5.63 2.41 0.17 0.27 7046M 8.63 4.88 0.26 0.28 7605 1.90 0.96 0.22 0.30 5508D 9.73 4.05 0.17 0.30 7047M 14.45 5.19 0.13 0.22 7610 0.38 0.21 0.26 0.36 5536 6.50 2.83 0.18 0.31 7050M 7.55 3.12 0.16 0.20 7611 3.35 1.79 0.24 0.24
5538 6.67 3.10 0.20 0.27 7090M 6.87 2.69 0.16 0.20 7612 14.10 6.47 0.19 0.23 5551 24.26 10.26 0.17 0.33 7098M 9.59 5.42 0.26 0.28 7613 4.37 2.18 0.22 0.29 5606 1.86 0.86 0.20 0.29 7099M 10.54 6.28 0.26 0.28 7704 5.28 2.98 0.27 0.33 5610 5.00 2.71 0.24 0.36 7133 3.37 1.51 0.19 0.27 7720 1.53 0.91 0.28 0.28 5645 6.99 3.48 0.23 0.37 7151M 4.09 1.84 0.19 0.27 7855 7.81 3.46 0.18 0.24
5651 8.15 3.88 0.21 0.32 7152M 5.00 2.36 0.19 0.27 8001 1.45 0.83 0.25 0.37 5703 17.85 8.13 0.19 0.28 7153M 4.55 2.05 0.19 0.27 8002 1.46 0.93 0.30 0.30 5705 10.20 5.44 0.24 0.26 7222 4.43 1.93 0.17 0.23 8006 1.68 0.94 0.25 0.33 5951 0.41 0.22 0.23 0.27 7228 4.52 2.30 0.22 0.24 8008 0.66 0.41 0.28 0.31 6003 7.13 3.29 0.19 0.26 7229 5.40 2.46 0.19 0.23 8010 1.16 0.65 0.25 0.33
6005 4.62 2.17 0.19 0.22 7230 5.58 3.19 0.26 0.25 8013 0.38 0.22 0.26 0.32 6017 7.31 3.54 0.20 0.19 7231 4.98 2.54 0.23 0.30 8015 0.61 0.35 0.25 0.35 6018 3.17 1.33 0.16 0.21 7232 3.83 1.69 0.17 0.21 8017 1.13 0.64 0.25 0.34 6045 5.27 2.01 0.14 0.21 7309F 19.59 10.26 0.15 0.27 8018 2.45 1.39 0.25 0.32 6204 8.23 3.91 0.20 0.30 7313F 3.62 2.02 0.18 0.28 8021 1.81 1.01 0.24 0.29
6206 4.31 1.75 0.17 0.25 7317F 10.32 5.61 0.17 0.30 8027 – 0.76 0.24 – 6213 4.64 1.97 0.17 0.23 7323 – 10.26 0.15 – 8031 1.67 0.85 0.22 0.29 6214 4.11 1.74 0.16 0.19 7327F 17.80 8.96 0.13 0.27 8032 1.02 0.60 0.27 0.35 6216 4.97 2.21 0.18 0.25 7333M 4.59 1.67 0.13 0.16 8033 2.42 1.34 0.24 0.25 6217 3.91 2.02 0.23 0.29 7335M 5.10 1.85 0.13 0.16 8039 1.44 0.83 0.26 0.37
6229 4.52 2.08 0.18 0.28 7337M 5.60 2.14 0.13 0.16 8044 2.17 1.19 0.24 0.31 6233 7.50 2.88 0.13 0.17 7350F 14.72 8.34 0.19 0.31 8045 0.69 0.41 0.26 0.30 6235 10.19 4.36 0.17 0.22 7360 5.20 2.90 0.26 0.26 8046X 1.39 0.76 0.24 0.40 6236 22.97 9.57 0.16 0.23 7370 4.58 2.84 0.29 0.30 8047 0.84 0.51 0.28 0.33 6237 2.69 1.19 0.18 0.24 7373X 1.51 0.91 0.29 0.26 8050 0.84 0.48 0.25 0.29
6251DX 9.87 3.70 0.15 0.20 7380 3.74 1.90 0.22 0.27 8058 1.74 0.97 0.25 0.40 6252D 5.66 2.07 0.14 0.17 7382X 3.87 2.15 0.26 0.37 8072 0.60 0.33 0.24 0.30 6260D 10.37 3.64 0.13 0.17 7390 6.84 3.26 0.21 0.33 8102 1.57 0.85 0.24 0.33 6306 3.93 1.78 0.19 0.24 7394M 12.39 5.09 0.17 0.23 8103 1.80 1.00 0.25 0.34 6319 5.39 2.41 0.19 0.31 7395M 13.77 5.66 0.17 0.23 8105 3.99 1.85 0.18 0.25
6325 4.76 2.12 0.19 0.30 7398M 15.13 6.56 0.17 0.23 8106 4.22 2.20 0.24 0.32 6400 7.29 3.88 0.23 0.32 7403 1.73 1.07 0.29 0.31 8107 3.54 1.73 0.21 0.30 6504 1.96 1.11 0.25 0.32 7405N 0.27 0.13 0.21 0.28 8111 3.47 1.82 0.23 0.37 6702M* 9.49 4.20 0.18 0.24 7409 11.24 3.37 0.09 0.15 8116 1.41 0.73 0.22 0.30 6703M* 11.59 5.41 0.18 0.24 7420 11.33 3.13 0.07 0.10 8203 3.58 2.05 0.26 0.32
6704M* 10.54 4.67 0.18 0.24 7421 2.62 0.93 0.11 0.17 8204 7.96 4.59 0.27 0.32 6801F 4.31 2.60 0.22 0.28 7422 1.92 0.77 0.16 0.18 8209 2.91 1.65 0.25 0.33 6811 2.96 1.20 0.15 0.23 7423 1.14 0.57 0.22 0.25 8215 1.79 0.89 0.22 0.31 6824F 9.16 4.83 0.17 0.32 7425 6.24 1.94 0.11 0.22 8227 4.42 2.06 0.20 0.32 6826F 8.17 4.27 0.16 0.33 7431N 1.88 0.57 0.09 0.11 8232 2.78 1.37 0.22 0.30
* Refer to the Footnotes Page for additional information on this class code.
© 2003 National Council on Compensation Insurance, Inc.

PURE PREMIUMS - NOT RATES MARYLANDPure premiums exclude all expense provisions.
Exhibit V Page S4Effective November 1, 2003
CLASS LOSS D EX-MED CLASS LOSS D EX-MED CLASS LOSS D EX-MED CODE COST ELR RATIO RATIO CODE COST ELR RATIO RATIO CODE COST ELR RATIO RATIO
8233 7.06 2.99 0.16 0.21 9015 1.92 1.01 0.24 0.31 8235 4.18 2.23 0.23 0.38 9016 1.25 0.70 0.25 0.35 8263 4.03 2.29 0.25 0.29 9019 1.91 1.04 0.24 0.23 8264 5.37 2.78 0.22 0.33 9033 1.33 0.80 0.27 0.29 8265 9.28 4.15 0.20 0.42 9040* 2.29 1.34 0.27 0.34
8279 5.13 2.98 0.26 0.33 9052 1.40 0.85 0.28 0.31 8288 3.88 1.96 0.21 0.35 9058 1.31 0.75 0.26 0.35 8291 3.34 2.07 0.29 0.28 9059 1.81 1.13 0.29 0.31 8292 4.29 2.34 0.24 0.30 9060 1.48 0.85 0.26 0.36 8293 4.99 2.69 0.23 0.32 9061 1.04 0.61 0.27 0.35
8304 4.02 1.75 0.18 0.27 9063 0.56 0.30 0.25 0.40 8350 4.67 2.15 0.20 0.31 9077F 0.45 0.28 0.18 0.29 8380 2.09 1.00 0.21 0.29 9082 1.29 0.76 0.27 0.35 8381 1.33 0.76 0.26 0.33 9083 1.39 0.83 0.28 0.36 8385X 4.48 2.17 0.21 0.33 9084 1.08 0.60 0.27 0.32
8392 2.16 1.28 0.26 0.25 9088a a a a a 8393 1.16 0.58 0.22 0.28 9089 1.84 0.99 0.24 0.38 8500 5.67 2.98 0.24 0.31 9093 0.85 0.51 0.27 0.32 8601 0.56 0.26 0.20 0.33 9101 1.53 0.91 0.27 0.30 8606 4.18 1.83 0.17 0.22 9102 2.03 1.17 0.26 0.32
8709F 4.79 2.62 0.17 0.27 9110 1.70 1.00 0.28 0.36 8710 – 2.34 0.24 – 9154 1.18 0.61 0.23 0.33 8719 2.32 1.20 0.22 0.22 9156 1.36 0.70 0.23 0.53 8720 1.09 0.55 0.22 0.25 9178 3.01 1.63 0.24 0.41 8721 0.33 0.17 0.24 0.35 9179 1.28 0.55 0.15 0.15
8726F 5.46 2.86 0.16 0.30 9180 2.67 1.35 0.21 0.35 8734M 0.39 0.20 0.21 0.30 9182 1.11 0.65 0.27 0.39 8737M 0.35 0.18 0.21 0.30 9186 10.22 4.05 0.16 0.33 8738M 0.43 0.22 0.21 0.30 9220 4.25 2.53 0.27 0.34 8742 0.29 0.14 0.21 0.30 9402 3.99 1.99 0.22 0.31
8745 4.23 2.10 0.21 0.45 9403 4.18 2.16 0.23 0.29 8748 0.61 0.28 0.19 0.30 9410 2.29 1.26 0.24 0.31 8755 0.31 0.14 0.18 0.21 9501 2.70 1.42 0.23 0.33 8800 1.13 0.66 0.26 0.34 9505 2.37 1.29 0.23 0.27 8803 0.07 0.03 0.23 0.30 9516 1.19 0.66 0.26 0.28
8805M 0.20 0.11 0.24 0.32 9519 1.63 0.85 0.23 0.25 8810 0.15 0.08 0.24 0.32 9521 3.51 1.62 0.19 0.28 8814M 0.18 0.10 0.24 0.32 9522 1.11 0.65 0.26 0.28 8815M 0.22 0.13 0.24 0.32 9534 7.29 2.96 0.15 0.24 8820 0.11 0.06 0.26 0.27 9545 – 3.31 0.18 –
8824 2.24 1.39 0.28 0.30 9549 – 3.31 0.18 – 8825 0.87 0.52 0.27 0.35 9552 – 3.31 0.18 – 8826 1.87 1.09 0.26 0.32 9554 7.78 3.31 0.18 0.34 8829 1.73 1.03 0.27 0.30 9586 0.44 0.25 0.26 0.34 8831 1.03 0.57 0.25 0.44 9600 1.64 0.71 0.15 0.24
8832 0.21 0.11 0.24 0.27 9620 0.63 0.33 0.23 0.31 8833* 0.61 0.31 0.21 0.31 8835 2.42 1.28 0.23 0.32 8861 0.60 0.39 0.31 0.33 8868 0.23 0.14 0.27 0.34
8869 0.47 0.29 0.29 0.37 8871 0.22 0.14 0.29 0.31 8901 0.15 0.09 0.26 0.27 9012 0.56 0.30 0.24 0.27 9014 1.98 1.13 0.25 0.30
* Refer to the Footnotes Page for additional information on this class code.
© 2003 National Council on Compensation Insurance, Inc.

WORKERS COMPENSATION AND EMPLOYERS LIABILITY MARYLANDExhibit VPage S5
Effective November 1, 2003
FOOTNOTE
a Pure premium for each individual risk must be obtained from NCCI Customer Service or the Rating Organizationhaving jurisdiction.
D Pure premium for classification already includes the specific disease loading shown in the table below. See Basic Manual Rule 3-A-7.
E Pure premium for classification already includes the specific disease loading shown in the table below.
Code No.Disease Loading Symbol Code No.
Disease Loading Symbol Code No.
Disease Loading Symbol
0059D 0.31 S 1710E 0.05 S 3175D 0.02 S0065D 0.08 S 1741E 0.36 S 4024E 0.03 S0066D 0.08 S 1803D 0.37 S 5508D 0.05 S0067D 0.08 S 1852D 0.07 Asb 6251DX 0.07 S1164E 0.10 S 3081D 0.06 S 6252D 0.05 S1165E 0.02 S 3082D 0.09 S 6260D 0.08 S1624E 0.04 S 3085D 0.05 SAsb=Asbestos, S=Silica
F Pure premium provides for coverage under the United States Longshore and Harbor Workers CompensationAct and its extensions.
M Pure premium provides for coverage under Admiralty Law and Federal Employers' Liability Act (FELA).
N This code is part of a ratable / non-ratable group shown below. The statistical non-ratable code and correspondingpure premium are applied in addition to the basic classification when determining premium.
Class Non-RatableCode Element Code4771 07717405 74457431 7453
P Classification is computed on a per capita basis.
X Refer to special classification phraseology in these pages which is applicable in this state.
* Class Codes with Specific Footnotes
1005 Pure premium includes a non-ratable disease element of $6.06. (For coverage written separately for federalbenefits only, $1.72. For coverage written separately for state benefits only, $4.34.)
1016 Pure premium includes a non-ratable disease element of $24.25. (For coverage written separately for federalbenefits only, $6.86. For coverage written separately for state benefits only, $17.39.) It also includes a catastropheloading of $0.07. Refer to the Manual of Underground Coal Mine Rules, Classifications, and Rates for the rulesapplicable to the use of this classification code.
6702 Pure premium and rating values only appropriate for laying or relaying of tracks or maintenance of way - no work on elevated railroads. Otherwise, assign appropriate construction or erection code pure premium and elr each x 1.215.
6703 Pure premium and rating values only appropriate for laying or relaying of tracks or maintenance of way - no work on elevated railroads. Otherwise, assign appropriate construction or erection class pure premium x 1.484 and elr x 1.565.
6704 Pure premium and rating values only appropriate for laying or relaying of tracks or maintenance of way - no work onelevated railroads. Otherwise, assign appropriate construction or erection class pure premium and elr each x 1.35.
8833 The ex-medical pure premium for this classification is $0.42.
9040 The ex-medical pure premium for this classification is $1.51.
© 2003 National Council on Compensation Insurance, Inc.

WORKERS COMPENSATION AND EMPLOYERS LIABILITY MARYLANDExhibit VPage S6
Effective November 1, 2003
MISCELLANEOUS VALUES
Basis of premium applicable in accordance with the footnote instructions for Code 7370 --"Taxicab Co.":
Employee operated vehicle………………………………………………………………………………………………$54,197.00Leased or rented vehicle………………………………………………………………………………………………….$36,131.00
$2,800.00
Minimum Payroll applicable in accordance with Basic Manual Rule 2-E-1 -- "Executive Officers"and members of limited liability companies……………………………………………………………………… $300.00
maximum surcharge per aircraft…………………………………………………………………………………$1,000per passenger seat…………………………………………………………………………………………………………..$100
Deductible HAZARD GROUP*Amount I II III IV
$500 2.9% 2.9% 1.8% 1.3%$1,500 5.7% 5.5% 3.3% 2.5%$2,500 7.4% 7.1% 4.3% 3.3%
* Percentage pure premium reductions shown are loss elimination ratios modified by a safety factor.
$47,000.00
Terrorism Risk Insurance Act -Certified Losses (Advisory Pure Premium)……………………………………… 0.03
20%
Experience Rating EligibilityA risk is eligible for intrastate experience rating when the payrolls or other exposures developed in the last year or last two years of the experience period produced a premium of at least $10,000. If more than two years, an average annual premium of at least $5,000 is required. Page A-1 of the Experience Rating Plan Manual should be referenced for the latest approved eligibility amounts by state.
Maximum Payroll applicable in accordance with Basic Manual Rule 2-E-1 -- "Executive Officers", including members of limited liability companies, and the footnote instructions for Code 9178 -- "Athletic Team: Non-Contact Sports," Code 9179 -- "Athletic Team: Contact Sports," and Code 9186 -- "Carnival--Traveling".............................................................................................................................................
(Multiply a Non-F classification pure premium by a factor of 1.2. This factor adjusts for the difference in state and federal benefits only.)
Premium Determination for Partners and Sole Proprietors in accordance with Basic Manual Rule 2-E-3………………………………………………………………………………………………………………....
United States Longshore and Harbor Workers' Compensation Coverage Percentage applicable only in connection with Basic Manual Rule 3-A-4…………...………………….………………………………
Per Passenger Seat Surcharge - In accordance with the footnote instructions for classification Code 7421, the surcharge is
Percentage Pure Premium Reductions - The following percentages are applicable by deductible amount and hazard group for total losses on a per claim basis:
Total Losses
© 2003 National Council on Compensation Insurance, Inc.

EXPERIENCE RATING PLAN MANUAL MARYLANDPART FIVE Exhibit V
Effective November 1, 2003 Page S7TABLE OF WEIGHTING VALUESAPPLICABLE TO ALL POLICIES
Expected Weighting Expected WeightingLosses Values Losses Values
0 -- 1,172 0.04 661,299 -- 697,775 0.441,173 -- 4,740 0.05 697,776 -- 736,364 0.454,741 -- 8,385 0.06 736,365 -- 777,254 0.468,386 -- 12,108 0.07 777,255 -- 820,658 0.47
12,109 -- 15,912 0.08 820,659 -- 866,815 0.48
15,913 -- 26,615 0.09 866,816 -- 915,996 0.4926,616 -- 39,617 0.10 915,997 -- 968,510 0.5039,618 -- 51,183 0.11 968,511 -- 1,024,706 0.5151,184 -- 62,444 0.12 1,024,707 -- 1,084,988 0.5262,445 -- 73,706 0.13 1,084,989 -- 1,149,817 0.53
73,707 -- 85,108 0.14 1,149,818 -- 1,219,728 0.5485,109 -- 96,725 0.15 1,219,729 -- 1,295,344 0.5596,726 -- 108,610 0.16 1,295,345 -- 1,377,394 0.56
108,611 -- 120,804 0.17 1,377,395 -- 1,466,735 0.57120,805 -- 133,338 0.18 1,466,736 -- 1,564,386 0.58
133,339 -- 146,243 0.19 1,564,387 -- 1,671,561 0.59146,244 -- 159,545 0.20 1,671,562 -- 1,789,726 0.60159,546 -- 173,274 0.21 1,789,727 -- 1,920,665 0.61173,275 -- 187,456 0.22 1,920,666 -- 2,066,565 0.62187,457 -- 202,119 0.23 2,066,566 -- 2,230,149 0.63
202,120 -- 217,293 0.24 2,230,150 -- 2,414,839 0.64217,294 -- 233,008 0.25 2,414,840 -- 2,625,001 0.65233,009 -- 249,298 0.26 2,625,002 -- 2,866,296 0.66249,299 -- 266,196 0.27 2,866,297 -- 3,146,196 0.67266,197 -- 283,741 0.28 3,146,197 -- 3,474,772 0.68
283,742 -- 301,971 0.29 3,474,773 -- 3,865,932 0.69301,972 -- 320,929 0.30 3,865,933 -- 4,339,440 0.70320,930 -- 340,662 0.31 4,339,441 -- 4,924,358 0.71340,663 -- 361,219 0.32 4,924,359 -- 5,665,252 0.72361,220 -- 382,653 0.33 5,665,253 -- 6,634,110 0.73
382,654 -- 405,024 0.34 6,634,111 -- 7,955,277 0.74405,025 -- 428,396 0.35 7,955,278 -- 9,863,625 0.75428,397 -- 452,837 0.36 9,863,626 -- 12,862,453 0.76452,838 -- 478,423 0.37 12,862,454 -- 18,260,337 0.77478,424 -- 505,239 0.38 18,260,338 -- 30,855,390 0.78
505,240 -- 533,374 0.39 30,855,391 -- 93,830,621 0.79533,375 -- 562,931 0.40 93,830,622 AND OVER 0.80562,932 -- 594,020 0.41594,021 -- 626,763 0.42626,764 -- 661,298 0.43
(a) State Per Claim Accident Limitation . . . . . . . . . . . . . . . . . . . . . . . . . . . . . . . . . . . . . . . . $140,000(b) State Multiple Claim Accident Limitation . . . . . . . . . . . . . . . . . . . . . . . . . . . . . . . . . . . . . . . . $280,000(c) USL&HW Per Claim Accident Limitation . . . . . . . . . . . . . . . . . . . . . . . . . . . . . . . . . . . . . . . . $305,500(d) USL&HW Multiple Claim Accident Limitation . . . . . . . . . . . . . . . . . . . . . . . . . . . . . . . . . . . . . . . .$611,000(e) Employers Liability Accident Limitation . . . . . . . . . . . . . . . . . . . . . . . . . . . . . . . . . . . . . . . . $55,000(f) USL&HW Act -- Expected Loss Factor -- Non-F Classes . . . . . . . . . . . . . . . . . . . . . . . . . . . . . . . . . . . . . . . .1.32(Multiply a Non-F classification ELR by the USL&HW Act - Expected Loss Factor of 1.32.)
Cap on Modifications = 1 + (0.00005)((Expected Losses) + (2)(Expected Losses)/(5.60))
© 2003 National Council on Compensation Insurance, Inc. 7/03

EXPERIENCE RATING PLAN MANUAL MARYLANDPART FIVE Exhibit V
Effective November 1, 2003 Page S8TABLE OF BALLAST VALUES
APPLICABLE TO ALL POLICIESExpected Ballast Expected Ballast Expected BallastLosses Values Losses Values Losses Values
0 -- 30,121 14,000 966,566 -- 994,549 112,000 1,946,282 -- 1,974,277 210,00030,122 -- 51,841 16,800 994,550 -- 1,022,534 114,800 1,974,278 -- 2,002,273 212,80051,842 -- 76,798 19,600 1,022,535 -- 1,050,520 117,600 2,002,274 -- 2,030,269 215,60076,799 -- 103,126 22,400 1,050,521 -- 1,078,507 120,400 2,030,270 -- 2,058,266 218,400
103,127 -- 130,095 25,200 1,078,508 -- 1,106,494 123,200 2,058,267 -- 2,086,262 221,200
130,096 -- 157,401 28,000 1,106,495 -- 1,134,482 126,000 2,086,263 -- 2,114,259 224,000157,402 -- 184,906 30,800 1,134,483 -- 1,162,470 128,800 2,114,260 -- 2,142,255 226,800184,907 -- 212,535 33,600 1,162,471 -- 1,190,459 131,600 2,142,256 -- 2,170,252 229,600212,536 -- 240,247 36,400 1,190,460 -- 1,218,448 134,400 2,170,253 -- 2,198,249 232,400240,248 -- 268,018 39,200 1,218,449 -- 1,246,438 137,200 2,198,250 -- 2,226,246 235,200
268,019 -- 295,830 42,000 1,246,439 -- 1,274,429 140,000 2,226,247 -- 2,254,243 238,000295,831 -- 323,675 44,800 1,274,430 -- 1,302,420 142,800 2,254,244 -- 2,282,240 240,800323,676 -- 351,543 47,600 1,302,421 -- 1,330,411 145,600 2,282,241 -- 2,310,237 243,600351,544 -- 379,431 50,400 1,330,412 -- 1,358,402 148,400 2,310,238 -- 2,338,234 246,400379,432 -- 407,334 53,200 1,358,403 -- 1,386,394 151,200 2,338,235 -- 2,366,231 249,200
407,335 -- 435,249 56,000 1,386,395 -- 1,414,386 154,000 2,366,232 -- 2,394,228 252,000435,250 -- 463,174 58,800 1,414,387 -- 1,442,379 156,800 2,394,229 -- 2,422,226 254,800463,175 -- 491,108 61,600 1,442,380 -- 1,470,372 159,600 2,422,227 -- 2,450,223 257,600491,109 -- 519,049 64,400 1,470,373 -- 1,498,365 162,400 2,450,224 -- 2,478,221 260,400519,050 -- 546,996 67,200 1,498,366 -- 1,526,358 165,200 2,478,222 -- 2,506,218 263,200
546,997 -- 574,948 70,000 1,526,359 -- 1,554,352 168,000 2,506,219 -- 2,534,216 266,000574,949 -- 602,904 72,800 1,554,353 -- 1,582,345 170,800 2,534,217 -- 2,562,213 268,800602,905 -- 630,864 75,600 1,582,346 -- 1,610,339 173,600 2,562,214 -- 2,590,211 271,600630,865 -- 658,828 78,400 1,610,340 -- 1,638,334 176,400 2,590,212 -- 2,618,209 274,400658,829 -- 686,794 81,200 1,638,335 -- 1,666,328 179,200 2,618,210 -- 2,646,207 277,200
686,795 -- 714,763 84,000 1,666,329 -- 1,694,323 182,000 2,646,208 -- 2,674,000 280,000714,764 -- 742,735 86,800 1,694,324 -- 1,722,317 184,800742,736 -- 770,708 89,600 1,722,318 -- 1,750,312 187,600770,709 -- 798,683 92,400 1,750,313 -- 1,778,307 190,400798,684 -- 826,660 95,200 1,778,308 -- 1,806,303 193,200
826,661 -- 854,639 98,000 1,806,304 -- 1,834,298 196,000854,640 -- 882,619 100,800 1,834,299 -- 1,862,294 198,800882,620 -- 910,600 103,600 1,862,295 -- 1,890,289 201,600910,601 -- 938,582 106,400 1,890,290 -- 1,918,285 204,400938,583 -- 966,565 109,200 1,918,286 -- 1,946,281 207,200
For Expected Losses greater than $2,674,000, the Ballast Value can be calculated using the following formula (rounded to the nearest 1):
Ballast = (0.10)(Expected Losses) + 2500(Expected Losses)(5.60) / (Expected Losses + (700)(5.60))
Cap on Modifications = 1 + (0.00005)((Expected Losses) + (2)(Expected Losses)/(5.60))
© 2003 National Council on Compensation Insurance, Inc. 7/03

Coal Miners Experience Rating Plan MarylandTable III - Table of W and B Values
State Average D & P.T. Value: 437000 11/01/03
Exhibit V
Expected Losses W B Expected Losses W B
0 -- 25,000 0.00 41,250 2,262,675 -- 2,306,124 0.52 941,63525,001 -- 90,174 0.01 77,401 2,306,125 -- 2,349,574 0.53 939,37690,175 -- 133,624 0.02 112,813 2,349,575 -- 2,393,024 0.54 936,378
133,625 -- 177,074 0.03 147,486 2,393,025 -- 2,436,474 0.55 932,642177,075 -- 220,524 0.04 181,421 2,436,475 -- 2,479,924 0.56 928,167220,525 -- 263,974 0.05 214,617 2,479,925 -- 2,523,374 0.57 922,953263,975 -- 307,424 0.06 247,074 2,523,375 -- 2,566,824 0.58 917,001307,425 -- 350,874 0.07 278,793 2,566,825 -- 2,610,274 0.59 910,310350,875 -- 394,324 0.08 309,773 2,610,275 -- 2,653,724 0.60 902,880394,325 -- 437,774 0.09 340,015 2,653,725 -- 2,697,174 0.61 894,712437,775 -- 481,224 0.10 369,518 2,697,175 -- 2,740,624 0.62 885,805481,225 -- 524,674 0.11 398,282 2,740,625 -- 2,784,074 0.63 876,159524,675 -- 568,124 0.12 426,307 2,784,075 -- 2,827,524 0.64 865,775568,125 -- 611,574 0.13 453,594 2,827,525 -- 2,870,974 0.65 854,652611,575 -- 655,024 0.14 480,142 2,870,975 -- 2,914,424 0.66 842,790655,025 -- 698,474 0.15 505,952 2,914,425 -- 2,957,874 0.67 830,190698,475 -- 741,924 0.16 531,023 2,957,875 -- 3,001,324 0.68 816,851741,925 -- 785,374 0.17 555,355 3,001,325 -- 3,044,774 0.69 802,774785,375 -- 828,824 0.18 578,949 3,044,775 -- 3,088,224 0.70 787,958828,825 -- 872,274 0.19 601,804 3,088,225 -- 3,131,674 0.71 772,403872,275 -- 915,724 0.20 623,920 3,131,675 -- 3,175,124 0.72 756,109915,725 -- 959,174 0.21 645,298 3,175,125 -- 3,218,574 0.73 739,077959,175 -- 1,002,624 0.22 665,937 3,218,575 -- 3,262,024 0.74 721,306
1,002,625 -- 1,046,074 0.23 685,837 3,262,025 -- 3,305,474 0.75 702,7971,046,075 -- 1,089,524 0.24 704,999 3,305,475 -- 3,348,924 0.76 683,5491,089,525 -- 1,132,974 0.25 723,422 3,348,925 -- 3,392,374 0.77 663,5621,132,975 -- 1,176,424 0.26 741,106 3,392,375 -- 3,435,824 0.78 642,8371,176,425 -- 1,219,874 0.27 758,052 3,435,825 -- 3,479,274 0.79 621,3731,219,875 -- 1,263,324 0.28 774,259 3,479,275 -- 3,522,724 0.80 599,1701,263,325 -- 1,306,774 0.29 789,728 3,522,725 -- 3,566,174 0.81 576,2291,306,775 -- 1,350,224 0.30 804,458 3,566,175 -- 3,609,624 0.82 552,5491,350,225 -- 1,393,674 0.31 818,449 3,609,625 -- 3,653,074 0.83 528,1301,393,675 -- 1,437,124 0.32 831,701 3,653,075 -- 3,696,524 0.84 502,9731,437,125 -- 1,480,574 0.33 844,215 3,696,525 -- 3,739,974 0.85 477,0771,480,575 -- 1,524,024 0.34 855,990 3,739,975 -- 3,783,424 0.86 450,4421,524,025 -- 1,567,474 0.35 867,027 3,783,425 -- 3,826,874 0.87 423,0691,567,475 -- 1,610,924 0.36 877,325 3,826,875 -- 3,870,324 0.88 394,9571,610,925 -- 1,654,374 0.37 886,884 3,870,325 -- 3,913,774 0.89 366,1071,654,375 -- 1,697,824 0.38 895,705 3,913,775 -- 3,957,224 0.90 336,5181,697,825 -- 1,741,274 0.39 903,787 3,957,225 -- 4,000,674 0.91 306,1901,741,275 -- 1,784,724 0.40 911,130 4,000,675 -- 4,044,124 0.92 275,1231,784,725 -- 1,828,174 0.41 917,735 4,044,125 -- 4,087,574 0.93 243,3181,828,175 -- 1,871,624 0.42 923,601 4,087,575 -- 4,131,024 0.94 210,7741,871,625 -- 1,915,074 0.43 928,728 4,131,025 -- 4,174,474 0.95 177,4921,915,075 -- 1,958,524 0.44 933,117 4,174,475 -- 4,217,924 0.96 143,4711,958,525 -- 2,001,974 0.45 936,767 4,217,925 -- 4,261,374 0.97 108,7112,001,975 -- 2,045,424 0.46 939,678 4,261,375 -- 4,304,824 0.98 73,2132,045,425 -- 2,088,874 0.47 941,851 4,304,825 -- 4,369,999 0.99 36,9762,088,875 -- 2,132,324 0.48 943,285 4,370,000 -- OVER 1.00 02,132,325 -- 2,175,774 0.49 943,9812,175,775 -- 2,219,224 0.50 943,9382,219,225 -- 2,262,674 0.51 943,156
© 2003 National Council on Compensation Insurance, Inc. 7/03

RETROSPECTIVE RATING PLAN MANUAL MARYLANDSTATE SPECIAL RATING VALUES RR 1
Effective November 1, 2003 Exhibit V
1. Hazard Group Differentials I II III IV 1.47 1.33 0.83 0.57 1.34 1.20 0.74 0.50 **
2. 2001 Table of Expected Loss RangesEffective July 1, 20012003 Table of Expected Loss Ranges**Effective December 1, 2003
3. Excess Loss Pure Premium Factors (Applicable to New and Renewal Policies)
Per Accident Hazard GroupsLimitation I II III IV
$25,000 0.621 0.646 0.764 0.821$30,000 0.589 0.615 0.739 0.801*$35,000 0.562 0.589 0.717 0.788$40,000 0.538 0.568 0.697 0.771*$50,000 0.497 0.532 0.671 0.741*$75,000 0.436 0.473 0.611 0.695
$100,000 0.397 0.436 0.572 0.653*$125,000 0.368 0.406 0.540 0.618$150,000 0.341 0.380 0.513 0.588$175,000 0.321 0.359 0.488 0.560$200,000 0.305 0.339 0.462 0.534$250,000 0.273 0.309 0.424 0.495$300,000 0.248 0.282 0.389 0.455$500,000 0.189 0.215 0.300 0.353
$1,000,000 0.127 0.144 0.200 0.234$2,000,000 0.084 0.095 0.131 0.153$5,000,000 0.049 0.056 0.076 0.089
* Also applicable to Underground Coal Mine classifications.
4. Retrospective Pure Premium Development Factors
With Loss Limit Without Loss Limit 1st 2nd 3rd 1st 2nd 3rd 4th & SubsequentAdj. Adj. Adj. Adj. Adj. Adj. Adjustment0.13 0.11 0.11 0.37 0.31 0.30 0.00
5. State Special Classifications by Hazard Group
Code No. HG Code No. HG Code No. HG Code No. HG2791 I 4417 II 4536 IV 7373 III3075 II 4479 I 4584 III
** Effective December 1, 2003.
© 2003 National Council on Compensation Insurance, Inc.

Maryland
© 2003 National Council on Compensation Insurance, Inc.
NCCI KEY CONTACTS
Lori Lovgren Regulatory Services Division
National Council on Compensation Insurance, Inc. (NCCI) 901 Peninsula Corporate Circle, Boca Raton FL 33487
Phone: 561-893-3337
Robert Moss Associate Actuary, ACAS, MAAA, ARe
Actuarial & Economics Services National Council on Compensation Insurance, Inc. (NCCI)
5 Marine View Plaza, Hoboken NJ 07030 Phone: 201-386-2614
Fax: 201-222-8880
All NCCI employees can be contacted via e-mail using the following format:
First Name_Last [email protected]

1 MARYLAND
© 2003 National Council on Compensation Insurance, Inc.
APPENDIX
NCCI AFFILIATE LIST – MARYLAND
ACADIA INSURANCE COMPANY ACCIDENT FUND INS CO OF AMERICA ACE AMERICAN INSURANCE COMPANY ACE FIRE UNDERWRITERS INSURANCE COMPANY ACE INDEMNITY INSURANCE COMPANY ACE PROPERTY & CASUALTY INSURANCE COMPANY ACIG INS CO ADMIRAL INDEMNITY COMPANY AIU INS CO ALEA NORTH AMERICA INS CO ALLIANZ INS CO AMERICAN ALTERNATIVE INSURANCE CORPORATION AMERICAN AND FOREIGN INS CO AMERICAN AUTOMOBILE INSURANCE CO AMERICAN CASUALTY COMPANY OF READING P A AMERICAN CENTRAL INSURANCE COMPANY AMERICAN ECONOMY INS CO AMERICAN EMPLOYERS INSURANCE CO AMERICAN FIRE AND CASUALTY CO AMERICAN GUARANTEE AND LIABILITY INS CO AMERICAN HARDWARE MUTUAL INS CO AMERICAN HOME ASSURANCE CO AMERICAN INS CO AMERICAN INTERNATIONAL SOUTH INS CO AMERICAN INTERSTATE INS CO AMERICAN MANUFACTURERS MUTUAL INS CO AMERICAN MINING INS CO AMERICAN MOTORISTS INS CO AMERICAN PHYSICIANS ASSURANCE CORP AMERICAN PROTECTION INS CO AMERICAN SAFETY CASUALTY INS CO AMERICAN STATES INS CO (A SAFECO COMPANY) AMERICAN ZURICH INS CO AMERISURE INS CO AMERISURE INS CO AMERISURE MUTUAL INS CO AMERISURE MUTUAL INS CO AMGUARD INS CO ARCH INS CO ARGONAUT INS CO ARGONAUT MIDWEST INS CO ASSOCIATED INDEMNITY CORP ASSURANCE COMPANY OF AMERICA ATLANTIC INS CO ATLANTIC MUTUAL INS CO ATLANTIC STATES INS CO

MARYLAND
© 2003 National Council on Compensation Insurance, Inc.
APPENDIX
NCCI AFFILIATE LIST – MARYLAND
AVEMCO INS CO BANCINSURE INC BANKERS STANDARD INS CO BERKLEY INS CO OF THE CAROLINAS BIRMINGHAM FIRE INS CO OF PA BITUMINOUS CASUALTY CORP BITUMINOUS FIRE AND MARINE INS CO BLUE RIDGE INDEMNITY COMPANY BLUE RIDGE INSURANCE CO BRETHREN MUTUAL INS CO BROTHERHOOD MUTUAL INS CO CA INDEMNITY INS CO CAMDEN FIRE INS ASSN CAPITAL CITY INS CO CENTENNIAL INS CO CENTRE INSURANCE COMPANY CHARTER OAK FIRE INS CO CHUBB INDEMNITY INS CO CHURCH MUTUAL INS CO CINCINNATI CASUALTY COMPANY CINCINNATI INDEMNITY COMPANY CINCINNATI INS CO CLARENDON NATIONAL INS CO CLARENDON NATIONAL INS CO COLOGNE REINSURANCE CO OF AMERICA COLONIAL AMERICAN CASUALTY & SURETY CO COLONY SPECIALTY INS CO COMMERCE AND INDUSTRY INS CO COMMERCIAL CASUALTY INS CO COMPANION COMMERCIAL INS CO COMPANION PROPERTY AND CASUALTY INS CO CONNECTICUT INDEMNITY COMPANY CONTINENTAL CASUALTY CO CONTINENTAL INS CO CONVERIUM INS (NORTH AMERICA) INC CRUM AND FORSTER INDEMNITY CO CUMIS INS SOCIETY INC DAIMLERCHRYSLER INS CO DISCOVER PROPERTY & CASUALTY INS CO DONEGAL MUTUAL INS CO EAGLE PACIFIC INS CO EASTERN ALLIANCE INSURANCE COMPANY EASTGUARD INS CO ELECTRIC INS CO EMCASCO INS CO EMPLOYEE BENEFITS INS CO EMPLOYERS FIRE INSURANCE COMPANY

MARYLAND
© 2003 National Council on Compensation Insurance, Inc.
APPENDIX
NCCI AFFILIATE LIST – MARYLAND
EMPLOYERS INS OF WAUSAU EMPLOYERS MUTUAL CASUALTY CO ERIE INS CO ERIE INS EXCHANGE ERIE INS PROPERTY AND CASUALTY CO EVEREST NATIONAL INS CO EVEREST REINSURANCE CO (DIRECT) EXCELSIOR INSURANCE COMPANY FAIRFIELD INS CO FAIRMONT INS CO FARMERS CASUALTY INS CO FARMLAND MUTUAL INS CO FEDERAL INS CO FEDERATED MUTUAL INS CO FEDERATED RURAL ELECTRIC INS EXCHANGE FIDELITY & DEPOSIT COMPANY OF MARYLAND FIDELITY & GUARANTY INS UNDERWRITERS FIDELITY & GUARANTY INSURANCE CO FIRE & CASUALTY INSURANCE CO OF CONNECTICUT FIREMANS FUND INS CO FIREMANS FUND INS CO OF WI FIREMENS INS CO OF WASHINGTON DC FIRST LIBERTY INS CORP FIRST NATIONAL INS CO OF AMERICA FIRST NONPROFIT INS CO FIRSTLINE NATIONAL INSURANCE COMPANY FLAGSHIP CITY INS CO FLORISTS INS CO FLORISTS MUTUAL INS CO GENERAL CASUALTY COMPANY OF WISCONSIN GENERAL INS CO OF AMERICA GENERAL REINSURANCE CORP GENESIS INS CO GLOBE INDEMNITY CO GRANITE STATE INSURANCE COMPANY GRAPHIC ARTS MUTUAL INS CO GREAT AMERICAN ALLIANCE INS CO GREAT AMERICAN ASSURANCE COMPANY GREAT AMERICAN INS CO GREAT AMERICAN INS CO OF NY GREAT NORTHERN INS CO GREAT WEST CASUALTY COMPANY GREATER NY MUTUAL INS CO GREENWICH INS CO GROCERS INSURANCE COMPANY GUARANTEE INS CO GUIDEONE MUTUAL INS CO

MARYLAND
© 2003 National Council on Compensation Insurance, Inc.
APPENDIX
NCCI AFFILIATE LIST – MARYLAND
GUIDEONE SPECIALTY MUTUAL INS CO GULF INS CO HANOVER AMERICAN INS CO HANOVER INS CO HARBOR SPECIALTY INS CO HARCO NATIONAL INS CO HARFORD MUTUAL INS CO HARLEYSVILLE INSURANCE COMPANY HARLEYSVILLE MUTUAL INS CO HARLEYSVILLE PERFERRED INSURANCE CO HARTFORD ACCIDENT AND INDEMNITY CO HARTFORD CASUALTY INS CO HARTFORD FIRE INS CO HARTFORD INS CO OF IL HARTFORD INS CO OF MIDWEST HARTFORD INS CO OF THE SOUTHEAST HARTFORD UNDERWRITERS INS CO HIGHMARK CASUALTY INSURANCE COMPANY ILLINOIS NATIONAL INSURANCE COMPANY IN LUMBERMENS MUTUAL INS CO INDEMNITY INS CO OF N AMERICA (CT GENERAL) (ACE) INS CO OF GREATER NY INS CO OF NORTH AMERICA INS CO OF THE AMERICAS INS CO OF THE STATE PA INS CORP OF AMERICA INSURANCE COMPANY OF OHIO INTL BUSINESS & MERCANTILE REASSURANCE KEMPER CASUALTY INSURANCE COMPANY KEMPER EMPLOYERS INSURANCE CO LIBERTY INS CORP LIBERTY MUTUAL FIRE INS CO LIBERTY MUTUAL INS CO LINCOLN GENERAL INS CO LM INS CORP LUMBERMEN'S UNDERWRITING ALLIANCE LUMBERMENS MUTUAL CASUALTY CO MA BAY INS CO MANUFACTURERS ALLIANCE INS CO MARYLAND CASUALTY COMPANY MERCHANTS INSURANCE CO OF N H INC MERCHANTS MUTUAL INS CO MERIDIAN CITIZENS SECURITY INSURANCE COMPANY MERIDIAN SECURITY INSURANCE COMPANY MIDDLESEX INS CO MIDWEST EMPLOYERS CASUALTY CO MILBANK INSURANCE COMPANY

MARYLAND
© 2003 National Council on Compensation Insurance, Inc.
APPENDIX
NCCI AFFILIATE LIST – MARYLAND
MITSUI MARINE AND FIRE INS CO OF AMERICA MONTGOMERY INDEMNITY COMPANY MONTGOMERY MUTUAL INSURANCE COMPANY MUTUAL BENEFIT INS CO NATIONAL AMERICAN INS CO NATIONAL FIRE INS CO OF HARTFORD NATIONAL GRANGE MUTUAL INS CO NATIONAL INTERSTATE INS CO NATIONAL LIABILITY & FIRE INSURANCE CO NATIONAL REINSURANCE CORP NATIONAL SURETY CORP NATIONAL UNION FIRE INS CO OF PITTSBURG NATIONWIDE AGRIBUSINESS INS CO NATIONWIDE MUTUAL FIRE INS CO NATIONWIDE MUTUAL INS CO NATIONWIDE PROPERTY AND CASUALTY INS CO NETHERLANDS INSURANCE COMPANY NEW HAMPSHIRE INDEMNITY COMPANY NEW HAMPSHIRE INSURANCE COMPANY NIPPONKOA INS CO LIMITED (US BRANCH) NORGUARD INS CO NORTH AMERICAN ELITE INSURANCE CO NORTH AMERICAN SPECIALTY INS CO NORTH RIVER INS CO NORTHERN ASSURANCE CO OF AMERICA NORTHERN INSURANCE CO OF N Y NORTHSTAR REINSURANCE CORP OH CASUALTY INS CO OH FARMERS INS CO OHIO SECURITY INS CO OLD GUARD FIRE INS CO OLD GUARD INSURANCE COMPANY OLD REPUBLIC INS CO ONEBEACON AMERICA INS CO ONEBEACON INSURANCE COMPANY ORISKA INS CO P M A CAPITAL INS CO PA GENERAL INS CO PA LUMBERMENS MUTUAL INS CO PA MANUFACTURERS ASSN INS CO PA MANUFACTURERS INDEMNITY CO PA NATIONAL MUTUAL CAS INS CO PACIFIC EMPLOYERS INS CO PACIFIC INDEMNITY CO PEERLESS INSURANCE COMPANY PENINSULA INS CO PENN MILLERS INS CO

MARYLAND
© 2003 National Council on Compensation Insurance, Inc.
APPENDIX
NCCI AFFILIATE LIST – MARYLAND
PENN MUTUAL INS CO PENN MUTUAL INS CO PENN NATIONAL SECURITY INS CO PETROLEUM CASUALTY CO PHARMACISTS MUTUAL INS CO PHOENIX ASSURANCE CO OF NEW YORK PHOENIX INS CO POTOMAC INS CO OF IL PREFERRED PROFESSIONAL INSURANCE COMPANY PRINCETON INS COMPANY PROTECTIVE INS CO PROVIDENCE WA INS CO PUBLIC SERVICE MUTUAL INS CO RANGER INS CO RECIPROCAL OF AMERICA RECIPROCAL OF AMERICA REGENT INSURANCE COMPANY REPUBLIC FRANKLIN INS CO REPUBLIC WESTERN INS CO ROCKWOOD CASUALTY IN CO ROYAL INDEMNITY CO ROYAL INS CO OF AMERICA SAFECO INS CO OF AMERICA SAFECO INS CO OF IL SAFEGUARD INS CO SAFETY FIRST INS CO SAFETY NATIONAL CASUALTY CORP SECURITY INS CO OF HARTFORD SELECT RISK INS CO SELECTIVE INS CO OF AMERICA SELECTIVE INS CO OF SC SELECTIVE INS CO OF THE SOUTHEAST SELECTIVE WAY INS CO SENECA INS CO SENTRY INS A MUTUAL CO SENTRY SELECT INSURANCE COMPANY SOMPO JAPAN INSURANCE CO OF AMERICA SOUTHERN PILOT INSURANCE COMPANY SOUTHERN STATES INS EXCHANGE SPECIALTY NATIONAL INS CO ST PAUL FIRE AND MARINE INS CO ST PAUL GUARDIAN INS CO ST PAUL MERCURY INS CO ST PAUL PROTECTIVE INS CO STANDARD FIRE INSURANCE COMPANY STAR INS CO STATE AUTO PROPERTY AND CASUALTY INS CO

MARYLAND
© 2003 National Council on Compensation Insurance, Inc.
APPENDIX
NCCI AFFILIATE LIST – MARYLAND
STATE AUTOMOBILE MUTUAL INS CO STATE FARM FIRE AND CASUALTY CO SUMITOMO MARINE AND FIRE INS CO LTD (US BRANCH) T.H.E. INSURANCE COMPANY TECHNOLOGY INS CO TIG INS CO (FAIRFAX INC) TIG PREMIER INS CO TOKIO MARINE AND FIRE INS CO TRANS PACIFIC INS CO TRANSCONTINENTAL INS CO TRANSGUARD INS CO OF AMERICA INC TRANSPORTATION INS CO TRAVELERS CASUALTY & SURETY TRAVELERS CASUALTY & SURETY CO OF AMERICA TRAVELERS INDEMNITY CO TRAVELERS INDEMNITY CO OF AMERICA TRAVELERS INDEMNITY CO OF CT TRAVELERS INDEMNITY CO OF IL TRAVELERS INS CO (PRE 2003) TRUCK INS EXCHANGE TWIN CITY FIRE INS CO ULICO CASUALTY CO UNION INSURANCE COMPANY UNITED FARM FAMILY INS CO UNITED STATES FIDELITY & GUARANTY CO UNITED WI INS CO UNIVERSAL UNDERWRITERS INS CO US FIRE INS CO US SPECIALTY INS CO UTICA MUTUAL INS CO VALIANT INSURANCE COMPANY VALLEY FORGE INS CO VANLINER INS CO VIGILANT INS CO VIRGINIA SURETY COMPANY INC WAUSAU BUSINESS INSURANCE COMPANY WAUSAU UNDERWRITERS INSURANCE COMPANY WEST AMERICAN INS CO WESTFIELD INS CO WESTPORT INS CORP XL SPECIALTY INS CO YORK INS CO ZENITH INS CO ZURICH AMERICAN INS CO ZURICH AMERICAN INS CO OF IL