mas q3 fy2006 ndr investor...
TRANSCRIPT

1
MIRAE ASSET SECURITIESInvestor Presentation
January 2007

2
This presentation may contain forward-looking statements about Mirae Asset Securities and unaudited preliminary figures internally collected as of December 2006.
These figures are subject to change without prior notice, and Mirae Asset Securities is neither obligated to provide revisions, nor responsible for any loss or inconvenience caused by changes regarding the projection and forecast presented in this document.
DISCLAIMER

3
Corporate Overview
Financial Highlights
Operational Performance
Growth Strategy
TABLE OF CONTENTS
I
II
III
IV

4
I. Corporate OverviewII. Executive ManagementIII. Group Structure
- Positioning- Synergy Creation- Fund Performance
CORPORATE OVERVIEW

5
I. Corporate Overview
Mirae AssetCapital
41%
Overseas Investor14%
ESOP3%
Related Party2%
(As of December end 2006)
Local Investors40%
Network
73 local branches
Our shareholders
No. of Employees
Approx. 1,000
Market Cap
Approx. USD 2 bn
Credit Rating
February 15, 2006
Establishment
Commercial Paper: A2
December 2, 1999
March
Date of Listing
Fiscal Year

6
Korea’s firstmutual fund
First wrap account& installment-type
investment
First real estate fund&PEF
First int'l asset management
company
First int'l investment fund
First Retirement Annuity Institute
1998 20042001 2005
Create the marketfor installment fundsCreate the market
for installment fundsOpened the era of
indirect investmentOpened the era of
indirect investment
Installmentfund
Installmentfund
Mutualfund
Mutualfund
VariableinsuranceVariable
insurance
CorporatePension
CorporatePension
Real estatefund
Real estatefund
PEFPEF
Int'l investmentfund
Int'l investmentfund
Wrapaccount
Wrapaccount
Leading alternative investment market Leading alternative investment market
Innovator in Korean Capital Market as MAS led the capital market in Korea thru "First-See" & "First-In“ strategy
2006
First Biz Unit SystemFirst Simultaneous Nationwide Branch Investment Seminar
I. Corporate Overview

7
Each year MAS is recognized as an industry leader in both the services we provide our clients and the innovations that have led the financial industry in Korea
Aug 2006Korea Finance Culture, Customer Satisfaction (Installment-type fund)Asia Economy
Apr 2006Marketing Grand Prize for “Total Asset Management”The Korea Economic Daily
Jan 2006 DASAN Finance AwardThe Korea Economic Daily
Dec 20052005 IPO Excellence Korea Exchange
Dec 20042004 IPO Excellence KOSDAQ Committee
Nov 20051st. Weekly Distinguished AwardKorea Securities Dealers Association (KSDA)
Apr 2004 2004 Best IB-IPO UnderwriterKOSDAQ Committee
Jan 2002Foreign Capital Attraction AwardMinistry of Commerce, Industry and Energy (MoCIE)
Dec 2006 ‘Korea’s Most Trusted Company Award”
Korea Economic DailyKorea Chamber of Commerce
I. Corporate Overview

8
II. Executive Management – ‘Back to the basics’
Woong Kee ChoRepresentativeInstitutional Capital MarketBusiness Unit Experience : 16
The executive management were at the center of MAS becoming the leading Korean provider of comprehensive asset management and brokerage services achieving the status of a truly world-class financial company
Hyun Ju ParkChairmanMirae Asset GroupExperience : 23
Hyun Man ChoiPresident & CEOMirae Asset SecuritiesExperience : 18
Koo Bum LeeRepresentative IB Business UnitExperience : 20
Yoo Suk SeoRepresentativeRetail Business UnitExperience : 19
Byung Yoon KimRepresentative Management Support Business UnitExperience : 18

9
III. Group Structure - Positioning
Within in the Mirae Asset Group, Mirae Asset Securities is at the core of the group’s sales and distribution channel well positioned to benefit from the group’s asset management arm
Financial GroupFinancial Group Mirae AssetMaps Invest.
Mgmt.
Mirae AssetInvestment
Management
Mirae AssetGlobal Invest.Mgmt. (Asia)(Singapore)
Mirae AssetGlobal Invest.Management(Hong Kong)
Asset Management Arm
Mirae AssetSecurities
Mirae Asset Life Insurance
Mirae Asset Capital
Mirae AssetVenture
InvestmentInvestment Arm
MAS HK

10
III. Group Structure – Synergy Creation
Mirae Asset Capital,
PEF
Mirae Asset Capital,
PEF
Mirae AssetInvestment Mgt.
Affiliates
Mirae AssetInvestment Mgt.
Affiliates
Mirae AssetSecurities
Excellent Management Skill► Dominance in equity fund market► Brand Power► Source of stable brokerage revenue
- Captive for equity transaction (50% rule)
Growth of variable insurance market► Increasing brokerage transaction
Pursue organic business► Synergy for corporate pension & IB Biz► Support capital loan during big deal
M&A Collaboration► Share information and perform joint projects
Pre–IPO business► Venture Investment company’s IPO
Mirae AssetLife InsuranceMirae Asset
Life Insurance

11
Mirae Asset investment arm continues to lead the indirect investment market with superior fund performance and 9% M/S within industry (33% M/S for equity-type fund)
(KrW Trillion)
Source: AMAK
0.08 0.3
11.9
2.1
0.90.6
15.2
-
10
20
30
40
50
Mar '01
Mar '02
Mar '03
Mar '04
Mar '05
Mar '06
Dec '06
Total Equity-type MarketMAG
Equity Fund Mkt.
(KrW Trillion)
Indirect Investment Mkt.
Source: AMAK
22.2
1.6
3.2
17.3
8.8
6.85.4
150
175
200
225
250
Mar '01
Mar '02
Mar '03
Mar '04
Mar '05
Mar'06
Dec '06
Total MarketMAG 11
313
No. of Eq.Fund
+41%+43%+61%
Vs. BM
PCA Mgmt.3KTB Mgmt.2
Mirae Asset1
CompanyRank
Equity Fund Return (Oct ’03 ~ Oct ’06)
(KrW)
2,000
4,000
6,000
Feb ‘02 Feb ‘04 Oct ‘06
439%
127%
+312%
Independence Equity fundKOSPI Index
Source : Zeroin
III. Group Structure – Fund Performance

12
I. Diversified Revenue StructureII. Above Industry ReturnIII. Operational Stability and Growth
FINANCIAL HIGHLIGHTS

13
I. Diversified Revenue Structure
MAS Peer Group
Source: Peer group includes industry top 4 brokers (Net Revenue = Operating Income – Operating Expenses excl. G&A expenses)
Brokerage
Investment Banking- Underwriting & IPO- Prop. trading- Fixed income securities- Principal Investment
Asset Management- Beneficiary certificates- Wrap account- Bancassurance
Interest Profit & Other19%
21%
30%
30%
29%
13%
50%
7%
MAS continuously maintains advanced and balanced revenue structure with comparatively high revenue proportion from asset management and a solid track record from investment banking
Net Revenue Comparison (Apr ~ Nov 2006)

14
Source: FSS, MAS
(In %)
ROE (MAS vs. Peer)
11.4
13.6
27.1
20.9
12.5
23.6
FY05
8.9
12.9
18.5
13.6
11.3
18.8
1HFY06
3.25.83.4D2
3.5
-5.3
-4.8
3.7
9.5
FY02
0.3
11.4
-16.3
5.9
21.2
FY03
2.5
-11.7
4.6
1.9
13.3
FY04
MAS
S
H
D1
W
ROE
II. Above Industry Return
ROE (MAS vs. Industry)
MAS
Industry
9.5
-4.4
20.3
13.0
8.7
0.3
FY 02 FY 03 FY 04 FY05 1H FY06
21.2
13.3
23.6
18.8
MAS continuously generated high profits compared to 5 major securities firms
Source: FSS, Annualized ROE of top 5 brokers for 1H FY06

15
III. Operational Stability & Growth
Operating Income Operating Profit Margin
(KrW billion)CAGR (’00 ~ ’05) : 33.3% (In %)
Source: FSSSource: MAS
103224 264 294 273
432 439
FY00 FY01 FY02 FY03 FY04 FY05 Q1-Q3 FY06 (20)
(10)0
102030
FY00 FY01 FY02 FY03 FY04 FY05
HW
MAS
D1S
32%
9%15% 13%
22% 19%
Net Income EPS Growth
CAGR (’00 ~ ’05) : 40.4%
Source: MAS
17 14 1744 31
92 82
FY00 FY01 FY02 FY03 FY04 FY05 Q1-Q3 FY06 (2)
(1)01234
FY00 FY01 FY02 FY03 FY04 FY05
WH D1S
(KrW K)
Source: FSS
(KrW billion)MAS
In addition to high profitability, MAS is increasing the scale of operating income and net come year after year

16
Installment Fund Balance
Mirae Asset Securities holds more than 257K installment-type fund accounts, constituting approximately 19% M/S within securities industry
Source: AMAK (As of Nov ‘06)
Balance of Ins-Type within total Funds
5
10
15
H S D1 W-
14%14%
MAS
Source: AMAK (As of Nov ‘06)
(In KrW billion)
1,2191,219
897
280335
4.4X
354
S W H D1 MAS
M/S in no. of Ins Accounts
Source: AMAK
(In million accounts)Total Market incl. Banks (LHS)MAS M/S (RHS)
-
1
2
3
4
5
6
7
8
Mar '05
Jun '05
Sep '05
Dec '05
Mar '06
Jun '06
Sep '06
Nov '06
2.5%
3.0%
3.5%
4.0%
III. Operational Stability & Growth

17
I. Operational Performance- Asset Management- Brokerage - Investment Banking
OPERATIONAL PERFORMANCE

18
MAS is the no. 1 seller of lucrative equity-type fund with 5.3 KrW trillion in balance and 42% M/S within industry
I. Operational Performance - Asset Management
(In KrW billion)
Others
MMF
Hybrid
Bond-type
Domestic equity-type
Overseas equity-type
Equity-type Proportion
Source: MAS
24% 25% 33% 39% 49% 53% 54%
244 266 394 524 1,022 1,406 1,558 2,074874 1,113 1,5382,048
2,7992,984 3,119
3,223
971 1,0651,170
1,043
951955 1,038
935
9001,096
795785
8291,016 956
1,115
1,2601,337
1,514 1,137
1,126814 669
388
452554
5131,029
1,0841,138 1,320
2,179
Mar ‘05 Jun ‘05 Sep ‘05 Dec ‘05 Mar ‘06 Jun ‘06 Sep ‘06 Dec '06
4,7005,430
5,9236,565
7,8118,312 8,659 22%
4%
11%
9%
33%
21%
9,914
54%
Other : PEF, REIT etc.

19
Portion of lucrative equity-type funds continues to increase recording 31% M/Swithin securities industry
MAS vs. Ind. Equity Portion
Source: AMAK
MASIndustry
Mar ’03 Mar ’04 Mar ’05 Dec ’06
54%
7% 6%4%
11%
3% 6%
17%
MAS vs. Peer Equity Portion
(In billion KrW)
Source: MAS
Mar ’03
Mar ’04
Mar ’05
Mar ’06
Dec ’06
5,297
591 6711,118
3,821
9X
MAS Equity Funds Sales
I. Operational Performance - Asset Management
Source: AMAK (As of Oct ‘06)
S D2 W D1 H
5,245
MAS
2,454
1,845 872
518599
2X
10X
(In billion KrW)

20
Source: MAS, data from each company
MAS vs. Peer M/S (Q306)
In addition to having the dominant position in financial product sales, equity brokerage M/S recovered 7.2% along with higher portion of commissions being generated from institutions (Institutionalization)
MAS
7.2%
7.9%
6.8%6.7%
WH S D1
7.0%
I. Operational Performance - Brokerage
MAS Equity Brokerage M/S
Source: MAS
Brokerage Breakdown
Source: MAS
5.7
8.18.4
8.2
7.2
6.6
5.85.9
6.9
7.27.1
FY2004Q1Q2Q3Q4
FY2005Q1Q2Q3Q4
FY2006Q1Q2Q3
Offline (Ins.)
Offline (Retail)
Online (Retail)
Trading ValueQ1 '06 Q3 ‘06 Q1 ‘06 Q3 ‘06
Commissions
82 80
32
1815
45
1511
4437
48

21
SF Performance
MAS lead Korea’s Financial market thru development of alternative investment products and has extensive knowledge and expertise in IPO and selling structured finance related products
I. Operational Performance - Investment Banking
ABCP
ABS
3,5605ABCP
1,7503ABS
14,24020
11,21814Real
EstateDev.
AmtNo. of Issue
Product(Mar ‘05 ~ Dec ’06)
Alternative Investments
2801Floating Capital Related
801Korean Beef Cattle Fund
1,3556Vessel Fund
1,4391School BTL
AmtNo. of Issue
Product(Sep ‘05 ~ Nov ‘06)
※Oil Fund, Mineral Fund, Solar Heat Fund, Art Fund, and Wind Power Plant Fundunder consideration
1,162Giga Telecom & other 92003
793Korea Ratings & other 52002
661Core Logic &
other 52004
1,139Dom & other 72005
784Pyungsan & other 22006
AmtNo. of IPOsYear
(In 100 million KrW)
IPO Performance
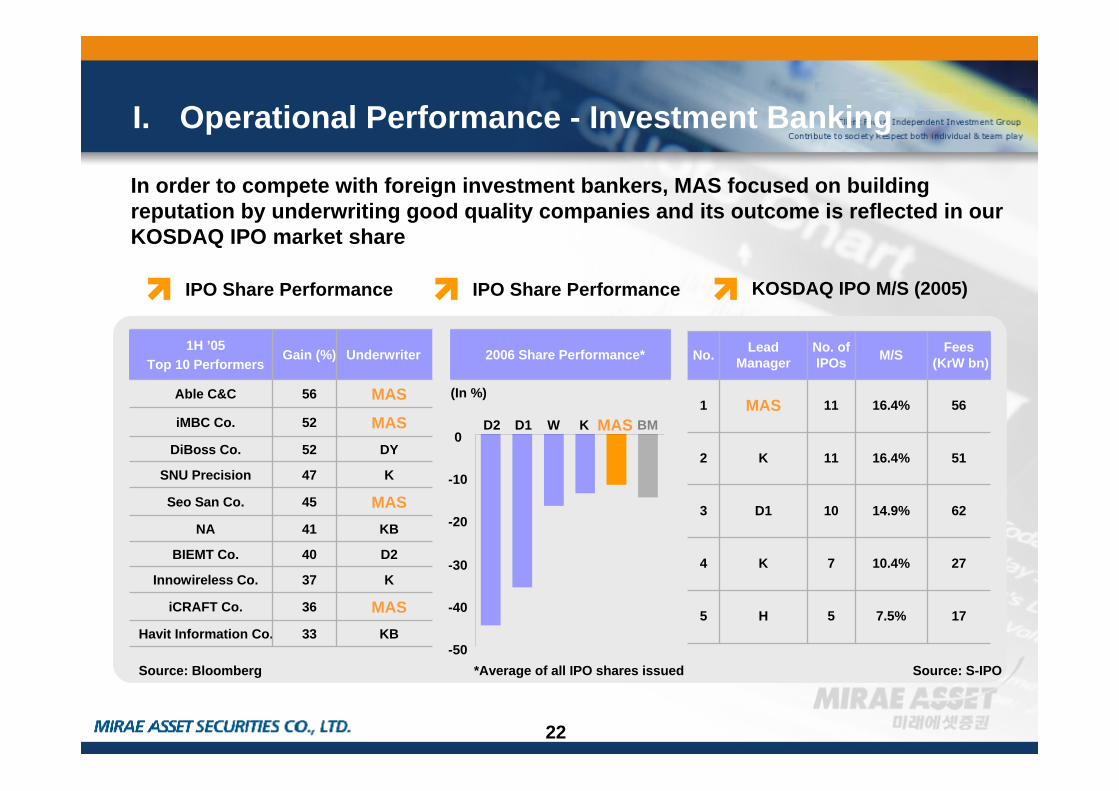
22
I. Operational Performance - Investment Banking
IPO Share Performance
KB41NA
DY52DiBoss Co.
MAS52iMBC Co.
K47SNU Precision
MAS56Able C&C
MAS45Seo San Co.
D240BIEMT Co.
KB33Havit Information Co.
MAS36iCRAFT Co.
K37Innowireless Co.
UnderwriterGain (%)1H ’05
Top 10 Performers
-50
-40
-30
-20
-10
0D2 D1 W K MAS BM
2006 Share Performance*
6214.9%10D13
2710.4%7K4
7.5%
16.4%
16.4%
M/S
17 5H5
5111K2
5611MAS1
Fees(KrW bn)
No. ofIPOs
LeadManagerNo.
Source: S-IPO
KOSDAQ IPO M/S (2005)IPO Share Performance
(In %)
Source: Bloomberg *Average of all IPO shares issued
In order to compete with foreign investment bankers, MAS focused on building reputation by underwriting good quality companies and its outcome is reflected in our KOSDAQ IPO market share

23
I. Operational Performance - Investment Banking
OTC PerformancePEF Performance DLS Performance
Source: FSS(In 100 million KrW)
90417ELW
6,291110Total
65013DLS
4,73180ELS
AmtNo. of Issue
Derivative Offerings
7,910
6,110
400
1,400
Amt
Sep ‘06Mirae Asset Partners 3
Total
Sep ‘05Mirae Asset Partners 2
Dec ‘04Mirae Asset Partners 1
Date ofIssue
PEFOfferings
MAS is leading the PEF industry with 46% M/S since the company’s first industry offering in Dec ’04. This success is continued with OTC derivative products with 67% M/S in public DLS placements since regulatory approval in March of ’06
S D1 W MAS H
650
271
400
620
1,193
(In 100 million KrW)

24
I. Changing Market EnvironmentII. Strategy in Fund MarketIII. Future Growth DriversIV. Network ExpansionV. Corporate PensionVI. Investment Summary
LONG-TERM GROWTH STRATEGY

25
I. Changing Market Environment
Bank
Integration
Under
CMISA
Insurance
BankSecurities
Futures
Asset Mgmt & Other
Insurance
Derivatives, FX Etc
Regulatory Changes (IB at center)
Individual : Direct Indirect Market
Investors’ preference is shifting from bank deposit’s to equity and from direct equity market to indirect investments. With upcoming regulatory changes, this trend is expected to accelerate
20032006
Shift in Household Asset
0
20
40
60
Bank Savings Equity FI Insurance Other
Source: Korea Bank
- Standardized product Customized prod/Services ☞ Importance of ability to design new products and
offer consulting services
1. Asset/Wealth Management
- Agent/Broker Principal
2. Investment Banking6
16
26
36
46
56
Jan ‘03 Jan ‘04 Jan ‘05 Jan ‘06 Jan ‘07
(4)(2)0246
Equity-Type Fund (LHS)Net Inflow (RHS)
-5T
(In KrW trillion)
+35T
Source: AMAK, MAS Research
(In %)

26
Source: AMAK
12
0.6
Mar ‘03 Dec ‘06
Total equity fund market
MAS equity-type funds balance
(In KrW trillion)
5.3
I. Strategy in Fund Market
Capital inflow to equity-type financial products is accelerating and MAS is well positioned to grasp future growth
47
2010
4X
9X
Installment funds
Aging population
Corporate Pension
Variable insurance
Globalization
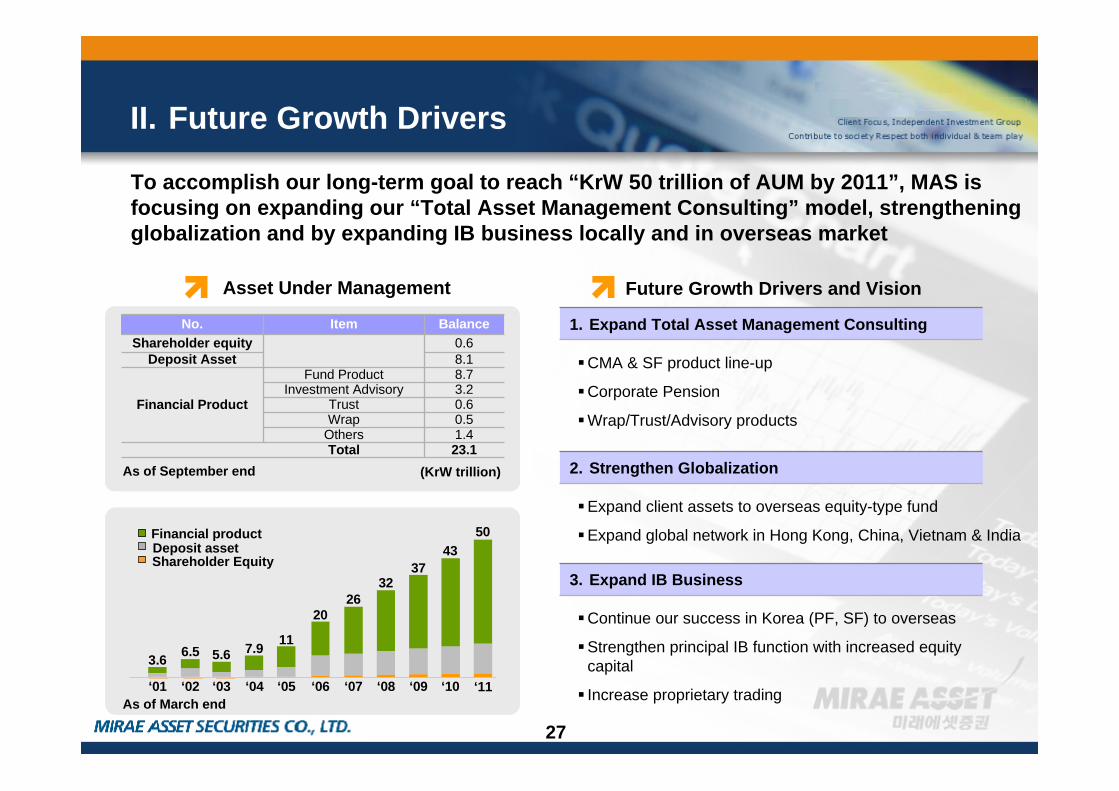
27
II. Future Growth Drivers
As of March end
0.5Wrap1.4Others
8.7Fund Product
Financial Product3.2Investment Advisory0.6Trust
23.1Total
8.1Deposit Asset0.6Shareholder equity
BalanceItemNo.
As of September end
Financial productDeposit assetShareholder Equity
3.6 6.5 5.6 7.9 11
2026
3237
4350
‘01 ‘02 ‘03 ‘04 ‘05 ‘06 ‘07 ‘08 ‘09 ‘10 ‘11
(KrW trillion)
To accomplish our long-term goal to reach “KrW 50 trillion of AUM by 2011”, MAS is focusing on expanding our “Total Asset Management Consulting” model, strengthening globalization and by expanding IB business locally and in overseas market
Asset Under Management Future Growth Drivers and Vision
CMA & SF product line-up
Corporate Pension
Wrap/Trust/Advisory products
Expand client assets to overseas equity-type fund
Expand global network in Hong Kong, China, Vietnam & India
Continue our success in Korea (PF, SF) to overseas
Strengthen principal IB function with increased equity capital
Increase proprietary trading
1. Expand Total Asset Management Consulting
2. Strengthen Globalization
3. Expand IB Business

28
In order to leverage the current and upcoming business environment and regulatory changes, MAS is planning to expand its current 73 branch network to 150 within the next couple years
III.Network Expansion
MAS Network Expansion Plan
No. of EmployeesNo. of Branch Network
- CMISA : Opportunity due to regulatory changes(Enlargement of scale)
Environmental Changes
- Wider recognition and inflow of funds to indirect investments (IRAs, corporate pension, VUL etc)
- Effective means to transfer commercial banks’deposits (Demand Deposit KrW 162 T as of July ’06)
1. Capital Market and Investment Services Act
2. Investment Asset
3. Introduction of CMA
As of March end
8
66
EF/B
1,061
71
BranchEq. Fund
8,832
4,717
21,162
8,662 122MAS
20KB
AF/BAll FundAs of Oct ‘06
(In KrW Billion)
379887 1,0001,1001,1501,2001,250
533 594 603 667
25 28 35 35 4669
80100
120140 150
'01 '02 '03 '04 '05 '06 '07 '08 '09 '10 '11
8X 6X

29
MAS’s M/S in the securities industry corporate pension segment is already 18%, well positioned to grasp future growth leveraging Mirae Asset’s brand power
IV.Corporate Pension
Corporate Pension Market Outlook MAS M/S in Corporate Pension (CY2006)
Source: Korea Securities Dealers AssociationBased on 20% conversion in 2006 to reach 70% by 2015Source: MAS
7% growth assumption5% growth assumption
40
80
120
160
2007 2008 2009 2010 2015-
144133
4442
(In KrW billion) (In KrW trillion)
Pension Market (LHS)MAS M/S (RHS)
-
2,500
5,000
7,500
10,000
Jan '06 Mar '06 Jun '06 Sep '06 Dec '06
0%
1%
2%
3%
4%
5%

30
V. Investment Summary
Our strategy & track record- Chairman Park & CEO Choi
(1st gen. founder, knowledge/experience, dynamic mgmt. style, and youth)
Our positioning within the group and synergy creation
Our key differentiation-Revenue structure that is diversified, stable and growing
Growth Prospects- Asset management (Expand CMA, overseas equity-type fund and network)- Investment banking (Expand IB biz to Hong Kong, China, Vietnam & India)- Corporate pension (Cost center Profit center)

31
THANK YOU
For more information, please contact [email protected] or visit www.miraeasset.com.
Q & A

32
I. Income StatementII. Balance Sheet
APPENDIX

33
I. Income Statement
[KrW million]
Items Q3 FY2006 Q2 FY2006 Q1 FY2006 FY2005 FY2004 FY2003
Operating Income 186,230 123,062 132,736 432,134 272,842 293,905
A. Commissions Received 63,916 59,564 62,826 234,076 106,181 105,033
1) Brokerage commission 27,152 25,811 31,083 142,433 74,497 77,945
2) Underwriting commission 760 4,468 844 9,702 5,094 5,845
3) Brokerage Commission on beneficiary certificates 23,673 17,217 22,431 56,883 12,221 9,622
4) Commission from Wrap account & asset management 1,955 1,857 1,956 5,143 1,736 350
5) Others 10,376 14,145 6,512 19,915 12,633 11,271
B. Interest Income 18,835 15,754 12,035 48,796 19,184 21,844
C. Dividends Income 36 38 70 223 158 865
D. Distribution Income - 75 162 160 224 415
E. Gain on Sales of Trading Securities 8,540 9,147 14,261 45,806 36,088 23,347
F. Gain on Valuation of Trading Securities 7,251 (83) 2,141 1,422 1,522 80
G. Gain on Valuation of Deposits 5,622 5,647 6,077 18,384 12,705 14,479
H. Gain on Derivatives Transactions 14,548 14,985 20,492 83,180 96,780 127,836
I. Others 67,482 17,935 14,672 86 2 6
Operating Expenses 143,038 86,058 100,636 294,587 220,354 229,885
A. Other Operating Expenses 101,621 44,302 59,736 146,206 121,134 128,199 B. G&A Expenses 41,417 41,756 40,900 148,381 99,220 101,686
Net Revenue (Operating Profit + G&A Expenses) 84,609 78,760 73,000 285,928 151,708 165,706
Operating Profit 43,192 37,004 32,100 137,546 52,488 64,020
Net Profit (Before Tax) 43,873 36,634 32,429 128,349 46,570 63,261
Net Income (After Tax) 32,085 26,569 23,343 91,527 31,261 43,662

34
II. Balance Sheet
[KrW million]
Items Q3 FY2006 Q2 FY2006 Q1 FY2006 FY2005 FY2004 FY2003
Total Assets 3,309,592 2,749,859 2,476,218 1,509,682 824,258 704,979
Ⅰ. Current Assets 3,138,736 2,588,435 2,315,391 1,373,547 677,867 602,121
Ⅱ. Fixed Assets 170,856 161,424 160,827 136,134 146,391 102,858
Total Liabilities 2,724,926 2,196,809 1,949,424 979,442 578,715 481,301
Ⅰ. Current Liabilities 2,722,839 2,195,418 1,947,671 978,066 577,790 480,623
Ⅱ. Long-term Liabilities 2,087 1,391 1,753 1,377 926 678
Total Shareholder's Equity 584,666 553,050 526,793 530,239 245,542 223,678
I. Stockholder's Equity 134,925 134,925 134,925 134,750 112,800 112,800
II. Capital Surplus 213,133 213,134 213,133 213,032 35,721 35,721
III. Retained Earnings 237,418 205,502 178,932 182,539 98,908 76,685
IⅤ. Capital Adjustment (810) (511) (197) (81) (1,887) (1,528)
Total Liabilities & Stockholder's Equity 3,309,592 2,749,859 2,476,217 1,509,682 824,258 704,979