masonite q2 2014 earnings call presentation final
DESCRIPTION
q2TRANSCRIPT

2014 Second Quarter Earnings Presentation
NYSE: DOOR
August 7, 2014

Safe Harbor / Non-GAAP Financial Measure
SAFE HARBOR / FORWARD LOOKING STATEMENTS This investor presentation contains forward-looking information and other forward-looking statements within the meaning of applicable Canadian and/or U.S. securities laws, including our discussion of improvements in the housing market and related markets and the effects of our pricing and other strategies, and the expected impact of the explosion at our Escourt Mill in South Africa. When used in this Investor Presentation, such forward-looking statements may be identified by the use of such words as “may,” might, “could,” “will,” would,” “should,” “expect,” “believes,” “outlook,” “predict,” “forecast,” “objective,” “remain,” “anticipate,” “estimate,” “potential,” “continue,” “plan,” “project,” “targeting,” or the negative of these terms or other similar terminology. Forward-looking statements involve significant known and unknown risks, uncertainties and other factors that may cause the actual results, performance or achievements of Masonite, or industry results, to be materially different from any future plans, goals, targets, objectives, results, performance or achievements expressed or implied by such forward-looking statements. As a result, such forward-looking statements should not be read as guarantees of future performance or results, should not be unduly relied upon, and will not necessarily be accurate indications of whether or not such results will be achieved. Factors that could cause actual results to differ materially from the results discussed in the forward-looking statements include, but are not limited to, general economic, market and business conditions; levels of residential new construction, residential repair, renovation and remodeling and non-residential building construction activity; competition; our ability to successfully implement our business strategy; our ability to manage our operations including integrating our recent acquisitions and companies or assets we acquire in the future; our ability to generate sufficient cash flows to fund our capital expenditure requirements and to meet our debt service obligations, including our obligations under our senior notes and our senior secured asset-backed credit facility; labor relations (i.e., disruptions, strikes or work stoppages), labor costs, and availability of labor; increases in the costs of raw materials or any shortage in supplies; our ability to keep pace with technological developments; the actions by, and the continued success of, certain key customers; our ability to maintain relationships with certain customers; new contractual commitments; our ability to generate the benefits of our restructuring activities; retention of key management personnel; environmental and other government regulations; limitations on operating our business as a result of covenant restrictions under our existing and future indebtedness, including our senior notes and senior secured asset-based credit facility; and other factors publicly disclosed by the company from time to time.
NON-GAAP FINANCIAL MEASURE Adjusted EBITDA is a measure used by management to measure operating performance. Adjusted EBITDA is defined as net income (loss) attributable to Masonite plus depreciation, amortization, restructuring costs, loss (gain) on sale of property, plant and equipment, impairment, registration and listing fees, interest expense, net, other expense (income), net, income tax expense (benefit), loss (income) from discontinued operations, net of tax, net income attributable to non-controlling interest and share based compensation expense. Adjusted EBITDA is not a measure of financial condition or profitability under GAAP, and should not be considered as an alternative to (i) net income (loss) or net income (loss) attributable to Masonite determined in accordance with GAAP or (ii) operating cash flow determined in accordance with GAAP. Additionally, Adjusted EBITDA is not intended to be a measure of free cash flow for management's discretionary use, as it does not include certain cash requirements such as interest payments, tax payments and debt service requirements. We believe that the inclusion of Adjusted EBITDA in this presentation is appropriate to provide additional information to investors about our operating performance. Not all companies use identical calculations, and as a result, this presentation of Adjusted EBITDA may not be comparable to other similarly titled measures of other companies. Moreover, Adjusted EBITDA as presented for financial reporting purposes herein, although similar, is not the same as similar terms in the applicable covenants in our ABL Facility or our senior notes. Adjusted EBITDA, as calculated under our ABL Facility or senior notes would also include, among other things, additional add-backs for amounts related to: cost savings projected by us in good faith to be realized as a result of actions taken or expected to be taken prior to or during the relevant period; fees and expenses in connection with certain plant closures and layoffs; and the amount of any restructuring charges, integration costs or other business optimization expenses or reserve deducted in the relevant period in computing consolidated net income, including any one-time costs incurred in connection with acquisitions. The table in the appendix sets forth a reconciliation of Adjusted EBITDA to net income (loss) attributable to Masonite for the periods indicated.
2

① Company / Industry Update
② Financial Review
③ Summary / Q&A

Company / Industry Update
U.S. Housing Completions
4
Multi Family Continues to Drive Growth in the U.S. Housing Market
Source: U.S. Census Bureau
9.4%
36.7%
15.4%
12.8%
-5%
0%
5%
10%
15%
20%
25%
30%
35%
40%
Single Family Multi Family Total Equivalent Units
U.S. New Housing Completions U.S. New Housing Completion Growth YTD
0
200
400
600
800
1,000
1,200
Jan
Feb
Ma
r
Ap
r
Ma
y
Jun
Jul
Au
g
Se
p
Oc
t
No
v
De
c
Jan
Feb
Ma
r
Ap
r
Ma
y
Jun
Jul
Au
g
Se
p
Oc
t
No
v
De
c
Jan
Feb
Ma
r
Ap
r
Ma
y
Jun
2012 2013 2014
(in 000s)

Company / Industry Update
Masonite Second Quarter 2014 Volume Growth
5
NA Wholesale & Retail are Tracking the U.S. New Housing & RRR Market
4.6
5.3
0
2
4
6
Q2'13 Q2'14
(in millions) (in millions)
NA Wholesale Customers* NA Retail Customers^
Q2 2014 Volume Growth: +5% Q2 2014 Volume Growth: +15%
(*) – Management believes that 70% / 30% of NA Wholesale customer volume is driven by new housing construction & residential RRR spending, respectively. (^) – Management believes that 10% / 90% of NA Retail customer volume is driven by new housing construction & residential RRR spending, respectively.
1.6 1.7
0
2
4
6
Q2'13 Q2'14

Company / Industry Update
U.S. Housing Starts
6
U.S. New Housing Starts Remain Choppy with Equivalent Starts Up Slightly
U.S. New Housing Starts
Source: U.S. Census Bureau
0
200
400
600
800
1,000
1,200
Jan
Feb
Ma
r
Ap
r
Ma
y
Jun
Ju
l
Au
g
Se
p
Oc
t
No
v
De
c
Jan
Feb
Ma
r
Ap
r
Ma
y
Jun
Ju
l
Au
g
Se
p
Oc
t
No
v
De
c
Jan
Feb
Ma
r
Ap
r
Ma
y
Jun
2012 2013 2014
U.S. New Housing Start Growth YTD
0.0%
19.8%
5.6%
3.3%
-5%
0%
5%
10%
15%
20%
25%
30%
35%
40%
Single Family Multi Family Total Equivalent Units
(in 000s)

(AU
P G
row
th %
, year
ov
er
ye
ar)
7
NA Average Unit Price Has Increased for Five Consecutive Quarters
NA Pricing Environment is Improving NA Average Unit Price is Increasing
~$10 Million of Pricing Expected Q3’14 – Q1’15^ Pricing Environment Helping Drive Positive NA AUP
$-
$5
$10
$15
Q3 '14 Q4 '14 Q1 '15
Impact of Previously Disclosed Pricing
Company / Industry Update
North American Average Unit Price Has Been Improving
• Q1’14 pricing actions of mid-high single
digit* increase across interior & exterior NA
retail & U.S. wholesale doors were fully
realized:
• ~$10 million of net pricing benefits
were captured during Q2’14
• Additional North American pricing actions
are expected over time as we seek fair
value for our high quality products and
services.
(*) – The 2014 impact of North American retail pricing is expected to be up low-mid single digits once prior year price concessions are taken into account. (^) – Management believes the majority, but not all, of this incremental pricing versus year-ago will be accretive.
-6.0%
-4.0%
-2.0%
0.0%
2.0%
4.0%
6.0%
8.0%
Q1
'11
Q2
'11
Q3
'11
Q4
'11
Q1
'12
Q2
'12
Q3
'12
Q4
'12
Q1
'13
Q2
'13
Q3
'13
Q4
'13
Q1
'14
Q2
'14

Company / Industry Update
Portfolio Optimization: Tuck In Acquisitions
8
Tuck-in Acquisitions Have Helped Create Leadership Positions for Masonite
Acquisitions are a Key Part of Masonite’s Balanced Growth Strategy
Similar
Technology
Distribution
Synergy
Brand
Positioning
Geographically
Translatable
Actionable Value
Creation
Select assets of:

Company / Industry Update
Portfolio Optimization: Market Exits
9
Masonite is Focused on Markets & Products with High Return Potential
Recent Geographic Exits: • Poland 2014
• Hungary 2012
• Romania 2012
• Ukraine 2010
• Turkey 2010
Non-Strategic Markets: • Limited growth potential
• Highly fragmented markets
• Poor cash flow characteristics • Low margins • Antiquated equipment • Extended payment terms
• High bad debt expense
– Existing Masonite Markets
Masonite has Exited Several Underperforming Markets Since 2010
Masonite Israel: • Represents ~1.0% net sales

Company / Industry Update
Five Focus Areas Designed to Accelerate Growth
Automation
Product Line Leadership
Electronic Enablement
Sales and Marketing Excellence
Portfolio Optimization: Strategic Tuck-ins & Market Exits
10
Goal: Grow Share & Expand Margins Beyond Macro Economic Recovery

① Company / Industry Update
② Financial Review
③ Summary / Q&A
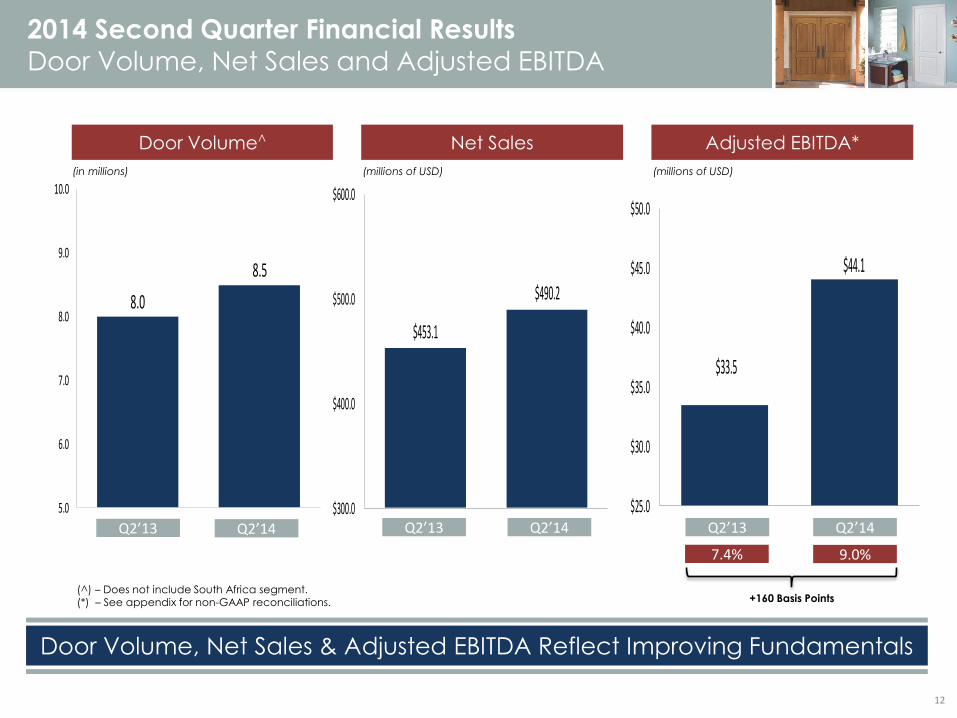
$33.5
$44.1
$25.0
$30.0
$35.0
$40.0
$45.0
$50.0
Q2'13 Q2'14
$453.1
$490.2
$300.0
$400.0
$500.0
$600.0
Q2'13 Q2'14
8.0
8.5
5.0
6.0
7.0
8.0
9.0
10.0
Q2'13 Q2'14
Net Sales Adjusted EBITDA* Door Volume^
(in millions) (millions of USD) (millions of USD)
Q2’13 Q2’14 Q2’13 Q2’14 Q2’13 Q2’14
(^) – Does not include South Africa segment. (*) – See appendix for non-GAAP reconciliations.
2014 Second Quarter Financial Results
Door Volume, Net Sales and Adjusted EBITDA
12
Door Volume, Net Sales & Adjusted EBITDA Reflect Improving Fundamentals
9.0% 7.4%
+160 Basis Points
(*) – See appendix for non-GAAP reconciliations
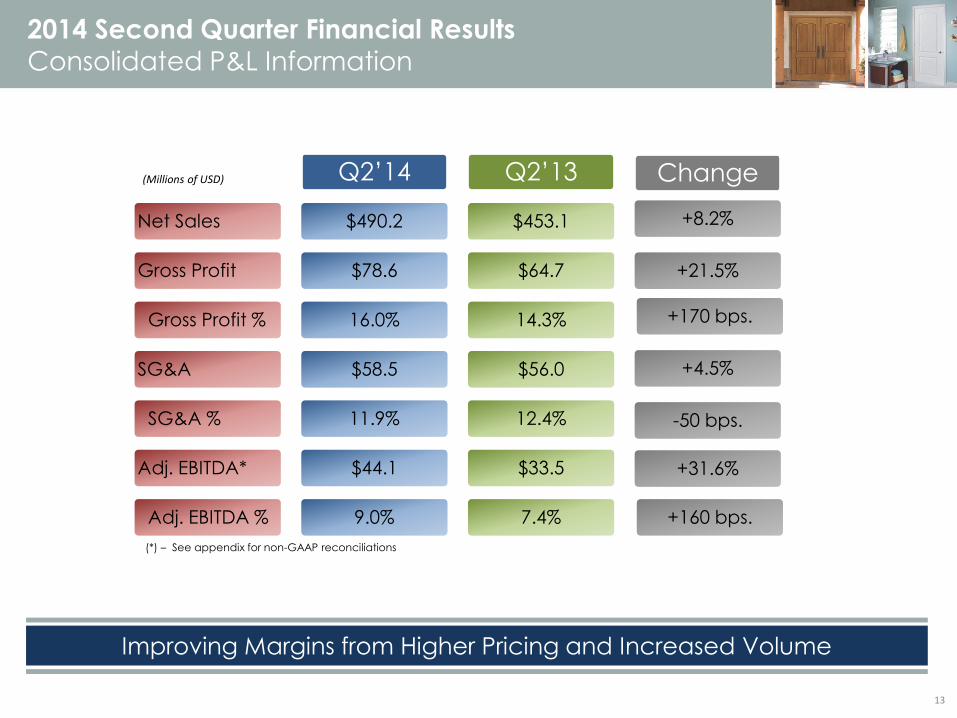
Net Sales
Gross Profit
Gross Profit %
SG&A
SG&A %
Adj. EBITDA*
Adj. EBITDA %
Q2’14
$490.2
$78.6
16.0%
$58.5
11.9%
$44.1
9.0%
Q2’13
$453.1
$64.7
14.3%
$56.0
12.4%
$33.5
7.4%
Change
+8.2%
+21.5%
+170 bps.
+4.5%
-50 bps.
+31.6%
+160 bps.
2014 Second Quarter Financial Results
Consolidated P&L Information
13
Improving Margins from Higher Pricing and Increased Volume
(Millions of USD)

14
Highest Adjusted EBITDA Margin in 5 Years
2014 Second Quarter Financial Results
Adjusted EBITDA Margin Progression
0.0%
1.0%
2.0%
3.0%
4.0%
5.0%
6.0%
7.0%
8.0%
9.0%
10.0%
Q1'11 Q2'11 Q3'11 Q4'11 Q1'12 Q2'12 Q3'12 Q4'12 Q1'13 Q2'13 Q3'13 Q4'13 Q1'14 Q2'14
Adjusted EBITDA Margin Benefitted from Pricing and an Improving U.S. Housing Market
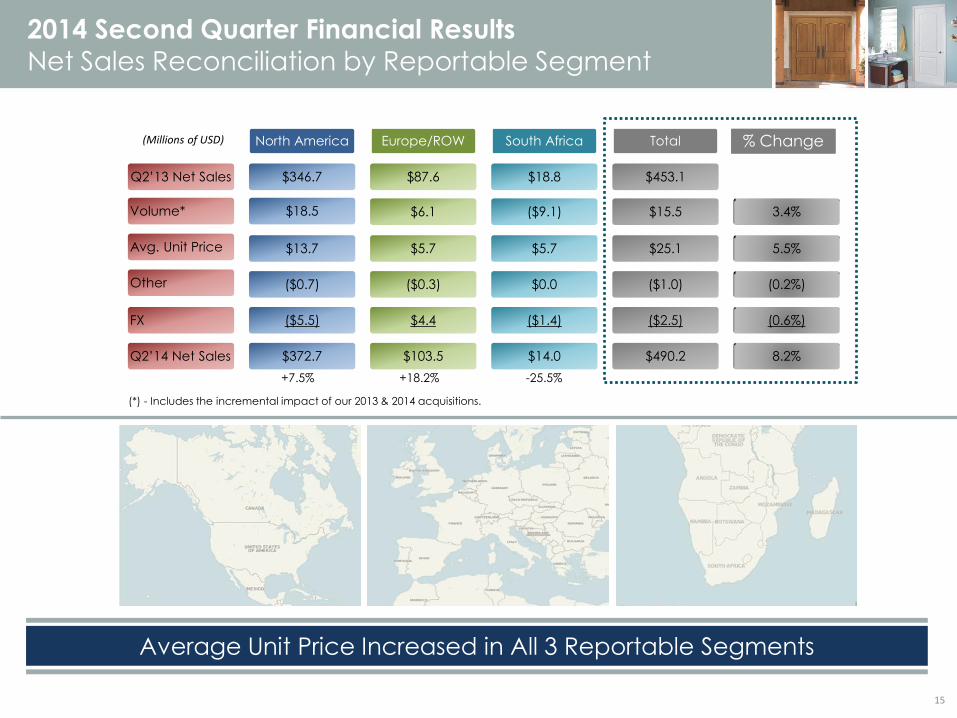
Q2’13 Net Sales
Volume*
Avg. Unit Price
Other
FX
Q2’14 Net Sales
North America
$346.7
$18.5
$13.7
($0.7)
($5.5)
$372.7
Europe/ROW
$87.6
$6.1
$5.7
($0.3)
$4.4
$103.5
South Africa
$18.8
($9.1)
$5.7
$0.0
($1.4)
$14.0
Total
$453.1
$15.5
$25.1
($1.0)
($2.5)
$490.2
3.4%
5.5%
(0.2%)
(0.6%)
8.2%
(*) - Includes the incremental impact of our 2013 & 2014 acquisitions.
(Millions of USD)
+7.5% +18.2% -25.5%
% Change
2014 Second Quarter Financial Results
Net Sales Reconciliation by Reportable Segment
Average Unit Price Increased in All 3 Reportable Segments
15

16
Masonite Africa is Insured Against Property Loss & Business Interruption
Masonite Africa Business Interruption: • Explosion occurred June 6, 2014.
• Reduced site’s ability to generate steam & heat
the kilns which required the production lines to
cease operations for several weeks.
• Mill currently running at ~50% capacity.
• Expect ~75% pre-incident capacity by end of
August & 100% by the fourth quarter of 2014.
• Expect $6.0 - $7.0MM* Adj. EBITDA impact,
before any potential insurance recovery, with
the vast majority hitting the third quarter of 2014.
• Monitoring situation closely.
2014 Second Quarter Financial Results
Masonite Africa - Business Interruption
Masonite Africa
(*) – Assumes 65-75 million South African Rand with a conversion ratio of ~10.7 Rand to 1.0 USD.

Financial Policy & Coverage Ratios
Selected Cash Flow Data YTD 2014 YTD 2013
Cash flow from operations* $25.7 $2.5
Additions to property, plant & equipment ($20.0) ($16.3)
Cash used in acquisitions ($50.4) $0.0
Gross Proceeds from issuance of LT debt $138.7 $0.0
Payment of financing costs ($1.9) $0.0
Increase (decrease) in cash & cash equivalents
$86.7 ($29.4)
Target
financial
leverage
range
Unrestricted Cash $187.5
ABL Borrowing Base $122.9
AR Purchase Agreement $14.3
Total Available Liquidity $324.7
Liquidity at June 29, 2014 (millions of USD)
LTM Adj. EBITDA^ $110.0
LTM Interest Expense $37.4
Total Debt $514.1
Net Debt $326.6
2014 Second Quarter Financial Results
Liquidity, Credit and Debt Profile
Debt Issuance History
8.25% Senior Unsecured Notes due 2021
$0
$100
$200
$300
$400
$500
2011 2012 2013 2014
17
(*) – Cash flow from continuing operations was $25.7 million during the six months ending June 29, 2014 compared to $2.5 million last year due largely to the implementation of a new accounts payable processing system which has, temporarily, extended payments beyond our normal trade terms. (^) – See appendix for non-GAAP reconciliations.
Masonite’s Balance Sheet Remains Strong with Ample Liquidity Available
8.25% Senior Unsecured Notes due 2021
3.4
3.3
3.6
5.2
4.7
2.6 2.3
2.6
3.5
3.0 3.3
3.6
3.2
2.8 2.9
2.0 2.1 1.8
1.5 1.6
0.0
1.0
2.0
3.0
4.0
5.0
6.0
6/30/13 9/29/13 12/29/2013 3/30/2014 6/29/2014
Total Debt / Adj. EBITDA Net Debt / Adj. EBITDA
Adj. EBITDA / Interest (Adj. EBITDA - Capex) / Interest

$-
$5.0
$10.0
$15.0
$20.0
$25.0
$30.0
$35.0
$40.0
$45.0
$50.0
2011 Q1 2011 Q2 2011 Q3 2011 Q4 2012 Q1 2012 Q2 2012 Q3 2012 Q4 2013 Q1 2013 Q2 2013 Q3 2013 Q4 2014 Q1 2014 Q2
18
Historically, 3Q Adj. EBITDA is Flat to Slightly Down vs. Q2 Due to Seasonality*
2014 Second Quarter Financial Results
Adjusted EBITDA Has Historically Peaked During Q2
($ in millions)
(*) – In addition, Masonite Africa expects a $6.0 - $7.0MM Adjusted EBITDA impact, before any potential insurance recovery, with the vast majority of the impact hitting Q3’14.

① Company / Industry Update
② Financial Review
③ Summary / Q&A
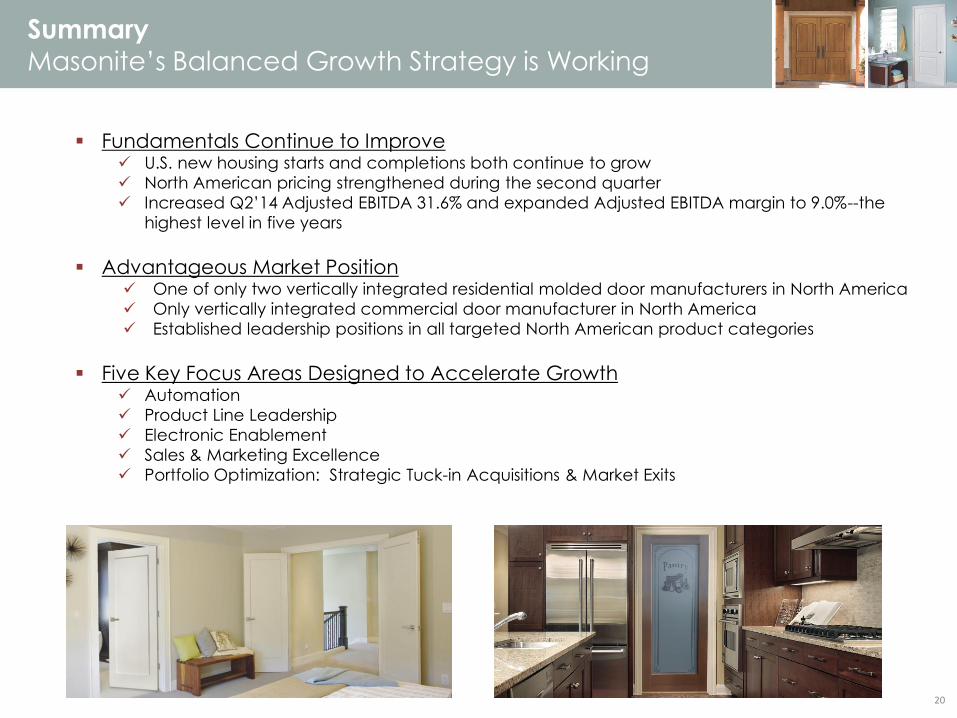
Fundamentals Continue to Improve U.S. new housing starts and completions both continue to grow
North American pricing strengthened during the second quarter
Increased Q2’14 Adjusted EBITDA 31.6% and expanded Adjusted EBITDA margin to 9.0%--the
highest level in five years
Advantageous Market Position One of only two vertically integrated residential molded door manufacturers in North America
Only vertically integrated commercial door manufacturer in North America
Established leadership positions in all targeted North American product categories
Five Key Focus Areas Designed to Accelerate Growth Automation
Product Line Leadership
Electronic Enablement
Sales & Marketing Excellence
Portfolio Optimization: Strategic Tuck-in Acquisitions & Market Exits
20
Summary
Masonite’s Balanced Growth Strategy is Working

Questions & Answers

Appendix

Reconciliation of Adjusted EBITDA to Net Income
(loss) Attributable to Masonite
23
(In thousands)
June 29,
2014
June 30,
2013
June 29,
2014
June 30,
2013
June 29,
2014
March 30,
2014
December 29,
2013
September 29,
2013
June 30,
2013
Adjusted EBITDA 44,050$ 33,461$ 63,768$ 59,638$ 110,007$ 99,418$ 105,877$ 113,687$ 110,240$
Less (plus):
Depreciation 14,536 15,651 29,982 32,177 59,885 61,000 62,080 63,544 63,898
Amortization 5,593 4,336 11,284 8,606 19,736 18,479 17,058 16,889 16,968
Share based compensation expense 2,797 2,081 5,080 3,911 8,921 8,205 7,752 7,664 7,609
Loss (gain) on disposal of property, plant and equipment 1,036 852 2,123 962 (614) (797) (1,775) 231 3,203
Impairment — 1,904 — 1,904 — 1,903 1,904 3,254 1,350
Registration and listing fees — — — — 2,421 2,421 2,421 1,998 —
Restructuring costs 560 1,762 1,281 3,202 8,709 9,911 10,630 10,847 13,411
Interest expense (income), net 10,594 8,208 20,587 16,458 37,359 34,973 33,230 33,169 32,808
Other expense (income), net 1,306 (363) 1,487 (521) 4,324 (949) 2,316 (1,445) (1,110)
Income tax expense (benefit) 1,379 (408) 1,398 (1,444) (18,535) (22,308) (21,377) (14,743) (8,612)
Loss (income) from discontinued operations, net of tax 170 44 312 134 776 649 598 236 224
Net income (loss) attributable to non-controlling interest 499 605 1,240 1,285 2,005 2,166 2,050 2,915 2,990
Net income (loss) attributable to Masonite 5,580$ (1,211)$ (11,006)$ (7,036)$ (14,980)$ (16,235)$ (11,010)$ (10,872)$ (22,499)$
Three Months Ended Six Months Ended Twelve Months Ended