masood, t., bojsen-møller, j., kalliokoski, k. k
TRANSCRIPT

This file was dowloaded from the institutional repository Brage NIH - brage.bibsys.no/nih Masood, T., Bojsen-Møller, J., Kalliokoski, K. K., Kirjavainen, A., Äärimaa, V.,
Magnusson, S. P., Finni, T. (2014). Differential contributions of ankle plantarflexors during submaximal isometric muscle action: a PET and EMG study. Journal of Electromyography & Kinesiology, 24, 367-374.
Dette er siste tekst-versjon av artikkelen, og den kan inneholde små forskjeller fra forlagets pdf-versjon. Forlagets pdf-versjon finner du på www.sciencedirect.com: http://dx.doi.org/10.1016/j.jelekin.2014.03.002 This is the final text version of the article, and it may contain minor differences from the journal's pdf version. The original publication is available at www.sciencedirect.com: http://dx.doi.org/10.1016/j.jelekin.2014.03.002

1
DIFFERENTIAL CONTRIBUTIONS OF ANKLE PLANTARFLEXORS DURING SUBMAXIMAL ISOMETRIC MUSCLE ACTION: A PET AND EMG STUDY
*1Tahir Masood MSc, 3,4Jens Bojsen-Møller PhD, 2Kari K. Kalliokoski PhD, 2Nina Sarja MSc, 5Ville Äärimaa MD, 4S. Peter Magnusson DSc and 1Taija Finni PhD
1Neuromuscular Research Center, Department of Biology of Physical Activity, University of Jyväskylä, Finland
2Turku PET Centre, Turku, Finland
3 Dept. Of Physical Performance, Norwegian School of Sport Sciences, Oslo, Norway
4 Institute of Sports Medicine Copenhagen & Musculoskeletal Rehabilitation Research Unit, Bispebjerg Hospital, Faculty of Health Sciences, University of Copenhagen, Copenhagen, Denmark
5Department of Orthopaedics and Traumatology, Turku University and University Hospital, Turku
*Corresponding author: [email protected]

2
ABSTRACT
The objective of this study was to investigate the relative contributions of superficial and deep
ankle plantarflexors during repetitive submaximal isometric contractions using surface
electromyography (SEMG) and high-resolution positron emission tomography (PET).
Myoelectric signals during submaximal isometric exercise were obtained from both legs of
twelve healthy volunteers (27 ± 4 yrs). A tracer ([18F]-FDG) was injected during the exercise and
PET scanning was carried out immediately after the cessation of exercise protocol. The targeted
muscles included the soleus, medial gastrocnemius (MG), lateral gastrocnemius (LG), and flexor
hallucis longus (FHL). Despite the existence of considerable individual and bilateral differences
in isometric MVC force production, muscle glucose uptake (GU) measured with PET and EMG of
various plantarflexors were comparable bilaterally. In terms of %EMG MVC, FHL and MG
displayed the highest activity (~34 %), while the activity of LG (~21 %) was the lowest.
Cumulative EMG from all parts of the triceps surae (TS) muscle accounted for ~70 % of the total
EMG signal. As for glucose uptake, the highest quantity was found in MG (2.4 ± 0.8
μmol/100g/min), whereas FHL (1.8 ± 0.6 μmol/100g/min) had the lowest uptake. Cumulative
GU of triceps surae muscle constituted nearly 80 % of combined GU of all four plantarflexors.
The findings of the current study provide valuable reference for studies where individual
muscle contributions are estimated using models and simulations.
Keywords: Positron Emission Tomography (PET), Electromyography (EMG), Isometric
plantarflexion exercise, Biomechanics, Achilles tendon, Glucose uptake.

3
INTRODUCTION
Ankle plantarflexion in humans is brought about by activation of two different sets of muscles;
superficial (triceps surae) and deep (e.g. flexor hallucis longus). The extent to which these two
muscle groups contribute to a plantarflexion task varies in individuals. Relative activation of
different plantarflexors during various tasks has been investigated using an in-situ buckle-type
force transducer on the Achilles tendon (Gregor et al. 1991), estimations based on cadaver
moment arm lengths and total muscle cross-sectional areas (van Zandwijk et al. 1998),
recordings of tendon forces with in-vivo optic-fiber technique (Finni et al. 2000), and
calculations of individual muscle contraction velocities using velocity-encoded cine phase-
contrast MRI (Finni et al. 2006). The amount of reported triceps surae (TS) contribution to the
total plantarflexion moment ranges from ~65% (Gregor et al. 1991) to ≥88% (van Zandwijk et al.
1998).
Previous studies have also established that the distribution of stress within different
compartments of TS muscle is not homogenous. Cadaver studies have shown differences in the
mediolateral forces within the Achilles tendon depending on how TS components were
activated or loaded (Arndt et al. 1999a, Arndt et al. 1999b, Lersch et al. 2012), and calcaneal
angle (Lersch et al. 2012). When all three muscles are loaded, lateral tendon forces are higher,
while, on the contrary, medial forces tend to be greater when medial gastrocnemius is loaded
alone (Arndt et al. 1999a). Similarly, significant differences in calcaneal moments can be seen
when both gastrocnemii are loaded together compared to soleus alone (Arndt et al. 1999b).
Furthermore, major inconsistency in soleus and gastrocnemius EMG, torque and force can stem
from small changes in the relative muscle lengths due to alterations in the ankle and knee joint
angles (Cresswell et al. 1995, Arndt et al. 1998).
Investigation of differential contributions of superficial and deep plantarflexors is challenging
due to estimations and assumptions leading to uncertainties. While in-vivo studies are scarce,
surface electromyography (SEMG) provides a convenient and non-invasive tool for studying
skeletal muscle activation. Conventional bipolar SEMG has been widely used to measure the

4
electrical activity of skeletal muscles during various physical activities (Hermens et al. 2000).
Despite the issues of optimal electrode positioning and signal reliability, SEMG provides
valuable and consistent information which corresponds to the skeletal muscle work (Merletti &
Conte 1997, Kleissen et al. 1997). SEMG can also be used to compare the contribution of
individual TS components to the Achilles tendon force during functional tasks (Gregor et al.
1991).
One of the limitations of the SEMG method is that it provides information about muscle activity
only from superficial regions, which may not represent the whole muscle (Knight & Kamen
2005). To study the whole muscle function, positron emission tomography (PET) enables non-
invasive investigation of muscle glucose uptake as a measure of muscle activation (Nuutila &
Kalliokoski 2000, Kalliokoski et al. 2007, Tashiro et al. 2008). Skeletal muscle glucose uptake is
increased during exercise due to a coordinated rise in glucose delivery rate, surface membrane
glucose uptake, and intracellular substrate flux through glycolysis (Rose & Richter 2005). Since
skeletal muscle glucose uptake rises in parallel with exercise intensity, it reflects muscle’s
metabolic activity (Kemppainen et al. 2002). High resolution PET, combined with tracers like
[18F]-Fluorodeoxyglucose ([18F]-FDG), has been employed to image and quantify glucose uptake
as a result of exercise in healthy tendons (Kalliokoski et al. 2005, Bojsen-Møller et al. 2006) and
skeletal muscles (Hargreaves 1998, Pappas et al. 2000, Fujimoto et al. 2000, Kemppainen et al.
2002, Hannukainen et al. 2005, Kalliokoski et al. 2007, Bojsen-Møller et al. 2010a, Rudroff et al.
2013).
Despite recent advances in PET imaging which enables assessment of muscle use during
plantarflexion, no reports on the attempts to validate it against EMG have surfaced thus far.
Although both SEMG and PET provide important insight into muscle behavior during exercise,
no study to-date has incorporated them to investigate the behavior of ankle plantarflexors in
voluntary contractions. Therefore, the purpose of this study was to evaluate muscle use during
submaximal isometric contractions by both SEMG and PET. More specifically, we were
interested whether the electrical and metabolic measures of muscle activity are comparable in
describing the relative contribution of superficial (TS) and deep (FHL) plantarflexion muscles.

5
MATERIALS AND METHODS
Subjects
Twelve healthy volunteers were recruited for the study through public advertisements. These
included eight males and four females with no history of a major leg injury over the past 12
months. The mean age, height, and body mass were 27 ± 4 (21 - 34) yrs, 174 ± 5 (163 - 180) cm,
and 68 ± 6 (59 - 78) kg respectively. Informed written consent, following the explanation of the
procedures and the risk involved, was obtained from all the participants before the testing.
Approval for the study protocol was issued by the Ethics Committee of the Hospital District of
South-Western Finland and conformed to the Declaration of Helsinki.
Experimental Protocol
Each subject took part in a series of tests at the Turku PET Centre, University of Turku, Finland.
A diagram of the experimental design is given in Fig. 1. All components of the study were
carried out on the same day for a subject. Participants were required to keep fasting for at least
8 hours prior to the PET scans. At the beginning, anthropometric measurements were obtained
which included body mass, height, and leg length readings.
Subject preparation comprised shaving, abrading, and cleaning of skin for surface
electromyography (SEMG), placement of electrodes on both legs, securing an electronic
goniometer to the ankle, and a pregnancy test in the case of female subjects. In addition,
catheters were inserted into the antecubital veins in both arms: one for venous blood sampling
and the other for [18F]-FDG tracer injection. This was followed by positioning of the subject in
the exercise apparatus for force and SEMG measurements. Subjects were helped to familiarize
themselves with the task by performing submaximal contractions with each leg. After a warm-
up, maximal Voluntary Contraction (MVC) force during plantarflexion was recorded individually
from both legs, and the highest of the three trials was selected for calculation of submaximal
force target level that in turn was used during subsequent exercise.

6
Exercise protocol: The exercise protocol consisted of a set of five 5 sec unilateral “constant-
force” submaximal, isometric contractions separated by a 5-second rest period. This was
accomplished alternately, one leg at a time. Subjects performed the task while sitting on a seat
placed on the floor with knees in full extension, hips flexed at right angle, and ankle in neutral
position (Fig. 2). The target force level selected for this task was 30% of the MVC. Subjects
received visual feedback of the plantarflexion force on a monitor in front of them. After 2 sets
of warm up contractions for both legs, about 150 MBq of [18F] FDG tracer was infused and
subsequently 10 sets of 5-s isometric contractions were performed, five repetition each, for
both legs. Thus the total time of exercise and rest before tracer injection was about 6-7 minutes
and the submaximal exercise protocol lasted for about 15 minutes post-injection. Blood
sampling for plasma radioactivity assessment was carried out repeatedly from the time of
tracer injection until cessation of the PET scan.
Immediately after the exercise bout, the subject was moved to the PET scanner on a wheelchair
in order to minimize additional use of leg musculature. Magnetic Resonance Imaging (MRI) was
performed after the PET scanning.
EMG and Force Acquisition and Analyses
Electromyographic data were recorded using conventional bipolar SEMG electrodes from both
legs. Silver-Silver Chloride Ambu Blue Sensor N electrodes (Ambu A/S, Ballerup, Denmark) with
an inter-electrode distance of 22 mm were placed, according to the SENIAM recommendations
(Hermens et al. 1999), over soleus, medial gastrocnemius (MG), and lateral gastrocnemius (LG)
muscles. For flexor hallucis longus (FHL), a pair of electrodes was placed after locating the
muscle behind the medial malleolus by manual palpation. Furthermore, a reference electrode
was secured on the medial malleolus of right ankle. EMG data was sampled via EISA (bandwidth
10 Hz to 1 kHz per 3 dB), a 10-channel EMG detection system (model: 16-2) (University of
Freiburg, Freiburg im Breisgau, Germany) at a sampling frequency of 1000 Hz). The signal was
pre-amplified with a factor of 200 by an integrated preamplifier in the shielded cables.
Analogue-to-digital conversion of EMG and force data was done through a Power1401 high-

7
performance multi-channel data acquisition interface (Cambridge Electronic Design Ltd.,
Cambridge, England). Compatible Signal 4.0 (Cambridge Electronic Design Ltd., Cambridge,
England) computer software was used for data recording, data reduction, and further analyses.
EMG signals from one set of 5 contractions were recorded separately for each leg from the
beginning, middle, and end of the exercise protocol. That resulted in data comprising 3 sets of 5
submaximal isometric contractions each for either leg.
EMG data was differentiated by high-pass filtering (second order Butterworth filter,
12dB/octave) with a cutoff frequency of 10 Hz to remove noise signal and correct DC offset. The
Root Mean Square (RMS) amplitude of each muscle was calculated from a 3-second epoch
during the middle of intermittent submaximal isometric contractions. This EMG RMS was
normalized to the RMS amplitude assessed from a 1-second time window during the MVC and
is denoted in the text as %EMG MVC. The occurrence of fatigue was checked by comparing the
RMS from the beginning, middle, and end of the exercise protocol. Additionally, Sol-to-FHL,
MG-to-FHL, and LG-to-FHL EMG muscle ratios during the submaximal exercise were computed
by dividing the respective normalized RMS muscle values. This was done to establish the
relative contributions of primary plantarflexors (triceps surae) to a secondary plantarflexor
(FHL). These calculations were based on the assumption that all plantarflexors were maximally
activated during MVC. Furthermore, cumulative EMG was computed by adding up electrical
activities of all four muscles, which was eventually used as the 100% value in the estimation of
the relative contribution from individual muscles to the isometric task.
Plantarflexion Force: Isometric ankle plantarflexion force was measured by an in-house custom-
built portable force transducer (University of Jyväskylä, Jyväskylä, Finland) (Fig. 2). The
transducer plate, mounted on a plastic stand, was secured in place by use of steel chains. The
chains, one on each side, were connected to the seat-back creating a rigid frame. Mean
absolute ankle plantarflexion force during the submaximal isometric contractions was
calculated along with the MVC force. The force signal was recorded via Signal 4.0 (Cambridge
Electronic Design Ltd., Cambridge, England) in synch with EMG at a sampling frequency of 1000
Hz.

8
Image Acquisition
PET: The participants were positioned supine in the scanner with radioactive markers on lateral
malleoli and medial femoral condyles to enable subsequent alignment of PET and MRI images.
A CTI-Siemens ECAT EXACT HR+ (Siemens, Knoxville, TN, USA) PET scanner was used. The legs of
the subject were scanned in four adjacent regions covering the whole leg region from toes to
lower thigh. The emission scan of each region lasted for approximately 5 minutes and was
followed with a transmission scan lasting about 2 minutes per region. Altogether the scan of
the legs with transition time between the regions took approximately 32 minutes.
MRI: In addition, MRI scanning was performed with 1.5 T Philips Intera MRI (Philips Healthcare,
Eindhoven, The Netherlands) for both legs for specific determination of muscle locations. Lipid
pills were taped to the same anatomical landmarks as used for radioactive markers in PET
scanning for later superimposition of the two data images.
Image Assessment
The obtained PET images were corrected for decay and parametric fractional uptake rate (FUR)
images were computed using the PET image data and the individual input function (plasma
radioactivity data) as described previously (Kemppainen et al. 2002, Fujimoto et al. 2003). The
regions of interest (ROIs) were drawn to include the whole individual muscle on the transverse
plane FUR images using Carimas 2.0 software (Turku PET Centre, University of Turku, Turku,
Finland). ROIs were drawn on every fourth cross-sectional PET image planes, which were
separated by approximately 1 cm from each other, and by the same investigator to avoid inter-
observer differences. FUR values were obtained for soleus, medial and lateral gastrocnemii, and
FHL. These values were then further converted to glucose uptake values using the following
formula:
𝐺𝐺𝐺𝐺𝐺𝐺𝐺𝐺𝐺𝐺𝐺𝐺𝐺𝐺 𝐺𝐺𝑢𝑢𝑢𝑢𝑢𝑢𝑢𝑢𝐺𝐺 (µmol/100g/min) =𝐹𝐹𝐹𝐹𝐹𝐹 x 𝑃𝑃𝐺𝐺𝑢𝑢𝐺𝐺𝑃𝑃𝑢𝑢 𝑔𝑔𝐺𝐺𝐺𝐺𝐺𝐺𝐺𝐺𝐺𝐺𝐺𝐺𝐿𝐿𝐺𝐺𝑃𝑃𝑢𝑢𝐺𝐺𝐿𝐿 𝐶𝐶𝐺𝐺𝐶𝐶𝐺𝐺𝑢𝑢𝑢𝑢𝐶𝐶𝑢𝑢

9
Plasma glucose level was obtained from the plasma sampling during the study. Lumped
constant is the value that takes into account differences in the uptake of glucose and 18F-FDG
from the blood and it has been shown to be 1.2 for skeletal muscle (Kelley et al. 1999,
Peltoniemi et al. 2000).
In order to examine the relative contribution of various plantarflexors, Sol-to-FHL, MG-to-FHL,
and LG-to-FHL muscle GU ratios were calculated, as was done for EMG. MRI images were used
as an anatomical reference to delineate the targeted muscles while regions of interest were
drawn on PET images. Similar to EMG, glucose uptake rate values from triceps surae and FHL
were added together and the resultant sum was taken as the 100% to estimate the relative
contribution of individual muscles during the exercise protocol.
Statistical analysis
IBM SPSS 20.0 (IBM Corporation, New York, USA) software was used for the statistical
treatment of the data. Normality of the data was checked by using Shapiro-Wilk test which
revealed that most of the data was not distributed normally. Therefore, a non-parametric test,
Wilcoxon signed-rank test, was used to compare the skeletal muscle glucose uptake and
electrical muscle activity of the two legs. Additionally, correlations between various muscles
(Pearson’s r) and parameters (Spearman's rank) were sought. Alpha (α) level of significance was
set at p value 0.05. The results are expressed as mean ± S.D (standard deviation).
RESULTS
Plantarflexion force: The mean MVC from right and left legs was 1133 ± 236 N vs. 1129 ± 192 N,
respectively. The 30% MVC target plantarflexion force maintained in the intermittent isometric
exercise protocol was 352 ± 71 N vs. 347 ± 55 N.

10
Electromyography
Neither plantarflexion force, nor SEMG, of the intermittent, voluntary, submaximal isometric
exercise protocol showed any signs of fatigue in terms of changes in the RMS (Fig. 3).
Therefore, the mean value of recordings from the beginning, middle, and end was taken to
represent each muscle’s electrical activity.
The highest MVC-normalized RMS activity was evident in FHL (34.05 ± 25% EMG MVC) and MG
(33.25 ± 12% EMG MVC), while LG (20.69 ± 12% EMG MVC) displayed the lowest activity.
Combined RMS of the three TS components constituted 69 ± 13% of the cumulative EMG while
FHL accounted for the remaining 31 ± 13% (Fig. 4A). The most active component of TS relative
to FHL was MG in both right (1.3 ± 0.5) and left legs (1.2 ± 1.2) without significant differences
between the ratios (Fig. 5).
Muscle-Tendon Glucose Uptake
Representative MRI and PET images from a subject in the study are shown in Fig. 6. Mean
bilateral muscle and tendon glucose uptake was very similar. The unit for all values reported
here is: μmol/100g/min. The highest uptake was present in MG in both right and left legs (2.4 ±
0.8 and 2.6 ± 0.8 respectively). Both soleus and LG displayed similar GU rate (right: 2.1 ± 0.6,
left: 2.1 ± 0.6 vs. right: 2.1 ± 0.8, left: 2.1 ± 0.6). The lowest uptake was observed in FHL (right:
1.8 ± 0.6, left: 1.8 ± 0.6). Combined data from the two legs revealed that collective TS muscle
GU accounted for 79% (SD: 4) of overall GU by all four investigated plantarflexors (Fig. 4B).
Similarly to EMG, no differences in the relative muscle GU were found between the legs. All TS
components were shown to be considerably more active compared to FHL. MG-to-FHL ratio
was (~1.4 ± 0.3) while both soleus and LG had very similar ratio with FHL (~1.2 ± 0.3) (Fig. 5B).

11
There was a significant positive correlation (P<0.005) among the GU of all muscles but no
association was evident in the case of SEMG.
DISCUSSION
This study revealed using surface EMG that the triceps surae contribution to overall
plantarflexion force is about 70 % while muscle glucose uptake suggests about 10 % greater
role for TS muscle group. The findings of the current study can provide valuable reference for
studies where individual contributions are estimated based on models and simulations.
The results revealed heterogeneous contribution from individual TS muscle
compartments during intermittent isometric exercise with 30 % MVC. In terms of SEMG, activity
of soleus was 24 % EMG MVC, MG 33 % EMG MVC, and LG 21 % EMG MVC. A previous study
has shown that mean EMG of soleus, MG, and LG at the beginning of a sustained, unilateral
submaximal (40% MVC) isometric exercise was ~43 % EMG MVC, ~33 % EMG MVC, and ~28 %
EMG MVC respectively, in older healthy male subjects (Mademli & Arampatzis 2005). In
dynamic exercises Kinugasa et al. (2005) reported that EMG activity in MG was 64-88 % EMG
MVC, soleus 49 % EMG MVC, and LG 57 % EMG MVC in repetitive, single leg calf-raise exercise.
In the same study, MRI technique revealed that only ~46 % of MG, in terms of muscle volume,
was activated compared to ~35 % in the case of soleus and LG (Kinugasa et al. 2005). The
differences between these studies may stem from different exercise modes, subject groups,
and differences in protocols. In the past, EMG of both gastrocnemius and soleus has been
shown to increase significantly over time during sustained unilateral submaximal isometric
exercise at 10-40 % MVC (McLean & Goudy 2004, Löscher et al. 2008, Pereira et al. 2011).
However, the present protocol applied intermittent contractions, instead of sustained, resulting
in no significant change in the EMG RMS during the exercise protocol.
Similar to the results for EMG, the MG had the highest GU (~2.5 μmol/100g/min).
Soleus and LG displayed a very similar GU behavior (~2.1 μmol/100g/min) while FHL had the
lowest GU among all muscles. In the past, Kemppainen et al (2002) measured muscle glucose
12
uptake per unit area of mass for quadriceps femoris muscle under both resting and exercising
conditions. Resting muscle GU was found to be very low and it increased significantly with an
increase in the exercise (cycle ergometry) intensity (30%, 55%, and 75% VO2max.). At 30% VO2max,
(91 ± 24 W) the uptake of 7.5 μmol/100g/min was reported which is more than twice the GU of
plantarflexors in our study. Another study (Hannukainen et al. 2005) reported the values of
~4.5 μmol/100g/min using the same protocol as Kemppainen et al, at (76.9 ± 15.6 W). Yet
another study, comparing GU response to exercise in trained and untrained men, reported
quadriceps femoris GU of ~5 μmol/100g/min in untrained men during cycle ergometry at 30%
VO2max (Fujimoto et al. 2003). Reasons for discrepancy in GU values in submaximal exercise may
include the use of different exercise modalities and examined muscle groups. Most other
studies are incomparable to the present because of either a different exercise device/intensity
(Oi et al. 2003, Kalliokoski et al. 2005, Reinking & Osman 2009) or a different quantifier was
used to report the glucose uptake [SUV (Rudroff et al. 2013) or ‘glucose uptake index’ (Bojsen-
Moller et al. 2006)]. Some studies used exercise for the whole body (Fujimoto et al. 1996,
Kilgore & Watson 1998) or only upper extremities (Pappas et al. 2001).
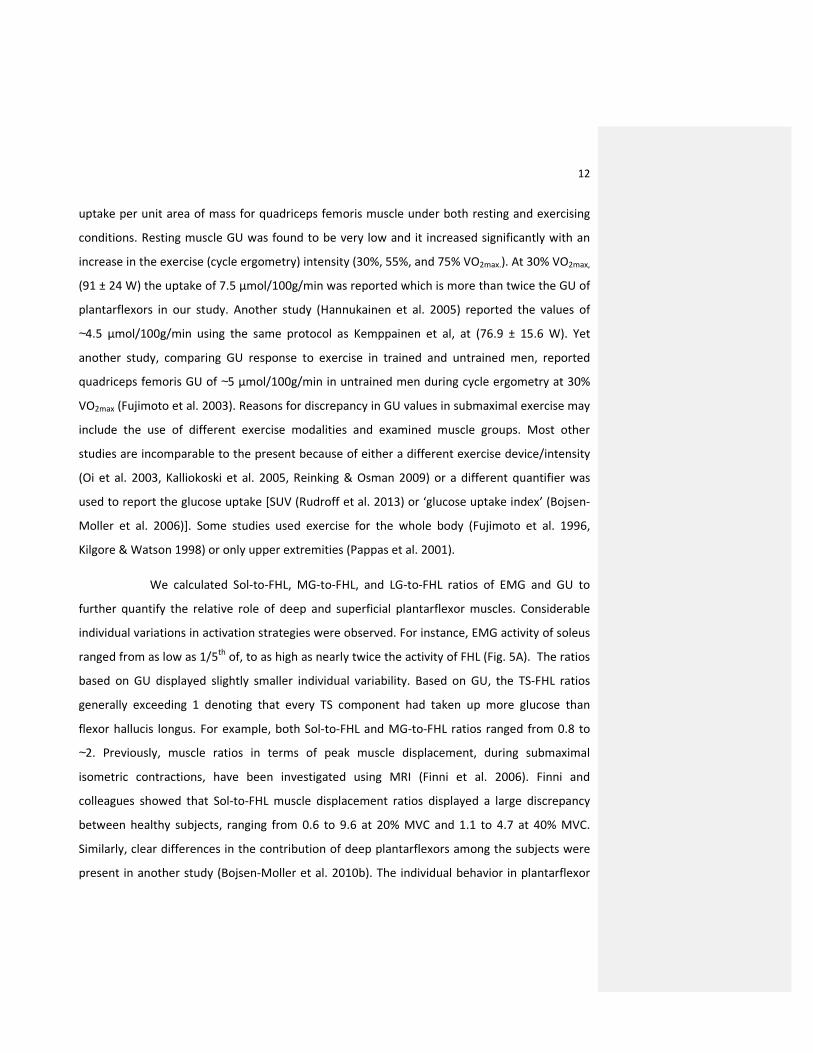
We calculated Sol-to-FHL, MG-to-FHL, and LG-to-FHL ratios of EMG and GU to
further quantify the relative role of deep and superficial plantarflexor muscles. Considerable
individual variations in activation strategies were observed. For instance, EMG activity of soleus
ranged from as low as 1/5th of, to as high as nearly twice the activity of FHL (Fig. 5A). The ratios
based on GU displayed slightly smaller individual variability. Based on GU, the TS-FHL ratios
generally exceeding 1 denoting that every TS component had taken up more glucose than
flexor hallucis longus. For example, both Sol-to-FHL and MG-to-FHL ratios ranged from 0.8 to
~2. Previously, muscle ratios in terms of peak muscle displacement, during submaximal
isometric contractions, have been investigated using MRI (Finni et al. 2006). Finni and
colleagues showed that Sol-to-FHL muscle displacement ratios displayed a large discrepancy
between healthy subjects, ranging from 0.6 to 9.6 at 20% MVC and 1.1 to 4.7 at 40% MVC.
Similarly, clear differences in the contribution of deep plantarflexors among the subjects were
present in another study (Bojsen-Moller et al. 2010b). The individual behavior in plantarflexor

13
coordination may potentially play a role when injury occurs or have functional significance
during rehabilitation from Achilles tendon injury (Finni et al. 2006).
Cumulative TS muscle GU accounted for 79 % of the total GU of all four muscles.
In the past, muscle moment investigations have established the input of TS to the residual
plantarflexion moment to be 65% on average while pedaling at power outputs of 90, 180, and
270W (Gregor et al. 1991). In another study, Arndt et al (1998) found that directly measured AT
moment was 121% of the resultant plantarflexion moment, under the forefoot, during
isometric plantarflexion at 25% MVC with nearly straight knee. This exceptionally high
contribution, as explained by the authors, was due to opposing moment from the antagonistic
dorsiflexors. Findings based on cadaver moment-arm length data and muscle cross-sectional
area had suggested that TS components were responsible for at least ~88% of total
plantarflexion moment (van Zandwijk et al. 1998). The present study by having only FHL as a
representative of the entire deep muscle compartment suggested ~70 - 80% contribution from
TS during submaximal task based on EMG and GU, respectively.
Even though there were some similarities between the findings from the two
methods, there was no real correlation observed between the two methods. This is consistent
with Rudroff et al. (2013) who concluded that PET was more sensitive, than SEMG, in revealing
modulation of physical activity in thigh muscles during fatiguing contractions of knee extensor
muscles at 25 % MVC force. In the current study, PET findings compared to SEMG are evident in
figure 5. Although the exercise protocol could theoretically be performed during the PET scan,
we chose to do the exercise before the PET scan. Such a protocol has been recently applied in
several other experiments (Kemppainen et al. 2002, Fujimoto et al. 2003, Hannukainen et al.
2005) made possible by the properties of [18F]-FDG that enables entrapment into the cells. As
there is some tracer still available in the plasma to be taken up by the cells after the cessation
of exercise, it may affect the measure of glucose uptake during exercise. However, this effect
has previously been estimated to be small (Kemppainen et al. 2002) and most probably in line
with the relative usage of the muscles during the preceding exercise. Thus, the lapse between

14
the cessation of exercise and image acquisition in our study is likely not to have affected the
data.
As expected, the mean maximal isometric force production was found to be
similar in right and left legs, even though significant bilateral and inter-individual variability
existed. The submaximal force levels maintained during the exercise protocol were high enough
to reveal appreciable muscle GU and low enough to enable the completion of the task without
the onset of fatigue. One assumption made in this study is that all compartments of TS muscle
were fully activated when MVC was recorded. Therefore, caution must be observed while
making inferences based on the findings. The SEMG results reported here are normalized to the
EMG RMS during the MVC and, thus, only represent the relative activation of the muscles. It
has been suggested in the literature that it is better to use M-wave, rather than % EMG MVC,
for the normalization of SEMG (Arabadzhiev et al. 2010) due to the factors influencing the
myoelectric signal, such as cross talk, amplitude cancellation, etc. (Farina et al. 2004).
The present study reports novel data on the relative contribution of superficial
and deep plantarflexor muscles during an isometric task using SEMG and high-resolution PET.
The findings from surface EMG suggest that the triceps surae contribution to plantarflexion
force is about 70 %. On the other hand, examination of muscle glucose uptake behavior, using
high-resolution PET, indicated 10 % greater role for TS muscle group in plantar flexor efforts.
These findings provide reference values for future research.
ACKNOWLEDGMENTS
The project was funded by research grants from Academy of Finland (TF) and Finnish Cultural
Foundation (KK).
REFERENCES

15
Arabadzhiev, T. I., Dimitrov, V. G., Dimitrova, N. A., & Dimitrov, G. V. (2010). Interpretation of
EMG integral or RMS and estimates of “neuromuscular efficiency” can be misleading in
fatiguing contraction. Journal of Electromyography and Kinesiology, 20(2), 223-232.
Arndt, A., Komi, P., Brüggemann, G. P., & Lukkariniemi, J. (1998). Individual muscle
contributions to the in vivo Achilles tendon force. Clinical Biomechanics, 13(7), 532-
541.
Arndt, A., Bruggemann, G. P., Koebke, J., & Segesser, B. (1999). Asymmetrical loading of the
human triceps surae: I. mediolateral force differences in the Achilles tendon. Foot &
Ankle International / American Orthopaedic Foot and Ankle Society [and] Swiss Foot
and Ankle Society, 20(7), 444-449.
Arndt, A., Brüggemann, G., Koebke, J., & Segesser, B. (1999). Asymmetrical loading of the
human triceps surae: II. differences in calcaneal moments. Foot & Ankle
international/American Orthopaedic Foot and Ankle Society [and] Swiss Foot and Ankle
Society, 20(7), 450.
Bojsen-Møller, J., Kalliokoski, K. K., Seppänen, M., Kjaer, M., & Magnusson, S. (2006). Low-
intensity tensile loading increases intratendinous glucose uptake in the Achilles
tendon. Journal of Applied Physiology, 101(1), 196-201.
Bojsen-Møller, J., Losnegard, T., Kemppainen, J., Viljanen, T., Kalliokoski, K. K., & Hallén, J.
(2010). Muscle use during double poling evaluated by positron emission tomography.
Journal of Applied Physiology, 109(6), 1895-1903.
Bojsen-Møller, J., Schwartz, S., Kalliokoski, K. K., Finni, T., & Magnusson, S. P. (2010).
Intermuscular force transmission between human plantarflexor muscles in vivo.
Journal of Applied Physiology, 109(6), 1608-1618.
Formatert: Norsk (bokmål)

16
Cresswell, A. G., Löscher, W., & Thorstensson, A. (1995). Influence of gastrocnemius muscle
length on triceps surae torque development and electromyographic activity in man.
Experimental Brain Research, 105(2), 283-290.
Farina, D., Merletti, R., & Enoka, R. M. (2004). The extraction of neural strategies from the
surface EMG. Journal of Applied Physiology, 96(4), 1486-1495.
Finni, T., Komi, P. V., & Lepola, V. (2000). In vivo human triceps surae and quadriceps femoris
muscle function in a squat jump and counter movement jump. European journal of
applied physiology, 83(4), 416-426.
Finni, T., Hodgson, J. A., Lai, A. M., Edgerton, V. R., & Sinha, S. (2006). Muscle synergism during
isometric plantarflexion in Achilles tendon rupture patients and in normal subjects
revealed by velocity-encoded cine phase-contrast MRI. Clinical Biomechanics, 21(1),
67-74.
Fujimoto, T., Itoh, M., Kumano, H., Tashiro, M., Ido, T., & Kitano, A. (1996). Whole-body
metabolic map with positron emission tomography of a man after running. The Lancet,
348(9022), 266.
Fujimoto, T., Itoh, M., Tashiro, M., Yamaguchi, K., Kubota, K., & Ohmori, H. (2000). Glucose
uptake by individual skeletal muscles during running using whole-body positron
emission tomography. European Journal of Applied Physiology, 83(4-5), 297.
Fujimoto, T., Kemppainen, J., Kalliokoski, K., Nuutila, P., Ito, M., & Knuuti, J. (2003). Skeletal
muscle glucose uptake response to exercise in trained and untrained men. Medicine
and Science in Sports and Exercise, 35(5), 777.
Gradinscak, D. J., Fulham, M. J., Mohamed, A., & Constable, C. J. (2003). Skeletal muscle uptake
detected on FDG PET 48 hours after exertion. Clinical Nuclear Medicine, 28(10), 840-
841.

17
Hannukainen, J., Kalliokoski, K., Nuutila, P., Fujimoto, T., Kemppainen, J., Viljanen, T., . . . Kjaer,
M. (2005). In vivo measurements of glucose uptake in human Achilles tendon during
different exercise intensities. International Journal of Sports Medicine, 26(9), 727.
Hargreaves, M. (1998). Skeletal muscle glucose metabolism during exercise: Implications for
health and performance. Journal of Science and Medicine in Sport, 1(4), 195-202.
Hermens, H. J., Freriks, B., Disselhorst-Klug, C., & Rau, G. (2000). Development of
recommendations for SEMG sensors and sensor placement procedures. Journal of
Electromyography and Kinesiology, 10(5), 361.
Hermens, H. J., Freriks, B., Merletti, R., Stegeman, D., Blok, J., Rau, G., . . . Hägg, G. (1999).
European recommendations for surface electromyography Roessingh Research and
Development, The Netherlands.
Jackson, R. S., Schlarman, T. C., Hubble, W. L., & Osman, M. M. (2006). Prevalence and patterns
of physiologic muscle uptake detected with whole-body 18F-FDG PET. Journal of
Nuclear Medicine Technology, 34(1), 29-33.
Kalliokoski, K. K., Bojsen‐Møller, J., Seppänen, M., Johansson, J., Kjaer, M., Teräs, M., &
Magnusson, S. P. (2007). Contraction-induced [18F]-Fluorodeoxyglucose uptake can be
measured in human calf muscle using high-resolution PET. Clinical Physiology and
Functional Imaging, 27(4), 239-241.
Kalliokoski, K. K., Kemppainen, J., Larmola, K., Takala, T. O., Peltoniemi, P., Oksanen, A., . . .
Nuutila, P. (2000). Muscle blood flow and flow heterogeneity during exercise studied
with positron emission tomography in humans. European Journal of Applied
Physiology, 83(4), 395-401.
Kalliokoski, K. K., Kuusela, T. A., Nuutila, P., Tolvanen, T., Oikonen, V., Teräs, M., . . . Knuuti, J.
(2001). Perfusion heterogeneity in human skeletal muscle: Fractal analysis of PET data.
European Journal of Nuclear Medicine and Molecular Imaging, 28(4), 450-456.

18
Kalliokoski, K. K., Langberg, H., Ryberg, A. K., Scheede-Bergdahl, C., Doessing, S., Kjaer, A., . . .
Kjaer, M. (2005). The effect of dynamic knee-extension exercise on patellar tendon and
quadriceps femoris muscle glucose uptake in humans studied by positron emission
tomography. Journal of Applied Physiology, 99(3), 1189-1192.
Kawakami, Y., Amemiya, K., Kanehisa, H., Ikegawa, S., & Fukunaga, T. (2000). Fatigue responses
of human triceps surae muscles during repetitive maximal isometric contractions.
Journal of Applied Physiology, 88(6), 1969-1975.
Kelley, D. E., Williams, K. V., Price, J. C., & Goodpaster, B. (1999). Determination of the lumped
constant for [18F] fluorodeoxyglucose in human skeletal muscle. Journal of nuclear
medicine: official publication, Society of Nuclear Medicine, 40(11), 1798.
Kemppainen, J., Fujimoto, T., Kalliokoski, K. K., Viljanen, T., Nuutila, P., & Knuuti, J. (2002).
Myocardial and skeletal muscle glucose uptake during exercise in humans. The Journal
of Physiology, 542(2), 403-412.
Kilgore, E. J., & Watson, N. E. (1998). Incidental, nontarget skeletal muscle uptake on whole
body (F-18)FDG PET scans. Clinical Positron Imaging : Official Journal of the Institute for
Clinical P.E.T, 1(4), 235.
Kinugasa, R., Kawakami, Y., & Fukunaga, T. (2005). Muscle activation and its distribution within
human triceps surae muscles. Journal of applied physiology, 99(3), 1149-1156.
Kleissen, R., Litjens, M., Baten, C., Harlaar, J., Hof, A., & Zilvold, G. (1997). Consistency of surface
EMG patterns obtained during gait from three laboratories using standardised
measurement technique. Gait & Posture, 6(3), 200-209.
Knight, C. A., & Kamen, G. (2005). Superficial motor units are larger than deeper motor units in
human Vastus Lateralis muscle. Muscle & nerve, 31(4), 475-480. Formatert: Norsk (bokmål)
19
Langberg, H., Skovgaard, D., Karamouzis, M., Bülow, J., & Kjær, M. (1999). Metabolism and
inflammatory mediators in the peritendinous space measured by microdialysis during
intermittent isometric exercise in humans. The Journal of physiology, 515(3), 919-927.
Löscher, W. N., Cresswell, A. G., & Thorstensson, A. (2008). Electromyographic responses of the
human triceps surae and force tremor during sustained sub-maximal isometric plantar
flexion. Acta physiologica scandinavica, 152(1), 73-82.
Mademli, L., & Arampatzis, A. (2005). Behaviour of the human gastrocnemius muscle
architecture during submaximal isometric fatigue. European journal of applied
physiology, 94(5), 611-617.
McLean, L., & Goudy, N. (2004). Neuromuscular response to sustained low-level muscle
activation: within-and between-synergist substitution in the triceps surae muscles.
European journal of applied physiology, 91(2), 204-216.
Merletti, R., & Lo Conte, L. R. (1997). Surface EMG signal processing during isometric
contractions. Journal of Electromyography and Kinesiology, 7(4), 241-250.
Merletti, R., Rainoldi, A., & Farina, D. (2001). Surface electromyography for noninvasive
characterization of muscle. Exercise and Sport Sciences Reviews, 29(1), 20-25.
Moritani, T., Oddsson, L., & Thorstensson, A. (1991). Activation patterns of the soleus and
gastrocnemius muscles during different motor tasks. Journal of Electromyography and
Kinesiology, 1(2), 81-88.
Nuutila, P., & Kalliokoski, K. (2000). Use of positron emission tomography in the assessment of
skeletal muscle and tendon metabolism and perfusion. Scandinavian Journal of
Medicine & Science in Sports, 10(6), 346-350.

20
Oi, N., Iwaya, T., Itoh, M., Yamaguchi, K., Tobimatsu, Y., & Fujimoto, T. (2003). FDG-PET imaging
of lower extremity muscular activity during level walking. Journal of Orthopaedic
Science, 8(1), 55-61.
Pappas, G. P., Olcott, E. W., & Drace, J. E. (2001). Imaging of skeletal muscle function using 18FDG PET: Force production, activation, and metabolism. Journal of Applied
Physiology, 90(1), 329-337.
Peltoniemi, P., Lönnroth, P., Laine, H., Oikonen, V., Tolvanen, T., Grönroos, T., . . . Nuutila, P.
(2000). Lumped constant for [18F] fluorodeoxyglucose in skeletal muscles of obese and
nonobese humans. American Journal of Physiology-Endocrinology and Metabolism,
279(5), E1122-E1130.
Pereira, G. R., de Oliveira, L. F., & Nadal, J. (2011). Isometric fatigue patterns in time and time–
frequency domains of triceps surae muscle in different knee positions. Journal of
Electromyography and Kinesiology, 21(4), 572-578.
Reinking, M. F., & Osman, M. M. (2009). Prospective evaluation of physiologic uptake detected
with true whole-body 18F-FDG PET/CT in healthy subjects. Journal of Nuclear Medicine
Technology, 37(1), 31-37.
Rose, A. J., & Richter, E. A. (2005). Skeletal muscle glucose uptake during exercise: How is it
regulated? Physiology, 20(4), 260-270.
Rudroff, T., Kalliokoski, K. K., Block, D. E., Gould, J. R., Klingensmith, W. C., & Enoka, R. M.
(2013). PET/CT Imaging of Age-and Task-Associated Differences in Muscle Activity
During Fatiguing Contractions. Journal of Applied Physiology.
Silbernagel, K. G., Gustavsson, A., Thomeé, R., & Karlsson, J. (2006). Evaluation of lower leg
function in patients with Achilles tendinopathy. Knee Surgery, Sports Traumatology,
Arthroscopy, 14(11), 1207-1217.

21
Tashiro, M., Itoh, M., Fujimoto, T., Masud, M. M., Watanuki, S., & Yanai, K. (2008). Application
of positron emission tomography to neuroimaging in sports sciences. Methods, 45(4),
300-306.
van Zandwijk, J. P., Bobbert, M. F., Baan, G. C., & Huijing, P. A. (1996). From twitch to tetanus:
performance of excitation dynamics optimized for a twitch in predicting tetanic muscle
forces. Biological cybernetics, 75(5), 409-417.

22
FIGURE LEGENDS:
Figure 1. Schematic diagram of the experimental protocol.
Figure 2. Experimental setup. The subject is pressing with her left foot against the force
transducer during a submaximal contraction. Intravenous catheters can be seen on both arms
for blood sampling and tracer injection. Also visible are some of the SEMG electrodes
connected to the acquisition device and an electronic goniometer around the right ankle.
Figure 3. Examples of raw recordings of force and EMG of Soleus (SOL) Medial gastrocnemius
(MG), and Lateral Gastrocnemius (LG) at the beginning, middle, and end of intermittent,
submaximal isometric contractions from the right leg of a subject.
Figure 4. Relative contributions of examined ankle plantarflexors under submaximal contracting
conditions based on surface EMG (A) and high-resolution PET (B). Values represent the percent
contribution of each muscle to the cumulative EMG or GU.
* Significant difference between the methods within a given muscle * (P<0.05), ** (P<0.01), ***
(P<0.005)
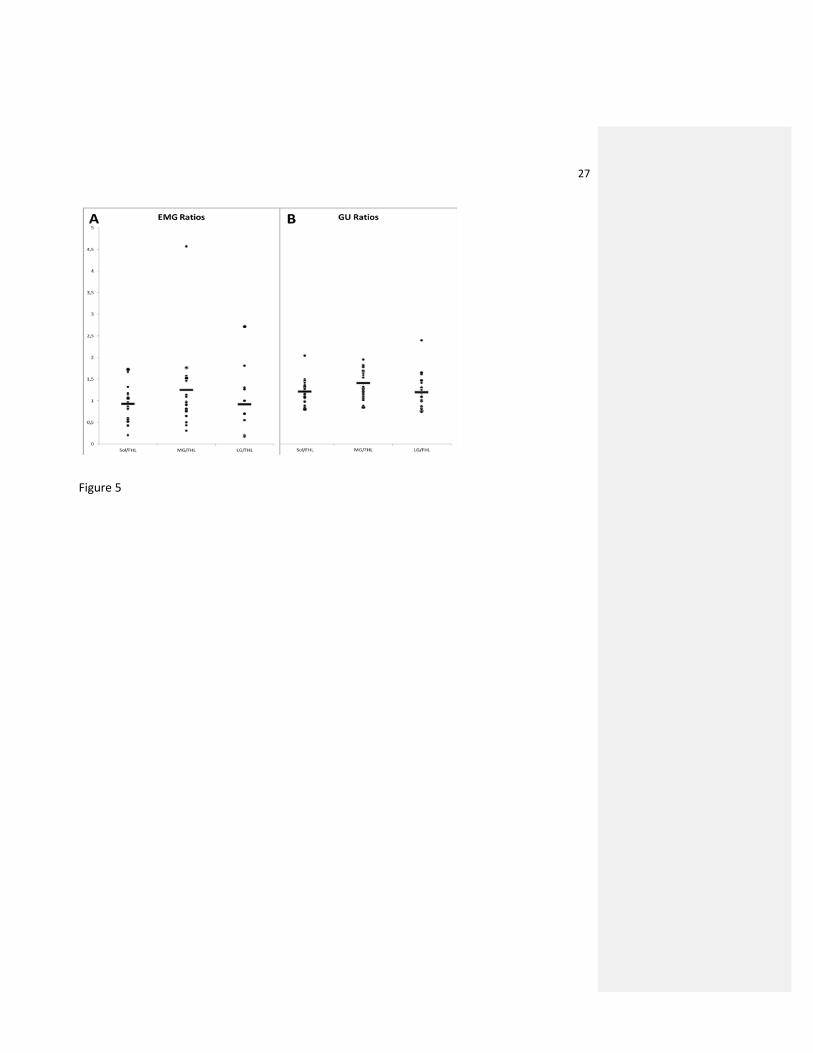
Figure 5. Comparison of triceps surae -to-flexor hallusis longus muscle ratios calculated using
EMG (A) and glucose uptake (B) during submaximal isometric contractions for both legs. Each
individual leg is represented by dot and mean values by horizontal line. (MG = Medial
Gastrocnemius, Sol = Soleus, LG = Lateral Gastrocnemius, FHL = Flexor Hallucis Longus) (Y-axis is
the same for both A and B)
Figure 6. Exemplary images from a subject in the study. MRI images from A) coronal (posterior),
B, axial, and C) sagittal sections and D,E,F) the same images superimposed with PET sinograms.
Region of interest drawings are visible on the triceps surae muscle of the left leg in B and one
calibration marker is visible on right lateral malleolus in D).

23
FIGURES
Figure 1

24
Figure 2

25
Figure 3

26
Figure 4
27
Figure 5

28
Figure 6