mass compressibili'iy of fractured chalk viepubs.surrey.ac.uk/773029/1/359742_vol1.pdf · the...
TRANSCRIPT

THE MASS COMPRESSIBILI'IY OF FRACTURED CHALK VI (",.fr-t>~· - ~~ I r \ .j, ,I
A thesis submitted to the University of Surrey for the Degree of
Doctor of Philosophy in the Department of Civil Engineering
by
MARCUS CHARLES MATTHEWS
B.Sc.(Hons.), M.Sc., F.G.S.
Volume 1
Introduction & Literature Review
DECEMBER 1993

To
my Father
Charles Franklin Matthews

SUMMARY
This thesis is concerned with the mass compressibility of fractured chalk and
its influence on the settlement of shallow foundations. A review of the
literature reveals nineteen case records of load-settlement behaviour from
relatively small diameter « 1m) plate loading tests but only six well
documented case records of the behaviour of shallow foundations on chalk.
The plate loading tests indicate that highly fractured near-surface chalk
undergoes yield at relatively low stresses (200 - 400kPa) resulting in a
significant reduction in stiffness. This behaviour contrasts with that observed
in other rock types with similar discontinuity patterns. For chalk it has only
been observed in one case record for a full-scale foundation. Little is
understood about the mechanisms causing yield.
At the time of starting this research, based largely upon the experience
..gained from in-situ loading tests carried out at Mundford, Norfolk (Ward et
aI., 1968), it was known that factors such as fracture spacing and aperture
played an important role in controlling the load-settlement behaviour of
shallow foundations. Little attention was paid to the large variation in intact
properties displayed by the chalk. In this research nine 1.8m diameter plate
loading tests have been carried out by the author on chalks with different
intact mechanical properties and similar discontinuity patterns. These data
are used to evaluate other in-situ tests (such as SPT, surface-wave geophysics
and visual assessment) as means of providing parameters for the prediction
of foundation settlement.
The results of this research indicate that fractured near-surface chalk
undergoes yield within the range of stresses likely to be imposed by shallow
foundations and that the pre-yield stiffness of the rock mass is controlled to a
large extent by the looseness of the fracture-block system, which in tum
appears to be associated with the intact mechanical properties of the rock.
The post yield-stiffness of the rock mass is generally about one tenth of the
pre-yield stiffness and is relatively insensitive to the rock material properties.
1

ACKNOWLEDGMENTS
The author would like to thank Prof. C.R.!. Clayton for his help and guidance
in carrying out the field work for this project and in the preparation of this
thesis. Special thanks are due to Chris Russell without whose hard work and
expertise the field work could not have been completed.
The author would like to thank the Building Research Establishment for the
loan of the 500 tonne plate loading test apparatus and Tony Butcher for his
help and advice concerning plate loading tests. The writer is particularly
grateful to Tony Butcher and Colin Abbiss of BRE for introducing the author
to surface-wave geophysics, and for their help with the fieldwork at
Leatherhead.
The author is also grateful to the following people for their help with the
preparation of the test sites and assembling the plate testing equipment:
Paul Cheesman
John Feldman
Bob Hillier
Vicki Hope
Roger Hopper
Brian Inch
Colin Sivewright
Ian Wilkinson
Peter Williams
Rick Woods
Special thanks are due to Adriano Bica whose help and advice with the
instrumentation proved invaluable.
11

The following organisations and individuals helped in providing the test sites
and assistance with site preparation:
Esso UK
Higgs and Hill pIc
Needham Chalks Ltd
Strott and Parker
The Expanded Piling Company
Brian Annis
Mr and Mrs Findley
John Seaman
Special thanks are given to Suffolk County Laboratory and Mike Burch for
carrying out Standard Penetration Tests and Dynamic Probing at the
Needham Market test site. Dynamic Probing was also carried out both at
Needham Market and at Leatherhead by Kevin McElmeel of BRE.
The author would like to thank Bill Ward for helpful discussion on the
background to the pioneering work on the mass compressibility of chalk
carried out at Mundford, Norfolk in the 1960's
The author is particularly grateful to Kevin Shaughnessy, Ian Davis and Chris
Bussey for their assistance in the production of this thesis.
Funding for this project was provided by an SERC research grant
(GRID 195883).
Finally the author would like to thank his parents for their support during the
period of this project.
111

CONTENTS
VOLUME 1
1.0 INTRODUCTION
2.0 LITERATURE REVIEW
2.1 Deposition, Diagenesis, Geological Structure
and Weathering
Deposition and Diagenesis
Mechanical Properties of Intact Chalk
Discontinuities in Chalk
Weathering
Summary
2.2 Mass Compressibility
Influence of Discontinuities
Load-Defonnation Behaviour of Fractured
Chalk
Behaviour of Foundations on Chalk
Nonnalised Load-Settlement Behaviour
Plate Loading Tests on Chalk
Summary
2.3 Methods of Assessing the Mass Compressibility
of Chalk
Pressuremeter Tests
Plate Load Tests
Geophysics
The Standard Penetration Test
Vzsual Assessment
Summary
2.4 Summary
. IV
Page
1
5
7
8
13
18
25
31
45
45
67
68
67
89
95
137
140
146
157
166
173
180
199

VOLUME 2
3.0 LOCATION OF TEST SITES AND
CHARACTERISATION OF CHALK
3.1 Test Site A: North Ormsby
Site Location
Topography
Geology
Rock Material and Rock Mass
Characteristics
3.2 Test Site B: Leatherhead
Site Location
Topography
Geology
Rock Material and Rock Mass
Characteristics
3.3 Test Site C: Needham Market
Site Location
Topography
Geology
Rock Material and Rock Mass
Characteristics
v
Page
204
208
208
209
210
215
235
235
235
236
237
260
260
261
261
264

Page
4.0 FIELD AND LABORATORY TESTING TECHNIQUES 287
4.1 Plate Loading Tests 290
Apparatus 292
Instrumentation 296
Procedure 311
Results of Plate Loading Tests 319
4.2 Other In-Situ Tests 380
Standard Penetration Tests 380
Dynamic Probing Tests 387
Geophysics 391
4.3 Laboratory Tests 427
Dry Density 428
Uniaxial Compressive Strength 433
Brazilian Tensile Strength 436
Intact Stiffness Characteristics of Chalk 437
On-Dimensional Compression Tests
on Intact Chalk 440
VI

VOLUME 3
5.0 DISCUSSION 453
5.1 Mechanical Properties of Intact Chalk 460
Dry Density 460
Uniaxial Compressive Strength 461
Brazilian Tensile Strength 466
Stiffness in Uniaxial Compression 468
Load-Deformation Behaviour
in Uniaxial Strain 471
Summary 476
5.2 Rock Mass Description 499
5.3 Load-Settlement Behaviour of Chalk 513
Initial Modulus E1 515
Post-Yield Modulus E~ 520
Yield Bearing Pressure q£. 522
Yield Bearing Pressure q~ 523
Collapse Settlement at
Needham Market (Site C) 524
Creep 526
Summary 531
.. Vll

5.4 Methods of Determining Mass Stiffness Parameters
Settlement Predictions using
Surface-Wave Geophysics
Settlement Predictions using
the Standard Penetration Test
Settlement Predictions using
Visual Assessment of the Rock Mass
Summary of Settlement Predictions
Cost Effectiveness of the Methods
of Settlement Prediction
Summary
5.5 Design of Plate Loading Tests
5.6 Design of Spread Foundations on Chalk
6.0 CONCLUSIONS AND RECOMMENDATIONS
6.1 Conclusion from Literature Review
6.2 Conclusions from Laboratory Studies
6.3 Conclusions from Field Studies
6.4 Implications for the Design of
Spread Foundations
6.5 Recommendations for Further Work
REFERENCES
APPENDIX A
APPENDIX B
Drill-hole logs, trial pit logs and face logs
Creep rate data
Vlll
Page
543
544
548
557
561
564
568
579
589
595
597
602
604
612
613
615
639
662

LIST OF TABLES
Table Title Page
Chapter 2
2.1/1 Zonal division of the Upper Cretaceous. 9
2.1/2 Range of index properties for the Chalk. 14
2.2/1 Characteristic load-deformation 57 behaviour for rock masses. (After Barton, 1986).
2.2/2 Summary of published case records of 69 the behaviour of foundations on chalk.
2.2/3 Parameters derived from average surface 72 settlement measurements (after Kee, 1974).
2.2/4 Percentage of immediate strains 77 recovered on unloading and values of Young's Modulus (after Ward et al. 1968).
2.2/5 Plate loading tests on chalk. 90
2.3/1 Methods used to determine the 139 deformation parameters of chalk.
2.3/2 Values of Poisson's Ratio determined 151 from unconfined compression tests (from Bell et al., 1990).
2.3/3 Principal types of elastic wave. 159
2.3/4 Basis of Wakeling's tentative correlation 168 between SPT 'N' and elastic modulus (from Wakeling, 1966).
2.3/5 Extended visual classification of the 176 chalk (after Clayton, 1990).
2.3/6 Correlation of engineering grade with 178 mechanical properties of chalk in the mass.
IX

Table Title Page
Chapter 3
3.1/1 Classification of the Upper Cretaceous 213 in the Northern (Yorkshire and Lincolnshire) and Southern (southern England) provinces (after Kent and Gaunt, 1980).
3.1/2 Field description of hardness. 216
3.1/3 Details of vertical joint sets at North 217 Ormsby.
3.3/1 Sub-vertical joint spacings. 265
Chapter 4
4.1/1 Rock Mass compressibility parameters 321 derived from plate loading tests.
4.2/1 Summary of SPT tests carried out at 381 plate test sites.
4.2/2 Summary of SPT tests carried out at site 382 A (North Ormsby).
4.2/3 Summary of SPT tests carried out at site 383 B (Leatherhead).
4.2/4 Summary of SPT tests carried out at site 386 C (Needham Market).
4.2/5 Test parameters for ASTM 1586 and 389 DIN 4094.
4.2/6 Details of Surface-Wave Tests at site A 401 (North Ormsby).
4.2/7 Details of Surface-Wave Tests at site B 403 (Leatberhead).
4.2/8 Details of Surface-Wave Tests at site C 404 (Needham Market).
4.3/1 Summary of dry density measurements. 432
x

Table Title Page
4.3/2 Summary of unconfined compressive 435 strength test results.
4.3/3 Summary of brazilian tensile strength 436 test results.
4.3/4 Summary of stiffness measurements on 440 intact chalk.
Chapter 5
5.1/1 Summary of uniaxial strain test results. 474
5.2/1 Assessment of looseness of the fracture- 503 block system.
5.3/1 Summary of rock mass compressibility 515 parameters derived from plate loading tests at the three test sites.
5.3/2 Rock mass factors for the three test 520 sites.
5.3/3 Ratio of qe to intact yield stress «(Jy). 523
5.4/1 Values of Go and m derived from 547 surface-wave seismic tests.
5.4/2 Ratio of observed settlement and 548 predicted settlement based on stiffness profiles determined from surface-wave seismic tests.
5.4/3 SPT N values. 553
5.4/4 Ratios of observed to predicted 554 settlements for a bearing pressure of 200kPa based on the Standard Penetration Test.
5.4/5 Degree of loading ('bet/ q(ult)u) for a 556 bearing p~essure of 200kPa .
. Xl

Table Title Page
5.4/6 Results of settlement predictions for a 562 bearing pressure of 200kPa based on visual assessment using the Mundford grading scheme devised by Ward et al. (1968).
5.4/7 Assessment of mass compressibility of 565 chalk based on visual assessment.
5.4/8 Logistics of in-situ measurements of 567 stiffness.
5.4/9 Unit cost of in-situ stiffness 568 measurements.
XlI

LIST OF FIGURES
Figure Title Page
Chapter 2
2.1/1 Variability of the chalk in terms of dry 33 density and porosity (from Clayton and Matthews, 1987).
2.1/2 Results of density tests on chalk from 33 West Surrey, Isle of Wight and the Isle of Purbeck (after Clayton and Matthews, 1987).
2.1/3 Variation of uniaxial compressive 34 strength of chalk with dry density and porosity (Data from Masson, 1973, Bell, 1977, Bonvallet, 1979, Woodland et aI., 1988, Clayton and Safari-Shooshtari, 1990, Bell et aI., 1990, Blight, 1990, Kroniger, 1990, Mortimore and Fielding, 1990, Nienhuis and Price, 1990, and Varley, 1990).
2.1/4 Variation of Brazilian tensile strength of 34 chalk with dry density and porosity (Data from Bell, 1977, Bell et aI., 1990, Kroniger, 1990, Mortimore and Fielding, 1990 and Nienhuis and Price, 1990).
2.1/5 Relationship between the uniaxial 35 compressive strength of dry and saturated specimens of chalk (Data from Masson, 1973, Bell, 1977, Bonvallet, 1979, Bell et al., 1990, Blight, 1990 and Kroniger, 1990).
2.1/6 Variation in stiffness of chalk with dry 35 density and porosity (Data from Bell, 1977, Bonvallet, 1979, Woodland et al., 1988, Bell et al., 1990, Kroniger, 1990 and Nienhuis and Price, 1990).
2.1/7 Typical stress-strain behaviour for intact 36 chalk (after Jardine et al. 1985).
Xl11

Figure Title Page
2.1/8 Variation of secant Young's modulus 36 with axial strain for chalk (after Jardine et al. 1985).
2.1/9 Yield observed in chalks of different 37 porosities when subjected to uniaxial (~) compression (after Leddra et al. 1993).
2.1/10 Map of southeastern England showing 37 the main structures affecting the Chalk.
2.1/11 (a) Block diagram showing relationships 38 between effective principal stresses and an extension fracture (E) and conjugate shear fractures (S) developed in a mechanically isotropic brittle rock. Stipple indicates the quadrants within which hybrid fractures form. (b) Composite failure envelope and Mohr circles constructed for 2a = 0, 45 and 60°. (T = tensile strength and ¢ = angle of internal friction. (after Hancock, 1985).
2.1/12 Rose diagrams showing typical grid lock 39 and joint spectrum discontinuity patterns in rock (after Rawnsley et al. 1990).
2.1/13 Typical system of jointing developed on 39 the linb of a fold (after Price, 1966).
2.1/14 (a) Frequency polygons for dominant 40 joint sets plotted against their strike for the Chalk recognised in the Chilterns. (b) Map of strikes of fracture sets observed in the northern Chilterns. (after Cawsey, 1977).
2.1/15 Frequency polygons showing the 41 variation in dip of the major joint sets recogniseg in the Chilterns (after Cawsey, 1977).
XlV

Figure Title Page
2.1/16 Block diagram illustrating orientation 42 and frequency of joints and faults in the chalk near Culver Cliff, Isle of Wight (after Fookes and Horswill, 1970).
2.1/17 Typical weathering profile for the Chalk. 43
2.1/18 Variation of vertical joint spacing with 44 depth for four sites in East Sussex (after Williams, 1987).
2.1/19 Variation of sub-horizontal fracture 44 spacing with depth for chalk, based on drillhole logs for Princes Quay, Hull (after Woodland et al. 1988).
2.2/1 Concave normal stress-deformation 99 behaviour of rock joints (after Bandis et al. 1983).
2.2/2 Measurements of the closure of natural 100 joints under normal stress (after Bandis et al. 1983).
2.2/3 Convex shear stress-displacement 100 behaviour of rock joints illustrating sample size dependence (after Bandis et al. 1981).
2.2/4 Mated and non-mated joints. 101
2.2/5 Relationship between joint contact area 101 and average normal stress for a variety of rock types including chalk (after Duncan and Hancock, 1966).
2.2/6 Relationship between joint contact area 102 and average normal stress for natural fractures in quartz monzonite (after Pyrak-Nolte et al. 1987, 1990).
xv

Figure Title Page
2.2/7 Constrasting load-deformation behaviour 103 for rock masses with different magnitudes of joint shear (S) and normal deformation (N) components (after Barton, 1986).
2.2/8 (a) Deformational response where the 104 joint sets are perpendicular to the imposed principal loads (after Chappell, 1979). (b) Results of a plate loading test on sandstone with predominantly sub-horizontal and sub-vertical joint sets (after Hobbs, 1973).
2.2/9 Simple models for studying the influence 105 of joint spacing on mass compressibility.
2.2/10 Variation in the ratio of mass stiffness to 106 intact stiffness with fracture frequency for fractures with different stiffnesses.
2.2/11 Variation in the ratio of mass stiffness to 106 intact stiffness with fracture frequency for fractures with different apertures.
2.2/12 Variation of rock mass factor (j) with 107 fracture frequency for chalk based on laboratory tests on artificial joints (after Wakeling, 1975).
2.2/13 Variation of rock mass factor (j) with 107 fracture frequency for joints with different initial contact area ratios.
2.2/14 Variation of rock mass factor (j) with 108 joint roughness expressed as the number of asperities per unit area (Na) for rock masses with different joint spacings.
2.2/15 Variation of rock mass factor (j) and 108 fracture frequency for chalk (after Hobbs, 1975).
XVI

Figure Title Page
2.2/16 Pressure distributions for a circular 109 foundation on a rock masses with different discontinuity set orientations (after Gaziev and Erlikhman, 1971).
2.2/17 Typical pressure-settlement curve for 110 Grades IV and III chalk (from Burland and Lord, 1970).
2.2/18 Silo foundations and positions of 111 levelling points and inspection shafts (after Burland and Bayliss, 1990).
2.2/19 Chalk grades based on visual inspection 112 of the chalk beneath the silos in shafts 1, 2, 3 and 4 (after Kee, 1974).
2.2/20 Settlement of Silo No.3 during first 113 loading (after Burland and Bayliss, 1990).
2.2/21 Settlement profiles for silo No. 3 during 113 first loading (after Burland and Bayliss, 1990).
2.2/22 Distribution of settlement with depth 114 beneath the centre of silo No.3 for various foundation pressures (after Burland and Bayliss, 1990).
2.2/23 Vertical strains beneath the centre of 114 silo No. 3 (after Burland and Bayliss, 1990).
2.2/24 Relationship between vertical stress and 115 depth beneath centre of silo when filled to capacity (after Nicoletto, 1979).
2.2/25 Stress distribution beneath a silo when 115 filled to capacity (after Nicoletto, 1979).
2.2/26 Vertical section showing the position of 116 the instrumentation used to monitor ground movements associated with the tank loading test at Mundford, Norfolk (after Ward et ale 1968).
XVII

Figure Title Page Section beneath tank showing the 117
2.2/27 distribution with depth of the immediate vertical deflections under maximum tank load at shafts 1, 2, 3 and 4, and the deflected shape of the ground surface (after Ward et aI., 1968).
2.2/28 Relationship between pressure and 118 immediate deflection at various levels in shafts 1 and 2 (after Ward et aI., 1968).
2.2/29 Short-term tank test; relationship 119 between time and vertical strain at various levels beneath the centre of the tank during loading, standing and then unloading (after Ward et aI., 1968).
2.2/30 Long-term tank test; relationship 119 between vertical deflection of level 1 (relative to level 6) in each shaft after completion of loading. The differential settlements at level 1 between the centre (Sl) and the edge (S2) of the tank are also shown (after Ward et aI., 1968).
2.2/31 Long-term tank test; relationship 120 between time and vertical strain for three levels beneath the tank over a period of one year (after Burland, 1975).
2.2/32 Profile of chalk grade at Luton, site D 121 (after Powell et aI., 1990).
2.2/33 Pressure-settlement curves for the slab 122 loading test carried out at Luton, site D (after Powell et aI., 1990).
2.2/34 Pressure-settlement curve for the slab 122 loading test at Luton, site D with the creep settlement removed (from Powell et al., 1990).
2.2/35 Profile of chalk grade at Luton, site C 123 (after Powell et al., 1990).
XVlll

Figure Title Page
2.2/36 Pressure-settlement curves for the 124 1710mm pad loading test carried out at Luton, site C (after Powell et aI., 1990).
2.2/37 Pressure-settlement curve for the 124 1710mm pad loading test at Luton, site C with the creep settlement removed (from Powell et al., 1990).
2.2/38 Simplified plan showing the arrangement 125 of the 1.98m and 3.35m square footings at Basingstoke (after Lake and Simons, 1975).
2.2/39 Relationship between time and average 125 settlement for the 1.98m and 3.35m square footings (after Lake and Simons, 1975).
2.2/40 Plan of raft foundations showing the 126 position of levelling stations boreholes and trial pits (after Burland et aI., 1975).
2.2/41 Profile of chalk grade based on SPT 'N' 126 values (after Burland et aI., 1975).
2.2/42 Relationship between time and 127 settlement for some of the levelling stations in Block A (after Burland et aI., 1975).
2.2/43 Cross-section through load test in the 128 base of the coffer-dam showing concrete cylinder, deep settlement points and kentledge (after Burland et aI., 1983).
2.2/44 Results of loading test in base of coffer- 129 dam (after Burland et aI., 1983).
2.2/45 Time-settlement observations on cable 129 chamber (after Burland et al., 1983) .
. XIX

Figure Title Page
2.2/46 Relationship between applied stress and 130 settlement-ratio showing pre-yield and post-yield behaviour for full-scale structures and large-scale loading tests.
2.2/47 Pressure-settlement curves for plates of 131 various diameters (after Lake and Simons, 1975).
2.2/48 Pressure-settlement curves for plates of 132 various diameters (after Hodges, 1976).
2.2/49 Relationship between modulus and plate 133 diameter of widely jointed Maarstichtian chalk (Nienhuis and Price, 1990).
2.2/50 Relationship between load-intensity and 134 creep ratio R from plate tests (after Burland and Lord, 1970).
2.2/51 ( a) Relationship between creep rate and 135 time from plate test at Luton, Site D (after Powell. 1990).
2.2/51 (b) Relationship between creep rate and 136 time from plate test at Luton, Site C (after Powell. 1990).
2.3/1 Typical arrangement for a Menard 185 pressuremeter test.
2.3/2 Typical curve from a Menard 186 pressure meter test in moderately weak rock (after Ervin et aI., 1980).
2.3/3 Moduli determined from pressuremeter 186 and plate tests on chalk compared with those back-analysed from a bridge foundation (from Marsland and Powell, 1983 and Powell et aI., 1990).
2.3/4 865mm diameter loading plate with four- 187 point sub-plate ground-deformation measuring system (after Marsland and Eason, 1973).
xx

Figure Title Page
2.3/5 Typical load-settlement curves from sub- 188 plate deformation measurements (after Hird et aI., 1991).
2.3/6 Error in modulus values derived from 188 sub-plate deformation measurements (after Hillier, 1991).
2.3/7 Typical relationship between stiffness 189 and strain for soils.
2.3/8 Seismic methods for determining the 190 variation of stifness with depth in soils and rocks.
2.3/9 Velocity profile along seismic line 7 at 191 Mundford, Norfolk (after Grainger et al. 1973).
2.3/10 Typical time-distance graph from a 192 seismic refraction test at Mundford, Norfolk (after Abbiss, 1979).
2.3/11 Relationship between static and dynamic 192 moduli for the chalk at Mundford, Norfolk (after Abiss, 1979).
2.3/12 Relationship between Young's modulus 193 and depth for the Mundford chalk determined using seismic refraction, finite element analysis and plate loading tests (after Abbiss, 1979).
2.3/13 Shear modulus-depth profiles for chalk 193 measured using cross-hole and down-hole seiesmic tests (after Sigismond et aI., 1983).
2.3/14 Correlation of stiffness with standard 194 penetration test results for chalk (after Wakeling, 1966).
2.3/15 Correlation of stiffness with standard 194 penetration test results for chalk (after Wakeling, 1970).
XXI

Figure Title Page
2.3/16 Comparison of empirical correlations 195 between E and SPT 'N' value for the chalk.
2.3/17 Variation of E' /N60 with degree of 196 loading for chalk (after Stroud, 1988).
2.3/18 Comparison of the results of standard 196 penetration tests carried out by different contractors at the same chalk site (after Mallard, 1977).
2.3/19 Reported ranges of moduli and yield 197 bearing pressure for in-situ chalk under foundation loading (after Clayton, 1990a).
2.3/20 Results of Standard Penetration Tests 198 and visual grading of the chalk (after Burland and Bayliss, 1990).
Chapter 3
3.0/1 Location of test sites. 207
3.1/1 Location of test site A (North Ormsby). 221
3.1/2 Plan of North Ormsby Quarry. 222
3.1/3 Topography of the area around North 223 Ormsby.
3.1/4 Geology of the area around North 224 Ormsby.
3.1/5 Structure contours for the base of the 225 Chalk in the Humberside area (after Berridge et aI., 1990).
3.1/6 Principal formations for the Chalk of the 226 N orthem Province (after Wood and Smith, 1978).
3.1/7 Corellation of major flint bands across 227 test site A
XX1l

Figure Title Page
3.1/8 Profiles of Mundford grade for site A 228 based on initial on-site appraisal.
3.1/9 Rock mass assessment for face log 1. 229
3.1/10 Rock mass assessment for face log 2. 230
3.1/11 Profiles of Mundford grade for site A 231 based on detailed analysis of spacing, aperture and infill.
3.2/1 Location of test site B (Leatherhead). 242
3.2/2 Plan of the Esso site prior to 243 development.
3.2/3 Topography of the area around 244 Leatherhead.
3.2/4 Geology of the area around 245 Leatherhead.
3.2/5 Limits of the chalk outcrop in western 246 Surrey.
3.2/6 Plan of Esso site showing site 247 invstigation boreholes positions, trial pit locations.
3.2/7 Plan of test site B showing the trial pit 248 and plate test locations.
3.2/8 Weathering profiles seen in deep trial 249 pits at site B. The zones A, B, C and D refer to the weathering zones defined in chapter 2.
3.2/9 Sketch of typical bedding plane 250 discontinuity seen in trial pits at site B.
3.2/10 Profiles of Mundford grade for site B 251 based on initial on-site appraisal of trial pits and foundation excavation.
3.2/11 Rock mass assessment for trial pit TPS 252 1.
XXlll

Figure Title Page
3.2/12 Rock mass assessment for trial pit TPS 253 2.
3.2/13 Rock mass assessment for trial pit TPS 254 3.
3.2/14 Rock mass assessment for foundation 255 excavation.
3.2/15 Profiles of Mundford grade for site B 256 based on detailed analysis of spacing, aperture and infill.
3.3/1 Location of test site C (Needham 269 Market).
3.3/2 Plan of Needham Chalks Ltd Quarry. 270
3.3/3 Topography of the area around 271 Needham Market.
3.3/4 Solid geology of the area around 272 Ipswich.
3.3/5 Superficial deposits in the area around 273 Needham Market.
3.3/6 Zonal map of the Upper Chalk of 274 Suffolk (after lukes-Browne and Hill, 1904).
3.3/7 Plan of test site C showing the trial pit 275 and plate test locations.
3.3/8 Lower hemispherical projection showing 276 the orientation of sub-vertical discontinuities observed in the trials pits at site C.
3.3/9 Correlation of major bedding plane 277 discontinuities observed in the trial pits at site C.
3.3/10 Typical block sizes observed in the trial 278 pits at site C.
XXIV

Figure Title Page
3.3/11 Profiles of Mundford grade for site C 279 based on initial on-site appraisal of trial pits.
3.3/12 Rock mass assessment for trial pit TPS 280 1.
3.3/13 Rock mass assessment for trial pit TPS 281 2.
3.3/14 Rock mass assessment for trial pit TPS 282 3.
3.3/15 Profiles of Mundford grade for site C 283 based on detailed analysis of spacing, aperture and infill.
Chapter 4
4.1/1 Schematic diagram of 500 tonne capacity 330 loading frame used for plate load tests.
4.1/2 Details of loading column used with the 331 500 tonne capacity loading frame shown in Fig. 4.1/1.
4.1/3 Typical tension pile arrangement and 332 attachment to spreader beam.
4.1/4 Typical disc spring and stacking 333 arrangements for disc springs.
4.1/5 Disc spring performance for different 334 stacking arrangements.
4.1/6 Typical arrangement of datum posts and 335 supports for dial gauges.
4.1/7 Typical settlement measurement 336 positions for dial gauges on the 1800mm dia. plate.
4.1/8 Typical bqoking form for dial gauge 337 readings.
xxv

Figure Title Page
4.1/9 Typical output from the spreadsheet 338 used to process the dial gauge readings.
4.1/10 Typical set of processed dial gauge 339 readings displayed as a surface in order to check for errors in data entry.
4.1/11 Typical time-settlement curve derived 339 from the dial gauge readings.
4.1/12 The Zeiss, Jena Ni 007 precise level. 340
4.1/13 View of staff through the Zeiss, Jena Ni 341 007 optics.
4.1/14 Typical arrangement of tension piles 342 used at each test site.
4.1/15 Arrangement of galvanised dome 343 headed levelling stations grouted into 1800mm dia plate.
4.1/16 Typical arrangement of levelling stations 344 used during a plate loading test.
4.1/17 Typical booking form used for precise 345 levelling.
4.1/18 Typical output of spreadsheet used to 346 process precise levelling data.
4.1/19 Typical variation in the apparent 347 movement of temporary bench marks with time.
4.1/20 Schematic diagram of the cantilever 348 beam type load cell used to measure the vertical load on the plate.
4.1/21 Typical calibration curve for the 500 349 tonne Macklow-Smith load cell.
4.1/22 Typical error analysis for load cell 350 calibration.
XXVI

Figure Title Page
4.1/23 Typical sequence of activities associated 351 with carrying out a suite of plate loading tests.
4.1/24 Pressure-settlement relationships from the three plate loading tests carried out
352
at site A.
4.1/25 Pressure-settlement relationships from 353 the three plate loading tests carried out at site B.
4.1/26 Pressure-settlement relationships from 354 the three plate loading tests carried out at site C
4.1/27 Pressure-settlement relationships for 355 tests 2 and 3 at site Coo
4.1/28 Typical time-settlement relationship 356 observed tests 2 and 3 at site which exhibited collapse.
4.1/29 Relationship between secant modulus 357 and bearing pressure for the plate loading tests carried out at site A.
4.1/30 Relationship between secant modulus 358 and bearing pressure for the plate loading tests carried out at site B.
4.1/31 Relationship between secant modulus 359 and bearing pressure for the plate loading tests carried out at site C.
4.1/32 Relationship between tangent modulus 360 and bearing pressure for the plate loading tests carried out at site A.
4.1/33 Relationship between tangent modulus 361 and bearing pressure for the plate loading tests carried out at site B.
4.1/34 Relationship between tangent modulus 362 and bearing pressure for the plate loading tests carried out at site C.
XXVII

Figure Title Page
4.1/35 Typical pressure-settlement curves 363 derived from precise levelling and dial gauges for site A
4.1/36 Typical pressure-settlement curves 364 derived from precise levelling and dial gauges for site B.
4.1/37 Pressure-settlement curves derived from 365 precise levelling and dial gauges for test 1 at site C.
4.1/38 Pressure-settlement curves derived from 366 precise levelling and dial gauges for test 2 at site C.
4.1/39 Relationship between the difference in 367 settlement derived from precise levelling and dial gauges and bearing pressure for all test sites.
4.1/40 Typical pressure-settlement curves for 368 individual levelling stations on the plate at site A showing magnitude of differential settlement.
4.1/41 Typical pressure-settlement curves for 369 individual levelling stations on the plate at site B showing magnitude of differential settlement.
4.1/42 Pressure-settlement curves for individual 370 levelling stations on the plate for test 2 at site C showing magnitude of differential settlement.
4.1/43 Pressure-settlement curves for individual 371 levelling stations on the plate for test 3 at site C showing magnitude of differential settlement.
4.1/44 Relationship between bearing pressure 372 and creep ratio R.
4.1/45 Typical creep behaviour observed 373 during plate tests at site A
XXVlll

Figure Title Page
4.1/46 Typical creep behaviour observed 374 during plate tests at site B.
4.1/47 Typical creep behaviour observed 375 during plate tests at site C.
4.1/48 Time-settlement relationship for the long 376 term maintained load test carried out at site A
4.1/49 Creep rate-time relationship for the long 377 term maintained load test carried out at site A
4.2/1 Plan of site A showing the position of 407 boreholes used for Standard Penetration Tests.
4.2/2 Typical relationship between penetration 408 per blow and penetration measured during Standard Penetration Tests carried out in boreholes advanced using different drilling methods at site A.
4.2/3 Variation of SPT 'N' value and Grade 409 with depth for site A.
4.2/4 Plan of site B showing the position of 410 exploratory boreholes.
4.2/5 Plan of site B showing the position of 411 boreholes used for Standard Penetration Tests and the location of dynamic probe tests.
4.2/6 Variation of SPT 'N' value with depth derived from the site investigation for
412
Esso's new European RO.
4.2/7 Variation of SPT 'N' value and Grade 413 with depth for site B .
. XX1X

Figure
4.2/8
4.2/9
4.2/10
4.2/11
4.2/12
4.2/13
4.2/14
4.2/15
4.2/16
4.2/17
4.2/18
4.3/1
4.3/2
Title
Plan of site C showing the position of boreholes used for Standard Penetration Tests and the location of dynamic probe tests.
Variation of SPT 'N' value and Grade with depth for site C.
Sacrificial cone used for dynamic probing tests.
Typical results of dynamic probing tests carried out at sites Band C.
The principles of continuous surface-wave seismic tests.
Typical output from the spreadsheet used to process continuous surface-wave seismic test data.
Typical graphical output used in the processing of continuous surface-wave seismic test data.
Typical relationships between stiffness and depth from continuous surface-wave seismic tests.
Profiles of shear modulus with depth for plate locations 2 and 3 at site A.
Profiles of shear modulus with depth for plate locations 1, 2 and 3 at site B.
ProfIles of shear modulus with depth for plate locations 1, 2 and 3 at site C.
Variation of dry density and porosity of chalk with depth for each test site.
Variation of uniaxial compressive strength with dry density and porosity of chalk from each test site.
xxx
Page
414
415
416
417
418
419
420
421
422
423
424
443
443

Figure Title Page
4.3/3 Variation of Brazilian tensile strength 444 with dry density and porosity of chalk from each test site.
4.3/4 Typical stress-strain curves for dry chalk 445 tested in uniaxial compression.
4.3/5 Stiffness of dry chalk during shear in 446 uniaxial compression.
4.3/6 Typical stress-strain and stiffness-strain 447 relationships for saturated chalk from site A tested in uniaxial compression.
4.3/7 Typical stress-strain and stiffness-strain 448 relationships for saturated chalk from site B tested in uniaxial compression.
4.3/8 Typical stress-strain and stiffness-strain 449 relationships for dry chalk from site C tested in uniaxial compression.
4.3/9 Variation in stiffness with dry density 450 and porosity of chalk from each test site.
4.3/10 Results of one-dimensional compression 451 tests on chalk from each test site.
4.3/11 Typical relationships between void ratio 452 and vertical stress for chalk tested in one-dimensional compression.
Chapter 5
5.1/1 Range of dry density and porosity found 478 at sites A, Band C in relation to the overall range according to biozone.
5.1/2 Variation of uniaxial compressive 479 strength of chalk with dry density and porosity (data from chapter 2 combined with the results given in Chapter 4).
XXXI

Figure Title Page
5.1/3 Relationship between the uniaxial 480 compressive strength of dry and saturated specimens of chalk.
5.1/4 Variation of Brazilian tensile strength of 481 chalk with dry density and porosity (data from chapter 2 combined with the results given in Chapter 4).
5.1/5 Relationship between uniaxial 482 compressive strength and Brazilian tensile strength of chalk.
5.1/6 Stiffness of undisturbed London Clay 483 during undrained shearing in triaxial compression.
5.1/7 Relationship between secant modulus at 484 0.01 % axial strain and that at 0.001% axial strain for specimens of chalk tested in uniaxial compression.
5.1/8 Relationship between L (EO•01 /EO.OO1) 485 and dry density for specimens of chalk tested in uniaxial compression.
5.1/9 Normalised stiffness of chalk (E/oc) and 486 London clay (E/2Su) during shear.
5.1/10 Variation in stiffness of chalk with dry 487 density and porosity (data from chapter 2 combined with the results given in Chapter 4).
5.1/11 Variation in 'corrected' stiffness of chalk 488 with dry density and porosity.
5.1/12 Relationship between the stiffness of dry 489 and saturated specimens of chalk.
5.1/13 The comparison of structured and 490 destructured compression in the oedometer test (after Leroueil and Vaughan, 1990)
XXXII

Figure Title Page
5.1/14 Yield locus for chalk in void ratio- 491 effective stress space.
5.1/15 Relationship between void ratio and 492 vertical stress for specimens of chalk with different porosities.
5.1/16 (a) Isotropic and (b) one-dimensional 493 compression data for a carbonate sand (after Coop, 1990)
5.1/17 Variation in constrained modulus (l/Illv) 494 of chalk with dry density and porosity.
5.1/18 Comparison between the constrained 495 modulus of chalk and Young's modulus measured in uniaxial compression .
5.1/19 Relationship between yield stress and 496 dry density for specimens of chalk.
5.1/20 Relationship between initial void ratio 497 and yield stress for chalk ..
5.1/21 Variation of compression index Cc of 498 chalk with dry density and porosity.
5.2/1 Principal factors influencing chalk mass 510 compressibility.
5.2/2 Variation of horizontal discontinuity 511 spacing with depth observed at test sites A, Band C.
5.2/3 Principal factors influencing the mass compressibility of chalk which can be
512
assessed by visual inspection of the rock mass.
5.3/1 Characteristic relationships between 536 secant modulus and bearing pressure observed at sites A, Band C.
5.3/2 Pressure-settlement ratio results showing 537 pre-yield behaviour for structures and 1.8m dia. plate loading tests on chalk.
XXXlll

Figure Title Page
5.3/3 Pressure-settlement ratio results showing 538 pre-yield behaviour of structures and 1.8m dia. plate loading tests on chalk classified according to dry density.
5.3/4 Relationship between rock mass factor j 539 and fracture spacing for the chalk (from Hobbs, 1975).
5.3/5 Pressure-settlement ratio results showing 540 yielding behaviour for structures and 1.8m dia. plate loading tests on chalk.
5.3/6 Relationship between bearing pressure 541 and creep ratio R for the chalk based on published data and 1.8m dia. plate loading tests at site A, Band C.
5.3/7 Characteristic relationships between 541 creep rate and log time observed at sites A, Band C.
5.3/8 Relationship between creep rate at 24 542 hours and bearing pressure.
5.3/9 Characteristic relationship between log 542 creep rate and log time observed at sites a, Band C.
5.4/1 Ratio of observed to predicted 571 settlement for bearing pressures of 100, 200 and 300kPa based on continuous surface-wave seismic tests.
5.4/2 Relationship between predicted 572 settlement (normalised by the settlement assuming a Poission's of 0.5) and Poisson's ratio derived from finite element analysis using CRISP90.
5.4/3 Ratio of observed to predicted 573 settlement for a bearing pressure of 200kPa based on empirical relationships between E and SPT 'N' value.
XXXIV

Figure Title Page
5.4/4 Empirical and observed relationships 574 between E and SPT 'N' value.
5.4/5 Visual classification of the chalk at each 575 test site using the Grading scheme for Mundford (Ward et aI., 1968).
5.4/6 Ratio of observed to predicted 576 settlement for a bearing pressure of 200kPa based on visual assessment of the rock mass.
5.4/7 Summary of settlement predictions 577 derived from geophysics, SPT and visual assessment.
5.4/8 Classification of the chalk at sites A, B 578 and C using the scheme proposed in Table 5.4/7.
xxxv

LIST OF PLATES
Plate Title Page
Chapter 3
3.1/1 (a) View of test site A looking south 232 west. (b) View of test site looking north east.
3.1/2 View of quarry face at the location of 233 face log 2.
3.1/3 View of plate location 1 (PL1) during 234 preparation showing loose fracture-block system.
3.2/1 Typical weathering profile seen in the 257 excavation for the foundations of Esso's new European Headquarters at Leatherhead.
3.2/2 View of the transition from structureless 257 chalk into structured chalk in trial pit TPS1 at site B.
3.2/3 Contaminated chalk seen in the 258 excavations for the foundations of Esso's new European Headquarters at Leatherhead. Note how the contaminant (brown discolouration) has picked out the fracture pattern.
3.2/4 Typical open sub-horizontal 259 discontinuities seen in trial pits at site B.
3.2/5 View of slickensides on sub-vertical 259 discontinuity seen in trial pit TPS3 at site B.
3.3/1 ( a) View of test site C looking west. (b) 284 View of test site C looking east showing the arrangement of tension piles and test locations.
3.3/2 View of plate test location 3 during 285 preparation. Note the open sub-vertical discontinuities.
XXXVI

Plate
3.3/3
Chapter 4
4.1/1
4.1/2
4.1/3
4.1/4
4.2/1
4.2/2
Title
View of rock face adjacent to the test site. Note the absence of flaggy chalk near the original ground surface.
View of 500 tonne capacity loading frame during assembly at test site B.
View of loading column showing the load cell, locking ring hydraulic jack and pump unit and the disc spring unit.
Typical arrangement of dial gauges used to measure plate settlement.
View of crushed chalk seen beneath plate location 3 (PL3) at site C. The orange lines show the excavation for the plate loading test and the limits of the crushed material.
Apparatus used to perform dynamic probing tests at sites Band C.
View of the equipment used to perform continuous surface-wave seismic tests at site A
XXXVII
Page
286
378
378
379
379
425
426

NOTATION
~ Contact area ratio.
a Cross sectional area of cone
Bf Width of foundation
Bp Width of foundation or diameter of plate
b Dia. of asperities
Ce Compression index
Dm Constrained modulus (l/IIlv)
Dp Plate diameter
d Geophone spacing
On Normal deformation.
Onj Normal closure of a single discontinuity.
o nr Normal deformation of intact rock.
0nt Total normal deformation of intact rock and discontinuity.
Os Shear deformation.
E Young's modulus.
E+ Unload-reload modulus from pressuremeter tests
Ee Post-collapse modulus.
EdynamieDynamic modulus
Ee Re-Ioad modulus.
EI Intact modulus.
E· Initial modulus. 1
Eih Initial horizontal modulus
Eiv Initial vertical modulus
E· Joint modulus. J
ELM Lower bound modulus.
Em Mass modulus.
Eo Young's modulus at ground surface or foundation level
Es Secant modulus.
E Static modulus static
XXXVlll

E t Initial tangent modulus
EtSo Tangent modulus at 50% of the uniaxial compressive strength.
Ey Post-yield modulus.
EUM Upper bound modulus.
EO.001 Secant modulus at 0.001 % axial strain
EO.01 Secant modulus at 0.01% axial strain
€ Normal strain
€ c Cavity strain
€v Vertical strain
e Void ratio.
f Frequency
ff Fracture frequency
f1 Empirical factor (Stroud, 1988)
g Acceleration due to gravity
G Shear modulus
Gh Horizontal shear modulus
Gi Initial shear modulus
Go Shear modulus at the ground surface or foundation level
Gs Specific gravity
Gur shear modulus based on unload-reload cycles
Gv Vertical shear modulus
Gy Post-yield shear modulus
He Hammer energy
h Drop height
~ Plasticity index
IsSO Point load index
y Shear strain
J Rock mass factor (Hobbs, 1975)
~ Coefficient of earth pressure at rest
k Rate of change of Young's modulus E with depth
~ Normal stiffness.
~ Shear stiffness.
XXXIX

L Ratio EO.Ol : EO.OOI
1 Standard measure of cone displacement (lOOmm)
A Wavelength
M Mass of hammer
m Rate of increase in shear modulus G with depth
llly Coefficient of volume compressibility
N Parameter derived from the Standard Penetration Test.
Na Number of asperities per unit area
Nc Bearing capacity factor
N60 N corrected for 60% of the free fall hammer energy
n Porosity
p pressure
p'm Mean in-situ effective stress
Pf Creep pressure
PL Limit pressure
Po In-situ horizontal stress
Q NGI tunnelling quality index
v Poisson's ratio
P Bulk density
Pay Average settlement
Pcentre Settlement at centre of loaded area
Pd Dry density
P f Settlement of foundation
Po Surface settlement at a given radius from centre of plate
Pp Settlement of plate
Ps Settlement
Pw Density of water
P24 Plate settlement after 24 hours
R Creep ratio (Burland and Lord, 1970)
RMR Rock Mass Rating
Su Undrained strength
a c Uniaxial compressive strength.
xl

a t Brazilian tensile strength.
a y Yield stress
a 1 Major principal stress.
a 2 Intermediate principal stress.
a 3 Minor principal stress.
a t' Major principal effective stress.
a 2' Intermediate principal effective stress.
a 3' Minor principal effective stress.
e Phase difference
T Corrected phase difference
T Shear stress.
q Bearing pressure
qe Yield bearing pressure (based on the onset of yield)
'lnet Nett average bearing pressure
qy Yield bearing pressure (based on the establishment of Ey)
quIt Ultimate bearing pressure
q(ult)u Ultimate bearing pressure (undrained)
VI Relative volume of intact material
Vj Relative volume of joint material
V 0 Initial volume
V p Compressional wave velocity
Vr Rayleigh wave velocity
Vs Shear wave velocity
w Moisture content
WI Liquid limit
w sat Saturation moisture content
z Depth
xli

1.0 INTRODUCTION
The Chalk outcrops over approximately 15% of the area of England. Thus a
great many foundations will be constructed on this material each year.
With the exception of structureless chalk the strength of the rock mass is
sufficiently large for bearing capacity not to be a problem in most foundation
design. The major issue in the design of shallow foundations on chalk is
settlement since this controls the allowable bearing pressure.
The settlement of shallow foundations on chalk is controlled to a large extent
by the fractures which break the rock mass up into discrete blocks. Over most
of the chalk outcrop the dominant fractures occur in more or less parallel
sets that are generally sub-vertical and sub-horizontal. Weathering processes
result in these fractures being closely spaced near the ground surface and
becoming more widely spaced with depth. The compressibility of the rock
mass therefore likely to reduce with depth.
Pioneering work on the mass compressibility of the Chalk was reported by
Ward et al. (1968). This work related, however, to one stratigraphic,
palaeogeographic and tectonic setting. This is now seen to be atypical and, as
acknowledged by the original authors, the results are not applicable to the
Chalk outcrop as a whole. The Chalk is now known to be a highly variable
material (Clayton, 1983), with intact strength and stiffness properties which
may vary from those of a hard soil to a moderately strong rock.
The mass compressibility of the chalk has been studied extensively through
the use of plate loading tests. The typical load-settlement curve produced by
plate loading tests in chalk with essentially horizontal and vertical
discontinuities is distinctly convex in shape. This characteristic shape led
Burland and Lord to idealise the load-settlement relationship as essentially a
bi-linear curve such that the mass compressibility may be modelled using five
parameters. Burland and Lord suggested that the change in gradient of the

load-settlement curve is associated with yielding, but the nature of such
yielding was not postulated. The fact that some form of yielding occurs can
be seen in the results of unload-reload cycles in which it has been found that
deformation is essentially recoverable for pressures less than the yield point.
For pressures above the yield point significant non-recoverable deformations
are observed and the post yield modulus Ey is generally an order of
magnitude less than the initial modulus E j •
The magnitude of the yield stress is clearly important in foundation design
because of the significant increase in compressibility that is associated with it.
Records of full-scale foundations that have caused the chalk to yield are
limited to that of the sugar silos at Bury St Edmunds, Suffolk (Kee, 1974).
In total there are only six well documented records of the behaviour of
shallow foundations, of which only four deal with structured chalk. The
published record of plate loading tests are a little more extensive. The
majority of these are not reliable since the plate diameter used was too small
to provide representative results. As a result of the lack of reliable well
documented case records the mechanisms which control the mass
compressibility behaviour of chalk are not fully understood. The following r
aspects of mass compressibility behaviour are of particular interest in the
design of shallow foundations:
• The influence of intact mechanical properties.
• The mechanisms that give rise to yielding.
• The mechanisms controlling time-dependent settlement.
To date there has been no systematic investigation of any of these.
This thesis attempts to improve the fundamental understanding of some of
the factors controlling the mass compressibility of chalk and evaluate some of
the methods used in site investigation to predict foundation settlements. It is
impossible to gain a complete understanding of mass compressibility from a
2

single study such as this. The scope of this thesis is therefore limited to
investigating the influence of intact mechanical properties on the mass
compressibility of weathered structured chalk characterised by sub-horizontal
and sub-vertical discontinuities.
A total of nine large diameter (1.8m) plate loading tests of the maintained
load type were carried out at three different sites. A plate diameter of 1.8m
was chosen since this is close to the size of a full-scale foundation. Three
tests were carried out at each site. The sites were selected on the basis of the
following criteria:
• Each site must display different intact strength and stiffness properties
• At each site the intact mechanical properties must be reasonably
uniform with depth
• Each site must display similar dominant discontinuity orientations
(sub-horizontal and sub-vertical) and spacing.
The maximum load applied to the plate in each test was sufficiently large to
ensure that the post-yield load-settlement behaviour could be studied. Each
loading increment for a given test was maintained for 24 hours to ensure that
the rate of creep settlement had reduced to a reasonable level before
changing the load. Plate settlements were monitored throughout this period
to permit the study of short-term time-dependent settlement.
The rock mass at each test site was described in detail using trial pits (below
plate locations) and exposed chalk faces (adjacent to plate locations). The
intact mechanical properties of the chalk at each test site were measured in a
suite of laboratory tests.
At each test site surface-wave seismic tests and standard penetration tests
were carried out together with the classification of the rock mass using the
Mundford grading scheme (Ward et al. 1968). The results of these tests and
3

classification were used to predict the pre-yield settlement of the plate in an
attempt to evaluate their accuracy.
This thesis is organised as follows:-
Chapter 2 presents a review of the literature. This chapter is split into three
parts. The first part considers the deposition, diagenesis, geological structure
and weathering of the chalk. The second part considers the mass
compressibility of chalk and the third part the methods commonly employed
in site investigations to provide stiffness parameters for foundation design.
Chapter 3 describes the location of the sites selected for plate loading tests in
terms of geographical location, local topography and geology. In addition to
the location of test sites this chapter also describes the characteristics of the
rock mass at each site.
Chapter 4 describes the in-situ tests carried out at the test sites and the
laboratory tests on intact chalk. In this chapter the emphasis is placed upon
the plate loading test since this provides the best similitude to a real
foundation. The results of both the field and laboratory tests are given in this
chapter.
Chapter 5 presents a discussion of the work and results described in the
preceding chapters.
Chapter 6 presents the conclusions and recommendations for further work.
4

2.0 LITERATURE REVIEW
This thesis is concerned with the mass compressibility of fractured chalk, and
its influence on the settlement of shallow foundations. The compressibility of
any rock mass will be affected by the mechanical properties of the intact rock
and the geometry and mechanical properties of the discontinuities. These
factors are in tum affected by mineralogical composition, depositional
environment, diagenesis, tectonism and weathering. Any study of rock mass
behaviour therefore, should address these factors.
This survey of past literature is divided into three parts. The first part
considers the factors influencing the mass compressibility of chalk. The
second part considers the behaviour of foundations on the chalk and the third
part is a review of the methods commonly used in site investigation to
provide parameters for settlement predictions.
In the first part of the literature survey the following subjects relating to the
deposition, diagenesis, geological structure and weathering of the chalk are
reviewed:-
(i)
(ii)
The deposition of the chalk
This focuses on the chemical composition and the depositional
environment of the chalk in order to study the variability of the
rock material in terms of its physical properties.
Mechanical properties of intact chalk
Mechanical properties such as strength and stiffness are
examined since these are most likely to influence the
compressibility behaviour of the rock mass.
5

(iii) Discontinuities in chalk
The mechanisms for the formation of discontinuities in rock are
reviewed and these are used to examine the dominant
discontinuity patterns that exist in the chalk.
(iv) Weathering of chalk
The dominant weathering mechanisms which affect the chalk
are identified and the extent to which the rock mass is affected
these processes is examined.
The second part of this survey considers the mass compressibility of chalk.
The principal topics reviewed include:
(i) The influence of discontinuities on the compressibility of rock
masses is reviewed
The principal factors affecting rock mass compressibility are
identified. These are reviewed in relation to observed load
deformation behaviour in the laboratory and in the field.
(ii) The load-deformation behaviour of fractured chalk
The characteristic load-deformation behaviour of chalk
dominated by sub-horizontal and sub-vertical discontinuities is
reviewed.
(iii) The behaviour of foundations
Published case histories of the load-settlement behaviour of
large-scale loading tests and full-scale foundations on fractured
chalk are reviewed.
The third part of this survey reviews the methods commonly employed in site
investigations to provide stiffness parameters for foundation design.
6

Since the discontinuities play such an important role in rock mass
compressibility it is normally impossible to predict settlements of foundations
using parameters provided by laboratory tests on intact chalk. Hence the
stiffness of the rock mass must be evaluated from in-situ tests and
observations. The methods considered include:-
• Pressuremeter tests
• Plate loading tests
• Geophysics
• Standard penetration test
• Visual assessment
By considering the above topics the current state-of-the-art for the mass
compressibility of fractured chalk may be reviewed.
2.1 Deposition, Diagenesis, Geological Structure and Weathering
To most engineers chalk is a white, weak and often friable material. It is
commonly associated with the south of England even though the outcrop
covers about 15% of the surface of England and extends into East Anglia,
Lincolnshire and the East Riding of Yorkshire. There are isolated outcrops in
Scotland and Northern Ireland but the material is different in character to
that found in England. For many years it was a commonly held belief
amongst engineers that the chalk is uniform material. Although this is
generally true with regard to the chemical composition of the chalk it is not
true for porosity. The large range of porosity (9 to 52%) stems from a wide
variety of depositional, diagenetic, and tectonic processes. This also gives rise
to a wide range of mechanical properties for intact chalk (Clayton
1983,1990a, Mortimore and Fielding 1990).
The chalk found near the surface is often highly fractured. Some of these
fractures may be considered to be 'primary' in that they result from
tectonism. These fractures will be found at depth as well as near the ground
7

surface and their geometry will be controlled by both regional and local stress
fields associated with the Alpine orogeny.
Many of the fractures found in the chalk near the ground surface may be
considered as 'secondary' since they result largely from weathering processes
such as stress relief and frost action. These fractures will reduce in number
with depth.
The near surface fractures in chalk are often modified as a result of
dissolution. This usually gives rise to rounded discontinuity walls and large
apertures. In extreme cases dissolution may result in larger features such as
pipe, dolines and sink holes. Such features may present a serious hazard to
foundation stability.
The combined effects of deposition, diagenesis, tectonism and weathering
give rise to a highly non-uniform rock mass. In order to characterise the chalk
it is necessary to gain a appreciation of how these factors influence the rock
material and the discontinuities.
Deposition and Diagenesis
The lowermost divisions of the formation (The Cenomanian - Table 2.1/1)
show the greatest variability in composition. The Cenomanian chalks are
typically greyish white in colour and characterised by rhythmically alternating
chalky limestones and interbedded marls in sequences similar to that found in
the Lias (Lower Jurrasic). This results from substantial quantities of clay
minerals and other clastic materials being introduced into the depositional
basin. However as the sea level rose in early Upper Cretaceous times the
amount of terrestrial detritus reduced such that the Turonian and Senonian
(Table 2.1/1) chalks are dominated by pelagic material, the bulk of which is
the debris from coccolithophorid planktonic algae (Haptophyceae), occurring
mostly in separate micron-sized plates or in their original rings known as
coccoliths (Hancock 1975). The calcium carbonate content of these chalks
8

Table 2.1/1 Zonal division of the Upper Cretaceous.
Stage Zone
Maastrichtian Belemnitella lanceolata
Belemnitella mucronata Campanian
Actinocamax quadratus Upper
Senonian Chalk Marsupites testudinarius
Santonian Micraster coranguinum
-------------Coniacian Micraster cortestudinarium
------------- -------------Holaster planus
Turonian Middle Terebratulina lata
Chalk Rhynchonella cuvieri
Cenomanian Lower Holaster subglobosus
Chalk Schloenbachia varians
9

(excluding marl bands and flints) generally exceeds 98% and rarely falls
below 96%. In terms of composition they display a high degree of uniformity.
Although most of the chalk has a more or less uniform composition it
exhibits a wide range of porosity. Clayton (1983) shows the range of dry
densities for English chalks to be 1.29 to 2.46 Mg/m3 which represents a
porosity range of 9 to 52%. The variation of porosity with biozone is shown
in Fig. 2.1/1. Fossil evidence suggests that the during the deposition of the
chalk substrate conditions must have been generally rather soft and therefore
inhospitable to many benthic taxa which are conspicuous by there absence.
Certain bivalves (eg species of Inoceramus, Pycnodonte and Spondylus)
became specially adapted to soft bottom conditions. The pelagic material
forming the sea bed would have behaved as a granular material in a loose
state which is characterised by high porosities. Indeed Scholle (1977) has
pointed out that carbonate mud may be deposited with as much as 70 to 80%
porosity. The major factor controlling the porosity of this material as it was
deposited would probably have been the grading, particle shape and degree
of bioturbation. Approximately half this pore space may have been lost by
dewatering during the initial stages of burial. Later diagenetic processes
during consolidation and cementation can reduce the porosity to less than
5 %. The fact that the chalk may retain very high porosities suggests that it
was subject to penecontemporaneous lithification. Lithification of carbonate
muds is often initiated as cementation at points of contact rather than
consolidation. Bathurst (1975) suggests that carbonate muds ·suffer very little
post burial compression because of this early cementation. Hence the rigidity
of weak carbonate rocks such as chalk may be attributed to mechanical
interlocking of grains, and the early cementing of the mass. It will be seen
from Fig. 2.1/1 that the range of maximum porosity in the white chalk (i.e.
the Turonian and Senonian Table 2.1/1) is similar to the range of porosity
within anyone zone. This tends to suggest that consolidation was not
significant in reducing the porosity of the majority of chalks. A
10

comprehensive discussion on the influence of consolidation on the
densification of chalk may be found in Clayton and Matthews (1987).
Hardgrounds are present in much of the chalk and are often sufficiently
extensive (e.g. Chalk Rock and Melbourn Rock) to provide geologists with
useful marker horizons for correlation purposes. These beds generally have
porosities of between 10 and 15% and are often nodular and show evidence
of intense bioturbation. Encrustation, phosphatisation and glauconitisation are
all features seen in these chalk hardground horizons. It is well known that
such hardgrounds were formed whilst the material was exposed on the sea
bottom during a break in deposition. During such time the carbonate mud
was exposed to intense biological reworking (Kennedy and Garrison 1975)
and significant cementation which brought about a significant reduction in
porosity. Hardground chalks have higher magnesium values than normal
white-chalk facies. This probably reflects early cementation by magnesium
high calcite remobilised from shells of the richer benthos associated with the
more stable substrates.
Tectonism appears to be an important process in causing significant
reductions in porosity. The influence of tectonism on the hardness of chalk
has been noted by Strahan (1898), Mimran (1975), Clayton (1983) and
Clayton and Matthews (1985). The variation of dry density with the dip of the
chalk strata is shown in Fig. 2.1/2. It will be seen from Fig. 2.1/2 that there is
a increase in dry density with increasing dip. Since steeply dipping strata are
indicative of intense tectonic activity the data presented in Fig. 2.1/2 suggests
that tectonism brings about a reduction in porosity. Clayton and Matthews
(1985) demonstrate that as a result of tectonism large variations in porosity
can occur over relatively short distances (5 to 10km) within the same
stratigraphic horizon. The chalk in those regions affected significantly by
Alpine tectonism often exhibits evidence of compressional crushing of
microfossils whereas elsewhere in southern England such features are absent.
11

The chalk of Yorkshire and Lincolnshire is known to have a uniformly low
porosity; typically about 25% in contrast to the much more variable porosities
found in the chalks of southern England. Some chalks in Yorkshire contain
tests of microfossils that have been crushed and much of the Yorkshire chalk
contains blocky euhedral calcite crystals which appear to fill in excess of 50%
of the original void space (Bell et al 1990). Pressure solution and other late
stage solution features such as stylolites and thin beds (about 10mm thick) of
silty-clay material are common in the hard chalks found north of the Wash.
Hancock (1975) suggested that in the Santonian chalk (Table 2.1/1) of the
Yorkshire coast up to 50% of the original deposit may have been removed by
late-stage solution. Much of this material must have been available to
recement the deposit or to be redeposited as the blocky euhedral crystals
mentioned above. The mechanism for the reduction in porosity of the
Lincolnshire and Yorkshire chalks remains a subject of speculation. Scholle
and Kinsman (1973) and Scholle (1974) have proposed mechanisms based on
fresh water alteration and high geothermal gradients, but none as yet are
conclusive.
The above mentioned processes explain why the chalk, although generally
uniform in terms of composition, is extremely non-uniform in terms of
porosity. This makes the chalk rather unusual, since other sedimentary rocks
of similar lithology within the same formation generally show much greater
variations in composition. This feature of the chalk means that geotechnical
properties such as density, strength, stiffness and permeability of the rock
material may be related to porosity. The wide variation in porosity will give
rise to a similar variation in brittleness. The brittleness of the rock, together
with tectonism, will influence the pattern of discontinuities which cut the rock
mass. The properties of the rock material and the rock mass will be modified
by weathering agencies such as solution, stress relief and frost. Whereas the
geotechnical properties of the rock material may be simply related to porosity
the same cannot be said of the rock mass, although intact porosity no doubt
plays an important role.
12

Mechanical Properties of Intact Chalk
Chalk is typical of most weak rocks in that its intact properties can range
from soil-like behaviour to rock-like behaviour. The range of index properties
for the Chalk is shown in Table 2.1/2. Although no comprehensive systematic
study has been carried out on the mechanical properties of undisturbed intact
chalk there is sufficient published data to indicate that strength and
deformability are related to porosity. Porosity has been found to be an
important parameter in other rock types such as weak sandstones
(Dobereiner and de Freitas, 1983, 1986). Dobereiner and de Freitas (1983)
found that the most practical index parameter for assessing the strength and
deformability of weak sandstones was the saturation moisture content.
Duncan (1969) recognised the importance of this parameter for rock
classification purposes. For rocks of relatively uniform composition the
saturation moisture content may be related directly to porosity.
The unconfined compression and indirect tensile (Brazilian and point load)
tests provide a useful measure of rock strength which is relatively easy to
obtain, and can be used for comparative purposes. Indeed these represent the
most common of all rock mechanics tests (Bieniawski 1974). Mortimore and
Fielding (1990) found that there was a good correlation between intact dry
density and strength (Brazilian indirect tensile and uniaxial compression) for
white chalks. This suggests that a similarly good correlation should exist
between porosity and strength. Indeed porosity has been found to correlate
with both strength and elastic moduli for other rock types such as sandstone,
limestone and gypsum (Schiller, 1958, Kowalski, 1966, Morgenstern and
Phukan, 1966, Sirieys, 1966) and relationships have been proposed between
strength and porosity for other brittle materials such as ceramics (Knudson,
1959, Brown et al, 1964).
Published data on mechanical properties of intact chalk permit relationships
with porosity to be examined. The sources of these data are given in Table
2.1/2. The relationship between porosity and strength for the chalk is shown
13
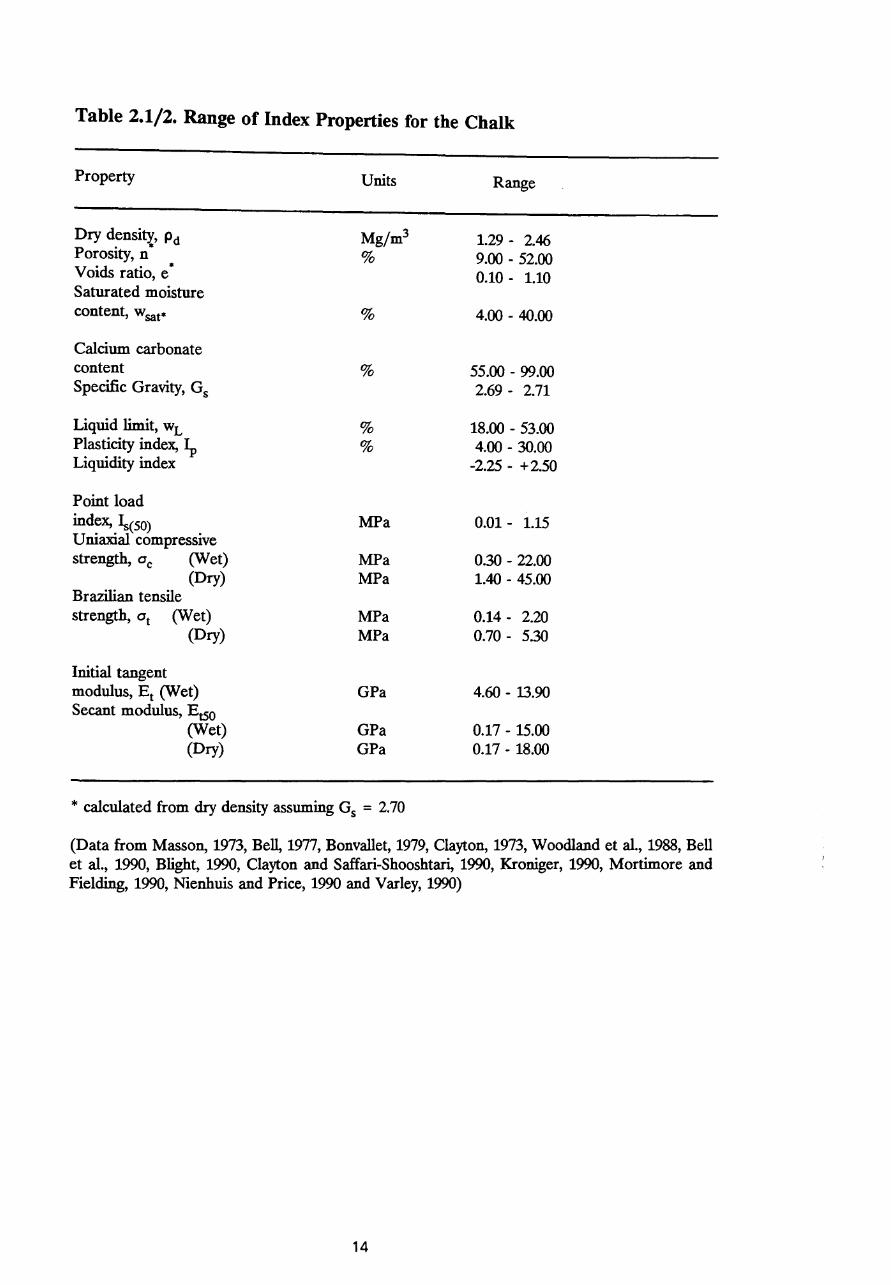
Table 2.1/2. Range of Index Properties for the Chalk
Property Units Range
Dry density, P d Mg/m3 1.29 - 2.46 Porosity, n * % 9.00 - 52.00 Voids ratio, e * 0.10 - 1.10 Saturated moisture content, W sat* % 4.00 - 40.00
Calcium carbonate content % 55.00 - 99.00 Specific Gravity, Gs 2.69 - 2.71
Liquid limit, wL % 18.00 - 53.00 Plasticity index, ~ % 4.00 - 30.00 Liquidity index -2.25 - + 2.50
Point load index, ~(50) MPa 0.01 - 1.15 Uniaxial compressive strength, a c (Wet) MPa 0.30 - 22.00
(Dry) MPa 1.40 - 45.00 Brazilian tensile strength, at (Wet) MPa 0.14 - 2.20
(Dry) MPa 0.70 - 5.30
Initial tangent modulus, E t (Wet) GPa 4.60 - 13.90 Secant modulus, EtSO
(Wet) GPa 0.17 - 15.00 (Dry) GPa 0.17 - 18.00
* calculated from dry density assuming Gs = 2.70
(Data from Masson, 1973, Bell, 1977, Bonvallet, 1979, Clayton, 1973, Woodland et ai, 1988, Bell et al., 1990, Blight, 1990, Clayton and Saffari-Shooshtari, 1990, Kroniger, 1990, Mortimore and Fielding, 1990, Nienhuis and Price, 1990 and Varley, 1990)
14

in Figs. 2.1/3 and 2.1/4. It will be seen from Figs. 2.1/3 and 2.1/4 that
despite the scatter there is a distinct increase in strength with decreasing
porosity. The way in which the specimens were prepared and the test
conditions may contribute to this scatter. Most of the test specimens were cut
from block samples, but a number of different test specimen diameters
(38mm to 60mm) were employed for uniaxial compression tests. The ISRM
recommends (ISRM Commission, 1979) that a constant rate of loading be
employed for uniaxial compressive strength tests. Some of the results shown
in Fig. 2.1/3 are derived from constant rate of strain tests. However these
results do not stand out from the rest of the data suggesting that the
compressive strength of the chalk is not sensitive to the method of loading.
When specimens of chalk are tested dry (ie at natural moisture content or
saturated) they exhibit an increase in strength compared with their water
saturated counterparts. Fig. 2.1/5 shows the relationship between unconfined
compressive strengths derived from dry and wet specimens. It will be seen
from Fig. 2.1/5 that the strength is sensitive to moisture content. Generally
there is an increase in strength upon drying of between 40 and 50%, although
Masson (1973) reports ratios of dry:wet uniaxial compressive strengths
exceeding 4 for French chalks. It is well known that the strength of rock is
influenced by moisture content. Obert et al. (1946) showed small changes in
compressive strength for sandstone, marble, limestone and granite as the
moisture content varied, while a more comprehensive study by Colback and
Wiid (1965) defined relationships between uniaxial compressive strength and
moisture content for sandstone and shale. Colbeck and Wiid (1965) showed
that the strength of saturated rock was about half that of completely dry rock.
Similar relationships have been found by other authors (Krokosky and Hisak,
1968, Jumikis, 1966, and Ruiz, 1966). The reasons for variation of strength
with moisture content are still somewhat obscure. Hawkes and Mellor (1970)
suggest that the presence of water on internal surfaces of the rock produces
static fatigue, which may involve reduction of surface energy or fracture
energy (stress corrosion), bond modification, or atomic shielding. Little work
has been done on the influence of moisture content variations in chalk.
15

Mortimore and Fielding (1990) suggest that for dry densities of around 1.65-
1.70 Mg/m3 (porosity 39-37%) the strength is independent of moisture
content. The data presented in Fig. 2.1/5, however, indicate that low porosity
chalks still exhibit a significant gain in strength when dry. Some authors
favour testing only dry specimens (eg Mortimore and Fielding, 1990) because
of problems encountered during saturation. Indeed recent research on the
mechanical behaviour of cemented soils (Maccarini, 1988 and Bressani, 1990)
indicates that there is often significant damage to the soil structure through
isotropic stress oscillation when specimens are saturated under vacuum.
Clearly this could be significant when attempting to saturated high porosity
chalks since these will be only weakly cemented.
Most of the strength data shown in Figs. 2.1/3 and 2.1/4 were derived from
specimens cored perpendicular to the bedding. There is some evidence of
strength anisotropy in the chalk (eg Bell et al. 1990) but it is insufficient to
examine any relationship with porosity.
The relationship between Young's modulus and porosity for chalk is shown in
Fig. 2.1/6. Since the axial Young's modulus of intact rock varies throughout
the loading history it cannot be regarded as a constant for the material. It r
may be calculated in a number of ways. One of the most common is the slope
of the axial stress-axial strain curve at some fixed percentage, generally 50%
of the uniaxial compressive strength (EtSo)' The gradient of the initial portion
of the stress-strain curve is also used to determine a value of Young's
modulus (Et). Values of both EtSO and Et are shown in Fig. 2.1/6. Generally
Et
tends to be slightly (generally < 10%) less than EtSo, indicating that the
initial part of the stress-strain curve is concave in shape. At first sight the
concave shape might be attributed to bedding. However in many cases where
this has been observed the strains have been measured locally using electrical
resistance strain gauges. Bell et al. (1990) suggest that this behaviour is
associated with the closure of microcracks. This type of stress-strain
behaviour is typical of weak high porosity sedimentary rocks (Farmer, 1968)
16
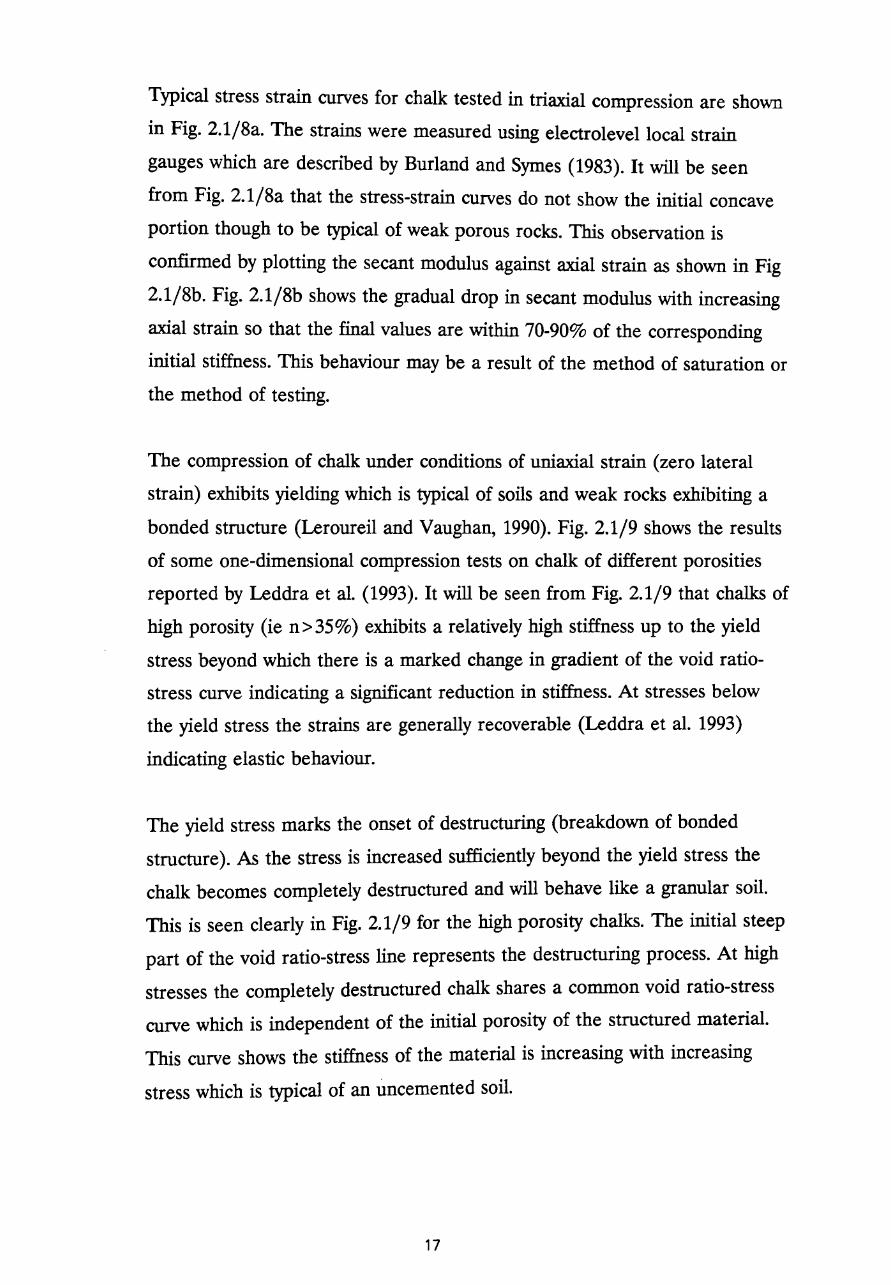
Typical stress strain curves for chalk tested in triaxial compression are shown
in Fig. 2.1/8a. The strains were measured using electrolevellocal strain
gauges which are described by Burland and Symes (1983). It will be seen
from Fig. 2.1/8a that the stress-strain curves do not show the initial concave
portion though to be typical of weak porous rocks. This observation is
confirmed by plotting the secant modulus against axial strain as shown in Fig
2.1/8b. Fig. 2.1/8b shows the gradual drop in secant modulus with increasing
axial strain so that the final values are within 70-90% of the corresponding
initial stiffness. This behaviour may be a result of the method of saturation or
the method of testing.
The compression of chalk under conditions of uniaxial strain (zero lateral
strain) exhibits yielding which is typical of soils and weak rocks exhibiting a
bonded structure (Leroureil and Vaughan, 1990). Fig. 2.1/9 shows the results
of some one-dimensional compression tests on chalk of different porosities
reported by Leddra et al. (1993). It will be seen from Fig. 2.1/9 that chalks of
high porosity (ie n>35%) exhibits a relatively high stiffness up to the yield
stress beyond which there is a marked change in gradient of the void ratio
stress curve indicating a significant reduction in stiffness. At stresses below
the yield stress the strains are generally recoverable (Leddra et ale 1993)
indicating elastic behaviour.
The yield stress marks the onset of destructuring (breakdown of bonded
structure). As the stress is increased sufficiently beyond the yield stress the
chalk becomes completely de structured and will behave like a granular soil.
This is seen clearly in Fig. 2.1/9 for the high porosity chalks. The initial steep
part of the void ratio-stress line represents the destructuring process. At high
stresses the completely destructured chalk shares a common void ratio-stress
curve which is independent of the initial porosity of the structured material.
This curve shows the stiffness of the material is increasing with increasing
stress which is typical of an uncemented soil.
17

The curve for chalk with 28% porosity in Fig. 2.1/9 shows no change in
gradient over the range of mean effective stresses used in these experiments.
However it will be seen from Fig. 2.1/9 that at the void ratio equivalent to
the initial porosity of this chalk the stiffness of the destructured material is
similar to that of the structured chalk and hence the yield stress will not be
marked by a noticeable change in gradient.
It will be seen from Fig. 2.1/9 that the yield stress increases as the porosity
reduces. This seems entirely reasonable since a high porosity is generally
associated with a weakly cemented chalk. The abruptness of yield appears to
be related to porosity in a similar manner.
Discontinuities in Chalk
In the mass the chalk is distinctly non-uniform, due principally to the wide
variety of discontinuity patterns displayed within this formation. Indeed the
fracture patterns often make the rock mass anisotropic (Nunn et al 1983,
Toynton 1983) and the degree and type of anisotropy varies significantly
across the extent of the outcrop. In geological terminology a discontinuity is
taken to include faults and joints. The separation between faults and joints
has frequently been associated with amount of displacement across the
fracture surface, and accordingly has been linked to scale. Joints are defined
as fractures formed to release stress within rock and along which there has
occurred insignificant displacement parallel to the fracture surface. Faults are
fractures along which there has been significant displacement parallel to the
fracture surface. Geologically they are considered to be different.
Geotechnically they share common characteristics such as low or zero tensile
strength and reduced shear strength compared with that of the intact rock.
Joints are relatively closely spaced structures. In small outcrops « 10m2)
there may be many joints belonging to the same set and often more than one
set may be present. On such a scale faults are generally rare, although some
faults may be closely spaced. In the chalk faults are generally rare except in
18

areas affected by intense tectonic activity. The major fold axes affecting the
Chalk of England are shown in Fig. 2.1/10. The Chalk has been affected by
only one major tectonic event; the Alpine orogeny. As the orogenic centre
was in continental Europe the intensity of effects in Britain decreases
northwards. Consequently, the only areas affected by complex structural
movements are south Dorset, the Isle of Wight and the Hog's Back in Surrey.
In these areas the chalk is found to be steeply dipping and cut by numerous
faults. Elsewhere the Chalk is affected only by relatively simple 'open' folds
such as the London Basin and the Wealden Dome. In the Chalk of East
Anglia, Lincolnshire and the Yorkshire Wolds, major folds are largely absent
and the chalk dips eastward at less than 10°. In general therefore the
principal discontinuities are joints.
Joint frequency is commonly a function of lithology and of bed thickness
(Harris et al, 1960; Hodgson, 1961, Price and Ladeira, 1981). Joint frequency
often increases markedly as the ground surface is approached. The chalk is
no exception, exhibiting closely spaced joints, often parallel to the bedding,
near the ground surface. Fault frequency is usually unrelated to lithology and
bed thickness. Joints are small two-dimensional structures. Minor joints are
generally restricted to single beds, particularly when the beds are folded or
the lithologies variable. Major joints usually cut several beds continuously. In
the chalk changes in depositional environment give rise to beds of different
porosity and hence brittleness. Such variations will often cause some joints to
be inpersistant and terminate at bedding discontinuities.
Slickensides are commonly associated with faults, but not with joints. In
tectonically hardened chalks it is common to find highly inpersistant
slickensided fractures associated with stylolites. In many rock types, joint
surfaces are irregular so that adjacent walls are completely interlocking. The
soluble nature of chalk however often results in the removal of small scale
irregularities which gives rise to limited point or ridge contact between
adjacent walls. The joints that appear most prone to this form of solution
19

weathering are generally those parallel with bedding, where the dip is sub
horizontal.
In competent rock the type and orientation of any joint is governed by the
relative magnitudes of the effective principal stresses during propagation
(Hoek, 1968). The stress controls for joint development can be described
using Mohr's circles as shown in Fig. 2.1/11. A tension joint (extension joint)
will form under conditions of zero shear stress (a = 0°) where a 3' is tensile
and equal to the tensile strength of the rock (at) and where a l' is less than
3at• Where (a1 - ( 3) > 4at then a component of shear stress acts. For (a1 -
a 3) between 4a t and 8a t a hybrid joint will develop with a dihedral angle 2a
between 1° and 30° (Fig. 2.1/11). Joints forming directly due to shear (shear
joints) can only occur when a3' is compressive and then (a1 - ( 3) must be
greater than 8a t. Such shear joints will generally develop dihedral angles
greater than 60°. A more comprehensive explanation of these stress controls
may be found in Hancock (1985).
The patterns created by the development of joints within a rock mass range
from simple to complex. The range of possible patterns even for a single
tectonic event is immense and without establishing the development stages on
the basis of field data, prediction of jointing characteristics is likely to be in
error. Rawnsley et al (1990) suggest that there are three simple joint systems
that may result from a single event. These include:
(i) Polygonal systems
This system is developed where a2 = a3 = -at. Each joint forms
parallel to a 1 but otherwise is unrestricted. Such joint systems
are typical of lava flows and desiccated sediments and are not
seen in the chalk.
20

(ii) Grid lock systems
The term grid lock was suggested by Hancock (1985) for the
development of two orthogonal sets of joints as shown in Fig.
2.1/12a. In this case a 2 and a 3 are both tensile and 0 > Ia 2 -
a 31 > at. The development of one joint locally releases the
value of tensile stress perpendicular to it within a stress release
field that is proportional to the length of the joint (Pollard and
Aydin, 1988). As a2 and a3 are close in value, such a reduction
may reverse their relative magnitude such that the next joint to
form is perpendicular to the first (Hancock, 1985, Simon et aI,
1988). This process continues until stresses capable of causing
joint formation are released and an orthogonal joint system is
produced. In most cases a 1 is the overburden stress leading to
vertical joint formation.
(iii) Joint spectral systems
Joint spectral systems (Hancock, 1985) result from a gradual
increase or decrease in a 1 relative to a 3 leading to a full range
of joints from tensile to shear. An example of this type of joint
system is shown in Fig. 2.1/12b. The development of this system
is complex with each joint propagating through a constantly
varying stress field resulting from the applied stress and the
stress relief fields of neighbouring existing and developing
joints. Curved joints (over a few metres) are common in such
systems since a single joint may alternate through stages of
tensile, hybrid or shear failure in response to the changing
stress field. Within mixed lithologies different spectra may be
specific to individual beds, presumably due to differing strength
and brittleness characteristics. Variation can also occur in a
single lithology due either to lateral stress variation or changes
in material properties.
21

A comprehensive systematic study of jointing in chalk has yet to be carried
out that permits the classification of joint systems using the above modeL
However observations of jointing in chalk made by several authors (Cawsey
1974, Nunn et aI, 1983, Toynton, 1983) suggests that joint spectral systems
may predominate. Price (1966) suggests that in simply folded rocks two sets
of tension joints and two sets of shear joints should occur in the pattern
shown in Fig. 2.1/13. The model developed by Price has been successfully
applied by Hancock (1969) to the pattern of jointing and faulting in the
Jurassic limestones of the Cotswold Hills and by Cawsey (1977) to the Chalk
of southern England.
In areas away from complex structural movements the discontinuity pattern is
generally characterised by a set of sub-horizontal bedding discontinuities and
several sets of steeply dipping joints. Cawsey 1974,1977 studied the fracture
patterns in the Chilterns and found up to six well-defined sets of steeply
dipping joints (Fig. 2.1/14) the orientations of which can be predicted from
the regional and local geological structures using Price's model. Figure 2.1/15
shows the distribution of dip for these joints. Cawsey (1974) found that
although there was a wide variation in dip angles more than 50% of the
population sampled had dips greater than 800• Similar patterns of steeply
dipping joints have been observed in East Anglia (Toynton, 1983) and
Lincolnshire (Nunn et al 1983). In most cases four sets can be identified.
In areas affected by complex structural movements a different pattern of
discontinuities are observed. In the Central Downs of the Isle of Wight where
the monoc1inal fold gives rise to steeply dipping bedding only 14% of the
fractures have dips exceeding 800 (Cawsey 1974,1977, Fookes and Horswill
1970). Only two sets of discontinuities predominate in this area and both
show evidence of shear displacement (Fig. 2.1/16). The conjugate (diamond)
fissure pattern, commonly associated with tectonic folding in brittle rocks is
not well developed on the monoclinal fold (Fookes and Denness, 1969). This
tends to support the theory that this structure was produced by gravity in
22

response to deep seated block displacement rather than horizontal
compression.
In terms of discontinuity pattern the chalk appears to display a relatively high
degree of uniformity within a given tectonic environment. The most common
pattern is one of sub-horizontal bedding discontinuities combined with steeply
dipping often sub-vertical joints. The number of joint sets together with the
average spacing and persistence of each set can however give rise to a highly
non-uniform rock mass. Although the pattern of jointing may be predicted
with reasonable accuracy from the regional and local geological structures,
spacing and persistence cannot. Joint frequency is commonly a function of
lithology and of bed thickness (Harris et aI, 1960, Hodgson, 1961 and Price
and Ladeira, 1981). The presence of a hard ground in the chalk will influence
the joint frequency but otherwise the major factors controlling joint frequency
are tectonism and weathering.
The roughness or surface topography is likely to have a significant influence
on the mechanical properties of discontinuities. Indeed roughness is
considered to be of fundamental importance in controlling the shearing
resistance of rock discontinuities (Patton, 1966, Barton, 1973). One of the r
principal factors controlling the stiffness of individual fractures is the
geometry or surface topography of the joint walls. The surface topography of
a fracture will depend to a large extent upon the mode of fracture
development and subsequent processes such as shear displacement and/or
solutioning. Most fractures are formed either by tension or by shear. Tension
fractures typically have a rough surface with some rounded portions whereas
shear fractures often display a regular step-like pattern (Chemyshev and
Dearman, 1991) and may be slikensided. The surface roughness of
discontinuities will vary according to scale. Typically roughness is
characterized by:
23

(i) Waviness
Large scale undulations (wavelengths between 0.5m and 10m) which if
interlocked and in contact, cause dilation during shear displacement
since they are too large to be sheared off.
(ii) Unevenness
Small scale roughness that tends to be damaged during shear
displacement unless discontinuity walls are of high strength and/or
stress levels are low permitting dilation on these features. The surface
roughness at this scale appears to be determined by the dominant
grain size of the rock if it is less than a millimetre to a few centimetres
in fine and coarse grained rocks respectively.
If a tension fracture undergoes shear deformation at some stage the small
scale asperities are likely to be sheared off, particularly in fine and medium
grained rocks, resulting in a reduction in unevenness. In soluble rocks such as
chalk, percolating water will tend to remove the unevenness by dissolution,
increase the aperture and reduce the degree of contact between the joint
walls.
Little work appears to have been done in classifying joint surface topography
for different rock types despite the fact that the morphology of rock fractures
is fundamental to the understanding or modelling hydromechanical
behaviour. Gentier and Riss (1990), Hakami and Barton (1990) and Pyrak
Nolte et al (1990) have studied the small scale morphology of fracture
surfaces in three dimensions of some igneous rocks. Bandis et al (1981) and
Aydan and Kawamoto (1990) have studied small scale surface topographies
for a variety of rock types in two dimensions. These sections indicate that in
two dimensions the surface topography at this scale may be considered as a
waveform in which symmetry, amplitude and wavelength are likely to be key
factors in classification. This "is essentially the basis o~spectral analysis
(Brown and Scholz, 1985). However for irregular and rough phenomena
showing partial correlations at a wide range of scales fractal analysis
24

(introduced by Mandelbrot (1977» is recommended (Gentier and Riss, 1990).
The bedding planes in limestone generally have a relatively rounded
topography compared with most of the others shown. The morphology of
these bedding plane asperities is associated with the depositional
environment. However it is likely that they have been modified by
solutioning. Over most of the chalk outcrop the bedding is sub-horizontal
and hence bedding discontinuities contribute much to the compressibility of
the rock mass beneath foundations.
For most of the chalk outcrop the dominant discontinuity system comprises
sub-horizontal bedding discontinuities and sub-vertical joints. The spacing of
these discontinuities is likely to be highly variable but may be controlled to
some extent by weathering processes and variations in lithology. In areas
where the chalk is dipping at angles greater than 10° the discontinuity system
will be more complicated and include steeply dipping joints together with
minor faults.
Most discontinuities in the chalk will be characterised by relatively rounded
asperities. The degree of contact between adjacent walls will be controlled by
largely by weathering processes such as stress relief and solutioning. These
processes are discussed in below.
Weathering
The principal weathering mechanisms which affect the chalk include:
(i) Stress relief
Stress relief results in the formation of new fractures and the
opening (increase in aperture) of existing fractures of tectonic
or depositional origin. The effects of stress relief die out with
depth or distance away from a cliff or valley side.
25

(ii) Frost or freeze/thaw action.
This results the mechanical disintegration of the chalk through
the formation of new fractures, opening of existing fractures
(regardless of origin) and the breakdown of the rock material.
In extreme cases the structure of the rock mass is completely
destroyed. Although the whole of the chalk outcrop has been
subject to type of weathering during the Pleistocene, some areas
are more seriously effected than others. In general those areas
such as southern England which were exposed to periglacial
activity throughout the Pleistocene tend to show the worst
effects which may extend 10's of metres below ground level.
(iii) Dissolution
The material adjacent to discontinuity walls undergoes
dissolution from percolating groundwater. This results in locally
increased apertures and the reduction in the degree of mating
of adjacent discontinuity walls. In extreme cases dissolution will
result in the formation of voids ranging in size from several
centimetres to several metres. The larger voids may collapse or
become infilled with soil. Such solution features are a common
problem in foundation design on chalk.
In the chalk these mechanisms combine to give rise to the characteristic
weathering profile shown in Fig. 2.1/17. Ward et al. (1968) observed the
weathering profile of the chalk in a number of large diameter boreholes at
Mundford, Norfolk and developed a engineering grade classification scheme
which is too a large extent controlled by the effects of weathering. This
classification scheme is shown in Table 2.3/9 and is discussed in detail in
section 2.2. It will be seen from Table 2.3/9 that zones A and B correspond
to Grade V (This also includes the additional Grade VI introduced by
Wakeling (1970), Zone C corresponds to Grades IV and ill and Zone D
corresponds to Grade IT (Grade I is defined on the basis of lithology and not
weathering).
26

The weathering zones may be identified on the basis of:
rock mass structure (ie presence of bedding and jointing);
discontinuity spacing;
and discontinuity aperture and infill
The zones shown in Fig. 2.1/17 do not have clearly defined boundaries. In
generally !~e boundaries between zones are gradational and the depth at
which a given zone grades into another is highly variable and is dependent
upon local conditions and recent geological history. The most noticeable
features of the weathering profile are the transition from unstructured to
structured chalk and the increase in discontinuity spacing with depth.
Examples of the variation of discontinuity spacing with depth are shown in
Fig. 2.1/18.
The chalk has been affected to a large extent by glacial and periglacial
conditions during the Pleistocene. The most significant is likely to be the
periglacial conditions since much of the chalk outcrop (ie southern England)
experienced these conditions more or less continuously during much of the
Pleistocene. Intact chalk is known to be susceptible to complete disintegration
by frost weathering (Tricart, 1956, Coutard et ale 1970, Lautridou, 1970,
Williams, 1980 and Jerwood et al., 1990). Near the surface the chalk is
intensely shattered and disturbed by frost heave such that the macro-structure
is destroyed. This structureless chalk comprising chalk fragments of all sizes
in a matrix of pasty matrix of remoulded chalk often resembles head, into
which it may pass upwards or laterally. However distinctive horizons such as
flint bands often continue through this material, although distorted by frost
heave, and prove that it is not transported material. Higginbottom (1966)
notes that the effects of frost shattering are most pronounced beneath
superficial deposits in the glaciated parts of the country, where they may
reach depths in the order of 15m. More than 12m of shattered chalk have
been recorded resting on the chalk beneath Quaternary tills and other
deposits of the Holderness Plain (Foster and Milton, 1976). In the south of
27

England frost shattering has been observed to depths in excess of 6m
(Higginbottom, 1966).
Frost shattering can cause selective opening of favourably orientated
discontinuities. Typically this affects discontinuities striking roughly with the
ground surface contours, through relief of expansive forces by downhill
displacement of the frozen layer. The effects often resemble small scale
cambering and may indeed be a related phenomenon. An example of this
form of frost shattering was found in the foundations for the first five piers of
on the western approach to the Medway bridge on the M2 in Kent. Loose
and open jointed chalk was encountered in which the principal discontinuities
had an average spacing of 460mm and apertures up to 50mm and most were
approximately parallel to the hillside, indicating an overall displacement
towards the valley centre (Higginbottom and Fookes, 1970). It was necessary
to grout to a depth of 6m below foundation level before the foundation
concrete could be placed (Kerensky and Little, 1964, and discussion 1965).
Most chalk excavations show very closely jointed material to depths in the
order of 30m (Higginbottom and Fookes, 1970). Where shallow deposits
overlie the shattered chalk, frost heaving has often produced involutions or
chalkland polygons and stripes, but where there are no such deposits the
chalk, though shattered is often not particularly disturbed (Williams, 1980).
Frost weathering accounts for much of the features of zones A and B and the
upper part of zone C. Within zone C the effects of frost shattering diminish
with depth such that the effects of stress relief may become more dominant.
There is no clear picture concerning the weathering of chalk in periglacial
times and hence it is impossible at this stage to predict the depth of frost
weathering for a given site. It is likely that there is a relationship between
intact porosity and the degree of disintegration of the chalk that would give
rise to different weathering styles. It has been noted (Williams, 1987) that
weathering is most clearly developed on the hardest (low porosity) chalks and
28

is relatively inconspicuous on weak chalks. However no systematic study of
chalk weathering can be found in the literature.
The effects of stress relief may be seen in the weathering profile particularly
in locations where frost shattering does not extend to great depth, although in
many cases it may be difficult to distinguish between them.
Stress relief generally produces joint-like fractures in brittle rock that are
commonly sub-parallel to the local topography, very local in extent and
normally have very little or no filling material (Nichols, 1980). They
sometimes crosscut tectonic fractures or become curved at the intersection
and terminate. Nichols (1980) suggests that these fractures are related to
lithology and proximity to free faces. For example in mixed sedimentary
lithologies such as limestone and shale the fractures are often contained
within a single unit and do not cross unit boundaries. The fracture
orientations are usually parallel to valley walls and in valley bottoms fractures
are parallel to the bottom surface. Hence the term 'topographic jointing' is
often used to describe these fractures.
The generally accepted idea, first proposed by Gilbert (1904), is that
expansion of rock masses when their confining pressures are reduced by uplift
and erosion finds relief in the development of cracks. This pressure-release
by erosion of a superincumbent load is seen mainly in granite, but also in
massive sandstone (Bradley, 1963), bedded sandstone (Currey, 1968) and
limestone (Kiersch and Asce, 1964). Stress relief through glacial erosion and
ice meltdown has resulted in significant fracturing of rock (Lewis, 1954).
Sheeting or topographic jointing is most common in massive brittle poorly
jointed rocks (eg Granite) In rocks that exhibit creep behaviour, such as high
porosity chalk stress relief jointing may not be well developed due to the
ability of the rock to deform in response to gradual stress changes. It is likely
that the style of stress relief jointing will vary across the chalk outcrop in
response to differences in brittleness related to wide variation in porosity. In
rocks masses which exhibit tectonic jointing the expansion may be taken up
29

by existing discontinuities hence the formation of 'topographic jointing' may
be severely restricted.
Fookes and Denness (1967) suggest that bedding the dominant control of
stress relief fracturing in chalk. They observed that if bedding is parallel to
the free ground surface, vertical unloading by erosion has a marked influence
on the development of fractures parallel to bedding.
The weathering profile may be modified by dissolution through the widening
of discontinuity apertures and the formation of larger scale features such as
pipes, swallow holes and dolines. Although the chalk has not developed the
huge cavern systems of the Carboniferous Limestone new cave systems are
being discovered every year, one of the most extensive occurring beneath
Beachy Head (Reeve et al. 1980).
In chalk as with other limestones, solution weathering is the process of
removing carbonate ions in an open system, thus permitting continuous
dissolution to take place. The extent of the dissolution and the removal of
the chalk as bicarbonate is controlled by a number of factors, the most
significant are likely to be:
(i) availability of water
(ii) availability of carbon dioxide
(iii) temperature
(iv) degree of saturation
(v) porosity
In addition to the carbon dioxide incorporated from the atmosphere,
percolating rainwater also takes carbon dioxide from the soil air (F ookes and
Hawkins, 1988). This additional carbon dioxide can increase the amount of
CaC03
that can be dissolved to over 30Omg/1 (Groom & Ede, 1972). Clearly
the soil profile can be a major source of chemical aggressivity. Atkinson and
30

Smith (1976) pointed out that in limestone terrains where a soil profile exists
the dominant solution activity takes place near the ground surface.
At low temperatures more carbon dioxide can be dissolved in water; for
example twice as much can be held at O°C than at 30°C. This has led some
authors (eg Higginbottom and Fookes, 1970 and Higginbottom, 1971) to
attribute the development of solution features in chalk to low temperatures
that existed during much of the Pleistocene.
Summary
The following points arise from this study of the deposition, diagenesis,
structure and weathering of the chalk:
• Most white chalk (Middle and Upper Chalk) exhibit a relatively
uniform chemical composition. However the processes of deposition,
diagenesis and tectonism have given rise to a wide range of porosity
(9% to 52%).
• The mechanical properties of intact chalk such as strength and
stiffness appear to be related to porosity. The strength and stiffness of
intact chalk can be expected to vary over two orders of magnitude.
• The discontinuity pattern in the chalk is dominated by sub-horizontal
bedding discontinuities and at least two sets of sub-vertical joints,
except in areas affected by intense tectonic activity. The primary
discontinuities (ie depositional and tectonically induced fractures) are
reasonably uniform within a given tectonic environment.
31

• Weathering processes result in significant changes to the structure of
the rock mass. The principal weathering processes include:
stress relief;
frost action;
and dissolution.
• The general weathering profile for the chalk is characterised by:
structureless chalk;
and structured chalk with discontinuity spacing increasing with depth
and aperture and infill decreasing with depth.
• The boundaries between zones within the general weathering profile
are gradational and their lateral and vertical extent are controlled by
local conditions and recent geological history.
• The weathering profile is dominated by the effects of intense freezing
during the Pleistocene. This has resulted in the formation of
structureless chalk and frost shattered chalk (ie closely to very closely
jointed chalk) to varying depths.
• Dissolution has resulted in the widening of discontinuity apertures,
modification of discontinuity surface topography and the development
of larger scale features such as pipe, swallow holes, dolines and caves.
These latter features can be a hazard to foundation stability in chalk
areas.
• There has been no systematic study of chalk weathering to date that
permits the identification of weathering styles associated with the wide
range of mechanical properties of this material.
32

Fig. 2.1/1
Fig. 2.1/2
Porosity (%)
Biozone 60 50 40 o
Bmue Min. Average Max.
Aqu
u~per M test
Calk Mea
Met
HP
Middle T lata
Chalk RhC
Lower Hsub
Chalk Sv
1.0 1.5 2.0 2.5 3-
Dry Density (Mg/m )
Variability of the chalk in terms of dry density and porosity (from Clayton and Matthews, 1987).
0
2.5-10
~ ,
Me •• , , , 20 ,
-.... • ,~'I' -C) 2.0- ffl. :E -- . \ •• 30 >->- -1'-........ • ... .-... tn . -tn 40 0 C "-
CD 1.5 0
C a.
>-Trend observed 50 ...
C by Mimran (1975) 60
1.0 0 30 60 90
Dip (degrees)
Results of density tests on chalk from West Surrey, Isle of Wight and the Isle of Purbeck (after Clayton and Matthews, 1987).
33

-as D.. :E -b
U
Fig. 2.1/3
-as D.. :E -b'"
Fig. 2.1/4
Porosity (%)
50~SO~ __ ~ ____ 4~0 ____ 3JO __ ~~ __ ~10L-__ ~0
40
30
20
10
0 1
III Dry chalk .,
+ Saturated chalk ..
1.2 1.4 1.6 1.8 2 2.2 2.4 2.S
Dry density (Mg/m3)
Variation of uniaxial compressive strength of chalk with dry density and porosity (Data from Masson, 1973, Bell, 1977, Bonvallet, 1979, Woodland et al., 1988, Clayton and Safari-Shooshtari, 1990, Bell et al., 1990, Blight, 1990, Kroniger, 1990, Mortimore and Fielding, 1990, Nienhuis and Price, 1990, and Varley, 1990).
Porosity (%) so 50 40 30 20 10 o
S,-~----~----~----~----~----~--~
5
4
3
2
1
0
El Dry chalk Gl
+ Saturated chalk '" '" '" '" '" '" ,,'" '" IY
" '" +,~-:" ",. £I ,-f
., '" , ... £1/ .... ~ + -~' ~ ......
~ +;...--~ - ~::r+:j:
1 1.2 1.4 1.6 1.8 2 2.2 2.4 2.6
Dry density (Mg/m 3
)
Variation of Brazilian tensile strength of chalk with dry density and porosity (Data from Bell, 1977, Bell et aI., 1990, Kroniger, 1990, Mortimore and Fielding, 1990 and Nienhuis and Price, 1990).
34

-. CO
D.. :E ---~ -CO .c Co)
~ ... C
bU
Fig. 2.1/5
-co D.. e" ---0 ~ -~ "0 0 E 0 ... C) C ~ 0 >
Fig. 2.1/6
50
40 0;. Dry = 2 0cSat
30
20 Ell
10
0 0 4 8 12 16 20 24
a Saturated chalk (MPa) c
Relationship between the uniaxial compressive strength of dry and saturated specimens of chalk (Data from Masson, 1973, Bell, 1977, BODvallet, 1979, Bell et aI., 1990, Blight, 1990 and Kroniger, 1990).
Porosity (%)
60 50 40 30 20 10 30
25 • Ei sat
• Et50 sat 20
• Et50 dry 15 • •• • • • 10
P !t . , •
5 . ~,.. •• •
0 1.00 1.50 2.00 2.50
Dry density (Mg/m3
)
Variation in stiffness of chalk with dry density and porosity (Data from Bell, 1977, Bonvallet, 1979, Woodland et al., 1988, Bell et aI., 1990, Kroniger, 1990 and Nienhuis and Price, 1990).
35

-CU D.. ~ --C")
b
b~ -
Fig. 2.1/7
Fig. 2.1/8
2000 B~
1500 A
N C
1000
500
O'~~------L-----__ ~ ________ -L ________ ~
o 0.02 0.04 0.06 0.08
Axial strain (%) Typical stress-strain behaviour for intact chalk (after Jardine et aI. 1985).
8 ,--------,--------,-------~--------~
-CU 6 D.. B CJ -t/) ::J -::J " 4 A 0 E c ... A Saturated samples c cu C tested undrained (,) CD 2 en B Part dried,
tested drained
o L-______ ~~ ______ ~ ________ ~ ________ ~
o 0.02 0.04 0.06 0.08
Axial strain (%) (bl
Variation of secant Young's modulus with axial strain for chalk (after Jardine et at. 1985).
36

Fig. 2.1/9
Fig. 2.1/10
1.0
0.8 48% porosity
0 .-... CU O.S ~
'"C .- 38% porosity 0 >
0.4 ...... _------- ---28% porosity
0.2 0 20 40 SO
Mean effective stress (MPa) -
Yield observed in chalks of different porosities when subjected to uniaxial (~ compression (after Leddra et al. 1993).
- Anticline
- - -- Syncline
1Skm
Chalk outcrop
Map of southeastern England showing the main structures affecting the Chalk.
37

a 2
a 2
a 3
(a)
Shear stress e\O~e e~~
-2T -T
Fig. 2.1/11
4T ~i,.~v.(e .................................... . ~ ....
.. . :/··· · ······· · ··· ...
2a = 45· ...
T Normal stress
aT
(b)
(a) Block diagram showing relationships between effective principal stresses and an extension fracture (E) and conjugate shear fractures (S) developed in a mechanically isotropic brittle rock. Stipple indicates the quadrants within which hybrid fractures form. (b) Composite failure envelope and Mohr circles constructed for 2a = 0, 45 and 60°, (T = tensile strength and <p = angle of internal friction. (after Hancock, 1985).
38

Fig. 2.1/12
Fig. 2.1/13
N
w ;------.;:: a.::.-----.... E
S N
(a) Grid lock system
w~----I"'''' .. ..----rE
s (b) Joint spectrum system
Rose diagrams showing typical grid lock and joint spectrum discontinuity patterns in rock (after Rawnsley et ale 1990).
-- Tension joints
- - - Shear joints
Typical system of jointing developed on the liob of a fold (after Price, 1966).
39

Fig. 2.1/14
U) CD 2 5 -- Jx
North Chilterns ca en 4 g II ::ii 015 -.-o 1 Z
U)
o
! South Chilterns Jy == .......... 4 ~ S! 3 J2 Jx' J3
.!2 II -.-2 oS
• 0 1 oeo Z o
90
Strike
90
Strike
J1
Base of chalk
180
180
(a)
Top of chalk
10km , ,
(b)
(a) Frequency polygons for dominant joint sets plotted against their strike for the Chalk recognised in the Chilterns. (b) Map of strikes of fracture sets observed in the northern Chilterns. (after Cawsey, 1977).
40

-fI. --->a () r::::: CI) ::J C" CI) ... --u..
Fig. 2.1/15
60,-----------------------------------
40
20
o~~~~~~~--~~--~~~~~~~~~
30 60 90 60 30
Dip (degrees)
___ J2 -+- Jx ~ J3 _ Jy --e-- J1 -8-- J4
Frequency polygons showing the variation in dip of the major joint sets recognised in the Chiltems (after Cawsey, 1977).
41

slickensided fault plane
Thrust fault
lolnt
joint
Flint band in plane of bedding
Joint
__ ~hearzone
3m I
Fig. 2.1/16 Block diagram illustrating orientation and frequency of joints and faults in the chalk near Culver Cliff, Isle of WIght (after Fookes and Horswill, 1970).
42

,
fragments Increases with depth and grades "' .. _~=:IP-- Friable to rubbly chalk. into structured chalk d· ~=~:::;:::::~<:::35~~= Bedding and jointing present.
\ Fractures are closely spaced ~-~-=-~~p-c=~- and generally Infilled with
With depth: .~..:::::::::::::::::=O- soil and chalk fragments. ~-h~~~ -- -{--
• fracture spacing increases D I --'--=:::--.
• Aperture decreases Blocky to massive chalk • amount of Inflll decreases Fractures are widely spaced and
generally tight
~----E----
Fig. 2.1/17 Typical weathering profile for the Chalk.
43

CD ()
~ :::J tJ)
"C C :::J o ... en ~ o a; Jl ..c
No. of vertical fractures per metre o 20 40 60 80 100 O.-------r-------.-------~------~------o .8 _.
- - - -v v
o Asham quarrey, Lewes
o Peacehaven cliff
• Taring Neville quarry, Newhaven
V Roedean cliff a CD 6 C
Fig. 2.1/18
Fig. 2.1/19
Variation of vertical joint spacing with depth for four sites in East Sussex (after Williams, 1987).
..-.. C 0 E ----CD > CD ...I
o
No. of horizontal fracture~ per metre
10 20 30 -25 ~--,.----r----
-30 v
A -35 AA
A
-40
Princess Quay
o BH1 v BH2 o BHa A BH9
Variation of sub-horizontal fracture spacing with depth for chalk, based on drillhole logs for Princess Quay, Hull (after Woodland et ale 1988).
44

2.2 Mass Compressibility
It is common practice in rock mechanics to emphasise the role of
discontinuities as the principal factor controlling the engineering behaviour of
rock masses. Since chalk is considered to be a weak rock, discontinuities are
thought to dominate the compressibility characteristics of the rock mass. The
description of the mechanical properties of rock discontinuities (particularly
rock joints), however, still appears to be a debatable subject. Although
several fundamental aspects of behaviour have been resolved qualitatively,
widely accepted quantitative procedures are limited. The literature reveals an
impressive number of articles documenting the shear strength of
discontinuities. The subject of rock joint stiffness and the influence this has
on the behaviour of the rock mass appears to be a relatively new subject and
hence has received less attention than shear strength.
Injluence of Discontinuities
Goodman (1976), Bandis et al. (1983) and Raven and Gale (1985) showed
that the introduction of a single discontinuity into a laboratory specimen of
rock perpendicular to the direction of the applied load will give rise to a
significant change in the stress-displacement characteristics when compared
with that of the intact rock. The deformation behaviour of a rock mass
involves the complex interaction of many factors. It is best understood by
separating the principal components of deformation. These include:-
(i) DEFORMATION BEHAVIOUR OF INTACT ROCK
Relative to the joints, intact rock is generally stiff. Its high
modulus is complemented by a low value of Poisson's ratio
which limits lateral expansion at moderate stress levels. It has
been shown in section 2.1 that the stiffness of intact chalk is
related to porosity.
45

(ii) NORMAL STRESS-CLOSURE BEHAVIOUR OF
DISCONTINUITIES
Goodman (1976) and Bandis et al. (1983) showed that
individually, joints display concave-shaped stress-closure curves
under normal loading. Fig. 2.2/1 shows that when the
deformation of the intact rock (0 nr) is subtracted from the stress
closure curve for the whole jointed block (0 nt)' a highly non
linear, hysteretic stress-closure curve is obtained for the
individual joint (onj). Fig. 2.2/2 shows that cycles of loading and
unloading exhibited hysteresis and permanent set that
diminished rapidly with successive cycles. Fig. 2.2/1 shows that
non-mated discontinuities display greater closure at a given
normal stress that mated discontinuities. These characteristics
of normal stress-closure behaviour are thought to be typical of
most rock types.
(iii) DISCONTINUITY SHEAR BEHAVIOUR
Schieder (1976), Bandis et al. (1983) and Yoshinaka and
Yamabe (1986) showed that individually, joints display convex
shaped stress-displacement curves under shear (Fig. 2.2/3),
usually accompanied by dilation which contrasts strongly with
the normal stress-closure behaviour. Fig. 2.2/3 shows that both
the peak shear strength and the displacement required to reach
the peak strength are scale dependent. The shear deformation
behaviour of discontinuities is strongly influenced by the
roughness of discontinuity surfaces and the degree to which
dilatancy is inhibited by the surrounding rock mass.
46

It will be seen from Figs. 2.2/1-4 that the stiffness of discontinuities in rock is
strongly stress dependent and influenced to a large degree by the mode of
deformation. The stiffness of individual discontinuities must therefore be
considered in terms of the normal and shear components of deformation.
Goodman et al. (1968) defined joint stiffness as the ratio between the
magnitude of the normal (a) or shear ('[) stress and the resulting normal (0 n)
or shear (os) deformation. This gives rise to two basic discontinuity stiffness
components:
Normal stiffness k n = ~ n
Shear stiffness ks = ; s
FACTORS AFFECTING NORMAL STIFFNESS
The principal factors which control the normal stiffness characteristics of
individual discontinuities include:-
(i) The area of contact between the two surfaces
(ii) The stress-strain characteristics of the intact rock
(particularly that adjacent to the discontinuity).
(iii) The presence of infill material and the mechanical properties of
this material.
(iv) The magnitude of the applied load.
47

Contact Area
When two rough surfaces are placed lightly together, the proportion of the
surface area in actual contact is almost zero. The entire normal load is
carried by a small number of point contacts. Under increasing normal load,
the point contacts enlarge by elastic deformation, crushing and tension
cracking, while deformation brings new regions into contact. Cook (1992)
suggests t~~t the normal stiffness of a discontinuity depends primarily upon
the contact area between the two surfaces.
The surface topography of joint walls will affect the distribution and
amplitude of asperities and the numbers of asperities in contact between the
two surfaces. This in tum will influence the asperity contact area, contact
stresses and the maximum joint closure. All these factors are dependent
upon the average stress level and whether the joint is mated or non-mated
(Fig. 2.2/4). Goodman (1976) made laboratory measurements of joint closure
as a function of normal stress on artificially induced tensile fractures in rock
cores. After the test with a non-mated joint, he observed that about 10% of
the area of the joint showed signs of crushing, representing the area of
contact between the two surfaces. Bandis et al (1983) have made an
extensive study of a variety of natural, unfilled joints with different degrees of
weathering and roughness in dolerite, limestone, siltstone and sandstone.
Impressions of contact areas between the two joint surfaces were made on a
polyester film 12 J..£m thick, inserted between the surfaces before loading.
These contact areas were found to be in the range of 40 - 70% of the total
joint surface area at the highest stresses. The effect of the film thickness
would be to overestimate the contact area, but natural joints are often mated
and hence would also be expected to have greater contact area than the non
mated artificial joint measured by Goodman. Duncan and Hancock (1966)
made measurements of contact area at different applied stresses for a variety
of rock types including chalk, by inserting two sheets of "No carbon-Required"
pressure sensitive paper (manufactured by the National Cash Register
Company) between the two surfaces of the joints. The results of these
48

experiments are shown in Fig. 2.2/5. Despite the scatter of data points a
distinct trend of increasing contact area with applied stress may be seen. At
relatively low stress levels « 3MPa) the contact area was generally less than
10% of the total area. The contact area increases with stress level but
generally never exceeds 50% of the total area even at an applied stress of
20MPa. It is likely however, that Duncan and Hancock's experiments gave an
overestimate of contact area due to the effect of the thickness of the pressure
sensitive paper.
This trend of increasing contact area with normal stress was also observed by
Pyrak-Nolte et al. (1987) from measurements of joint closure, contact area
and void space geometry across natural joints in specimens of quartz
monzonite (50mm dia.) at room temperature and at 100°C. To study the
contact areas and void spaces between the surfaces of the joints, molten
Cerrosafe®, an alloy of lead, tin, bismith and cadmium that is totally molten
at 92°C, was injected into the joints at effective stresses of 3, 35, and 85 MPa
with a back pressure of 2MPa. The specimens were cooled to solidify the
alloy in place while the stress and back pressure were held constant.
Cerrosafe® has a surface tension of 400 roN /m, so that under a back pressure
of 2 MPa it will penetrate void spaces with apertures as small as O.4J,£m.
When the specimen was separated into two halves, precise metal casts of the
void spaces were found to adhere to one or the other of the two surfaces.
The void space and contact area could be mapped using optical techniques
and scanning electron microscopy. Fig. 2.2/6a shows the composite
micrographs of a portion of the natural joint at different effective stresses for
specimen E30. The black areas in Fig. 2.2/6a indicate the asperities of
contact. These contact areas appear to increase significantly with increasing
effective stress. Fig. 2.2/6b shows the relationship between joint closure and
normal stress and the relationship between contact area and effective stress
for the two specimens tested. At 3MPa the contact areas were 9 and 16% of
the total area. At 85MPa the contact area of the stiffest specimen (E32) had
asymptoted to a value of about 40% while that of the less stiff specimen
(E30) had reached a value of 30% and was continuing to increase. It is
49

apparent from Fig. 2.2/6b that even at stresses as high as 85MPa the joints
continue to close and significant void space remains within the joint. It will be
seen from Fig. 2.2/6b that the contact areas are of the same order of
magnitude as found by Duncan and Hancock (1966), Goodman (1976) and
Bandis et al. (1983).
It is clear from the above discussion that when a joint is subjected to
increasing stress that the asperities of contact increase in size and as a result
of joint closure new contact points are created. This behaviour is well
illustrated by a photoelastic investigation reported by Hyett and Hudson
(1990). In this study stress sensitive epoxy resins were cast against natural
joint surfaces in order to accurately reproduce their surface morphology. For
mated joints the number of new point contacts was greater for the rough than
for the smooth joint as the applied stress was increased. The pre-existing
point contacts for the smooth joint tended to spread laterally with increasing
applied stress. For mismatched joints the number of joint contacts created as
the load was increased was few, and to compensate for this the stress
transmitted across individual contacts was higher. As with the interlocking
cases individual contact zones spread more rapidly for the smooth joint than
for the rough joint. The smooth mismatched joint probably best models the
bedding plane discontinuities in chalk that have had material removed by
solution.
A number of mathematical models have been proposed to describe joint
closure under an applied loading which take account of joint surface
topography (Greenwood and Williamson, 1966, Swan, 1983, Brown and
Scholz, 1985,1986). The theories used to model joint compliance are based
on elasticity and yet they predict decreasing compliant behaviour with
increasing stress which is observed in experiments involving both elastic and
plastic deformations. These models are clearly deficient in that they fail to
recognise the fact that asperities of contact are likely to undergo yield or
collapse particularly in weak rocks None of these theories of joint closure
50

takes account of the interaction between asperities and the related
deformation of each elastic half space bounded by the joint surfaces.
Stress-Strain Behaviour of Discontinuity Wall Rock
The surface topography of the two joint surfaces and the degree to which the
two surfaces are mated will clearly control the initial contact area. As the
load is applied perpendicular to the joint, load is transmitted across the
asperities of contact and high contact stresses are generated at these points.
The stress-strain characteristics of the intact rock forming the joint wall will
control the response of the asperities of contact to these induced stresses. In
strong rocks of low porosity its is likely that the asperities of contact behave
elastically at engineering stress levels, and that in such a case the normal
closure of the joint will be recoverable upon unloading. Sun et al (1985)
carried out experiments on artificially produced discontinuities in rock types
of relatively high strength (Granite (Jc > 200 MFa and Slate (Jc > 300 MFa).
They found that for the first loading of an un-mated joint up to 72% of the
deformation was recoverable, whilst in repeated loading on other un-mated
joints this figure could be as high as 92%. The high degree of elastic
response of these materials, particularly at the low stress levels employed « r
0.1 * (J c), will have a significant influence on the observed behaviourial trends.
Brown and Scholz carried out joint closure studies on a £ 80 grit roughened
marble surface which had been loaded against a flat surface over four cycles
to 10MPa. The closure data show a large permanent set for the first cycle
and recoverable deformation for subsequent cycles. Scanning electron
microscope studies show definite plastic flow at the higher asperity tips. For
the flattened tips yielding occurred resulting in plastic flow until the contact
area became sufficient to support the load elastically for the remaining cycles.
This plastic behaviour was not observed as a dominant joint closure
mechanism in similar experiments on rocks such as quartzite and granite in
which the individual grains are stiffer than the calcite forming the marble.
51

In weak rocks even at relatively low applied stress levels it is likely that
asperities of contact could undergo yield and hence behave in a plastic
manner. In such a case the joint closure would not be recoverable upon
unloading. In highly porous weak rocks such as chalk the asperities of contact
may undergo pore structure collapse which may result in a sudden change in
gradient of the joint closure-normal stress curve. Pore structure collapse has
been observed in intact specimens of chalk (Leddra et al. 1990). Compression
tests on artificial discontinuities in chalk have demonstrated that in uniaxial
strain the discontinuity exhibits yielding at average normal stresses much less
than that of intact chalk (Matthews and Clayton, 1992). This behaviour
contrasts with the characteristic concave stress-closure curves observed by
Goodman (1976) and Bandis et al. (1983) for other rock types. Wake ling
(1975) and Matthews and Clayton (1992) showed that chalk exhibits this
behaviour for smooth fractures with contact area ratios (contact
area/specimen cross sectional area) greater than 90%. The yielding
behaviour was observed for specimens with contact area ratios less than 30%.
Clearly the normal stiffness of discontinuities depends upon an
interrelationship between the stress-strain behaviour of the intact rock
forming the asperities and contact area.
Weathering of discontinuity walls is likely to have a significant effect on the
stress-strain behaviour of asperities which in turn will influence the normal
stiffness of the discontinuities. Chemical decomposition of rock forming
discontinuity walls is likely to reduce the stiffness of asperities of contact.
Dissolution of discontinuity walls will reduce the contact area.
In the chalk the wide range of porosity gives rise to a wide range of intact
mechanical properties which may have a significant influence on the
compressibility characteristics of the discontinuities.
52

Discontinuity Infill
The presence of infill material within the discontinuities will effectively
increase the contact area between the two surfaces and reduce the void space
and hence is likely to have a significant effect on the stiffness characteristics
of the fracture. The influence infill has on the compressibility of a
discontinuity will depend to a large extent upon the degree to which the void
space is filled and the mechanical properties of the infill material. If a joint is
completely infilled the stiffness will be controlled by the thickness of the infill
relative to the amplitude and distribution of asperities together with the
mechanical properties of the infill material. If the infill thickness is greater
than the maximum amplitude of the asperities then there will be no contact
between the asperities and the stiffness will be controlled by the mechanical
properties of the infill until joint closure brings the asperities into contact. If
the thickness of infill is such that there is asperity contact then it is likely that
the asperity contact stresses will be reduced through load shedding onto the
infill since deformation of the infill may be inhibited by lack of drainage
(cohesive infill) or by the lack of sufficient void space if the infill is dilatant.
In such a case the stiffness of the joint may be increased and in the case of a
cohesive infill result in time-dependent joint closure. If the infill is loose and
free draining it is likely that the presence of the infill will have little effect on
the joint stiffness provided there is asperity contact. Of course in all these
cases ultimately joint closure will be inhibited by both the increase in asperity
contact area and the increase in stiffness of the infill as it consolidates. This
assumes the infill behaves as a soil. In some cases joint infill can be cemented
and hence may behave as a rock. In such cases it is likely that the joint
stiffness would be increased.
If the discontinuities are only partially infilled the normal closure will
proceed as if the infill were not present until the volume of the remaining
void space approaches that of the infill. In such a case there would be
interaction between asperity contact and the infill in the manner described
above.
53

Little work appears to have done on the influence of compressible infill
material on joint stiffness. Goodman (1970) tested artificial joints infilled with
crushed mica in direct shear. The shear stiffness of the joint decreased slowly
with degree of joint filling until the infill thickness was greater than 0.8 times
the amplitude of the asperities at which point the stiffness remained constant
at twice the stiffness of the infill material. This represents one of the first
investigations of the influence of infill on the mechanical properties of joints.
This and subsequent investigations (Lama 1978, Papaliangas et aI., 1990,
Pereira, 1990, Phien-wej et al., 1990 and Xu et al., 1990) have all focused on
shear strength. In terms of normal stiffness the principal factors relating to
the influence of infill would include:
(i) Stiffness of infill material
(ii) The degree of infilling (ie whether the joint is partially or
totally infilled) and the thickness of the infill.
(iii) The degree of rock to rock contact across the joint.
Most joints in chalk are either free of infill or only partially infilled with
chalk fragments. The rock to rock contacts across the joint are generally
dominant and hence the infill will have a negligible effect on the joint or
mass stiffness.
FACTORS AFFECTING SHEAR STIFFNESS
Shear stiffness is unlikely to make a significant contribution to the
compressibility of chalk which is dominated by sub-horizontal and sub-vertical
discontinuities. It is the normal stiffness of the horizontal and sub-horizontal
joints that will tend to control the deformation of the rock mass in response
to a vertical foundation loading. A comprehensive review of the factors
affecting shear stiffness is therefore beyond the scope of this thesis. For this
reason the factors affecting shear stiffness are only outlined below.
54

The principal factors affecting the shear stiffness of a single discontinuity
include:
(i)
(ii)
The roughness of the discontinuity walls
The stress-strain behaviour and shear strength of the
discontinuity wall rock
(iii) The presence of infill or materials coating the discontinuity
walls
(iv) The magnitude of the applied load
Within a rock mass the discontinuities may be so orientated with respect to
the applied stresses that mode of deformation is one of shear displacement.
In such a case the degree of interlocking of asperities, the amplitude of
asperities, the shear strength of asperities, the freedom for dilatancy and the
presence of infill will be important factors in controlling the shear stress
displacement characteristics of the discontinuity. The shear stress
displacement curves shown in Fig. 2.2/3 suggest that joint behaviour in
translational shear under constant normal stress may vary from 'brittle' to
almost 'plastic', depending on the size of the joint. Barton et al. (1981) in a
survey of peak shear stiffness found that for a given normal stress, shear
stiffness was inversely proportional to discontinuity length. Peak shear
strength, peak shear displacement and shear stiffness are all depicted as scale
dependent parameters (Barton and Bandis, 1982). In a rock mass, however,
translational movements along discontinuities are unlikely to occur under
conditions of constant normal stress. Since translation often involves dilation
the normal stiffness of the discontinuity will cause the normal stress to
increase. Rock joints tested under constant normal stiffness conditions still
produce convex shear stress-displacement curves.
55

FACTORS AFFECTING THE COMPRESSmILITY OF A FRACTURED
ROCK MASS
It is clear from the above discussion that the stiffness characteristics of
individual discontinuities are associated with interaction of several factors
such as contact area, infill and the mechanical properties of the intact rock.
The compressibility characteristics of a rock mass however involves the
interaction of multiple discontinuities and intact rock. The principal factors
controlling the compressibility of a rock mass subject to a foundation loading
must include:-
(i)
(ii)
The stiffness characteristics of the discontinuities present
within the zone of influence of the applied load.
The orientation of the discontinuities relative to the direction of
the applied load.
(iii) Confining pressure.
(iv) The number of discontinuity sets present.
(v) The spacing of discontinuities relative to the size of the loaded
area.
(vi) The stress-strain characteristics of the intact rock.
(vii) The magnitude of the applied load.
The stiffness characteristics of individual discontinuities will play a major role
in controlling the compressibility of a fractured rock mass. The factors which
influence the stiffness of discontinuities has been discussed earlier. The
contrasting shapes of the normal stress-closure and shear stress-displacement
56

curves will clearly give rise to different modes of rock mass deformation for
different orientations of discontinuities relative to the direction of applied
load.
Orientation of Discontinuities Relative to the Direction of Applied Load
Barton 1986 defined three characteristic modes of load-deformation
behaviour associated with the orientation of the discontinuities relative to the
direction of the applied load based on the dominant deformation mechanism.
These are summarised in Table 2.2/1 and Fig. 2.2/7. Fig. 2.2/7 shows the
three simple rock mass models considered by Barton (1986) subjected to a
vertical applied load.
Table 2.2/1. Characteristic load-deformation behaviour for rock masses.
(After Barton, 1986)
Case Dominant Shape Hysteresis Lateral mode of of load- expansIon Deformation Defm. curve
A Normal Concave Small Small
B Normal & shear Linear Moderate Moderate
C Shear Convex Large Large
In case A the dominant discontinuity orientations are horizontal and vertical.
In this case the normal closure of the horizontal fractures will be the
dominant deformation mechanism. Since, individually, joints display concave
shaped stress-closure curves under normal loading (Fig. 2.2/1) it seems
reasonable to assume that the load-settlement curve for the rock mass
displays a similar concave shape (Fig 2.2/7a). Brown and Trollope (1970) and
Chappell (1979) demonstrated this concave behaviour in laboratory-scale
model tests with fractures parallel and perpendicular to the applied major
57

principal stress (see Fig. 2.2/8). This characteristic concave load-settlement
curve has been observed in large diameter (l.5m) plate loading tests on
Bunter Sandstone at Heysham, Lancashire (Hobbs, 1973) which is dominated
by sub-horizontal bedding discontinuities and steeply-dipping joints (Meigh et
al. 1973). Once the joints have closed sufficiently the stiffness of the intact
rock will begin to dominate the load settlement behaviour. The interaction
between joint closure and intact rock deformation depends upon the relative
stiffness of the joint and the intact rock together with the strength of the
asperities.
In case B (Fig. 2.2/7b) the orientation of the discontinuities are such that
the deformation of the rock mass must involve both normal closure of
fractures together with shear displacement. Individually joints display a
convex-shaped stress-displacement curves under shear, usually accompanied
by dilation (Fig. 2.2/4). Barton (1986) suggests that a linear load-settlement
relationship is applicable to this model (Fig. 2.2/7b) resulting from the
superposition of normal closure (concave stress-closure curve) and shear
displacement (convex stress-displacement curve) components of deformation.
Cramer et al. (1984) describe large-scale in-situ block tests performed on
columnar basalt. When the load was applied perpendicular to the basalt r
columns the load-deformation curve was more or less linear. The concave
behaviour associated with normal joint closure was absent during loading but
was evident during unloading suggesting that a combination of shearing and
normal joint closure was occurring. However it is unlikely that the magnitude
of normal closure will have been balanced by the magnitude of shear
displacement such that a linear load-settlement curve results. The shear
displacement is likely to be associated with dilatancy (depending on the
roughness of the joint walls). DilatanCY, however) may be inhibited by the
normal stiffness of the fractures on which the shear displacement is taking
place. This is likely to reduce the amount of shear displacement and hence
the expected load-settlement curve for the rock mass is more likely to be
concave than linear. Load deformation curves obtained from the triaxial tests
on hexagonal columns (with their long axes horizontal) reported by Brown
58

(1970) show linear stress-strain curves only at high confining pressures. When
unconfined the load deformation curves where distinctly concave. Since
deformation was measured externally in these tests this behaviour may be
associated with bedding at the platens. However since the concave curvature
dominates the stress-strain behaviour up to failure it seems unlikely that
bedding during the initial stages of the tests is masking much of the rock
mass behaviour.
In case C (Fig. 2.2/7c) the discontinuities are all inclined relative to the
direction of the applied load such that the dominant deformation mechanism
is one of shear displacement. Barton (1986) suggests that a convex load
deformation curve will be associated with such a geometry since the shear
stress-displacement curves for individual joints are typically convex. Convex
load-deformation curves were observed by Brown and Trollope (1970)
Chappell (1979) and Yoshinaka and Yamabe (1986) in model tests with
blocks in this configuration. Normal closure will however, still play an
important role in the deformation of this rock mass since the dilatancy
generally associated with the shear displacement will be controlled by the
normal stiffness of the inclined joints which in tum influences the shear
stiffness of these fractures.
Confining Pressure
Laboratory-scale model tests have shown that the stress-strain behaviour of
fractured rock masses is dependent upon confining pressure (Brown, 1970,
Brown and Trollope (1970) and Yoshinaka and Yamabe, 1986). The
application of high isotropic confining pressures is likely to bring the blocks
in the model closer together thus increasing the degree of contact across
joints. This would clearly result in the stiffness of the rock mass increasing.
High confining pressures however, are not relevant to the load deformation
behaviour of a rock mass subjected to foundation loading near the surface.
59

Confining stress is likely to influence the shear stiffness of discontinuities
more than it does the normal stiffness since increasing confining stress will
inhibit dilatancy. It is unlikely that confining stress will have a significant
influence on the load-settlement behaviour of near surface weathered chalk,
particularly in cases where the sub-vertical discontinuities are open.
Number of Discontinuity Sets
Discontinuities normally occur in sub-parallel sets which are controlled by
tectonism, cooling and stress relief. The number of sets present within a rock
mass will influence the dominant mode of deformation and the average
block size and shape. The smaller the average block size the greater the mass
compressibility.
Discontinuity Spacing relative to the size oj the loaded area
In general the dimensions of a loaded area will control the volume of rock
which experiences an increase in stress. The geometry of the discontinuities
within the rock mass will have a strong influence on the distribution of
stresses associated with the load applied by a foundation which complicates
this model. However if the dimensions of the foundation are less than the
average discontinuity spacing the discontinuities will have little effect on the
load-settlement behaviour. This is rarely the case for weathered near surface
rocks. In most cases the discontinuity spacing is much less than the
dimensions of the foundation and hence the stiffness of these fractures will
dominate the load-settlement behaviour. The rock mass compressibility will
therefore be sensitive to the number of discontinuities that occur within the
zone of influence of the loaded area.
The influence of discontinuity spacing upon mass compressibility may be
explored mathematically by considering the rock mass as a composite
material made up of joints and intact rock. The modulus values for joints
and intact rock may be considered as lower and upper bounds respectively for
60

the resultant composite (the rock mass) when considering the criteria of
either equilibrium or compatibility (Voigt, 1928, Reuss, 1929). When
determining the upper and lower bound moduli for a composite material a
simplistic yet correct model can be employed. If the joint modulus Ej is much
smaller in magnitude than the intact modulus E and the joints are orientated
perpendicular to the direction of the applied load (Fig. 2.2/9a) then it is the
modulus of the joints which control the deformation of the rock mass and this
rise to a lower bound value of mass modulus. If however the joints are
parallel to the direction of the applied load (Fig.2.2/9b) it is the intact
modulus which tends to control the deformation rock mass and gives an
upper bound mass modulus. If the joint set is inclined to the direction of the
applied load (Fig. 2.2/9c) the mass modulus is a combination of the upper
and lower bound moduli and in the shear modulus of the joint set must be
considered. A comprehensive description of the shear modulus effect is given
by Chappell (1979).
The lower and upper bound moduli for a rock mass of the type shown in Fig.
2.5/16a may be defined by :
(i) Averaging the elastic moduli which is equivalent to assuming a
uniform strain on the boundary of each region, that is satisfying
compatibility (Voigt 1928).
where:
Em = Lower bound modulus
By = Intact modulus
Ej = joint modulus
VI = relative volume of intact material
V. = relative volume of joint material J
61

(ii) Averaging the compliancies which corresponds to the
assumption of uniform stress on the region boundaries (Reuss
1929).
where:
BuM = Upper bound modulus
The effect of discontinuity spacing on the mass modulus may be depicted
using equation (3) to determine a lower bound modulus of a varying number
of joints with different ratios of joint to intact material moduli. The case with
the joints open to 1.0mm, aligned perpendicular to the direction of the
applied load is shown in Fig. 2.2/9a. This represents the geometry often
found in chalk. It will be seen from Fig. 2.2/10 that as the modulus of the
joint approaches that of the intact material (ie E/EI = 0.5 in Fig. 2.2/10) the
number of joints has little effect on the ratio of mass modulus to intact
modulus. The implication is that for the softer type of materials such as soils
the joint system does not cause an appreciable difference between the mass
modulus and intact modulus. The most significant feature of this model
however is the extremely rapid drop in Ern/E! with the introduction of only a
few (1 to 8) fractures per metre when the ratio of E/E! is less than 0.005.
When the fracture frequency exceeds about 10 per metre the mass modulus
becomes relatively insensitive to increasing numbers of joints.
The relationships shown in Fig. 2.2/10 assume a constant joint aperture of
1mm. If the ratio E/EI is kept constant and the aperture allowed to vary the
set of curves shown in Fig. 2.2/11 results. The greater the aperture the
greater the mass compressibility. Wakeling (1975) carried out some
laboratory compression tests on cylinders of chalk stacked end on end to
simulate jointing. The results of these tests shown in Fig. 2.2/12 exhibit a
similar trend to that predicted by the model. Since the ends of each cylinder
were smooth the aperture was probably less than O.5mm. The values of rock
mass factor j are much lower than those shown in Fig. 2.2/11 for the same
62

joint frequency. This suggests that the ratio E/E. for this chalk was much less
than 0.005.
This model assumes that the aperture is of constant width for each joint. This
is rarely the case in practice. Bandis et al (1983) suggest that partial contact
between blocks would account for a low mass modulus of apparently rigid
blocks, since the stresses between the blocks would be transmitted by
asperities of contact which vary in size, shape and height. Pursuing this line of
reasoning Hobbs (1975) derived a simple ideal model in which uniform
contacts are regarded as miniature plate loading tests. The rock mass factor j
which is equivalent to Em/EJ is obtained from the expression given by:-
Where:-
j = Rock mass factor
ff = Fracture frequency
b = Dia. of asperities
Na = Number of asperities per unit area
v = Poisson's ratio
The contact area ratio ~ (ie contact area per unit area of joint wall) is given
by:-
1tb2N A. = a * 100%
J 4
Figure 2.2/13 shows the relationship between rock mass factor j and fracture
frequency for different contact area ratios ranging from 5 to 36.5%. It will be
seen that the curves are a similar shape to those derived from the above
model and that as the contact area ratio increases the curves become flatter
and less sensitive to fracture frequency. However, as one might expect from a
model based on contact, Hobb's model is sensitive to the relative magnitudes
of Na and b. For a given contact area ratio, Poisson's ratio and fracture
63

frequency, the Rock Mass Factor j increases with an increasing number of
asperities per unit area (see Fig. 2.2/14). This implies that as the asperity
contact area reduces the rock mass compressibility is reduced. Another
feature of Hobb's simple model is that it becomes ill-conditioned for contact
area ratios greater than 36.5% and yield rock mass factors greater than unity
implying that the fractures cause the fractured rock mass to be less
compressible than the intact rock.
The discontinuity pattern in chalk outside the areas affected by intense
tectonic activity is generally dominated by sub-vertical and sub-horizontal
fractures and hence the simplistic models discussed above may be applied to
the chalk mass. The rock mass factor j is plotted against joint frequency in
Fig. 2.2/15 for four Chalk sites. All are based on large diameter plate tests
with the exception of the Killingholm site where the pressuremeter was used.
The results exhibit a similar trend to that predicted by the models discussed
above indicating the importance of joint frequency, aperture and asperities in
controlling the mass compressibility. Ward et aI. (1968) recognised the
importance of joint frequency and aperture in the development of an
engineering grade classification (Table 2.3/5) for predicting the mass
compressibility of Chalk at Mundford. This classification system is discussed
later.
These simple models relating joint frequency to mass modulus assume that
the ratio E/EI remains constant for the system of joints under consideration.
However the tests on individual fractures (Goodman, 1976 and Bandis et aI.
1983) have shown that Ej is highly stress dependant. In reality the stiffness of
the joints beneath a loaded area is likely to change with depth as a result of
the distribution of applied stresses. This will clearly modify the relationships
discussed above. A load applied over a large area will influence a larger
volume of rock than the a load of similar magnitude applied over a smaller
area. In the latter case only few discontinuities may be present within the
zone of influence of the applied loading whereas in the former case there is
scope for many more fractures to be present which clearly would give rise to
64

different mass compressibility characteristics. Therefore it is not simply the
fracture spacing that affects the mass compressibility but the spacing in
relation to the size of the loaded area. The situation is further complicated by
the fact that the orientation, persistence and aperture of the joints will have a
strong influence on the distribution of stresses within the rock mass
associated with an applied load.
Stress-strain Characteristics of the Intact Rock
The stress-strain characteristics of the intact rock can be expected to have a
fundamental role to play in the compressibility of a rock mass even when it is
cut by joints. The normal stiffness of a joint is influenced by the stress-strain
properties of the rock forming the joint walls. A joint with a given surface
roughness and degree of contact in a stiff rock will be more stiff than the
same joint in a more compressible rock. In chalk the stiffness of the intact
rock is related to porosity. The porosity of chalk can vary over a relatively
wide range, hence the intact stiffness will also vary (see section 2.1). This
leads to the hypothesis that the compressibility of high porosity chalk in the
mass is greater than that of a rock mass comprising low porosity chalk. In
reality the situation is complicated by the fact that the porosity of the intact r
chalk is likely to influence the nature of the fractures developed in terms of
frequency, persistence, aperture and surface topography. The interaction of
these factors could give rise to the case where the compressibility of the low
porosity chalk is greater than that of a high porosity chalk.
When a porous rock such as chalk is subject to unconfined compression it
will fail at a given stress leveL If, however, the rock is confined it will not fail,
but a point will be reached when the skeleton of bonded particles collapses.
The stress at which collapse occurs will be dependant upon the bond strength
and to some extent the porosity (see section 2.1). At the points of contact
across a joint, high stresses can be generated even at relatively low applied
foundation loads. These contact stresses may be sufficiently high to cause
either failure or pore structure collapse of the asperities in contact with each
65

other. This is likely to bring about a change in the gradient of the load
deformation curve for the rock mass. However the situation is complicated by
the scale of the surface roughness of the joints. When the collapse of the
asperities occurs the associated deformation will bring more asperities into
contact or simply increase the area of contact across the initial asperities. As
discussed earlier this is a function of whether the joint is mated or not. The
result may possibly be progressive collapse of the pore structure at points of
contact giving rise to a gradual change in gradient of the load-deformation
curve for the rock mass.
STRESS DISTRmUTIONS IN FRACTURED ROCK
In the case of persistent horizontal and inpersistent vertical joints the stress
bulb associated with an foundation loading will be elongated vertically in
comparison with that in an elastic continuum (Fig. 2.2/16b) due to the stress
transfer across the horizontal joints together with some lateral flaring due to
the inpersistent nature of the vertical joints causing load shedding. The
general shape of the stress distribution in this joint system has been derived
from model tests (Gazievand Erlikham, 1971 and Knox and Mok, 1985).
Where the vertical joints are persistent the rock mass will act like a series of
discrete columns and hence the stress bulb is likely to be even narrower and
extend to greater depths than in the case discussed above. The general shape
of this stress bulb has been investigated using model tests (Gaziev and
Erlikham, 1971) and is shown in Fig.2.2/27d. The degree to which the bulb
extends outside the loaded area depends upon the aperture of the vertical
joints and the stress level. If the vertical joints are tight there will be load
shedding across the vertical joints and the bulb may extend outside the
loaded area by an amount approaching that for the elastic continuum (Fig.
2.2/16a). If the joints are open with little contact across them it is likely that
the bulb will remain within the loaded area. However the vertical columns
may deform laterally with increasing stress level and local yield such that load
66

shedding across the vertical joints is then possible. It is therefore likely that
the shape of the stress bulb will change as the foundation load increases.
If the joints are inclined the stress bulb beneath the loaded area will become
distorted and asymmetrical. The stress bulbs derived from model tests and
mathematical models for different joint orientations are shown in Fig.
2.2/16c.
The model tests on jointed rock masses all show that the stress distribution
beneath the loaded area is significantly different to that based on an elastic
continuum. In a real rock mass such as the chalk the situation is further
complicated by the fact the style of jointing (orientation, persistence and
aperture) often changes with depth. It is arguable therefore whether the
stress at a given point below a loaded area can be predicted with any
accuracy.
Load-Deformation Behaviour of Fractured Chalk
On the basis of the forgoing discussion a concave load-deformation
relationship for chalk dominated by sub-horizontal bedding discontinuities
and sub-vertical joints. However, the pressure-settlement curves for plate
loading tests on weathered near surface chalk were generally convex (Lake
and Simons, 1975, Hodges, 1976, Marsland and Powell, 1981 and Powell et al.
1990). The characteristic shape of the pressure-settlement curve led Burland
and Lord (1970) to idealise it as a bi-linear curve (Fig. 2.2/17). This
idealisation permits the pressure-settlement behaviour of the rock mass to be
described using five parameters:
E j - initial modulus
Ey - post-yield modulus
qe - yield bearing pressure (based on the onset of yield)
qy - yield bearing pressure (based on the establishment of Ey)
67

Burland and Lord suggested that the change in gradient of the pressure
settlement curve is associated with yielding. This is based on the results of
865mm diameter plate loading tests at Mundford, Norfolk which displayed
little irrecovable deformation in unload-reload cycles prior to the change in
gradient and significant irrecoverable deformation after the change in
gradient. Little is understood concerning the mechanism by which the chalk
yields. Lord (1990) suggests that this yield is associated with slip and possibly
breakage between blocks of intact chalk.
Behaviour of Foundations on Chalk
The behaviour of foundations on chalk may be studied from case records
relating to full scale structures which have been monitored. The results of
plate loading tests may also be included were the plate diameter is greater
than 1m, since the scale is approaching that of a full scale foundation. The
literature, however, reveals a very limited number of case records of full scale
foundations or large diameter plate loading tests. A summary of these case
records is given in Table 2.2/2.
Of the 6 case records outlined in Table 2.2/2 it will be seen that the
majority are for foundations on structured chalk. There is only one published
record of a full-scale foundation loading the chalk beyond the yield bearing
pressure qe and only one case where long term settlement observations have
been made in order to study time-dependent deformation. The case records
presented here a diverse in terms of the rock mass conditions, the
instrumentation employed, the assumptions made concerning contact stresses
and stress distribution with depth, the control over rate of loading and
unloading and the duration over which observations were made. As a result it
is impossible with such a limited database to identify patterns of behaviour
that would significantly improve our current level of understanding
concerning the mass compressibility of chalk.
68

Table 2.2/2 Summary of published case records of the behaviour of foundations on chalk..
Location Details Source
Mundford, Norfolk 18.3m diameter full scale tank Ward, Burland & Gallios test. (1968).
Grade IV 1m chalk, Pd = 1.55 Mg/m3
Bury St Edmunds, Suffolk 22.85m diameter rafts for silos. Kee (1974), Burland & Grade IV 1111 chalk P g = 1.35 to Davidson (1976) and
1.45 Mg/m Burland & Bayliss (1990)
Basingstoke, Hampshire 1.98m and 3.35m square footings. Lake & Simons (1975) Grade m chalk, P d = 1.34 to
1.43 Mg/m3
Reading, Berkshire 16.5m and 14.5m square rafts. Burland, Kee and Burford Grade V IV! chalk, inferred from (1975)
SPT tests.
Salisbury, Wiltshire 1.55m Dia. footing loading test. Burland, Hancock & May Grade V! chalk. (1983)
Luton, Bedfordshire 3 * l.5m slab and 1.7lm Powell, Marsland, Longworth diameter pad loading tests. & Butcher (1990)
Grade III chalk.
The case records are presented below in the same order as they are shown in
Table 2.2/2. This order reflects the contribution made to the state-of-the-art
as well as the different rock mass conditions. In all the case records the rock
mass has been classified using the engineering grade classification developed
for the chalk at Mundford, Norfolk by Ward et aI. (1968). This classification
scheme is discussed later and the definitions of the grades are given in Table
2.3/5.
69

22.85m DIAMETER RAFfS FOR SILOS AT BURY ST EDMUNDS , SUFFOLK
Burland and Davidson (1976) describe a study of the settlement of some silos
on Upper Chalk at Bury St Edmunds, Suffolk. Kee (1974) and Burland and
Bayliss (1990) present a more detailed study of the settlement of each silo.
The silo complex comprises four cylindrical silos of 12000 tonne capacity
arranged in line with an elevator tower at one end (see Fig. 2.2/18). The
dead weight of each silo is approximately 4100 tonnes.
Each silo has an internal and external diameter of 20.12m and 20.57m
respectively and is supported on a raft foundation 22.86m in diameter and
1.22m thick bearing directly on the underlying chalk. The silos are spaced at
22.81 m centres and the rafts are separated by joints into independent units.
The rafts, which are reinforced, are 1.22m in thickness. Internally each silo
has a floor supported at a height of 2.54m above the base on short concrete
columns. The floor is independent of the silo wall. The layout of the silo
complex is shown in Fig. 2.2/18.
The geology of the site consists of glacial material up to about 4m thick,
overlying Upper Chalk to great depth. The chalk in this area is sub
horizontal. The chalk at this site has been inspected in the walls of 965mm
diameter shafts which were augured to depths of 15m and 19m at locations
shown in Fig. 2.2/18. The porosity of intact chalk samples taken from a
borehole a few metres west of the silos was found to be between 45% and
49% to a depth of 26m. Below this depth the porosity steadily reduces to a
value of 39% at 29.5m (Burland and Bayliss, 1990). Such high intact
porosities directly below the silos will give rise to low values of intact stiffness
(see section 2.1) which is likely to influence the compressibility of the rock
mass at this site. Burland and Bayliss (1990) noted from the observations in
the shafts that the bedding planes in the chalk often displayed separation with
pillar-like supports suggesting that there is limited contact across these
discontinuities. A low contact area across the sub-horizontal discontinuities
70

combined with a chalk of relatively low intact stiffness is likely to give rise to
any relatively low normal stiffness for the bedding planes.
The chalk in the shafts was classified using the Mundford grading system
(Ward et al. 1968 see Table 2.3/5 for definitions). Above about 5m (below
ground level) the chalk on the west side of the silos is highly weathered and
is described by Burland and Bayliss (1990) as Grade VI to V whereas to the
east the chalk is of better quality being described as Grade V to IV. Below
5m depth the chalk is of Grade IV and occasionally Grade III in all the
shafts. The base of each raft was located at a depth about 1m below ground
level (Kee, 1974) in structureless chalk ( Grade V /VI, see Fig. 2.2/19).
Structured chalk (Grade IV or ill/IV) occurred about 1m below the
underside of each raft (Fig. 2.2/19).
During November 1973 silo 1 was filled with approximately 10000 tonnes of
sugar (giving 344 kPa bearing pressure) with silo 2 virtually empty. As a
result silo 1 began to tilt towards the south west (Kee, 1974). The settlements
measured in the interior of the silos were about 19mm at the extreme eastern
edge, 47mm at the centre and 87mm at the western edge. It will be seen that
these settlements reflect the change in quality of the chalk from west to east.
The observation shafts were sunk after this event and the visual examination
of the chalk in the shaft walls revealed frequent shattering in the immediate
vicinity of the separation planes usually up to a thickness of 80 - 100 mm
(Burland and Bayliss, 1990). This is clear evidence of crushing and collapse
of the asperities of contact associated with sub-horizontal bedding plane
discontinuities.
Settlement observations of the base of each silo were made using a precise
optical level, BRS settlement bolts, and an invar staff. Vertical deflexion
measurements were made at various depths (up to 30m) beneath the centre
of each silo using circular magnet extensometers inserted in 150mm diameter
boreholes.
71

Each silo was filled to a capacity of between 10000 and 12000 tonnes giving
bearing pressures (including that imposed by the dead weight of the
structure) of between 340 and 400 kPa. Fig. 2.2/20 shows the load-settlement
behaviour of each of the silos on first loading. It will be seen that all the
load-settlement curves are convex, showing the yielding behaviour commonly
observed in results of plate loading tests on the chalk. The measurements on
these silos appear to be the first documented case history of a large-scale
foundation for which yield has been observed. The parameters derived from
measurements of the raft settlements are given in Table 2.2/3.
Table 2:1./3 Parameters derived from average surface settlement
measurement~ (aile Kee, 1974)
Silo
1 2 3 4
Initial modulus
E· 1
(MPa)
785 830 830 800
Post yield modulus
E (MFa)
25 37 52 50
Yield bearing pressure
'Ie (kPa)
225 225 200 200
Yield bearing pressure q (~a)
280 330 270 280
Fig. 2.2/21 shows a typical settlement profile for the base of each silo at
various stages of loading. For sugar loads that up to 5000 tonnes the
settlement profile is typically dish shaped indicating( ignoring the differential
settlement the foundation was behaving in a flexible manner. This loading
intensity lies within the pre-yield portion of the sugar-load-settlement curves
for each silo (Fig. 2.2/20). Within this loading intensity, the settlement of a
silo influences the adjacent one in a similar manner to that predicted using
elastic theory (Boussinesq). However when the sugar-load is greater than
5000 tonnes the settlement profile becomes convex (Fig. 2.2/21) and the silos
appear to act independently (Kee, 1974). This corresponds to the yield and
post yield portions of the sugar-load-settlement curves shown in Fig. 2.2/20. It
was this doming of the foundations that caused the columns supporting the
floor of silos to crack. The change in the deflected shape of the foundations
72

suggests that during the intial stages of loading the sugar within the silos was
applying a uniform stress to the silo floor which gave rise to a relative ley
uniform contact stress. At some point during the loading of each silo the
mass of sugar bagan to arch and cause the live load to be transmitted through
the silo wall. Thus as the load in each silo was increased the maximum
settlement moved from the centre to the edge of each slab.
The relationships between vertical deflexion and depth beneath the centre of
silo No.3 for various average foundation pressures are shown in Fig. 2.2/22.
It will be seen that the greatest settlement occurs at the ground surface and
diminishes with depth. Burland and Bayliss (1990) have used the magnet
extensometer measurements to determine the stress-strain relationships for
elements of the rock mass at various depths below the centre of each silos.
These relationships are shown in Fig. 2.2/23 for silo No.3. It will be seen
that these stress-strain curves all exhibit convex curves. For elements below
Sm depth the gradients of the post yield portion of each curve are generally
similar and steeper than those for elements at depths above Sm. Below Sm
depth a general improvement in the quality of the rock mass was observed in
the shaft wall. Intuitively the stiffness of this chalk should be greater than the
more weathered material above Sm. However the indications from the stress
strain curves shown in Fig. 2.2/23 suggest the reverse. Another surprising
aspect of the relationships shown in Fig. 2.2/23 is the apparent reduction in
yield stress with increasing depth of elements. Of course these stress-strain
plots use the average foundation pressure at the ground surface for the stress
and not the stress at the depths at which the strain determinations were
made.
The stress distribution with depth below the silos is complicated by the ring
loads from the silo walls which tend to dominate the settlement behaviour
after the onset of yield. Fig.2.2/24 shows a comparison between vertical stress
distributions predicted using' Boussinesq and finite elements based on linear
elasticity for silo 2 (Nicoletto, 1979). The soil structure interaction analysis
shows that along the centre line the vertical stress initially increases with
73

depth before starting to decrease at about 12m below foundation level. This
is due to the presence of stress concentration bulbs below the edge of the raft
(see Fig. 2.2/25). These bulbs coalesce at depth such that there is little
difference between the stress distribution predicted by Boussinesq and that
determined from finite elements. This is clearly shown in Figs. 2.2/24 & 25. It
is likely that it is the stress distribution and not the rock mass that is causing
the anomalies in Fig. 2.2/23.
Burland and Bayliss (1990) determine a yield locus for the chalk beneath
silos 3 and 4. To determine the horizontal and vertical stress changes
associated with the foundation loading Burland and Bayliss assumed that the
rock mass was homogeneous and used elastic theory for a rigid circular load.
Clearly this approach is likely to yield erroneous results due to the stress
concentrations discussed above.
Only a few periods of clearly established creep settlements have been
identified (Burland and Bayliss, 1990). In 1976 the load in silo 2 was held
constant for 7 months. During this period the silo settled at a constant rate of
O.4mm per month. Other measurements over shorter time periods gave
similar rates of settlement.
It is likely that the yielding behaviour observed in the chalk beneath each silo
was probably caused by the contact stresses developed at the edge of the rafts
which was much greater than the contact stress based on the known load and
the area of the raft. Hence the reliability of this case record is brought into
question particularly with respect to the post-yield load-settlement behaviour.
The values of post-yield stiffness given by Kee (1974) are likely to be greater
than the true values since they are based on a uniform contact stress
distribution.
74

18.3m DIAMETER TANK LOADING TEST AT MUNDFORD , NORFOLK
The most comprehensive case record of foundation behaviour on chalk is the
Mundford tank loading test. As part of a detailed site investigation for a large
proton accelerator the Building Research Station carried out a loading test
using an 18.3m diameter water filled tank at Mundford, Norfolk. Details of
this test are given by Ward et al. (1968).
The location of the tank test was chosen to be most representative of the
rock mass conditions at the Mundford site. A log of the geology to a depth of
30m below ground level is included in Fig. 2.2/30 with the details of the tank
location and location of the instruments. The tank was 18.3m high and of the
same diameter and was founded 1. 7m below the ground surface on
structureless chalk (Grade V, Ward et al. 1968)
Measurements of vertical deflexions at various depths under and adjacent to
the tank were made using instruments in a series of 0.9m diameter shafts
together with ground surface de flexion measurements made using a number
of precise water level gauges (see Fig. 2.2/26). Details of the instrumentation
are described by Ward et al. (1968). Settlement measurements of the tank
were made by precise optical level observations.
The programme followed in carrying out the full-scale tank test included a
short-term cycle of loading followed by long-term maintained load test. The
short-term test included a loading stage lasting 37 hours followed by a period
of 4.5 days whilst the load was maintained followed by an unloading stage
lasting 23 hours. The average bearing pressure (imposed by the tank) when
the tank was full of water was 180 kPa. This represents the average contact
stress assuming the base of the tank is flexible. It must be pointed out that
the stress distribution beneath the tank is controlled by the discontinuity
75

pattern and hence the vertical stress at a given depth cannot be predicted
accurately using models based on an elastic continuum.
The vertical deflexions at various depths in shafts S 1 to S4 on completion of
the first filling of the tank are shown in Fig. 2.2/27. It will be seen from this
figure that maximum deflexions were measured beneath the centre of the
tank (1.19mm at level 1 to O.15mm at level 6), with significantly smaller
settlements being measured at the edge of the tank (O.26mm at level 1 to
O.05mm at level 6). The settlements at all the other points outside the tank
were smaller than the accuracy of the water level gauges (ie < O.lmm). A
shortening between levels 1 and 6 measured in shafts S3 and S5 was O.03mm
was indicative of the fact that very small deflexions had occurred outside the
loaded area. The deflected shape of the ground surface is shown in Fig.
2.2/27 where it is compared with that predicted from simple elastic theory. It
is evident that the observed deflexions are localised around the loaded area
far more than the simple elastic model suggests. Ward et al. (1968) suggest
that this behaviour is consistent with theoretical predictions by Gibson (1967)
for an elastic material whose stiffness increases with depth. However it is also
consistent with the stress distribution shown in Figs. 2.2/16b for a rock mass
dominated by horizontal and vertical discontinuities. Since the discontinuity
frequency is shown to decrease with depth at Mundford it does not seem
unreasonable to assume that the stiffness of the rock mass increases with
depth. The observed ground surface profile however, is likely to be a result of
the combined effect of increasing stiffness with depth and the pattern.
The relationships between bearing pressure (imposed by the tank) and
vertical deflexions at various depths below the centre and edge of the tank
are shown in Fig. 2.2/28. It will be seen that the curves are slightly convex,
and that above a bearing pressure of approximately 39kPa they become
linear. The yielding behaviour commonly seen in plate loading tests on chalk
is absent here since the maximum bearing pressure imposed by the tank
(180kPa) was too small to cause the chalk to undergo yield. The chalk
beneath the tank did however, exhibit some creep during the period when the
76

load was maintained. This can be seen in Fig. 2.2/29 where the strains
observed beneath the centre of the tank are plotted against time. It will be
seen that the creep is not significant at depths below the centre of the tank
greater than 7m. No creep was observed outside the tank. During unloading
the strains that occurred between 11m and 29m below the tank were fully
recovered whilst those between 4m and 7m were not. Table 2.2/4 shows the
percentages of the immediate strains recovered on unloading (creep effects
apart). Ward et al. (1968) suggest that for all practical purposes the
immediate deformation in all but the structureless grade V are all fully
recoverable.
Table 2.2/4 Percentage of immediate strains recovered on unloading and
values of Young's Modulus (after Ward et al. 1968)
Level (below tank)
(m)
0.00 to 3.81 3.81 to 7.32 7.32 to 10.93
10.93 to 14.59 14.59 to 22.57 22.57 to 28.97
% recoverable strain
(immediate)
75.0 97.3 99.7
100.0 100.0 100.0
Young's Modulus (MPa)
1st loading 2nd loading
363 451 1658 1560 1628 1619 2178 2070 4287 3944 4611 4277
Grade of
chalk
V IV - III
III III - II
II IT
In Table 2.2/4 values 'of Young's modulus for the first and second loading at
various depths have been listed. These values have been estimated from the
immediate vertical strains measured beneath the centre of the tank. However
the stress distribution beneath the tank was determined using simple isotropic
elastic theory. Since it is known that the stress distribution a discontinuous
rock mass cannot be accurately predicted using this simple model (Knox and
Mok, 1985) it is likely that the values of E given in Table 2.2/4 are in error.
The second stage of the tank loading test involved a long-term loading test to
investigate the time-deformation characteristics of the chalk. The time
deflexion relationships for level 1 relative to level 6 in each of the 5 shafts
77

(see Fig. 2.2/26) for the first 18 months after filling the tank are shown in
Fig. 2.2/30. It will be seen that most of the creep settlement occurs directly
beneath the tank with very little creep observed outside the tank. It should be
noted that the ground adjacent to the edge of the tank experienced a
negative creep. Ward et al. (1968) attribute this unusual behaviour to the fact
that the groundwater table rose approximately 3m over the period during
which these observations were made.
Fig. 2.2/31 shows the time-deflexion relationships for three levels beneath the
tank over a period of about 1 year. It will be seen that the majority of the
creep takes place in the top 7 metres (ie in grades IV and III chalk). The
grade III chalk between levels 2 and 3 showed a small amount of creep which
terminated within 120 days. The Grade IV chalk between levels 1 and 2
showed significant creep which was by no means complete after 1 year. This
result seems to be the only well documented case of creep on chalk and it is
unfortunate that the test had to be terminated after only one year.
On the basis on the Mundford tank test Burland (1975) suggests that the
ratios between long-term and short-term moduli for Grades V, IV, and ill
are 0.2, 0.3, and 0.5 respectively.
3m * 1.5m SLAB AND 1.71m DIAMETER PAD LOADING TESTS AT
LUTON, BEDFORDSHIRE
As part of the investigations for bridge works in the Luton area, large scale
in-situ loading tests were carried out by BRE. The results of these tests are
reported by Powell et al. (1990). The regional dip of the chalk in this area is
0.50 to the south-east. However Sylvester-Bradley and Ford (1968) report
some gentle folding and minor faulting of the chalk in Luton area. Despite
these minor structural features it reasonable to expect sub-horizontal and
sub-vertical discontinuities to dominate the rock mass.
78

A loading test was made on a 3m long and 1.5m wide reinforced concrete
slab constructed in an excavation with an invert level 4m below ground level
in Grade III/IV chalk. The load was applied using the 500 tonne frame
described in Chapter 4 up to the full capacity giving a maximum bearing
pressure of 1100kPa.
The chalk below the level of the slab test comprises blocky chalk with sub
horizontal joint spacing 30-100mm and apertures of 0-3mm. At a depth of 3m
below the slab test the discontinuities become generally tight and more
widely spaced (Grade II chalk). This improvement in the quality of the chalk
is reflected in the SPT N values and ultimate bearing pressures measured at
various depths (see Fig. 2.2/32).
The pressure-settlement behaviour displayed by the slab loading test is shown
in Fig. 2.2/33. It will be seen from this figure that the chalk showed no clear
signs of yielding up to the maximum applied bearing pressure of 1100kPa.
The loading sequence employed involved a number of unload-reload loops. It
will be seen from Fig. 2.2/33 that the gradient of the pressure settlement
curve for each loading stage becomes less steep during the first two cycles
indicating a decrease in compressibi1jty with increasing bearing pressure. The
pressure-settlement relationship for the first loading stage is concave. This
type of pressure-settlement behaviour is commonly seen in stronger rock
types where normal closure of discontinuities is the dominant deformation
mechanism (see section 2.5). However this is the first documented loading
test where this behaviour has been observed in the chalk. Fig. 2.2/34 shows
the pressure-settlement relationship for the slab test with the creep
settlements removed. It will be seen that the pressure-settlement curve is
concave up to a bearing pressure of 550kPa. At bearing pressures between
550kPa and 800kPa the relationship is more or less linear and above 800kPa
the gradient increases slightly. This slight change in gradient at 800kPa
bearing pressure may indicate the onset of yield.
79

The concave pressure-settlement relationship may be associated with the fact
that the sub-horizontal discontinuities became tight within 3m of the base of
the slab. Such tight fractures are likely to have a significantly higher contact
area than those in more weathered chalk which may display apertures greater
than 3mm. However it may be argued that the initial concave part of the
pressure-settlement curve is associated with disturbance of the base of the
excavation for the slab, since machines were used to make the excavation.
At the end of each loading stage the load was maintained for a period of
time between 70 and 134 hours. Time-dependent settlements of between 0.5
and 2mm were observed during these periods. There does not appear to be
any correlation between the bearing pressure and the amount of time
dependent settlement. The irrecoverable deformations at the end of each
unl?ading stage are similar in magnitude to the deformation measured during
the periods whilst the load was maintained. This indicates that the immediate
deformations were largely recoverable.
Powell et al. 1990 describe a load test carried out on a 1710mm diameter pad
footing at 2.5m depth. The rock mass at this site is described in Fig. 2.2/35.
The pad bears directly on material classified as Grade m chalk. Powell et al.
noted that the Grade IV /m chalk at the location of this test had a more
open macrofabric than that observed by BRE at Mundford. The
topographical position of the site, in the bottom of the Lea valley, suggests
that this open macrofrabic may have resulted from the chalk being subjected
over a prolonged period to strong lateral flow of groundwater. Such
conditions would result in dissolution of material from the walls of
discontinuities and reduce the contact area across these fractures.
The pressure-settlement behaviour displayed by the pad loading test is shown
in Fig. 2.2/36. It will be seen from this figure that the chalk showed no clear
signs of yielding up to the maximum applied bearing pressure of 600kPa. This
is better seen in Fig. 2.2/37 in which only the loading stage of each unload
reload cycle have been shown and the settlements associated with the periods
80

of maintained load have been removed. The pressure-settlement relationship
shown in Fig. 2.2/37 is more or less linear unlike the concave relationship
observed for the slab test discussed above. Both tests were performed in
Grade III chalk. However it cannot be argued that the open macrofabric is
responsible for the difference in shape of these pressure-settlement
relationships, since the location of the slab test the chalk was observed to
improve to Grade II within 3m of the base of the slab, whereas the quality of
the chalk was only subject to visual inspection to a depth of 1.5m below the
pad. The difference in the shape of the two curves may be attributed to the
fact that the test level for the pad was carefully prepared by hand. Hence
disturbance to the underlying chalk was minimised.
1.98m AND 3.35m SQUARE FOOTINGS AT BASINGSTOKE,
HAMPSHIRE
Lake and Simons (1975) made settlement observations on a four-storey
reinforced concrete framed structure supported on spread foundations in
chalk in Basingstoke, Hampshire. The chalk at this site is described as being
weak to very weak (ac = 0.4 to 1.0 MPa). At shallow depths the discontinuity
spacing was between 50 and 100mm. Below 2 to 3m depth the spacing
increased up to 200mm and the fractures were generally tight. The bedding at
this site is described as horizontal, suggesting that this area has not been
subjected to intense tectonic activity. It is therefore reasonable to assume that
sub-vertical and sub-horizontal discontinuities dominate the rock mass. It is
not clear from the description of the rock mass given in the paper whether
discontinuity spacings relate to sub-horizontal or sub-vertical discontinuities.
However given that most of the data collected was from boreholes it is likely
that the descriptions relate to sub-horizontal discontinuities.
A simplified foundation plan for the structure is shown in Fig. 2.2/38.
Observations of settlements were continued for 36 weeks, commencing within
a few days of the stub-column shuttering being struck. Settlement
81

observations were made using a precise optical level on six internal columns
with bases 3.35 m square and four external columns with bases 1.98 m square.
The larger bases were located 1.5 m to 3.0 m below the ground floor slab
level and the smaller bases 1 m below this level. Most of the footings were
therefore placed in the chalk with the 200mm fracture spacing, which is
described as being Grade III to II on the basis of fracture spacing and SPT N
values. The design bearing pressure was 430 kPa and that due to the
structural loading was calculated to be 365 kPa, which is the value adopted
for determining the values of Young's modulus.
The measured settlement for the 3.35 m and 1.98 m square bases are shown
in Fig. 2.2/39. The average settlement at the end of the observation period
was 6.5 mm for the large bases and 4.0 mm for the small bases. About 50%
of the total average settlement was recorded within 6 weeks, before the first
floor slab had been cast. Very little settlement was observed after 10 weeks.
Lake and Simons suggest that a large proportion of the initial settlement was
due to the compression of loosened chalk which was disturbed during
excavation. The values of Young's modulus calculated on the basis of the
total average settlements after 36 weeks were 105 and 95 MPa for the 1.98 m
and 3.35 m bases respectively. These values are very low compared with that
derived from the Mundford tank test for Grade III and II chalk. The dry
density of the chalk at Basingstoke is lower than that at Mundford (see Table
2.2/2) indicating a higher porosity and hence a lower intact stiffness. The
plate loading tests carried out at this site showed the typical yielding
behaviour with yield stresses (qy) between 363 kPa for a 0.91m diameter plate
to 527 kPa for a O.3m diameter plate. There is clearly a trend of decreasing
yield stress with increasing plate diameter. The relationship between yield
stress and plate diameter for this site is not linear and at plate diameters
greater than 0.61m the yield stress in much less sensitive to increasing plate
diameters. On the basis of the plate tests it is likely that the yield stress
applicable to the bases is about 360 kPa. Since the structural loading placed
on these bases is considered to give rise to a bearing pressure of 365 kPa it is
likely that the chalk beneath the bases is undergoing yield. It may be argued
82

however that since the plate loading tests were carried out at a depth of 1.5
m the chalk was more closely fractured than at the depth of the foundations.
Hence the yield stress at the foundation level may be greater than that
determined from the plate loading tests. The initial modulus (Ej ) determined
from the 0.91m diameter plate was 443 MPa and the post yield modulus (Ey)
was 15 MPa. The modulus determined from the observed settlements at an
assumed bearing pressure of 365 kPa is intermediate between these two
values. It i~_!ikely that the disturbance caused during excavation together with
the onset of yield beneath the bases contributed to the low mass stiffness
values determined from the observed settlements.
16.5m AND 14.5m SQUARE RAFTS AT READING, BERKSHIRE
Burland et al. (1975) made settlement observations of a five-storey building
founded in soft weathered chalk at Reading, Berkshire during construction.
The building was of reinforced concrete frame construction with brick
cladding. The foundations comprised three discrete rafts with joints between
them. The rafts are 1m thick and were cast directly onto the surface of the
chalk. A plan of the raft foundation is shown in Fig. 2.2/40.
The site investigation was carried out by sinking three 150mm diameter
boreholes by means of a light cable percussion rig, and digging three trial
pits. The positions of the boreholes and trial pits are shown in Fig. 2.2/40. "It
was not possible to characterise the chalk by visual inspection at this site due
to depth of cover and the high water table. The chalk was therefore
characterised using the Standard Penetration Test (SPT) and the approximate
correlation between the Mundford grading and SPT 'N' value given by
Wakeling (1970). The ground conditions beneath the site are shown in Fig.
2.2/41. No dry density values are given by Burland et al. (1975) for the intact
chalk. This makes it difficult to make meaningful comparisons with
foundation behaviour observed at other sites. There are some similarities
with the ground conditions beneath the Mundford tank in that the chalk
beneath the raft is essentially structureless. However at the Reading site the
83

thickness of structureless chalk is much greater and the groundwater table is
much higher.
Settlement observations were made of a number of points on the raft (see
Fig. 2.2/41) using a precise optical level and an invar staff. The relationship
between settlement and time for some of the levelling stations in Block A is
shown in Fig. 2.2/42. The foundations of the building were constructed in
August 1972 and by May 1973 the building was substantially complete. Most
of the points show between O.5mm and O.lmm settlement at very low load.
This may be due to the bedding of the raft into chalk disturbed by
excavation. During the initial stages of construction the rate of settlement
with time is small and is considered to be elastic by Burland et al.. Towards
the end of construction the rate of settlement is significantly higher. It is not
clear whether this is a result of a reduction in stiffness as a result of yielding
or if it associated with the onset of creep.
Values of E based on the applied stress (57 kPa) and the average settlements
(corrected for settlement associated with bedding of raft) at the end of
construction for Blocks A and Bare 113 MPa and 164 MPa respectively. At
Mundford the value of E for the structureless chalk beneath the tank
immediately after loading was 360 MPa. Over a period of one year under a
maintained load creep settlements confined to the more weathered chalk
resulted in a reduction in stiffness. The ratios between long-term and short
term moduli for Grade V chalk is 0.2 for the Mundford tank test (Burland,
1975). Hence the long-term value of E for Grade V chalk at Mundford was
72 MPa. At Reading the major part of the loading was applied over a period
of about six months. Hence a significant reduction in stiffness with time may
be expected. The lack of agreement between the stiffness values determined
for Mundford and Reading may result from the different time periods
involved, the different groundwater levels and differences in intact
mechanical properties of the chalk at each site.
84

1.55m DIAMETER IN-SITU LOADING TEST AT SALISBURY,
WILTSHIRE
Burland et al. (1983) describe the results of a large in-situ loading test on
highly weathered chalk at Salisbury, Wiltshire. The test was carried out to
assess the load-settlement characteristics of the foundations for a cable
chamber which forms part of a telephone exchange. The telephone exchange
is a four-storey building of reinforced flat slab construction. Most of the
structure is founded on pad footings bearing on gravel. The cable chamber
runs along one edge of the building. The base of the cable chamber
comprises a reinforced concrete raft 9m wide and 47m long, bearing on
highly weathered structureless chalk some 6.6m below original ground level.
The gross bearing pressure imposed by the cable chamber was approximately
185kPa Excavation for the cable chamber took place within a cofferdam due
high ground water table which was about 2m below original ground level. The
chalk exposed in the base of the cofferdam was described as very soft,
consisting of small angular pieces of chalk in a silt like putty chalk matrix.
The nature of the chalk and the high water table made excavation difficult
without causing significant disturbance to the formation level. The degree of
disturbance and the general condition of the chalk below the excavation was
investigated using cone penetrometer tests. The poor quality of the chalk at
formation level made it necessary to carry out an in-situ loading test to assess
the load-settlement behaviour of the rock mass.
The geology of the site comprises 2 to 3m of medium dense gravel overlying
4 to 5m of soft structureless chalk, containing small lumps of intact chalk
(Grade VI chalk, see section 2.7/5 for definitions). This is underlain by chalk
which has been classified on the Mundford scale as Grade V at the top
improving to Grade III with depth on the basis of measured SPT 'N' values
(Wake ling, 1970).
Fig. 2.2/43 show a cross-section through the load test apparatus. The loading
test was carried out in a 2m square pit l.5m deep, excavated underwater in
85

the base of the larger cofferdam excavation. A loading column 1.55m in
diameter was constructed using thrust-bore rings. A concrete plug was
formed in the first ring and measures were taken to ensure adequate load
transfer between the ring and the plug. A 153mm dia. tube was cast into the
plug to permit measurements of the settlement of the footing and to allow
measurements to be made of ground movements below the footing. These
measurements were made using a 53mm dia. steel tube and a 25mm dia.
steel rod which were grouted into the chalk at a depths of 1.19m and 2.13m
below the base of the pit respectively (see Fig. 2.2/43). It should be noted
from Fig. 2.2/43 that the loading column was not constructed vertical.
The column was loaded using kentledge in 4 tonne increments up to a load
of 40 tonnes which was held for 24 hours. The load was then increased again
in an attempt to reach 60 tonnes. However sever tilting of the column caused
the test to be terminated at a load of 51 tonnes. During the test the 25mm
dia. steel rod became jammed and hence there were no measurements of
settlement at a depth of 2.13m below the footing.
The load-settlement relationship for the footing is shown in Fig. 2.2/44. The r
application of the first loading increment results in a slight heave of the
measuring point below the footing and only a small settlement of the footing
itself. The second loading increment results in a much greater settlement of
the footing together with the settlement of the sub-footing measurement
point. This behaviour is somewhat unusual, but it may have occurred as a
result of the loading column not being vertical. Lateral movements of the
loading column during the test are not reported by Burland et al. (1983). For
the loads between 8 and 36 tonnes the load-settlement curves are
approximately linear giving Young's modulus values of 4.4MPa and 5.5MPa
for the footing a the point 1.19m below the footing respectively (Poisson'S
ratio was assumed to be zero in the determination of these values (Burland
et al. 1983». A slight change in gradient occurs above 36 tonnes (191 kPa
bearing pressure). This may indicate the onset of yield. The large settlement
86

recorded when the load reached 51 tonnes is likely to be associated with
bearing capacity failure.
The values of Young's modulus derived from the loading test are very small
compared to those derived from full-scale foundations and loading tests at
other sites. It should be remembered that this loading test was carried out in
structureless Grade VI chalk, below the watertable in an excavation made
underwater. It is difficult to assess which of these factors will contribute most
to the observed load-settlement behaviour. Clearly the base of the pit must
have been disturbed during excavation underwater This alone would
contribute to a low modulus. However it is surprising that such disturbance
was not reflected in large settlements occurring during the first loading
increment. The nature of the material on which the loading tests was
performed was such that it is more likely to behave as a soil than a rock. The
modulus values obtained are certainly closer to those that would be expected
in a soil, rather than a rock.
The time dependent settlement observed under constant load during the
loading test was very small. Fig. 2.2/45 shows the time-settlement
observations on the cable chamber during and after the construction of the
telephone exchange. The most striking feature is that most of the settlement
took place during the construction of the raft and thereafter the settlements
were small and very uniform ranging from 3 to 5mm.
Normalised Load-Settlement Behaviour
The load settlement behaviour for chalk has been observed in both large
scale loading tests and full scale foundations. It is valuable to be able to
compare the observed behaviour of foundations and such tests. In order to
make such a comparison it is necessary to normalise the data to bring it to a
common base. Powell et al. (1990) suggest the application of a scaling factor
derived by equating the expressions used to determine the elastic modulus
from a rigid circular plate at a given depth below ground level and that for a
87

rectangular foundation at the surface. They point out that such a scaling
factor can be overestimated where the modulus increases uniformly with
depth from zero at the surface and in such cases only provides an upper
bound value. Lord (1990) extended this approach to make allowance for the
rigidity of the foundation. It is, however, unwise to include rigidity in the
scaling factor since there is uncertainty as to whether certain foundations are
to be treated as flexible or rigid. Implicit in both Powell et al. and Lord's
scaling factor is an equivalent plate at depth. It seems more reasonable to
consider as a basis for comparison a circular plate founded at the surface.
Furthermore if average stresses and average settlements are considered, the
error introduced by not making allowance for rigidity will be small. The
writer therefore proposes using an equivalent flexible circular plate founded
at the surface and using only average settlements as a basis for deriving a
scaling factor. The settlement of a foundation can therefore be related to the
settlement of an equivalent plate by means of the expression:
Where:
pr/Bc = S(pp/Dp)
Pc = settlement of foundation
Be = width of foundation
Pp = settlement of equivalent plate
Dp = diameter of equivalent plate
S = scaling factor
The appropriate scaling factors have been applied to the average observed
settlements in the above cases and the resulting load settlement behaviour is
shown in Fig. 2.2/46. Fig. 2.2/46b shows the load settlement behaviour up to
a settlement ratio of 0.4% and hence includes the post-yield behaviour. The
maximum settlement ratio used in Fig. 2.2/46a is 0.1%, allowing the initial
pre-yield behaviour to be examined in detail. Since there is only one
documented case where the chalk has been loaded beyond yield it is difficult
to draw many conclusions from Fig. 2.2/46b.
The typical range of initial modulus values is shown by the envelope in
Figure 2.2/46a (200 to 1000 MPa). Although this range appears large it
88

should be noted that generally pre-yield settlements are small with settlement
ratios less than 0.05 % at average applied foundation pressures up to 200 kPa.
Thus even for foundations 20m in diameter, on grade IV /m chalk,
settlements below this stress level will not exceed lOmm.
Plate Loading Tests on Chalk
Plate loading tests provide a high degree of similitude with the full-scale
foundation. As a result this form of in-situ test is useful for studying the mass
compressibilty behaviour of fractured rocks such as chalk. However the
rigidity and geometry of the plate are such that different elements of ground
are subjected to different stress paths resulting in problems extrapolating
from test-scale to full-scale. This is particularly relevant when the plate
diameter is small compared with the fracture spacing. In general the plate
diameter must be at least six times the average sub-horizontal discontinuity
spacing in chalk (Lake and Simons, 1975). For most near surface weathered
chalks a plate diameter of 865mm is suitable. The use of such a plate
diameter requires a large test rig together with large amounts of kentledge or
the use of tension piles, all of which makes this form of in-situ test
prohibitively expensive for routine investigations. However despite the
expense the literature reveals more results of plate loading tests on chalk
than observations of full-scale foundation behaviour. Table 2.2/5 summarises
the results of plate loading tests on chalk found in the literature.
It will be seen from Table 2.2/5 that in many cases the post-yield modulus Ey
was not established. In some cases this was due to the fact that the yield
stress was greater than the capacity of the plate testing equipment (eg Grade
II chalk at Mundford) or the test was not designed to determine this
parameter (eg constant rate of penetration (C.R.P.) tests at Welford, Theale
and Norwich).
The most comprehensive plate loading test data for the chalk was from tests
carried out at Mundford, Norfolk (Ward et al. 1968 and Burland and Lord,
89

I { y:> II nIl I!".} )1 Ji I{'-..,\ 2-.', c::.->L';VL>'-.J LJULJU c:::#
Site &
Source
Welford & 140 Theale (Lake & Simons (1970» • Initial loading Imm/min " Reloading 2 mm/min
Norwich (Butler & Lonl (1970»
(C.R.P.)
Loading at Imm1min
Bumg.toke 305 (Lake & Simons (1975»
Otterboume 152 (Hodges (1976»
Whitchurch 152 (Hodges (1976»
Brighton (Lonl & Davies (1979»
Purf\eet (Palmer (1966) & (1976»
Geulhemmer 400 N etherlanda 280 (Nienhui. & 180 Price (1990» 120 Secant moduli at 600 kPa
Mundford 865 (Warc!, Burland & Ga11io. (1968), Burland & Lord (1970»
Luton -Site C (powell et al (1990»
Luton -Site 0 (powell et al (1990»
P1ate Depth size (mm) (m)
12.1 (C.R.P.) 19.9
7.7 13.8 19.6 10.1
14.5 19.2
4.7
140 5.5 7.6 9.1
10.7 12.2 2.3 3.9 5.4 6.9 8.4
10.4 12.2
1.5 III 610 1.5 910 1.5
1.5 V 305 1.5 762 1.5
1.5 II 254 1.5 762 1.5
450aq Horr.
445 8.7
Horr. II II II II
80 50 30
3.4 V 3.2
6.0 IV 5.4 2.6 7.8
11.4 7.4 9.0
10.9 12.9 13.6 16.6 19.5 16.6 5.6 8.1
865 2.0 (C.R.P.) 2.0 4.0 III
4.0
865 2.0 (C.R.P.) 3.0 3.2 IVnIl
6.6 6.8
10.5 15.0
Grade Eo E,. CIa q. q,., 10%0
(MPa) (MPa) (kPa) (kPa) (MPa)
72'/1 OS' 9.3 34'/176' 4.3 9'/40" 2.6
25' 6.7 107' >16 83'm6' >16
86' 15.5 121'/402" >16
21'
57 2.9 9 1.6
23 1.7 22 1.4
20 2.1 9 1.8
45 1.3 26 1.2 33 1.9 49 18 2.2 19
690 24 350 475 >2.5 m 312 22 214 320 >1.0 III 443 19 214 290 >0.6
1.5 V 10 2 536 1.5 V 5 >0.4
1640 1.5 II 33 4 680 2.8 II 24 >0.5
II 2360 4950 II 3900 7500
5.0
510 910 llOO 1460 II 460 II 620 II 260
3690 37 200 500 IV 2040 43 200 600 2860 42 200 600 III 3400 194 400 650 m 3690 136 450 550 III 4610 146 350 600 IIIIII 1900 II 2380 II 1960-2240 II 2600 II 2380-2720 II 2940-3920 II 1900-2090 II 1960-2940 II/I 6860 I 9210 I 9500
IV 340 1.70 IV 119 10 45 360 1.65
7 320 1.66 III 120 16 45 230 1.80
IV 77 3.4 IVffiI 197 4.2 234 510
III 128 5.2 m 600 200 520 II 307 7.1 II 1600 6.4
90

1970). At this site 865mm diameter plate loading tests were carried out at
different depths in 0.9m diameter shafts. This enabled stiffness parameters to
be measured for the complete weathering profile. The rock mass at this site
was described in detail down to the level of the water table using a number
of large diameter (0.76m) augered boreholes. The engineering grade
classification that is used to describe the condition of the rock mass at the
sites considered in the case histories and in Table 2.2/5 was developed from
these detailed descriptions (see Table 2.3/5). The most notable feature of
the results of the Mundford plate loading tests was the very high values of
initial modulus for chalk of Grade III and IV. The values are greater than the
values of stiffness obtained from tests on Grade II chalk at Mundford and
significantly greater than the stiffness derived from plate loading tests in
Grades III and IV chalk at other sites (eg Basingstoke, Lake and Simons,
1975). Burland and Lord (1970) suggest that the high values of Ei obtained at
Mundford are associated with adhesion between the plate and the walls of
the auger hole due to the plaster of Paris squeezed up during bedding of the
plate.
The plate loading tests reported by Lake and Simons (1970) between Welford
and Theale on the M4 Motorway were carried out using a 140mm diameter
plate loaded at a rate so as to produce a constant rate of penetration of
1mm/min. Such a rate of penetration renders it impossible to determine Ei
and qy with any accuracy. The ultimate bearing capacity measured at a
penetration of 10% of the plate diameter varied between 3MPa and in excess
of 16MPa indicating a wide variation in strength. The dry density of the chalk
at this site varied between 1.3 and 1.4Mg/m3 indicating that this chalk has a
high porosity (48 to 52%) and hence would be expected to have a low
strength. Constant rate of penetration plate loading tests carried out in
Norwich using the same rate of penetration and the same plate diameter
(Butler and Lord, 1970) give a lower ultimate strength since the chalk in
Norwich generally has a higher dry density than 1.3Mg/m3.
91

Lake and Simons (1975) carried out a series of plate loading tests using a
variety of plate diameters, on the chalk at Basingstoke. The results shown in
Fig. 2.2/47 indicate that the observed behaviour is sensitive to the plate
diameter, which raises the question of the validity of extrapolating data
acquired from small diameter plate tests to full scale foundations. The
sensitivity of the observed behaviour to plate diameter stems from the
inability of small diameter plates to test a representative volume of the rock
mass. The discontinuities in the chalk at the Basingstoke site were
predominantly horizontal and vertical and the average spacing of the
horizontal joints was 50 to 100mm at shallow depths and up to 200mm below
2m. The results shown in Fig. 2.2/47 indicate that a reduction in sensitivity to
plate diameter when the plate diameter exceeds 5 times the average joint
spacing (ie 5 * 100mm). Indeed this rule of thumb has been adopted by
BS1377:1990 part 9. Despite the diameter of the plates used by Lake and
Simons the results of all the tests displayed convex pressure settlement
curves conforming to the Burland and Lord model.
Hodges (1976) carried out a sreies of plate loading tests on chalk at
Whitchurch and Otterboume in Hampshire using three different plate
diameters (152mm, 254mm and 762mm). The chalk was classified using the
Mundford grading system by direct visual examination. The chalk at
Whitchurch and Otterboume was classified as Grade IT and V respectively.
The pressure-settlement relationships are shown in Fig. 2.2/48. It will be seen
from this figure that these results show a similar trend to that observed by
Lake and Simons (1975). It appears that for a wide range of discontinuity
spacings and apertures there is a trend of decreasing initial modulus (Ei) and
increasing yield bearing pressure (qe and qy) with increasing plate diameter.
Nienhuis and Price (1990) report the result of a series of horizontal plate
tests carried out in Maastrichtian chalk in the Geulhemmer mine in Holland.
These tests are of particular interest since although the chalk is coarser
grained (medium grained calcarenite, mostly made up of foraminifera about
2.4mm in diameter and about 1mm thick. Crinoid ossicles about 1mm in
92

diameter and shell fragments are also present) than most chalks found in the
U.K it has a high porosity (40 -50%), joints are so infrequent that they may
be individually mapped and bedding is seldom seen clearly. In such a
material the plate tests reflect the behaviour of the rock material due to the
lack of discontinuities. Nienhuis and Price performed tests with plates ranging
in diameter from 30mm up to 400mm. Fig. 2.2/49 show the influence of
plate diameter on modulus. These results tend to show higher values for the
180mm and 280mm diameter plates but the difference in value between these
and the results from the larger and smaller plates is relatively small. This
leads to the conclusion that the modulus values obtained are independent of
plate diameter. The variations in modulus may be attributed to
inhomogeneity within the rock mass. These results when considered alongside
those of Lake and Simons (1975) highlight the influence discontinuities have
on the measurement of rock mass compressibility.
Most plate loading tests are designed to provide information about the short
term behaviour of the rock mass. As a result there is a scarcity of creep data
for the chalk. Burland and Lord (1970) in an attempt to overcome this
problem devised a simple method of comparing the creep results from plate
tests with long-term settlement observations of full-scale foundations. This ,
involved expressing the rate of creep as a proportion of the immediate
settlement in the following manner:
R = Settlement per cycle of log time *100% Observed total immediate settlement
In Fig. 2.2/50 the values of the creep ratio R from plate tests and the
Mundford tank test have been plotted against bearing pressure. For bearing
pressures above that of yield (qe) the R values are clustered relatively tightly
in the range 10 to 15%. For low bearing pressures (at or below qe) the results
are very scattered and the values of R are considerably higher (> 30%). This
93

is possibly the result of different creep laws being associated with pre and
post-yield behaviour.
The creep ratio R assumes the relationship between creep settlement and the
logarithm of time is linear. This relationship has been observed in both short
and long term maintained loading tests (Burland and Lord, 1970, Powell,
1990). However, the immediate settlement required in the calculation of R is
less reliable, since the term 'immediate' has not been defined by Burland and
Lord (1970). Different interpretations of this term can lead to significant
variations in the value of R. Ideally the immediate settlement used to
determine R should be based on creep rate.
The creep measured in tests on grade ill/IV chalk for a borehole and a
trench based plate loading test are plotted as creep rate against log time in
Fig. 2.2/51. It will be seen from Fig. 2.2/51 that the creep rate reduces
rapidly achieving rates less than those proposed by Burland and Lord (1970),
for the rate at which the next increment of load could be applied, in 500 -
1100 minutes. The time to achieve this rate is seen to increase with increasing
stress level. For stress levels below yield the curves all show similar shapes
and fall close to each other. Once the yield stress (qe) is exceeded however,
the creep rates are seen to increse significantly while maintaining the same
basic shape of curve. It will be seen from Fig. 2.2/51 the curves for the
highest bearing pressures in each test the Burland and Lord rate is not
achieved even after 6000 minutes.
Powell (1990) suggests that creep may be of little importance at low stress
levels (ie < qe) with most of it being built out during construction. However
it is clear that at stress levels approaching and exceeding qe creep settlements
can become significant.
94

Summary
The following points arise from this study of the mass compressibility of
chalk:
• The introduction of discontinuities into any rock mass will significantly
increase the compressibility.
• The principal factors affecting the normal stiffness of discontinuities in
rock include:-
contact area;
stress-strain characteristics of the intact rock;
presence of infill material
and the magnitude of the applied load
The most important of these is contact area. This is related to the
surface topography of the discontinuity walls and the degree to which
adjacent surfaces are correllated. Contact area is related to the
magnitude of the applied load and the stress-strain characteristics of
the intact rock. As the applied load is increased the contact area
changes in a manner controlled by the mechanical properties of the
rock forming the asperities of contact.
In chalk the contact area across sub-horizontal discontinuities has been
reduced through dissolution and may be less than 10% of the total
plan area of these fractures.
• The yielding and collapse behaviour of intact chalk may bring about
similar behaviour in discontinuities due to high stresses generated at
the asperities of contact.
95

• The compressibility behaviour of a fractured rock mass is controlled
by:
the orientation of discontinuities relative to the direction of
applied load;
the number of discontinuity sets;
the spacing of discontinuities relative to the dimensions of the
loaded area;
the stress-strain characteristics of the intact rock
and the magnitude of the applied load.
• The available literature therefore suggests that, for a rock mass with
joints parallel and normal to the direction of loading
• the details of contact geometry, and the yield strength of joint
walls normal to the direction of loading, will dominate the
stiffness of the rock mass
• stiffness will increase with increasing load.
Stiffness can be expected to decrease with increasing frequency of the
joint set normal to the direction of loading, but this may well be a
secondary effect if there is significant spatial variation of contact area
and aperture of the joints.
• The stress distribution in rock below a loaded area is controlled to a
large extent by the discontinuity geometry and hence cannot be
predicted accurately using theories based on continuum mechanics.
• The mass compressibility of the English Chalk shows a behaviour in
contrast to that to be expected from the general rock mechanics
literature. Yielding during normal closure of bedding discontinuities
may possibly initially lead to an increase in stiffness, although available
data suggest that this does not occur. At relatively low applied
96

stresses, in near-surface fractured Chalks, yielding commences and
there is a large decrease in stiffness with increasing load.
• Burland and Lord have proposed an bi-linear idealisation for the load
settlement behaviour of fractured chalk. Using this model the mass
compressibilty behaviour may be described using the following
parameters:
Ei - initial modulus
Ey - post-yield modulus
qe - yield bearing pressure (based on the onset of yield)
qy - yield bearing pressure (based on the establishment of Ey)
• Only six case records on the behaviour of foundations on chalk exist.
Of these only four deal with foundations on structured chalk. The
reliability of some of these case records is brought into question
because of the assumptions used in determination of contact stresses
and the stress distribution beneath the loaded area (eg Bury St
Edmunds sugar silos and the Mundford tank loading test).
• Generally pre-yield settlements are small with settlement ratios less
than 0.05% at average applied foundation pressures up to 200 kPa.
• Little is known about the post-yield behaviour of foundations on chalk
since there is only one documented case.
• Little is known about the time-settlement behaviour of foundations on
chalk.
• Little is known about the mechanisms causing the rock mass to yield.
• Little is known about the influence the intact mechanical properties of
chalk has on the mass compressibility behaviour.
97

• Most published results of plate loading tests are unreliable since the
plate diameter used was too small in relation to the discontinuity
spacing. In general the plate diameter should be at least five times the
average spacing of the sub-horizontal discontinuities.
98

o
-E E -.. ::I: 0.1 c CI) en c cu .c (J
0.2
Fig. 2.2/1
Normal stress (MPa) o 20 40 Solid rock
t
o . nJ
Interlocked joint \.
" " " "- ...
" ... "-°nt .... " "- ...
..... ..... '- ...
...... ..... t ..... ..... ....... ........ ....
\ aperture = 0.20mm \
\ O. \ nJ
\
\ \ Mismatched joint \ \
"- " ... \ ... \ ... ..... \.
..... \. ..... \. .....
°nt ..... ...
..... \. "'0.\..
6 = 6 - 6 aperture = 0.35mm nj nt nr
Concave normal stress-deformation behaviour of rock joints (after Bandis et al. 1983).
99

Normal stress (MPa) o 10 20 30 40 so
o I
~\~:::::::::.:::::::;::::::::: ................ . 0.02 ___ ::::: _____ _ -------=---
3rd cycle
2nd cycle ~
E .! 0.04
CD -~ tn 0.06 o -(,) .. .E 0.08 o ..,
Fig. 2.2/2
Fig. 2.2/3
0.10
0.12
(I) ., CD -;; -as CD .c
UJ
1st cycle
Umestone (bedding)
Measurements of the closure of natural joints under normal stress (after Bandis et al. 1983).
4 i--f ----;:.---~~
Shear displacement
Convex shear stress-displacement behaviour of rock joints illustrating sample size dependence (after Bandis et al. 1981).
100

Fig. 2.2/4
ca ep r-
Mated joint
-- -- -
Non-mated joint
Mated and non-mated joints.
100 .-------------~--------------~------------~
80 D
o D
Chalk
Sandstone (strong)
Sandstone (weak)
" ca 60 t) ca ... c o
00 () 40 ... D o o
o D o
C ep () rep
o --
a.. 20
Fig. 2.2/5
D ---.-,----,-
o ~~ ____________ L-____________ ~ ______________ ~
o 5 10 15
Average normal stress (MPa)
Relationship between joint contact area and average normal stress for a variety of rock types including chalk (after Duncan and Hancock, 1966).
101

Normal stress 3MPa
Normal stress 33MPa
0 20 0
-E E -CD ~
~ 0 0.005 0 -()
..... c: .-0 -,
0.010 as 50 CD ~
as 40 ..... () as 30 ..... c: 0 20 ()
..... 10 c:
CD () 0 ~
CD 0 D.. 20
·~-. ..:. ... ~~~.
". ;.. ''-4-~
,;. . . .~ .
. ,- :":.~ .~. "~ '--'.-~. '
f < . ",. ',
Normal stress 85MPa
Specimen E30 Approx. scale
Normal stress (MPa) 40 60
40 60
Normal stress (MPa)
0.4mm
80
E30
E32
E30
80
(a)
(b)
Fig. 2.2/6 Relationship between joint contact area and average normal stress for natural fractures in quartz monzonite (after Pyrak-Nolte et al. 1987, 1990).
102

Fig. 2~/7
p Type A p
---
Settlement
p Type B p
Settlement
TypeC p
, Settlement
Constrasting load-deformation behaviour for rock masses with different magnitudes of joint shear (S) and normal deformation (N) components (after
Barton, 1986).
103

..-. E E '-"' ... c -CI)
E CI) () C'G Q. o C
..-. E E '-"' ... C CI)
E CI) -:= CI)
en
Fig. 2.2/8
o o
0.25
0.50
0.75
1.00
o o
0.25
0.50
0.75
1.00
1.25
1.50
1
p
Load (kN) 2
p
3 4
Elastic response
Hydrostatic loading
p (a)
Bearing pressure (kPa) 500 1000 • 1500
(b)
(a) Deformational response where the joint sets are perpendicular to the imposed principal loads (after Chappell, 1979). (b) Results of a plate loading test on sandstone with predominantly sub-horizontal and sub-vertical joint sets (after Hobbs, 1973).
104

Fig. 2.2/9
Pv
.................................. :.:.:.:.:.:.:-:.:.:.:.: :.:.:.:.:.:.:-:.:.;.:.:.:.:.:
:-:-:.:.:.;.;.:-:.;.;.;.: ............................... :-:-:.;.:.;.;.;.: .
. :.:-:-:.:.: ;.;.;.;.;-:.;.:-:.;.:.;,' .... . .::::::'
P':';"'Z:':':':',Z":-:':-:B' ::::::::::::::::==:':B':':':':B.:.:.:-:.q ..... ________ Joints
Pv (a)
:
~i ~ : :
.' ;::: : : :::
:: ::: : : : : .'
.'. ~lj
: ::: ~~ : : : .'
: : : :
:: : :
: .'
: : .' j ~
Pv (b)
Pv (c)
Simple models for studying the influence of joint spacing on mass compressibility.
105

1
0.8
Em 0.6
EI 0.4
0.2
0
Fig. 2.2/10
1
0.8
Em 0.6
E, 0.4
0.2
0
Fig. 2.2/11
EJ E = 0.5
I
EJ E = 0.05
I
EJ E = 0.0001
I EJ E = 0.005
I I Aperture = 1.0mm
0 4 8 12 16 20 24 28
No. of joints per metre
Variation in the ratio of mass stitTness to intact stitTness with fracture frequency for fractures with ditTerent stitTnesses.
Aperture
1 0.005
0 4 8 12 16 20 24 28
No. of joints per metre
Variation in the ratio of mass stitt ness to intact stitTness with fracture frequency for fractures with ditTerent apertures.
106

.-... 0 .., () as .. tJ) tJ) as E
JIll:: () 0 a:
Fig. 2.2/12
.-... 0 .., () as .. tJ) tJ) as E
JIll:: () 0 a:
Fig. 2.2/13
Chalk grades (Ward et al. 1968) Grades I & II Grade III Grade IV 1~---:----------__ ~--------__ ~
0.8
0.6
0.4
0.2
0 0
T1ghtr closed joints
rocompressed joints
4 8 12 16 20 24 28
No. of joints per metre
Variation of rock mass factor (j) with fracture frequency for chalk based on laboratory tests on artificial joints (after Wakeling, 1975).
36.5% contact area ratio
1
0.8
0.6
0.4
0.2
0 0 4 8 12 16 20 24 28
No. of joints per metre (1 If)
Na = 50 Poisson's ratio = 0.25
Variation of rock mass factor (j) with fracture frequency for joints with different initial contact area ratios.
107

'-~ 0 ..., (,) «S ... U) U) «S E ~ (,) 0 a::
Fig. 2.2/14
'-~ o ..., (,) «S ... U) U) «S E ~ (,) o a::
Fig. 2.2/15
O.S
O.S
0.4
0.2
0 0 200 400 SOO SOO 1000 1200 1400
No. of asperities per unit area (Na )
A j = 20%, Poisson's ratio = 0.25
Variation of rock mass factor (j) with joint roughness expressed as the number of asperities per unit area (Na) for rock masses with different joint spacings.
1.0
O.S_
o.sB
0.4
0.2
Killingholme, Lincs [ ::::::::::::::::::::::::::::J Mundford, Norfolk ------ Newmarket, Cambs.
Fractures becoming tighter
0.0 L-__ -L ____ ~ __ ~ ____ ~ __ ~ ____ ~ __ ~ __ ~
o 5 10 15 20 25 30 35 40
Fractures per metre
Variation of rock mass factor (j) and fracture frequency for chalk (after Hobbs, 1975).
108

Fig. 2.2/16
(a)
l I I \ fIl I I j
I I II .1\/ H \\ I I I I 1/ i ~\'~ 1 1
I I Jr v l\ I T I I \ /) ~ / 1
I I - II I I I \J I / 1 1
1 I '\ ""LA J I r I /'\J IA I T
I - 1 1 (b)
(c)
(d)
Pressure distributions for a circular foundation on a rock masses with diITerent discontinuity set orientations (after Gaziev and Erlikhman, 1971).
109

.-.. E E
o
'-" 1 0 ... C CD E CD
i en
20
o
q q e y
1000
Average bearing pressure (kPa)
Fig. 2~/17 Typical pressure-settlement curve for Grades IV and III chalk (from Burland and Lord, 1970).
110

..... ..... .....
Elevator Tower
~15.750m~
I ct
Silos n -~ , I h I
22.81 Om -.t~22.81 Om----i---22.81 Om-I:>: ct ct· "Co
• ..L...
4 \ • r II~-
Silos 20.0m' Internal Ola.
A
1
Inspection shaft 'C' 1
Silo NO.1
ct
0 I
0.1 0 0 Settlement points
0 0 0 10 0 •
0 0 o ;0 0
Silo NO.2
~ I A 0 .J 0
Silo No.3 Silo No.4
PLAN SHOWING ARRANGEMENT OF SILOS AND INSPECTION SHAFT LOCATIONS
I
610mm Dla. ~ I Columns • \ I 1065mm thick RC silo
: floor slab
" .at 30.0m ~
I :~Extensometer 1-t. borehole
PLAN SHOWING SETTLEMENT LEVELLING POINTS SECTION A-A
Fig. 2.2/18 Silo foundations and positions of levelling points and inspection shafts (after Burland and Bayliss, 1990).
1220mm thick RC raft foundatlor;ls 75mm blinding concrete

o
2
4
6
~8 E --10 .c Q.12 CD
C 14
16
18
20
r-
r-
~
r-
r-
~
r-
-
~
-
-
Fig. 2.2/19
1 Fill VI IV
.... 0_- .. -...... IVN
IV
II
Ill/IV ---.-.... __ . __ ..
IV
Ill/IV
2
VNI
III/IV
III/IV
IV
II
IV
III
Base of rafts
-' 3
VNI
IV
III .-._-_ ... ----_ ..
III
III/IV --•• 0_ •••••• -.-.
IV
IV
. . . . Chalk Grading based on visual inspection
in shafts 1, 2, 3 and 4
4
VNI t---
IV
III/IV ... _---_ .. __ ._.-
III/IV
._------_ .. -----
IV ----------------
IV
Chalk grades based on visual inspection of the chalk beneath the silos in shafts 1, 2, 3 and 4 (after Kee, 1974).
112

0
.-. 10 E E ---.., c CD E 20 CD -=: CD en
30
40
Fig. 2.2/20
Fig. 2.2/21
Load in Silo No. 3 (tonne) 0 2000 4000 6000 8000 10000 12000
I
~
t;:" -~ C") - ~ ,...
t;:" N N ~ -- ~
C") --~ -~ ~ -
0 Av. settlement of silo walls
• Settlement of raft centre ~ -
-~ ,... -~ -~ ~
Settlement of Silo No.3 during first loading (after Burland and Bayliss, 1990).
o
-20 E .s .., c CD 40 E CD E CD
en 60
Silo No.3
" (31/12/73)
,
i ! I
(18}~/74) I
~.~-+~-.----- ... ... " I ..... • -- I ..........
,,,, ! ' .....
.'''''''~(1982) 80 ,
,
4-I~"' ___ ------ 22.Sm
...,
~I
Settlement prorlles for silo No.3 during first loading (after Burland and Bayliss, 1990).
113

..-. E '-"
o o
.c 10 a G> c
20
Fig.2j./22
c o "; "S: "-
Relative settlement (mm) 10 20
Silo No.3 Zero = 100 kPa
• qav = 210 kPa • qav = 250 kPa ... qav = 313 kPa o qav = 353 kPa D qav = 383 kPa
Distribution of settlement with depth beneath the centre of silo No. 3 for various foundation pressures (after Burland and Bayliss, 1990).
Average foundation pressure (kPa) 200 400
8-7
7-6
6-5 '"0 ... r--__ 5 - 4 G> Q.
'*' ,... o o c "iii ... .., o
Fig.2j./23
~ ____ '4~-~3~~--~--__ •
yield bearing pressure
2 -1
Silo No.3
1.80 8 0.42
7 4.81 8.26 6
5 11.34 Depth (m)
14.81 4 3 17.29
19 2 1 23.30
Positions of settlement
measurent points
Vertical strains beneath the centre of silo No.3 (after Burland and Bayliss, 1990).
114

~
~
V1
<t.
Vertical stress (kPa) o 100 200 300 400 500
o I :c;:: x
5
10
-.s 15 .s:: Q. CD C
20
25
30
Fig.2J./24
900- flm . 460
o Bousssinesq
• Soli-structure Interaction analysis
700
600
Relationship between vertical stress and depth beneath centre of silo when filled to capacity (after Nicoletto, 1979).
Soli-structure
I
~o i
i70_! 2~ I . I i
Interaction analysis <t. Bousssinesq
Countours of vertical stress In kPa
Fig.2J./25 Stress distribution beneath a silo when filled to capacity (after Nicoletto, 1979).

...... ..... 0"
18.3m Dla. tank
183kPa 1
10m I
W9 W8
~2~_Y-i WS W6
---C: W7
I Level 1
" , , " I 1 30mOD I W1G
I IV
Level 2 r---
III Twin Marls
Level 3 r-- 20m 00 ---
-I-- -
54 Level 4 51 52 53 II
Approx. water level . ...... _- .......................................... - .. --.- .. -_ ................ ........................ .. ......................... . ........ -.-. . ......... ....................................................................... Y. ..................... c-·····10m·OO············
LevelS Mount Ephraim Marl
II - I
Level 6 Chalk Grade
W1 - 8 Water level gauges 51 - 4 5hafts for vertical deflexlon Instrumentation
Level 1 - 6 Depths at which vertical deflexlons were measured
Fig. 2.2/26 Vertical section showing the position of the instrumentation used to monitor ground movements associated with the tank loading test at Mundford, Norfolk (after Ward et al. 1968).
Om 00

Deflected shape from simple elastic theory
-~-------
Deflected shape of ground surface
Shaft 54
Tat:lk bearing pressure
183kPa
Vertical deflexlon (mm) o
5
.-E
10 -.:.= c '" .. ~ 15 0 -CI) .a 20 .s::. .. a. CI)
C 25
30
Shaft S1
o ._ .. 4--------....
Shaft S2 Shaft S3
Fig. 2.2/27 Section beneath tank showing the distribution with depth of the immediate vertical deflections under maximum tank load at shafts 1, 2, 3 and 4, and the deflected shape of the ground surface (after Ward et aI., 1968).
117
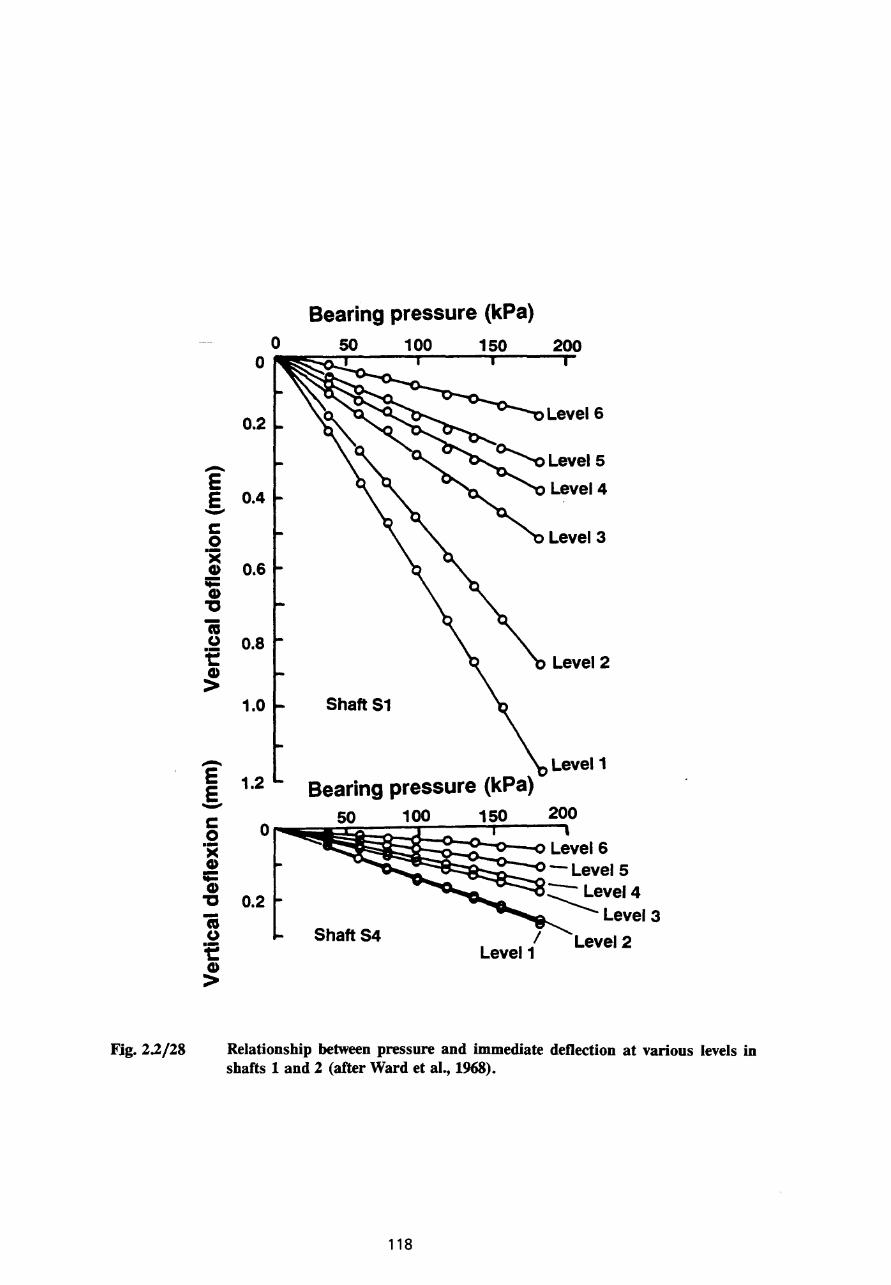
Fig. 2.2/28
.-. E E --c 0 .->< CI) ---CI) -c -co u .-1: CI)
>
.-. E E --c o .;C CI) ---CI) -c "i u t: CI)
>
Bearing pressure (kPa) o 50 100 o ... ~~---r--r--r
0.2
0.4 Level 4
Level 3
0.6
0.8 Level 2
1.0 Shaft S1
Level 1 1.2 Bearing pressure (kPa)
200 100
o~~~ ~ ... -LevelS ------ -0.2 ~vel4
Level 3 / Level 2 Level 1
Shaft S4
Relationship between pressure and immediate deflection at various levels in shafts 1 and 2 (after Ward et aI., 1968).
118

~
E ---.. CD 20 .. m ~ ~
10 0
• .. 0 J:
~ 0.002 ~ ---C 0.004 .-m .. .. t/) - 0.006 m (,) .- 0.008 t: ~
0.010
0.012
Fig. 2.2/29
-0.4
-0.2
0.0 ~
E 0.2 E 0.4 ---.. C 0.6 CD E CD
0.8 -= 0.1 CD en 1.2
1.4
1.6 0
Fig. 2.2/30
200 Time (Hours)
Levels 3-4
Levels 2-3
Short-term. tank test; relationship between time and vertical strain at various levels beneath the centre of the tank during loading, standing and then unloading (after Ward et aI., 1968).
FIlling of the tank complete
S3
Differential between S1 and S2 .
20 40 60 80 100 120
Time (days)
Long-term. tank test; relationship between vertical deflection of level 1 (relative to level 6) in each shaft after completion of loading. The differential settlements at level 1 between the centre (S1) and the edge (S2) of the tank are also shown (after Ward et al., 1968).
119

0
.-. '#I!. e..... 0.01 c --as '-.. rn -as ()
0.02 --t:: ~
0.03
Fig. 2.2/31
Time (days) 0 100 200 300
E = 3980MPa
Level 3-4 (Grade II)
E = 1160MPa Level 2-3 (Grade III)
Level 1-2 (Grade IV-III) E = 488MPa
Long-term tank test; relationship between time and vertical strain for three levels beneath the tank over a period of one year (after Burland, 1975).
120

Fig. 22/32
Visual Description
Lumps less than 3Omm, in soft matrix
Rubbly, friable chalk, joints 10-50mm apart and partly open to 4mm
Rubbly to blocky, joints 3-100mm apart t03mm
Blocky; Joints 30-11 Omm apart, psartly open to 3mm
Blocky, tight Joints III - II
Massive; tight minor joints more than 200mm apart. Some major horizontal joints partially open to 3mm.
~
Chalk Grade
V
IV
IV - III
III
II
Depth below ground level (m)
o
t-- 2
Level of slab test
4
I-- 6
t-- 8
t-- 10
t-- 12
t-- 14
t-- 16
'Profile of chalk grade at Luton, site D (after Powell et aI., 1990).
121

Bearing pressure (kPa)
o 200 400 600 800 1000 o ~~--~------~-----,------~----~~-
2 .-. E E 4 --.., C CD 6 E CD
i 8 UJ
10
12
Fig. 2.2/33
o
Load maintained
Load maintained
Load maintained for 312hrs
Load maintained for 134hrs
Pressure-settlement curves for the slab loading test carried out at Luton, site D (after Powell et al., 1990).
Bearing pressure (kPa)
200 400 600 800 1000 o ~-------,-------,--------.-------~--------~--
2 .-. E E 4 --.., i 6 E CD B 8 CD
UJ 10
12
Fig. 2.2/34 Pressure-settlement curve for the slab loading test at Luton, site D with the creep settlement removed (from Powell et aI., 1990).
122

Visual Description
Superficial silty clay
Structureless chalk with Intact lumps
dimensions 3O-6Omm
Soft blocky chalk: vertical and horizontal joints spaced 3O-60mm apart and open from 2-Smm. Several prominant near-vertical joints up to 20mm wide and filled with clay and sand
At 2.3m, 40mm thick sandy clay seam
/ Inclined at 4 degrees to the horizontal
Medium-soft blocky chalk. Vertical joints 6O-150mm apart, open to 2mm
BASE OF PIT
NOTE: Scattered nodular flints and Inclined veins of tabular flint, typical of the Middle Chalk, are found throughout the section
Chalk Grade
V
IV
...................
III
Depth below ground level (m)
o
1
~ 2
...... Level of pad test
~ 3
4
Fig.2j,/35 Profile of cbalk grade at Luton, site C (after Powell et at, 1990).
123

o o
~
~ "'-'" o 0.2 --... ca ... 'E CI) 0.4 E CI)
-= CI) en 0.6
Bearing pressure (kPa) 200 400
Load maintain
~72hrs Load maintained
~ for72hrs
600
~ ::::~\ Load maintained
~ . for72hrs
~~~::!ntalned .... Settlement~
= 10.26mm ~
0.8 -
Fig. 2.2/36
o
~
(ft. "'-'" o 0.2
i ... ... i 0.4 E CI)
-= CI) en 0.6
0.8
Fig. 2.2/37
o
Pressure-settlement curves for the 1710mm pad loading test carried out at Luton, site C (after Powell et al., 1990).
Bearing pressure (kPa)
200 400 600
Pressure-settlement curve for the 1710mm pad loading test at Luton, site C with the creep settlement removed (from Powell et aI., 1990).
124

Fig. 2.2/38
-E E
""-'" ... c: CI)
E CI) -= CI)
en
Fig. 2.2/39
Observations on columns
, With :98m square bases
[!] ~ ~ 'Observations on columns
with 3.35m square bases
/ . '" [!] [!] [!]
10m
Simplified plan showing the arrangement of the 1.98m and 3.35m square footings at Basingstoke (after Lake and Simons, 1975).
Time (Weeks) 0 10 20 30 40
0
-- -----@
10
20 • 3.35m square bases
D 1.98m square bases
Relationship between time and average settlement for the 1.98m and 3.35m square footings (after Lake and Simons, 1975).
125

S1
S22
Fig. 2.2/40
Fig. 2.2/41
• R.C. columns
o Borehole positions
o Trial pit positions
* Levelling positions : •........... Ii 8 BH1 * * ~:. •
r--r-_-c-__ S3 __ S_4~ .·······.L ... j .... J * .............• * ........... * ........... ~ ...... * 1. • . . . ..... I I :
.' : _ _ 1 BLOCK B :
BLO_CK A .0 9 ;'H2 ....... 1.... ............. .. ....... q.: *r· .. * .......... *
10m
* : I : I
• .*: I . I : I
r----~, I I I I I I I I I I I I I IV: I I
I I I I I I . .
Raft joints
Plan of raft foundations showing the position of levelling stations boreholes and trial pits (after Burland et aI., 1975).
0
2
- 4 -E -.r:. 6 c.. CD 8 a -
10
12 -
14
m 1
1 I 1
I 1
1 I
I I I
Fill
Weathered chalk with some flints
Tentative grading Based on SPT N values
V - VI
V
IV - V
Unweathered chalk
Profile of chalk grade based on SPT 'N'values (after Burland et al., 1975).
126

~ ca a. ~ ---G> :; Floor slabs :: and some cladding G> a. 60 C) c: .-'"" ca 40 G> .c G> ~20 '"" G>
~ o 1---4-=
~
E 2 E ---.., c: G> 4 E G> -:= G> 6 en
Backfill and
I Roof and other finishes cladding:
, , I
I I I I
I I I I I I I
Time (weeks) 20 30
•• ' .~ ••. _ ••• ___ H"_~_"' ___ '"
40
S4 S22
Fig. 2.2/42 Relationship between time and settlement for some of the levelling stations in Block A (after Burland et al., 1975).
127

The addition of
thi fai
s block caused
lure
-l-
l
!
28.1t
I
i
~
Centre of gravity of base
I 22t
r i/ Steel bloc ks
!
i 1 ....... - Steel beams 1.1 t
l....
Safety guy
Fig. 2.2/43
'\l ...J
--
W 1..
- ! ....... - 1.ssm Dia . .......
i
! I,
i .~ '-.J -u n
E CJ) Y"'" E . Y"'"
• M Y"'"
N
" []
Cross-section through load test in the base of the cof[er-dam showing concrete cylinder, deep sett1ement points and kentiedge (aller Burland et al., 1983).
128

Load (t) o 40 50 60
o ~~~~----'-----r-----~----~----I
.-.. E E
20
--- 40 .. C G)
E G) E 60 G)
en
80
100
Fig. 2.2/44
2
Load maintained overnight E = 4.4 MPa
no further settlement
o Settlement of point 1.19m below footing
o Settlement of footing No recovery on removal of load
Results of loading test in base of coffer-dam (after Burland et aI., 1983).
1977 1978 1989 1980
Raft completed f.-- Building completed
-.~ ______________ ~ North end
South end 14 _
Fig. 2.2/45 Time-settlement observations on cable chamber (after Burland et aI., 1983).
129

-" w 0
Applied Stress (kPa)
o 100 200
o
~ m11~ Ii!! Ii!! Ii1I ~ -4
0.02
300 o
Applied Stress (kPa) soo
I : o ~~d ~ 3et'11 mf~
Ii!! (fl' . m!ll 1 3 &1ll1
1i1I1 111]1
1000
.-. "'0 IilIIlil 1illD11 .-. 0.1 -fI. 1lI1 fI.
"'-" "'-" f! m3 !ill a: r 1 0 .-~ co a: ~
c: CI)
E CI)
= CI)
en
m1 0 Ii!!~ 1 .-0.04
Ii!! 1 ~ co
rn1 a: ~
c: 1 CI)
1 mi E CI)
0.06 -:= CI)
en
O.OS i "\..\ m6
0.1
(a)
0.2 -
0.3
:., 1 i ~ .:'.: 1 1lIt!J1
4g ll'l1 4rn m 1
1 m 1 1m ElJllI 1
(;31
1mP~ 1 EI..... 1 1 ~ .. 1
EI 1 1m
m1
0.4 -L-_______________ -----'
(b)
1 22.SSm Dla. rafts for silos at Bury St Edmunds, Suffolk 4 1.9Sm & 3.3Sm square footings at Baslngstoke, Hampshire 2 1S.3m Dla. tank loading test at Mundford, Norfolk S 16.Sm & 14.Sm square rafts at Reading, Berkshire 3 3m * 1.Sm slab & 1.71 m Dla loading tests at Luton, Bedfordshire 6 1.55m Dla. In-situ loading test at Salisbury, Wiltshire
Fig. 2.2/46 Relationship between applied stress and settlement-ratio showing pre-yield and post-yield behaviour for full-scale structures and large-scale loading tests.

.-. E E '"-" .. c CD E CD -= CD til CD C) ca ... CD
~
Fig. 2.2/47
Bearing pressure (kPa)
1000 1500 2000 O~~"~~r-------II-------'--------~
5
10
910mm
15
610mm
300mm plate Dia.
20
Pressure-settlement curves for plates of various diameters (after Lake and Simons, 1975).
131

Bearing pressure (kPa) 0 1000 2000 3000 4000
0
Grade II chalk
..-.. 762mm E 5 E --... c CD
i-10 -= CD U)
CD C) cu 15 "-CD
~
20
254mm 152mm Dia. plate
(a)
Bearing pressure (kPa)
0 500 1000 1500 2000 0
Grade V chalk
..-.. E 10 E --... c CD E 20 CD 762mm -= 152mm Dia. plate CD U)
CD C) cu 30 "-CD
~
40 305mm (b)
Fig. 2.2/48 Pressure-settlement curves for plates of various diameters (after Hodges, 1976).
132

-.. as D.. Cl --tJ) ::l -::l "0 0 E .. C as () CD
U)
Fig. 2.2/49
2
1
Loading cycle D:.1 .4 • 2 o 5 • 3
0 0 50 80 120 180 280 400
Plate diameter (mm)
Relationship between modulus and plate diameter of widely jointed Maarstichtian chalk (Nienhuis and Price, 1990).
133

2000
0 Mundford
0 Burland & Lord (1970) ..- 0 Luton as D. q Powell et al. (1990) .:.= ---CD 0 I '- I
:::J aJ 0 '" '" 0 ! 1000 -
Dc:P 0 C. I
C) I
t: I .- 000120 0 '- Mundford Tank as CD m
I
0 Ot§] 0 0
0 o ~ ____ L-__ ~ ____ ~ ____ ~ ____ ~ ____ ~ ____ ~
o
Fig. 2~/50
10 20 30 40 50 60 70
R (%)
Relationship between load-intensity and creep ratio R from plate tests (after Burland and Lord, 1970).
134

10
8
.-.. ~ as
6 "C --E E -CD ..., as ~
Q. 4 CD
CD ~
0
2
o
Burland & Lord
rate ~
1200kPa
1820kPa Bearing pressure
... ... ...
... ...
... ...
... ~
.. ' ............... , ....................... . 10 100 1000
Time (min)
Borehole test (Site D)
(a)
10000
Fig. 2.2/51a Relationship between creep rate and time from plate test at Luton, site D (after Powell. 1990).
135

10
8
.-. ~ m
6 "C --. E E "-" CD ... m ... Q.
4 CD CD ... 0
2
o
Fig. 2.2/S1b
10
Burland & Lord rate
445kPa
100
665kPa Bearing pressure
Trench tests (Site C)
Post yield
1000
Time (min)
(b)
10000
Relationship between creep rate and time from plate test at Luton, site C (after Powell. 1990).
136

2.3 Methods of Assessing the Mass Compressibility of Chalk
Discontinuities have a significant effect on the mechanical properties of rocks
in the mass. The stiffness of discontinuities is generally significantly less than
that of intact rock. It is therefore difficult, if not impossible to make accurate
estimates of mass compressibility from laboratory stiffness measurements
made on intact rock if the rock mass is in any way fractured. Intuitively it
seems likely that the intact stiffness will influence the compressibility
behaviour of the rock mass, but the degree of influence must be related to
the size of the loaded area in relation to the average block size. Hobbs
(1973,1975) suggests that the intact stiffness can be used in conjunction with
the rock mass factor j to obtain rock mass stiffness parameters.
The interrelationships between block size and the dimensions of the loaded
area has been demonstrated by the results of plate loading tests using
different plate diameters in jointed and unjointed chalk (Lake and Simons,
1974, Hodges, 1976 and Nienhuis and Price, 1990). Because the
discontinuities can play an important role in controlling the mass
compressibility it is preferable to perform in-situ tests to assess the mass
compressibility parameters.
The first attempts to understand the load-settlement behaviour of chalk in
the mass was based upon observations of plate tests and foundation
settlements. Wakeling (1966) suggests that the rate of consolidation in intact
chalk has been found to be sufficiently rapid that most structures will
experience full consolidation settlement during construction. It is unlikely that
Terzaghi's theory of consolidation can be applied to chalk since the particles
are cemented to such an extent that the material has a much more rigid
skeleton than soils. Immediate or elastic settlements were thought to
dominate the load-settlement behaviour of chalk and hence settlement
predictions were based on the simplifying assumption that fractured chalk
behaved as a linear elastic material (Wakeling, 1966). However by the late
1960's further observations of the compressibility of chalk under relatively
137

large diameter plates had indicated that yielding occurred at applied stresses
well within the normal stress range applied to full-scale foundations
(Wakeling, 1970, Burland and Lord, 1970).
Mundford represented a milestone in understanding the mass compressibility
of chalk. The work included plate loading tests, a tank loading test, visual
classification and standard penetration tests. The results of the plate and tank
loading tests demonstrated that chalk could indeed meet the stringent
requirements placed upon the settlement of sensitive structures such as a
particle accelerator. It also made engineers aware of the yielding
characteristics of the rock mass. Such behaviour, which does not represent
failure, had not been associated with rock subjected to such low bearing
pressures before. The work at Mundford also highlighted the time-dependent
behaviour of the chalk. Burland and Lord (1970) noted that little attention
was shown to the time-dependent behaviour of chalk.
In comparison to the work done to understand the immediate load-settlement
behaviour of chalk, very little has been done to investigate the time
dependent settlement characteristics. The longest loading test carried out
remains the Mundford tank test. The tests reported by Powell et al. (1990)
and Powell (1990) are short term in comparison, only lasting a matter of
days.
The mass compressibility of chalk has been investigated using a variety of in
situ tests ranging from the most popular and cheap techniques such as the
standard penetration test to the less popular and expensive plate loading
tests. Table 2.3/1 shows the in-situ tests commonly used to determine the
parameters defined in Burland and Lord (1970) model (Fig.2.2/18).
138

Table 2.3/1 Methods used to determine the deformation parameters of chalk.
Method
Pressuremeter
Plate loading tests
Geophysics
S.P.T.
Visual assessment
Parameters
./? ?
? ?
139
?
?
Comments
Direction of applied load perpendicular to that applied by a foundation. Results of pressure meter tests carried out in preformed holes (eg Mennard Pressuremeter) will be influenced by distwbance. Self boring pressure meters will have difficulty penetrating flint layers.
Plate loading tests are very expensive to perform and require careful attention to preparation of the plate location and the design of the instrumentation. Plate diameters less than 865mm rarely yield useful data. Interpretation of plate tests results rely on assumptions.
Restricted to seismic techniques (refraction, cross
hole, surface-wave). These techniques are relatively cheap and quick to perform. Surface refraction and borehole techniques will be influenced by anisotropy. Results will be in the form of a modulus depth profile. Some assumptions may be required in the interpretation of raw data.
Tests are cheap to perform. Most commonly
used test to determine ground stiffness profile. Interpretation of test results is based on empirical relationships. Tests results are influenced by drilling method.
Engineering grade classification developed for
Mundford Site is site specific but is used country wide. Relationship between stiffness and grade is empirical. Reasonably large exposures or mansized boreholes required to enable effective use since correlations with SPT are unreliable.

Pressuremeter Tests
Pressuremeters may be defined as cylindrical devices designed to apply
uniform pressure to the walls of a borehole by means of a flexible membrane.
There are three broad categories of pressuremeter which may be
distinguished in terms of the installation method. These include:
(i)
(ii)
Menard-type pressuremeter (MPM) test - in which the
device is lowered into a borehole (which is usually
slightly oversized).
Self-boring pressuremeter (SBP) test - in which the
device bores its own way into the ground.
(iii) Rock pressuremeter (RP) test - this employs a special
type of self boring pressuremeter that is capable of
boring its own way into rock. Since rock is generally
expected to be much stiffer than soil this pressuremeter
uses instrumentation that has a higher resolution than
the conventional self boring pressuremeter.
Pressuremeters are normally inserted vertically at various depths in the
ground. Figure 2.3/1 shows a typical arrangement for a pressuremeter test.
The test involves expanding a membrane against the surrounding ground by
means of water, gas or oil under pressure. Outward radial deformation of the
ground occurs as the membrane is expands. The object of the test is to obtain
the relationship between the applied pressure and the deformation of the
ground. Ground deformation is determined by measuring the volume of fluid
injected into the central part of the pressuremeter. In devices which are
expanded by gas under pressure (and in some which are expanded by oil) the
radial deformation of the ground is measured directly by a number (usually
3) of 'feeler' arms. In weak rocks the ground deformations are generally small
140

and hence resolution and accuracy of the volume change measurements may
not be adequate for ground stiffness determinations. The use of 'feeler' arms
offer better accuracy and resolution but are still not adequate for stiffness
measurements in weak rocks. The rock pressuremeter makes use of Hall
effect semi-conductors in place of the 'feeler' arms. These permit the
measurement of radial displacements of less than a micron.
Corrections have to be made to measurements of pressure, volume or radial
deformation to account for the effects such as system compressibility,
elevation differences and membrane characteristics. A comprehensive
description of pressuremeters and the principles of pressuremeter testing are
given by Baguelin et al (1978) and Mair and Wood (1987). The nature of the
pressuremeter test is such that within the test zone all soil/rock elements
strained follow very similar stress paths (Jamiolkowski et al, 1985).
Typical data from a MPM test is shown in Fig. 2.3/2. Three distinct phases
are usually evident in tests on soil and are shown in Fig. 2.3/2. These phases
include:
Phase 1
Phase 2
The initial curved portion is attributed to the expansion
of the membrane until it comes into full contact with the
sides of the borehole, also the deformation of any
disturbed or softened zone. In a good quality SBP test in
which the pressuremeter is inserted into the ground with
minimum disturbance, this phase is normally absent.
This approximately linear portion of the curve shown in
Fig. 2.3/2 represents elastic deformation of the
surrounding ground. The onset of phase 2 is considered
to represent the recovery of the in-situ horizontal stress
(Po)'
141

Phase 3 The onset of plastic deformation at Pf in Fig. 2.3/2
marks the beginning of this phase. Phase 3 continues
with the zone of soil in a plastic condition increasing in
radius until a limit pressure Pu is approached. The limit
pressure is the highest pressure that can be sustained by
the ground and can be related to the shear strength of
the ground.
Nearly all of the experience to date in weak rocks has been with Menard
Pressuremeter testing. In certain categories of weak rock, such as chalk, marl
and mudstones the self boring pressuremeter has been used successfully, but
at present experience is relatively limited (Mair and Wood, 1987). Typical
results from MPM tests in moderately weak rock are shown in Fig. 2.3/2. The
shear modulus can be determined from the pressure expansion curve as
follows:
or
The gradient of the linear portion of the pressure expansion curve in phase 2
will give the initial shear modulus (Gi) and the gradient of the linear portion
in phase 3 (if present) will give the yield shear modulus (Gy). In order to
determine Ei and Ey it is necessary to assume an appropriate value of
Poisson's ratio (v) since:
E=2G(l+v)
The yield stress qe is analogous to the creep pressure Pf in Fig. 2.3 /2. The
yield stress qy may be found by extrapolating the linear part of the phase 3
142

pressure expansion curve (if present) back to a vertical line representing the
start of phase 2 in Fig. 2.3/2.
The prime requirement for a MPM test is the formation of a good quality
test pocket with minimum disturbance. Ideally the wall of the test pocket
should be reasonably smooth. In highly fractured chalk it is virtually
impossible to achieve a relatively smooth borehole wall. Irregularities in the
borehole wall will result in limited contact between the membrane and the
wall resulting in non-uniform distribution of stresses and strains. The nature
of the fracturing may cause the pressuremeter to deform asymmetrically due
to movement along joints, or anisotropy, permitting the body of the
instrument (reference frame) to move relative to its original position (Ervin
et al. 1980). Under such conditions the interpretation of pressuremeter data
becomes difficult. Drilling in highly fractured chalk commonly causes
loosening of the ground around the borehole. This type of disturbance can
seriously affect the interpretation of pressuremeter data resulting in Ei being
underestimated. Both the MPM, SBP and the RP test are hampered by the
presence of flint in chalk. Drilling through flints can cause significant
overbreak and disturbance at the level of the flint and below depending on
the drilling method and the care taken by the drill crew. Such overbreak and
disturbance will influence the performance of the MPM test. When rotary
coring in chalk the enormous difference in hardness between chalk and flint
often requires changing the drill bit type to penetrate flints. Since it is not
practical to retract a self-boring pressuremeter in order to change the cutting
tool and since it is unlikely that the cutting tool provided on conventional
SBP's and the RP are capable of cutting through coarse gravel size flints, the
progress of this device will be terminated by the presence of flints.
Some of the difficulties encountered as a result of an uneven borehole wall
may be overcome by performing unload-reload cycles so that Gur can be
determined. Jewell and Fahey (1984) found that for tests in moderately weak
siltstone the ratio Gur/Gi varied between 1.2 and 7 in more weathered
material. The values of Gi were found to vary widely as a result of
143

disturbance whereas Gur values were much more repeatable and consistent.
Hobbs (1970) compared the results of pressuremeter (MPM) tests with that
of plate tests on chalk at Mundford. Hobbs found that the unload-reload
modulus E + values determined in the linear elastic phase of the
pressuremeter test agreed well with the yield modulus Ey values obtained
from plate loading tests, particularly for the more fractured chalk. Hobbs also
claims moderate agreement between Po given by the pressuremeter and qe
from the plate tests. It is likely that Hobbs' results are severely influenced by
disturbance and poor resolution. The pressuremeter used by Hobbs relied
upon the measurement of volume change which is considered to be
inadequate for tests in weak rocks (Mair and Wood, 1987). The agreement
obtained by Hobbs is likely to be coincidence.
Powell et al. (1990) present a comparison of the results of pressuremeter tests
(MPM tests) and plate tests in chalk at Luton (Fig 2.3/3). The pressuremeter
tests and plate loading tests were performed in adjacent boreholes.
Considering the highly fractured nature of the chalk, the agreement between
the limit and ultimate bearing pressures is fairly reasonable. The initial
loading moduli data from the plate tests are fairly close to those back
analyzed from differential settlement measurements of the full scale
foundation, whereas both initial and reload pressuremeter moduli are only a
fraction of the values obtained large-scale plate loading tests. Powell et al.
(1990) attribute these low values obtained from the MPM tests to the
combined effects of disturbance, of the sensitive microfabric of the chalk
during drilling of the test pockets, and the presence of partially open vertical
joints. The chalk between 2 and 3m depth at this site had an unusually open
macrofrabric which was dominated by vertical discontinuities (see Fig. 5
Powell et aI, 1990). Such a structure would be expected to be anisotropic with
Gy > Gh• Since Gh is obtained from the pressuremeter and Gy from the plate
tests the difference in values seen in Fig. 2.3/3 could equally be attributed to
anisotropy.
144

Longworth and Driscoll (1991) through finite element modelling of a 46m
high cutting in chalk found that the field observations of ground
displacements measured during excavation could only be achieved when the
pre-excavation horizontal stresses were assumed to be zero. This does not
seem unreasonable since the chalk at this locality was dominated by open
vertical joints despite the arguments that could be raised concerning the
inability of the finite element method to properly model a discontinuous rock
mass.
Discontinuity patterns in the chalk often make the rock mass anisotropic
(Nunn et aI, 1983, Toynton, 1983). Since discontinuities are an important
factor controlling mass compressibility such anisotropy is likely to give rise to
mass modulus anisotropy. This may be significant in weathered chalk since
the frequency of sub horizontal joints is often greater than that of vertical or
steeply dipping joints. In such a case the initial modulus in the horizontal
direction Eih is likely to be greater than that in the vertical direction E iv•
Theoretically the pressuremeter is the best method for determining the
stiffness parameters for a soil or rock mass since within the test zone all
elements of ground strained will follow similar stress paths. This means that
stiffness parameters can be determined directly from the pressuremeter data
without the need to make use of any assumptions. However, as has been
mentioned in practice there are some disadvantages in using the
pressuremeter, particularly in the chalk. These inc1ude:-
(i)
(ii)
Drilling a hole in preparation for a MPM test will cause
mechanical disturbance of the ground within the test zone and
the resulting stiffness values measured are likely to be lower
than the true values.
Both the conventional self-boring pressuremeter and the rock
pressuremeter will have difficulty in forming suitable test
pockets in chalk containing flint nodules. Indeed it is unlikely
145

that these devises would be able to penetrate the thick tabular
flints found in some horizons within the Upper Chalk.
(iii) In chalk with moderate to widely spaced discontinuities it is
unlikely that a representative volume of the rock mass is tested
using any of the pressuremeters described above.
(iv) The stress applied to the ground from a typical pressuremeter
test is in the wrong direction to adequately simulate that
applied by a foundation. Only in isotropic materials will the
pressuremeter provide meaningful data for the prediction of
foundation settlement. The discontinuity patterns in chalk,
particularly near the ground surface, impart a high degree of
anisotropy to the rock mass.
Plate Load Tests
The plate loading test can be considered the earliest application of in-situ
testing for the evaluation of soil deformability. It is particularly useful in
materials such as fill, boulder clay, hard fissured clays and weak rocks which
cannot be explored by any other in-situ techniques with the exception of
geophysics. Plate loading tests represent the best method for providing mass
compressibility parameters in weak rock. Although expensive such tests afford
the greatest degree of similitude between the test and the field prototype.
The interpretation of the plate loading test however is complicated by the
fact that the rigidity and geometry of the plate results in different elements of
ground beneath the plate following different stress paths. This results in
problems extrapolating from the test scale to that of a full scale foundation.
Plate loading tests may be carried out in shallow pits or in a borehole. The
test involves loading a circular plate (rectangular or square plates are also
used) and monitoring the settlement. Techniques for carrying out these tests
are described by C.P. 2001:1957, Burland and Lord (1970), AS.T.M. Dl194-
146
72, Tomilinson (1975) B.S.5930:1981, Clayton et al. (1982) and B.S.1377:1990
(Part 9). In the test the soil or rock surface to be tested is carefully cleaned
by removing all loose and softened material and the plate is bedded into this
surface using sandi cement mortar or plaster of paris. The cleaning operation
is of particular importance as any loose compressible material left on the test
surface will lead to errors in the determination of initial modulus E j •
Adequate cleaning may be difficult or impossible when tests are carried out
down a borehole.
Load is applied to the plate via a load cell and a hydraulic jack. The jack
may bear against beams supporting kentledge or reaction may be provided by
tension piles or ground anchors installed on either side of the load position.
In weak rocks such as chalk tension piles are necessary if it is intended to
study the post-yield behaviour with an 865mm or larger diameter plate.
When using tension piles it is important that they are positioned outside the
zone of influence of the plate and hence do not influence the results.
B.S. 1377: 1990 recommends that tension piles should not be positioned less
than three times the plate diameter from the centre of the plate. The manner
and rate at which the load is applied to the plate gives rise to two categories
of test:
(i) Constant rate of penetration test (CRP)
The load is applied in a controlled manner such that the selected rate
of penetration is uniform and continuous. The rate of penetration in
CRP tests carried out on the chalk at Luton was 2.5mm per minute
(Powell et al. 1990). At such rates only the undrained or immediate
settlement behaviour is obtained.
(ii) Maintained incremental load test (ML)
The load is applied in a series of discrete increments with a certain
time interval between the application of each increment. Burland and
Lord (1970) suggest that in tests on chalk the time interval between
increments may be based on the rate of settlement. Burland and Lord
147

adopted a settlement rate of 0.005mm per half hour (0.0002mm/min).
The time interval between loading increments was never less than 15
minutes. Clayton et al. (1982) recommend a rate of settlement of
O.004mm per minute. Since the chalk exhibits time-dependant
settlement characteristics the values of Ei and Ey will be influenced by
the time interval between loading increments together with the
magnitude of the increment. The creep rate in chalk is more
significant at stresses above the yield stress and hence the value of Ey
is likely to be influenced more by the interval between loading
increments than Ei . At stresses below the yield stress, Burland and
Lord's rate of settlement is generally achieved within 24 hours (Powell,
1990).
Settlement of the plate is measured using dial gauges or linear displacement
transducers. In order to measure any tilt Clayton et al. (1982) suggest using
four gauges on the perimeter of the largest plate. These instruments are
normally supported on rigid uprights driven (or grouted) firmly into the
ground at a distance of at least twice the plate diameter from the plate
centre. A reference beam for mounting gauges should be adequately
protected from temperature changes. When the test is conducted down a
borehole the vertical settlement of the plate is transferred to the ground
surface by an invar tape reference system described by Ward et al. (1968).
When the test is performed in a shallow pit the settlement of the plate may
be monitored using precise levelling using deep bench marks situated outside
the zone of influence of the plate. Clearly the time taken to perform a round
of levels is such that this technique is unsuitable for CRP tests.
It was noted in section 2.2 that the mass compressibility of fractured chalk is
sensitive to plate diameter. Clayton et al. (1982) suggest that as a general
rule of thumb the plate diameter should never be less than either six times
the maximum soil particle size or six times the maximum intact block size.
B.S.1377:1990 recommends for plate tests on fissured clays that the plate
should be more than five times the average block size. Lake and Simons
148

(1975) suggested the use of a 600mm dia. plate on chalk which had an intact
block size in the range 50-100mm, based on predicted and observed
settlements of a building at Basingstoke, England. Although the plates used
on the chalk in the U.K. range in diameter between 140mm and 1710mm the
preferred size is 865mm. Recently plate loading tests carried out for the
foundations of the new Dartford bridge a 300mm diameter plate was used.
Such a small plate would underestimate the mass compressibility of all but
the most weathered chalk.
Typical results of a plate loading test on chalk are shown in Fig. 2.2/18. The
stiffness of the chalk as determined from the data presented in Fig. 2.2/18 is
given by the equation for a uniformly loaded rigid punch on a semi-infinite
elastic isotropic solid, ie.
where:
E = rcqDp (l-v 2)
4 Pp
E = elastic modulus r
q = applied pressure between the plate and the ground
Dp = plate diameter
v = Poisson's ratio
Pp = settlement under the applied pressure q
When calculating Ey the origin for the applied pressure q is taken at the yield
stress qy (see Fig. 2.2/18).
149

If the plate is considered as flexible then the equation becomes:
or
where: Pay =
Pcentre -
E = O. 844qDp
(1-v2
)
Pav
E = qDp (1-v2
)
Pcentre
average settlement under the applied load q.
settlement at the centre of the plate under the
applied load q.
In the case of a rigid plate P av = P centre' If average settlements are considered
the ratio Eflex:Erigid = 1.08: 1 whereas for settlement measured at the centre
the ratio is 1.27:1. Clearly, since the rigidity of the plate cannot be
guaranteed (particularly with large diameter plates) it is preferable to
determine average settlements from a number of settlement measurements
made at different positions and different distances from the centre of the
plate.
For intact chalk the value of Poisson's ratio is normally between 0.25 and
0.30 at stress levels of 50% of the uniaxial compressive strength (Bell et al.
1990). Bell et al (1990) found that the value of Poisson's ratio increases with
increasing stress level. Table 2.3/2 gives average values of Poisson's ratio at
different stress levels for intact Upper Chalk from Kent. This extends the
overall range to between 0.1 and 004. Clearly the influence of this range of
values on th~ term (1 - v2) will be relatively small and hence will have a
negligible effect on the modulus (Schneider, 1967). Bell et al. (1990) tested
chalks with a relatively wide range of porosities (24 to 47%). Measurements
of Poisson's ratio as part of this study suggest that it is not related to porosity,
150

Table 2.3/2 Values of Poisson's Ratio determined from unconfined
compression tests (from Bell et al., 1990)
% ac Average Poisson's Ratio
7.0 0.170 21.3 0.270 28.4 0.273 42.5 0.293 56.7 0.310 70.9 0.343 81.5 0.367
The above equations assume that the rock mass is an elastic continuum,
whereas in reality it is a dis continuum comprising both elastic and non-elastic
components. This assumption will clearly lead to errors in the determination
of moduli from the plate loading tests when these equations are employed
(Schneider, 1967).
Since E is obtained from load-displacement measurements, an a priori
assumption regarding the constitutive model is necessary. In most cases the
elastic model described above is employed in which homogeneity is assumed.
Chalk, however, often displays a steady increase in modulus with depth
mainly as a result of a decrease in weathering. This non-homogeneity imposes
a serious limitation on the interpretation of plate loading tests if homogeneity
is assumed in conjunction with surface settlement measurements. The effect
of non-homogeneity depends on the ratio Eo/k1 and the diameter of the plate
or foundation. It is not possible from the measurements of plate settlement
alone to determine Eo and k (Hillier, 1992). Since plates of increasing
diameter will stress the ground to greater depths the effect of non
homogeneity cause the average E determined from plate settlements to be
sensitive to the plate diameter even when it exceeds the average block size by
1 Eo = surface modulus, k = the rate of increase in E with depth
151

some 5 or 6 times. This sensitivity of observed load-settlement behaviour to
plate size has been observed in the results of plate loading tests reported by
Lake and Simons (1975) and Hodges (1976). It appears that Eo and k may
be determined from the results of a suite of plate loading tests in which
plates of various diameters are used. Lake and Simons (1975) presented the
results of plate loading tests carried out with different plate diameters ( 0.3,
0.61 and 0.91m) in chalk at Basingstoke, Hampshire. Hobbs (1975) used these
data to determine Eo and k (Eo = 97 MPa, k = 19 MPa/m). However the
results from the 300mm diameter plate are considered unreliable since the
plate diameter is close to the average joint spacing (50 to 200mm). An
alternative to using plates of different diameter is to use a single plate at a
number of different depths in order to determine a profile of modulus with
depth.
These techniques for determining Eo and k all involve performing a number
of plate loading tests, which will prove expensive. An attractive alternative is
to make measurements of settlement at a number of discrete points below
the centre of the plate (Marsland & Eason, 1973) or on the ground surface
around the plate (Rocha Filho et aI, 1987). An underplate settlement
measurement system has been developed by BRE (Marsland and Eason
1973) to investigate the effects of bedding disturbance and expansion of the
soil on load-settlement behaviour of large diameter plates. The system allows
the settlement at 4 points beneath the plate (set at 150mm in a 38mm
diameter axial borehole) to be recorded via a transducer system housed in
the plate (see Fig. 2.3/4). In this way the settlement distribution beneath the
plate may be measured and the corresponding vertical strains calculated. A
typical set of pressure settlement curves is shown in Fig. 2.3/5.
In order to determine modulus values from underplate strain data, it is
necessary to assume a distribution of total stress beneath the centre-line of
the plate. An axially symmetric stress system may be considered for the
ground between each pair of measuring points. From a suitable starting point
152

(eg the vertical overburden pressure), the (secant) Young's modulus for each
element of ground can be calculated from:
where:
Aav = assumed change in vertical stress
A a h = assumed change in horizontal stress
A €v = change in vertical strain
v = Poisson's ratio
For most chalks it is reasonable to assume v = 0.25, Hence:
However were the vertical and sub-vertical joints in chalk are open it is likely
that Ka approaches zero (Longworth & Driscoll, 1991). This implies that
there are no horizontal stresses transmitted through the rock mass and hence
a change in vertical stress will not bring about a change in lateral stress. In
such a case were A a h = 0, E will be given by:-
This condition is only likely to be true whilst the sub-vertical joints remain
open. The rock mass will therefore behave as a series of columns. As the
vertical stresses are increased, these columns are likely to yield of fail
153

resulting in the development of horizontal stresses. In such a case the above
condition is no longer valid.
At the simplest level the stress changes can be estimated on the basis of
solutions available in the literature for perfectly elastic materials and
idealised geometries. However finite element analysis of plate loading tests
carried out by Hillier (1992) indicates that serious errors in modulus arise if
underplate strain measurements are made within half a plate diameter of the
underside of the plate, (Fig. 2.3/6) when such a simplistic approach is taken
for the determination of the stress changes. It will be seen from Fig. 2.3/6
that for a typical 865mm diameter plate the BRE underplate device will yield
values of modulus that are < 10% in error (at load factors < 0.25) for only
the two deepest elements of ground under consideration. The errors in the
determination of E for the two elements nearest the plate will give rise to
significant errors in the determination of Eo and k. For large diameter plates
a longer underplate settlement measuring device than that currently used by
BRE is required. The use of longer devices may present problems for
installation in chalk particularly when flints are abundant.
It was shown in section 2.2 that the stress distribution beneath the plate will
be influenced by both the orientation and persistence of the joints. Model
tests on jointed rock masses all show that the stress distribution beneath the
loaded area is significantly different to that based on an elastic continuum. In
a real rock mass such as the chalk the situation is further complicated by the
fact the style of jointing (orientation, persistence and aperture) often changes
with depth. It is arguable, therefore, that the stress at a given point below the
plate cannot be predicted with any accuracy, and this casts doubt on the
validity of modulus determinations from sub-plate deformation
measurements. These arguments concerning stress distributions in jointed
rock will apply equally to the interpretation of pressure meter data and
instrumented foundations.
154

Rocho Filho et al. (1987) proposed a method of determining Eo and k from
the form of the distribution of vertical surface settlement outside the area
loaded by a circular rigid plate. The form of the surface settlement depends
upon the degree of inhomogeneity and Poisson's ratio. Thus when Poisson's
ratio is known the ratio of Po (the settlement at a given radius outside the
plate) to Po (the settlement inside the plate) will lead directly to a value of
Eo/kDp, where Dp is the diameter of the plate. Eo can be determined from
the magnitude of the plate settlement for a given loading increment.
Rocho Filho et al.'s method is based on elastic theory and uses the numerical
model developed by Brown and Gibson (1972). This model assumes an
elastic continuum. The rock mass, however, is not a continuum, and the form
of the distribution of surface settlement will depend to a large extent on the
geometry of t?e discontinuities (Hungr and Coates, 1978).
The variation in modulus with depth may be determined from a series of
plate tests carried out in a borehole at different depths. However the method
has the following limitations:
(i)
(ii)
The maximum depth will be limited by the position of the water
table since the base of the hole requires minimal disturbance
and careful preparation.
The maximum size of plate will be limited and hence the test
data may not be representative of the rock mass.
(iii) The accuracy of the modulus-depth profile will be limited if the
modulus increases rapidly with the zone of influence of the
plate.
Accurate settlement predictions of full scale structures based on plate loading
test data requires knowledge of the modulus depth profile. The average E
derived from surface measurements of plate settlement alone can give rise to
155

significant errors in settlement predictions when the ground is non
homogeneous. If the plate is the same size as the foundation or the ground
has a uniform stiffness such errors do not arise. In making settlement
predictions it is sometimes assumed that:-
Where
Pc = settlement of foundation
Pp = settlement of plate
Be = width/diameter of foundation
Bp = width/diameter of plate
a = empirical factor
The empirical factor a may be determined from tests with different size
plates. However Hobbs (1975) shows that except at values of a approaching 1
for relatively small foundations the above equation does not adequately
model the condition of steadily increasing modulus with depth, which is the
only condition apart from homogeneity in which this procedure can be
realistically applied.
Plate loading tests may be used to measure the creep behaviour of the rock
mass. However these tests by there very nature are time consuming and
hence expensive. When considering the measurement of creep settlement the
accuracy and stability of the displacement measuring system becomes
crucially important. Large diurnal temperature variations (which can be as
much as 20°C in the UK) combined with high winds cause great difficulty in
achieving stability, particularly using electronic instrumentation. In order to
achieve reliable measurements of creep over long periods of time it is
necessary to thermally isolate the measurement system or devise a suitable
method of compensating for the effects of changes in temperature. The use of
precise optical levelling may overcome the temperature effects to a large
extent but suffers from stability problems in high winds and a lack of
156

resolution. Resolution is a particular problem in attempting to accurately
measure settlements at stress levels below yield. The transducer systems used
by BRE and described by Ward et al. (1968) and Burland and Lord (1970)
are capable of providing sufficient resolution but suffer from temperature
instability. This can produce significant errors when the settlements measured
are very small. The result is that it is very difficult to obtain reliable time
dependent settlement data at low bearing pressures (ie <300kPa).
Geophysics
Geophysics provides a number of indirect methods of determining ground
stiffness. Such indirect methods do not involve the direct measurement of
stress and strain but make use of mathematical relationships to determine
stiffness parameters such as E and G. Geophysics makes use of variations in
the physical properties of the ground. Since the propagation velocity of
seismic waves through the ground is related to density and elastic constants
seismic techniques are most appropriate for determining stiffness.
Geophysical methods such as the measurement of longitudinal and shear
wave velocities by down-hole and cross-hole techniques are of relevance to
the measurement stiffness in soils and weak rocks (Miller et al. 1975, Bodare
and Massarsch, 1982). These measurements also provide an insight into the
stress-strain behaviour the ground at low strains (y ~ 10-5%). The design and
evaluation of structures for earthquake excitation has prompted increased use
of seismic field studies to determine in-situ moduli at low strain levels. The
stiffness of rocks and soils determined from seismic methods are frequently
significantly greater than those determined from monotonic loading tests in
the laboratory. Recent research however has shown that intact soil
specimens are much stiffer at small strains (€ = 0.001%) than at larger
strains measured with conventional laboratory instrumentation (ie € = 0.1 -
10%) (Jardine et aI., 1984, Jardine et al. 1985). Fig 2.3/7 shows a typical
relationship between secant modulus and strain. The maximum strains which
have been observed in the ground adjacent to full scale structures are often
157

at the bottom end of the range of resolution for conventional laboratory
instrumentation and in many cases the working strains are at least an order
of magnitude less than that which can be measured by conventional means
(see Fig. 2.3/7).
Due to the small strains associated with the propagation of seismic waves
only the initial modulus (Ei) for chalk may be determined with geophysics.
The fact that seismic techniques are unable to give any indication of the yield
stress or yield modulus may be considered a serious disadvantage. However
this should be set against the fact that a profile of Ei with depth can be
provided relatively rapidly, and for a representative volume of ground.
Moreover some seismic methods do not necessitate the use of boreholes.
The small-strain moduli are estimated from determinations of P and S wave
velocities taken together with the in-situ assessed bulk density and Poisson's
ratio. Table 2.3/3 lists the principal types of elastic wave and how the
propagation velocity is related to elastic modulus.
It will be seen from Table 2.3/3 that the determination of Young's modulus,
E, from the P wave velocity, Vp' requires Poisson's ratio to known for the
rock/ soil mass. Since this is a difficult parameter to measure in-situ it is often
estimated. The determination of E becomes impossible when v = 0.5, a
typical condition in near-surface saturated ground. It is therefore more
attractive to measure the S wave velocity V S' since the relationship between
shear modulus G and Vs does not involve Poisson's ratio and G is the same
for both drained and undrained loading (Grainger et al., 1973).
There a number of different seismic techniques that are used to obtain a
modulus depth profile in soils and rocks. These methods include:
158

-" V1 ~
Table 2.3/3 Principal types of elastic wave
Wave Designation Remarks Propagation velocity
Compressional, dilational P Particle motion in direction of propagation. Vp2 = E(l - v)/p(1 - 2v)(1 + v)
(infinite medium)
Distortional, shear S Particle motion normal to direction of propagation. V/ = G/p
Vertically polarized SH
Horizontally polarized SV
Rayleigh wave R Retrograde elliptical motion at surface. Vr = C*Vs
(C = constant which depends upon Poisson's ratio v)
Love wave L Particle motion normal to direction of propagation in Short A: Vt = (G/PtY'~ plane of interface. Long A: V2 = (Gip2)~
Stonely wave (generalised Rayleigh Surface wave in elastic half-space where two layers O.988Vs wave) have similar shear wave velocities.
V p = propagation velocity of P waves, Vs = propagation velocity of S waves, Vr = propagation velocity of Rayleigh waves, E = Young's modulus, G = shear modulus, v = Poisson's ratio, p = bulk density, A = wavelength, subscripts 1 & 2 refer to layer numbers.

(i) Seismic Refraction
(Grainger et aI., 1973, Abbiss, 1979)
The conventional surface refraction survey is performed using an
impact or explosive energy source in conjunction with a multiple array
of geophones (Fig. 2.3/8). Transit times between source and detector
are provided by a suitable seismograph. These are interpreted by
plotting the transit time against the distance from the energy source
for each geophone. Both compressional and shear waves may be used
to determine the P and S wave velocities respectively. P waves only
have limited use in soils and in such cases S waves are used. The
elastic moduli are determined from the seismic velocities. Typically the
seismic refraction method will allow the ground to be divided up into
layers each having a characteristic P and S wave velocity. Unless the
survey is designed carefully the resolution in terms of a modulus depth
profile will be coarse giving average modulus values for relatively thick
layers. The method will only detect layers when the velocity increases
with depth. In the case of a highly compressible material underlying a
much stiffer material the compressible material will not be detected
since its velocity will be less than that of the overlying layer.
(ii) Crosshole
(Thompson et aI. 1993)
Crosshole surveys are carried out using two or more boreholes (Fig.
2.3 /8). The boreholes are cased with plastic casing which is grouted in
place to provide good acoustic coupling between the borehole and the
ground. A seismic source is placed in one of the boreholes and a
receiver in another at a known elevation (see Fig. 2.3/8). The transit
time for seismic waves to travel between source and receiver is
measured with a suitable seismograph. By measuring the transit times
at different elevations a modulus depth profile can be built up. Both P
and S waves may be used for crosshole surveys although S wave
surveys are more common. P waves are generated using a sparker and
160

are detected using hydrophones in water filled-holes. S waves are
generated using a hammer clamped against the casing and are
detected with clamped three component geophones. The conventional
S-wave hammers produce vertically polarized shear waves together
with compressional waves. In order to determine accurately the transit
times it is necessary to trigger in seismograph and the energy source
simultaneously. This is not always possible particularly with
conventional S wave hammer sources. In such circumstances two
receiver boreholes are required such that transit times can be
measured between receivers instead of between source and receiver.
(iii) Uphole/Downhole
(Sigismond et al. 1983)
In this type of survey the transit times of P or S waves are travelling
between points in a borehole and a point on the ground surface near
the top of the hole are measured (see Fig. 2.3/8). The terms uphole
and downhole refer to the general direction in which the seismic waves
are travelling (eg uphole refers to an energy source located in the
borehole and the receiver located on the ground surface). Velocities
may be determined from a plot of depth against transit time. The
downhole method is used in preference to the uphole method since a
more powerful energy source can be used (without the possibility of
damaging the borehole wall) and the seismic noise is less at a
downhole detector. The seismic waves used in this type of survey
travel in a near vertical direction.
(iv) Surface-Waves
(Abbiss, 1981)
Surface-waves (Rayleigh waves) are generated by a controlled
vibratory energy source. The surface waves are detected by a series of
geophones placed in line with the vibrator (Fig. 2.3/8). The time-
161

domain data collected by the geophones is converted to the frequency
domain using a Fast Fourier Transform. The frequency domain data is
used to calculate the phase velocity and the wavelength of the surface
wave. By collecting data over a range of frequencies (typically 5 to
200Hz) it is possible to build up a velocity depth profile. If Poisson's
ratio is known it is possible to determine the shear wave velocity from
a Rayleigh wave velocity. Thus a shear wave velocity-depth profile can
be obtained which can be easily converted to a shear modulus-depth
profile. A comprehensive description of the field techniques, data
processing and interpretation for continuous surface-wave surveys is
given in Chapter 4.
In most cases the seismic velocities are determined from transit times
measured between the energy source and receivers and the distance travelled
by the wave between source and receiver (not always a straight line). In the
case of conventional seismic refraction, cross-hole and down-hole surveys, the
source imparts a pulse of energy into the ground and hence the pulse velocity
is determined. In the case of surface-wave surveys a continuous vibratory
source is employed. The seismic velocity in this case is determined from the
phase difference between neighbouring receivers. The velocity determined is
a phase velocity which may not have the same magnitude as the equivalent
pulse velocity.
Seismic refraction was used in an attempt to correlate degree of fracturing
with P-wave velocity at Mundford, Norfolk by Grainger et ale (1973). Since
the Mundford site had been subjected to a comprehensive sub-surface
investigation which included the visual inspection of the chalk at different
depths as well as in-situ stiffness determinations (from plate loading tests)
there was ample ground truth to correlate with seismic measurements. A total
of 10 seismic refraction lines were employed over the whole site with 5
located in the vicinity of the tank loading test. The interpretation of the
seismic data together with ground truth data are shown in Fig. 2.3/9. It will
be seen that the seismic refraction survey clearly shows that the velocity
162

increases with depth in well defined steps, which broadly correspond to the
classification system adopted by Ward et al. (1968) which is based primarily
on fracture spacing and aperture. This is generally the case for the other 9
seismic lines. It should be pointed out that since the refraction survey was
designed to give a depth of penetration of 30m it was impossible to
adequately resolve the drift deposits from the highly disturbed grade V chalk.
Hence the correlation with ground truth in these upper layers is not good
(see Fig 2.3/9).
It seems entirely reasonable that the P wave velocity should be influenced by
the degree of fracturing in the rock mass since the acoustic coupling across
fractures will be poor (Wyllie et al. 1956) thus reducing the seismic velocity.
This effect, however, is markedly reduced by the introduction of water into
the fractures. The P wave velocity in intact porous rocks is almost constant
over a wide range of saturations (about 10-95%). Grainger et al. (1973) found
that the seismic interpretation was unaffected by the position of the water
table when the fracture spacing was greater than 60mm. However in the
structureless grade V chalk they found that the velocity was raised from
700m/s to 195Om/s, by saturation. This material tends to comprise blocks of
intact chalk in a groundmass of remoulded (putty) chalk. The skeleton of this ,
material is highly compressible and hence behaves like a soil. When a soil of
low permeability is loaded it experiences no change in effective stress in the
short term if confined. A compressional wave propagating through a soil will
subject the soil to a similar undrained loading even in soils of relatively high
permeability. Since the applied loading will be carried by the excess pore
water pressure and not by the soil skeleton the seismic wave will tend to
propagate through the pore water. The velocity of such a P wave will be
strongly related to the velocity of water (150Om/s) and not to the density and
stiffness of the soil skeleton. This is a serious limitation to the use of P waves
it compressible porous media such as soils. It is because of this limitation that
S waves are now used extensively for the seismic investigation of such
materials.
163

The seismic studies carried out at the tank site comprised a P wave refraction
survey. Abbiss (1979) carried out seismic refraction survey at the tank site
specifically to determine the variation of stiffness with depth. A typical time
distance graph from this survey is shown in Fig. 2.3/10. The time distance
graph shows a continuous curve indicating a continuous increase in P wave
velocity with depth. Such data can be interpreted by fitting an inverse sinh
function to it which corresponds to a linear increase in velocity with depth
(Dobrin, 1960). Such an interpretation has yielded the dynamic moduli shown
in Fig. 2.3/11. It will be seen from Fig 2.3/11 that there is a linear
relationship between the dynamic moduli derived from the refraction survey
and the short-term static moduli deduced from the tank loading test such that
Estatic = 0.4 7Edynamic.
The time increment for each stage of the tank test was several orders of
magnitude greater than the time for each strain excursion associated with the
propagation of a compressional wave through the rock mass. Since the chalk
is known to display time dependent characteristics it seems reasonable that
the deformations measured in the tank test will be more influenced by time
than those associated with the seismic refraction survey and the latter would
be expected to yield the higher modulus. This assumes that the modulus is
independent of strain. Since it generally accepted that the modulus reduces
with increasing strain, this difference in strain level between the static and
dynamic tests could contribute to the difference in moduli. The difference in
frequency between the static and dynamic tests could also influence the
elastic moduli derived from each (Abbiss, 1979). The dynamic moduli
obtained from the seismic refraction survey' when converted to equivalent
static values using the relationship obtained from Fig 2.3/12 show good
agreement with the moduli derived from the tank test. This suggests that the
dynamic stiffness values derived from seismic velocity measurements must be
reduced by an appropriate factor in order to provide equivalent static values
that will not significantly underpredict foundation settlements.
164

Borehole seismic methods have been used to obtain modulus-depth profiles
in many rock types including weak mudstones (Thompson et al. 1993) and
chalk (Sigismond et al. 1983).
Sigismond et al. (1983) present the results of cross-hole and down-hole tests
in chalk which were performed for the site investigation for a power station
in Nogent-sur-Seine, France. Fig. 2.3/13 shows the shear modulus depth
profiles derived from of cross-hole and down-hole shear wave surveys. It will
be seen that the moduli determined from the different surveys show
reasonable agreement below 20m depth. This suggests that the rock mass
does not display a high degree of anisotropy. Above 20m in the putty chalk
and overlying alluvium the two types of survey yield distinctly different
moduli values for a given depth. This may be due to anisotropy. The authors
reported problems in interpreting the cross-hole data within the putty chalk
(10-16m) due to refraction in the overlying and underlying layers which both
have a higher velocity. ,
Below 20m in Fig. 2.3/13 the shear modulus is seen to increase with depth
from 2000MPa at 20m to 3000MPa at 80m. Such an increase in modulus in
chalk would normally be attributed to a reduction in the frequency and
aperture of discontinuities with depth.
Surface-wave techniques offer an attractive alternative to the above method
for obtaining a modulus-depth profile. The main attraction is that a profile of
shear modulus with depth may be determined rapidly without the need for
boreholes.
Geophysics measurements are made at shear strains of about 10-5%. To
obtain assessments of shear moduli at higher strain levels a strain-dependent
moduli model needs to be used. Of the several models that exist that by
Hardin and Drnevich (1972) has been found to be the easiest to use. Powell
and Butcher (1991) used this model to compare results of direct
(pressuremeter, plate, triaxial) tests with indirect (refraction, surface-wave
165

and laboratory piezobender) for a number of different soil types including
glacial till, heavily overconsolidated clay and soft clay.
The Standard Penetration Test
The standard penetration test is perhaps the most common in-situ test used
in the UK It is common practice to include standard penetration tests in
almost all subsurface investigations in soil and weak rock. The test involves
measuring the number of blows necessary to drive a standard penetrometer
through a given distance (300mm) into the base of a borehole using a
standard mass falling through a given distance. Since there is likely to be
disturbed material in the base of the borehole it is standard practice to drive
the penetrometer 150mm before the main drive described above commences.
The number of blows required to drive the penetrometer the standard
distance in the main drive (30Omm) is referred to as the SPT 'N' value. The
test is described in detail in BS 1377:1975 & 1990.
The SPT may be carried out in accordance with BS1377:1975 using a
standard split spoon sampler tool in most soils or a solid 600 cone for use in
gravels or gravelly sand. However BS5930: 1981 extends the use of both the
split spoon and solid cone to rock despite the fact that contractors have been
carrying out standard penetration tests with both types of tool for many years
prior to 1981. Where flints are likely to be encountered in the chalk,
contractors are likely to use the solid cone since flints can cause considerable
damage to the shoe of the split spoon sampler. Neither British Standard
requires the contractor to state the tool used in the test. It is likely that the
SPT N value is effected by the tool used. Montague (1990) compared the
results of tests performed in chalk with both types of tool. Variations of the
order of 2:1 were identified between Nsolid cone and Nsplit spoon at common
depths at the same site. Little work appears to have been done to ~vestigate
the influence of the type of tool on the N value.
166

The popularity of this tests has led to a wide variety of empirical methods
which permit the prediction of strength and stiffness for soils and weak rocks.
The nature of the tests lends itself more to the measurement of strength than
that of stiffness. A number of correlations between 'Elastic Modulus' and SPT
'N' value have been proposed for the chalk over the past 30 years. Most are
based on moduli determined from plate loading tests and very few on the
performance of full scale structures (Wakeling, 1966, Wakeling, 1970, Lake
and Simons, 1970, Kee and Clapham, 1971, Powell et al. 1990). All should be
treated with caution.
It seems reasonable to assume that the penetration resistance of intact chalk
may be related to the intact porosity. Since the mechanical properties of
intact chalk are controlled largely by the intact porosity a good correlation
may exist between the SPT 'N' value and the intact stiffness of chalk. If the
intact strength (which is related to intact stiffness) of chalk influences the
compressibility of the rock mass, then the SPT 'N' value may reflect mass
compressibility where the joint frequency is sufficiently small.
Wakeling (1966) produced a tentative correlation between SPT 'N' value and
'Elastic Modulus' for soft chalk (Fig. 2.3/14). This correlation is based on
only three values of modulus obtained from field tests:-
a pile test (Newbury),
a large foundation (Medway Bridge)
and a plate loading test (Norwich).
Such a correlation is indeed tentative when the background to each case is
considered (see Table 2.3/4). Although Wake ling was careful to take account
of the depth of the foundation in the determination of the modulus he was
unaware of the influence of the size of the loaded area in relation to joint
frequency, on modulus. Tomlinson (1966) raised this point in the discussion
of Wakeling's paper. In the case of the plate loading tests carried out at
Norwich the plate was too small to yield any meaningful results. In the case
167

.... O'l 00
Table 2.3/4 Basis of Wakeling's tentative correlation between SPT 'N' and elastic modulus (from Wakeling 1966)
Site
Newbury
Medway Bridge
Norwich
Foundation
Underreamed pile. Shaft Dia. 1372mm, underream Dia. 2591mm.
Bridge pier foundation. 9.5m • 32.3m
Deep plate-bearing test. Plate Dia. 140mm. 23 tests carried out at 1.5m intervals to a depth of 12m in 4 boreholes.
Equivalent modulus (MPa)
138 at 300 tonnes. Calculated assuming all the load was taken on the base of the pile.
207
117 (average from 23 plate tests)
SPT details
SPT 'N' values from two boreholes increased with depth, particularly below the base of the pile .
No Standard Penetration Tests carried out. SPT 'N' values were estimated by comparing the moisture contents at this site with those prevailing at Newbury and Norwich.
Tests carried out to a depth of 12m in all 4 boreholes. Chalk displayed a uniform penetration resistance with depth.

of the Medway Bridge no SPT 'N' values were measured. SPT 'N' values
were interpolated from those measured at Norwich and Newbury on the basis
of moisture content and obviously the validity of this approach is
questionable (Rodin, 1966). With regard to the pile test at Newbury since
shaft resistance was ignored it is likely that the modulus has been
overestimated.
Wakeling carried out standard penetration tests at Mundford and was able to
improve the correlation discussed above by making use of the moduli derived
from the plate and tank loading tests described by Ward et al. (1968). The
SPT data used by Wakeling came from 4 boreholes, advanced by light
percussion boring, located adjacent to the tank loading test and plate loading
tests T3 and T4. The correlation between SPT N value and modulus is shown
in Fig. 2.3/15. The values of modulus were interpolated since the level at
which they were measured did not correspond to the level of the SPT results.
The two lines A and B shown in Fig. 2.3/15 relate to values of Ey and Ee
respectively. It will be seen from Fig. 2.3/15 that the data used by Wake ling
to support line A is influenced by the incorporation of data from plate tests
in small-diameter boreholes, which are known to be unrepresentative in chalk
due to scale effects and base disturbance.
Lake and Simons (1970), inspired by the tentative correlation between SPT N
value and modulus proposed by Wakeling (1966), developed another
correlation based on 140mm diameter plate loading tests in chalk on the M4
at Welford Theale, Berkshire. This correlation is shown in Fig. 2.3/16
together with that of Wakeling (1970). The plate loading tests were
conducted at depths between 4 and 20m in boreholes advanced by light
percussion boring methods. In order to minimise disturbance a conventional
auger was employed to advance the hole when within 305mm (1ft) of the test
level. At the test level a specially made flat bottom auger was used to trim
and clean the base of the hole. The method used may reduce mechanical
disturbance of the chalk at the test level, but in such small diameter holes it
is impossible to clean the base of the hole adequately and hence the results
169

of these tests will be affected by base disturbance. The plate loading tests
were of the constant rate of penetration type and the rate (1 to 2 nun/min)
was such that the initial modulus Ei could not be determined.
Kee (1968) initially re-analyzed the data used by Wake ling (1966) and
suggested a correspondingly lower correlation between the modulus and SPT
N value. Kee and Clapham (1971) modified this relationship (see Fig. 2.3/16)
on the basis of a number of 200nun diameter plate tests carried out in
boreholes, and the analysis of data from two case histories, Tomlinson (1966)
and Palmer (1966). Tomlinson (1966) gave the results of 143nun diameter
continuous rate of penetration plate loading tests for Addenbroke's Hospital,
Cambridge and Palmer (1966) discussed the results of a 445mm diameter
plate loading test at Purfleet, Essex.
The correlations proposed by Lake and Simons (1970) and Kee and Clapham
(1971) should be treated with caution since both are based on small diameter
plate loading tests. The use of small diameter plates (in general < 865mm)
are known to be unrepresentative in chalk for reasons outlined earlier. Powell
et al. (1990) proposed a correlation based on 865mm plate loading tests and
the back analysis of a full-scale foundation at Luton, Bedfordshire. This r
correlation represents a lower bound of moduli based on settlements of 0.5 %
of the plate diameter and gives modulus values which are generally higher
than Lake and Simons and Kee and Clapham.
Ward (1970) emphasised the fact that the SPT values for all varieties of chalk
seem to vary by only 3 or 4 times and correspond to a variation in E values
of some 100 times. Ward concluded that the SPT cannot therefore provided a
sensitive index of the elastic modulus. This results from plotting the moduli
on a logarithmic scale. Wakeling (1966) introduced the logarithmic scale in
the first correlation between modulus and SPT N value in order to display
the wide range of moduli values. The logarithmic scale was again adopted
Wake ling (1970) for his interpretation of the data from Mundford. Certainly
the Mundford data would appear to justify the use of a logarithmic scale for
170

Young's modulus. This led other workers (Lake and Simons, 1970, Kee and
Clapham, 1971 and Powell et al. 1990) to adopt the same approach even
though the range of modulus values is much less than those observed by
Wakeling.
Stroud (1988), recognising that both stiffness E and N vary with mean
effective stress for soil, proposed that the ratio E/N60 should be considered
together with its variation with strain level or degree of loading by the ratio
q/qult" The parameter N60 used by Stroud is the SPT N value corrected for
60% of the free fall hammer energy (Clayton, 1990b). The variation of E/N60
with 'bet/q(ult)u for the Chalk is summarised in Fig. 2.3/17 based on available
data from in-situ loading tests of shallow foundations, piles and large plates.
'bet represents the average net effective bearing pressure. Values of q(ult)u for
weak rocks and chalk were determined using bearing capacity factors and the
undrained shear strength of the rock mass. The undrained strength may be
estimated from N60 values and the appropriate value of f1 using the following
relationship:
Stroud suggests that for chalk f1 = 25kPa.
Stroud suggests that a value of E/N60 of 15 MPa is broadly consistent with
data presented by Hobbs and Healy (1979) for the base performance of 30
pile loading tests and a number of large scale footings with degrees of
loading up to 0.15. He indicates that a conservative estimate of stiffness for
chalk under a moderate degree of loading (> 0.15) is given by E/N60 of
about 5.5 MPa. Both correlations are shown in Fig. 2.3/16. The choice of
which relationship to use depends upon whether pre-yield or post-yield
settlements are required. It is therefore necessary to know what the value of
the yield stress qy. This cannot be predicted from the Standard Penetration
Test.
171

The relationships between SPT N value and Young's modulus is unusual
since it is linear. However it will be seen from Fig. 2.3/16 that these
empirical correlations provide a much better agreement with Powell et al.'s
data than the logarithmic relationships discussed earlier. This suggests that
Stroud's correlations may give more accurate predictions of foundation
settlement than the other commonly used methods such as Wakeling (1970)
and Kee and Clapham (1971).
The reliability of the SPT in providing accurate stiffness values is made even
worse by the fact that the results are affected by the presence of water, fallen
debris at the base of the borehole, the amount of mechanical disturbance
below the base of the hole caused by drilling and the type of tool used. The
mass compressibility of chalk is a function of the fracture state (orientation,
frequency and aperture) and the mechanical properties of the rock material.
In order for there to be a unique correlation between modulus and SPT N
value these factors must be reflected in the penetration resistance. In highly
fractured chalk a large proportion of the test volume may be through open
discontinuities, whereas in chalk were the discontinuities are closed and over
200mm apart the intact rock will dominate the penetration resistance.
Clayton (1978) demonstrated that the SPT N value is sensitive to the intact
dry density of the chalk. It is likely, however, that in a closely jointed chalk
rock mass the joints would have a significant influence on the SPT N value. A
situation could arise in which a chalk with a high dry density and closely
spaced joints gives a lower N value than a chalk of low dry density and widely
spaced joints. In this context it is the vertical joint spacing and aperture which
are of importance. When the vertical joints are closely spaced and open there
is likely to be less resistance to penetration since the rock is able to deform
laterally with ease ahead and around the SPT tool. The low N values derived
from such a rock mass could lead to a significant overestimation of the mass
compressibility. Where both the vertical and horizontal joints are widely
spaced the SPT N value is likely to reflect better the intact dry density of the
rock and the rock mass compressibility.
172

Evidence of drilling method influencing SPT N values in chalk is given by
Mallard (1977). Fig.2.3/18 shows the results of standard penetration tests
performed by four contractors at the Liitlebrook D power station site.
Contractors A, Band C used the conventional light percussion method of
boring whereas contractor D performed tests in BX rotary percussive
boreholes. It will be seen from Fig. 2.7/34 that contractor D shows a fairly
tight band increasing in N value with depth up to about 6m then a broad
band of essentially constant N value with depth. These trends cannot be
identified in the other contractors results due to the large amount of scatter.
A comparison between contractor C and D indicates that the N values
derived from light percussion boreholes are lower than those derived from
the rotary percussion holes. This possibly reflects the relative amounts of
disturbance ahead of the bottom of the hole produced by the different
drilling methods. The evidence is by no means conclusive but it does suggest
that the SPT N value may be sensitive to drilling method. There have been
no systematic investigations of the influence of drilling method reported in
the literature.
Although the SPT is the most popular in-situ test for providing mass
compressibility parameters for the chalk, it is perhaps the least reliable. The
empirical nature of the correlations between N value and E together with the
fact that the test is insensitive to relatively large variations in stiffness should
cause the results to be treated with caution. The fact that the results of SPT
tests appear to be affected by drilling method and the type of tool used in the
test means that the data can only be usefully employed for profiling rather
than for the determination of design parameters.
VlSUlll Assessment
The systematic collection of geological data and its correlation with
engineering experience and measurement can lead to improved methods of
predicting the behaviour of rock masses. Thus Moye (1955) developed a
method of correlating geological occurrence and behaviour for rock in the
173

Snowy Mountains Scheme. The major part of the Snowy Mountains Scheme
was the construction of tunnels in granite, and the principal geological feature
which controlled the behaviour of the rock mass was alteration of the granite
by chemical weathering. Moye (1955) devised an engineering grade
classification system for the granite in order to ensure that geologists
descriptions were meaningful in engineering terms. It was important that the
various degrees of chemical weathering were recognised and hence Moye's
classification is essentially a classification of weathering of rock material in
engineering terms. This classification system was the forerunner for numerous
other weathering classifications dealing with both the rock material and the
rock mass (eg Ruxton and Berry, 1957, Anon, 1977). Indeed the interest in
weathering classifications has been such that true engineering grade
classifications become insignificant in comparison and some are referred to as
weathering classifications simply because weathering happens to be an
important feature controlling the behaviour of that particular rock mass.
In general engineering grade classification schemes rely on qualitative or
semi-quantitative observations of the rock mass. They are usually developed
for a particular project in order to provide some uniformity in rock mass
descriptions as well as allowing engineering parameters measured at discrete
points or zones to be extrapolated to other areas of the site. Such
classification schemes are thus site specific and should not be confused with
rock mass classification schemes which serve to quantify experience so that it
may be extrapolated from one site to another. These classification schemes
seek to assign numerical values to those properties or features of the rock
mass considered likely to influence its behaviour, and to combine these
individual values into one overall classification rating for the rock mass.
Rating values for rock masses associated with a number of mining and civil
engineering projects are then determined and correlated with rock mass
behaviour. Goodman (1976) and Hoek and Brown (1980) have reviewed a
number of rock mass classification schemes that have been developed for a
variety of purposes, although the majority are for tunnelling applications. Two
of these schemes, the NGI tunnelling quality index (Q) developed by Barton
174

et al (1974) and the CSIR geomechanics or Rock Mass Rating (RMR)
scheme developed by Bieniawski (1973, 1976), are currently widely used in
civil engineering. What most of these schemes have in common is a
combination of laboratory and field measurements together with observation.
The laboratory measurements often include the determination of uniaxial
compressive strength together with other mechanical properties.
Chappell and Maurice (1980) have attempted to adapt the RMR rock mass
classification scheme for predicting the deformation of a rock mass beneath a
foundation. The scheme proposed by Chappell and Maurice is based upon
composite elastic theory which combine the intact and joint material
properties. The authors do not consider yielding of the rock mass, making the
scheme unsuitable for weak rocks such as chalk which exhibit such behaviour
under relatively low applied stresses. There appears to be no comprehensive
rock mass rating scheme suitable for predicting settlement on weak rocks in
the literature.
Some examples of engineering grade classifications are given by Knill and
Jones (1965). These classifications were developed specifically for studying
the geological conditions for dam foundations. In the case of the Roseires
dam the dominant feature controlling the assessment of foundation conditions
was weathering of the gneiss, hence the classification focused on this aspect.
In the case of the Latiyan dam it was the jointing and the presence of shale
layers that were considered to be important. Both these classifications were
developed to ensure efficient and rapid mapping of geological conditions
across each dam site. Both classifications are site specific, as is the case with
most engineering grade classifications.
Classic among engineering grade classifications was that developed by Ward
et al. (1968) for the chalk at Mundford, Norfolk. Table 2.3/5 shows the
original classification and subsequent additions of Wakeling (1970) (Grade VI
and correlation with SPT N value). The classification was developed in order
that the mass compressibility of the chalk measured at discrete points could
175

Table 2.3/5 Extended visual classification of the chalk (after Clayton, 1990a)
Grade Original Description (Ward et at., 1968, I - V, Wakeling, 1970, VI)
VI Extremely soft structureless chalk, containing small lumps of intact chalk.
V Structure less melange. Unweathered and partially-weathered angular chalk blocks and fragments set in a matrix of deeply-weathered remoulded chalk. Bedding and jointing are absent.
-"
" ~ IV Friable to rubbly chalk. Unweathered or partially-weathered chalk with bedding and jointing present. Joints and small fragments closely spaced, ranging from 10mm apart to about 60mm apart. Joints commonly open up to 20mm and infilled with weathered debris and small unweathered chalk fragments.
III Rubbly to blocky chalk. Unweathered medium to hard chalk with joints 60mm to 200mm apart. Joints open up to 3mm, sometimes with secondary staining and fragmentary infilling.
II Medium hard chalk with widely-spaced closed joints. Joints more than 200mm apart. When dug out for examination purposes this material does not pull away along joint faces but fractures irregularly.
Hard, brittle chalk with widely-spaced closed joints. Details as for Grade II but the chalk is harder.
SPTN
<8
8-15
15-20
20-25
25-35
>35
Identification factors nonnally used in practice
Structure Jointing/particle sizes
Bedding and behaviour dominated by jointing chalk fines absent.
Bedding and behaviour dominated by jointing intact chalk lumps absent
Bedding and Joints: 10-60mm spacing, jointing <20mm aperture with present debris in fill
Bedding and Joints: 60-200mm jointing spacing, <3mm aperture, present possible infill
Bedding and Joints: >200mm spacing, jointing Omm aperture present
Bedding and AsH jointing present
Identification factors not nonnally considered
Hardness/strength Weathering
extremely soft
deeply weathered
friable to rubbly unweathered or partially weathered
rubbly to blocky unweathered, sometimes with secondary joints
medium hard unweathered
hard unweathered

be extrapolated to other parts of the site which exhibited similar geological
features. Ward et al. (1968) assumed that the compressibility of the rock mass
depended primarily upon the following factors:
(i) The presence or absence of structure
(ii) Spacing of discontinuities
(iii) Orientation of discontinuities
(iv) Tightness (aperture) of discontinuities
(v) Hardness of intact chalk
The classification of the Mundford chalk was based on these factors. Grades
IV and V are largely the result of weathering (stress relief and frost
weathering) and are considered to be independent of lithology. Grades I and
IT are completely unweathered, the difference between them being a related
to lithological differences. A bed of hard low porosity chalk (Chalk Rock)
was encountered at depth in some parts of the site. It is this hard brittle
chalk that is classified as grade I.
In general grades V to ill occur in succession from the surface down
(sometimes with one or more missin~). Since grade I chalk relates to a
particular stratum it is possible for grade I chalk to overly grade II chalk.
Grade III chalk usually overlies grade II or I but occasionally it was found at
depth associated with minor tectonic features. The grades have been
correlated with rock mass properties such as compressibility and P-wave
velocity (Ward et al. 1968, Grainger et al., 1973). The correlations are shown
in Table 2.3/6. It can be seen from this table that the deformation
characteristics of chalk in the mass show a general improvement from grade
V through to I. Fig. 2.3/19 shows the range of values of Ei, Ey and qe
reported in the literature. The range of porosity involved in these
measurements is quite small, with a predominance in the more bighly
weathered chalks thought to have porosities of around 44%.
177

Table 2.3/6 Correlation of engineering grade with mechanical properties of
chalk in the mass.
Grade Approx range Yield Pwave Creep properties of E- stress velocity 1
'Ie Vp (MPa) (kPa) (mjs)
V 500 <200 650- 750 Exhibits significant creep IV 500-1000 200-400 1000-1200 as above
III 1000-2000 400-600 1600-1800 For pressures <400kPa creep is small and terminates in a few months
II 2000-5000 > 1000 2200-2300 Negligible creep for pressures at least 400kPa
I >5000 >1000 as above
(After Ward et aI (1968) & Grainger et aI. (1973))
Whilst structure, discontinuity spacing and aperture were defined in a way
that could be determined with relative ease in the field, the other parameters
were not. The lack of definition of some components may stem from the fact
that this classification was never intended to be used at sites other than
Mundford. Indeed Ward et al. (1968) state:
''It must be emphasised that this particular classification was developed
specifically for the conditions and requirements of the Mundford site. II
Despite this warning this classification scheme and its subsequent extensions
have been used by geotechnical engineers indiscriminately over much of the
chalk outcrop in the UK. The stratigraphic, pala:!ogeographic and tectonic
setting of the chalk at Mundford is now seen as atypical and hence the
correlations derived for this site cannot be applied to the outcrop as a whole.
Fookes and Horswill (1970) point out that the various components of the
classification at one grade at Mundford cannot necessarily be expected to be
found in unison at any other location because of the variable nature of this
rock.
178

In practice classification of chalk normally takes place on the basis of SPT N
value, the presence or absence of structure and discontinuity spacing. With
regard to the use of SPT N value to classify the chalk, the results are often
misleading. Dennehy (1975) compared the grade of chalk observed in trial
pits with that determined from SPT N values recorded in adjacent boreholes
formed by light percussion techniques. This study demonstrated that for a
given grade a wide range of SPT values could be obtained. Lord and Smith
(1976) carried out a similar study and concluded that SPT results do not
provide a suitable means of establishing chalk grade and hence foundation
level. Fig. 2.3/20 shows the results of standard penetration tests and visual
grading of the chalk for a silo complex at Bury St Edmunds. Based on the
SPT N values the chalk above the water table would be classified as Grade V
and yet the visual classification shows the quality of the chalk improving with
depth from Grade VI/V near the surface to Grade IV jm at depth. The
boundaries defined by the visual classification cannot be identified from the
SPT results. This example reinforces the point that SPT N values alone can
be misleading when attempting to determine the quality of the chalk for
foundation design.
The classification scheme proposed by Ward et al (1968) takes no account of
factors such as joint orientation, joint surface topography, the degree of
contact across joints and the looseness of the fracture block system. These are
significant factors which control the deformation of a rock mass and their
absence from this classification scheme serves to emphasise its site specific
nature.
179

Summary
• Theoretically the pressuremeter is the best method for measuring the
stiffness parameters for the rock mass. This is because in an elastic
continuum, all the elements of ground within the test zone will follow
similar stress paths. This means that stiffness parameters can be
determined without making any simplifying assumptions. Hence the
parameters may be used directly in predicting the settlement of a full
scale structure without the application of any scaling factors.
• the parameters E i, EY' qe and qy may be determined using the
pressuremeter.
• There are some serious practical disadvantages with the
pressuremeter. One of the principal disadvantages identified was that
the pressuremeter loads the ground in a different direction to a
foundation loading. The other important practical disadvantage with
pressuremeters was the difficulty in penetrating large flints.
• The plate loading test offers the best similitude between the test and
the full scale foundation. However the rigidity and geometry of the
plate results in different elements of the rock mass beneath the plate
following different stress paths. This results in problems extrapolating
from the test scale to that of a full-scale foundation.
• the parameters E i , EY' qe and qy may be determined using the plate
loading tests.
• In general the plate should have a diameter which is greater than five
times the average sub-horizontal discontinuity spacing in order to
minimise the scale effects and obtain reliable results.
180

• The interpretation of plate loading test data generally assumes the
ground to have a uniform stiffness. In non-homogeneous ground this
assumption imposes a serious limitation on interpretation.
• Values of Young's modulus are determined using pressure-settlement
data from plate loading tests. Following equations are used:
or
Rigid plate
Flexible plate
E = !:.qD (1 - v2)
4 P Pcentre
E = O.844qDp
(1 - v2
)
Pav
E = qD (1 - v 2)
p Pcentre
In practice stiffness parameters are determined assuming the plate to
be rigid.
• The rate of chage of stiffness with depth in non-homogeneous ground
may be determined from sub-plate settlement measurements or from
the distribution of ground surface settlement. Both methods are
generally unreliable in fractured chalk since they assume the ground to
be an elastic continuum.
• The major practical disadvantages of the plate loading test, particularly
when using large diameter plates, is that it is very expensive (generally
about £ 10,000 per test) to perform, it takes a long time to set up and
perform, it requires careful preparation of the ground and careful
selection and setting up of the instrumentation.
181

• Recent research work on the small strain stiffness behaviour of soils
there is a growing interest in the use of seismic methods to determine
stiffness parameters for soil and rock masses.
• Seismic techniques permit the measurement of stiffness that is close to
Ei since chalk does not exhibit significant non-linear stress-strain
behaviour at stresses less than qe.
• Seismic surveying techniques such as refraction, crosshole, uphole,
downhole and continuous surface wave permit a profile of modulus
with depth to be determined. This is clearly of importance in non
homogeneous ground.
• P-waves may be used in structured chalk above and below the water
table. In saturated structureless chalk S-waves or Rayleigh waves must
be used since the P-wave velocity will not reflect the stiffness of the
material since it is dominated by the pore water.
• The advantage of geophysics is that it is relatively cheap and the
fieldwork can be conducted rapidly. The disadvantage is that the
geophysics is unable to provide data to enable the yield stress or post
yield modulus to be determined due to the very small strains induced
by seismic energy in the ground.
• The Standard Penetration Test does not measure the stiffness of the
rock mass. Values of stiffness can only be derived from empirical
correlations with SPT N value.
182

• Various empirical correlations between stiffness (Ei and Ey) and SPT
N value have been found. These include:
Wakeling (1966) Log linear relationship
Wake ling (1970) Log linear relationship
Lake and Simons (1970) Log linear relationship
Kee and Clapham (1971) Log linear relationship
Stroud (1988) Linear relationship
Powell et aL (1990) Log linear relationship
• The most commonly used empirical correlations in practice are
Wakeling (1970) and Kee and Clapham (1971).
• Most of the empirical relationships are unreliable since they are based
on a relatively small number of small-diameter plate tests. Of all the
relationships that proposed by Stroud (1988) appears to have the most
potentiaL
• In general stiffness values based on SPT N values are unreliable
principally because:
(i)
(ii)
SPT N value is sensitive to drilling method.
SPT N value is insensitive to relatively large changes in
rock mass stiffness.
• The Mundford engineering grade classification for chalk is site specific
but is applied by engineers across the whole of the chalk outcrop.
• The classification scheme is complicated by having too many classes
and having a number of descriptors which are not adequately defined
to be used in practice (eg weathering and hardness).
183

• In practice the classification of the chalk normally takes place on the
basis of:
SPT N value;
the presence or absence of structure
and discontinuity spacing.
• The use of SPT N values alone to classify the chalk is often
misleading.
184

Pressure volumeter.
Air to guard cells
Ground level
Preformed borehole
Probe.
Water injection
4+---Air
. .
...... --Water
C02 bottle
.--- Guard cell (Airfilled )
-..--- Measuring cell (Waterfilled)
4----- Guard cell ( Airfilled )
Fig. 2.3/1 Typical arrangement for a Menard pressuremeter test.
185

.-.. as D. :IE ---a. .. CD -::s tn tn CD -D.
Fig. 2:3/2
.-.. E ---.c ... a. CD C
Fig. 2.3/3
16
14
12
10
8
6
4
2
P f
p o
dp E = - (1 +v)
dEc - 1340 MP
Phase 3 - a
Phase 2
o 7~1I~~~~~~L---~--~ 10 11
0
2
4
6
Phase 1 Cavity strain, (%)
Typical curve from a Me d Ervin et al., 1980). nar pressuremeter test in moderately weak rock (after
o
Range of values back analysed from foundation settlements
74 .. .. •
20 30 40 50 60
Shear modulus, G (MPa)
Initial Reload loading cycle
Pressuremeter 0 •
Plate tests 6. £. 1710mm Dia. plate test *
.. 96 .. ......
70
Moduli determined from pressuremeter and plate tests on chalk compared with those back-analysed from a bridge foundation (from Marsland and Powell, 1983
and Powell et aI., 1990).
186

Borehole wall
Fig. 2.3/4
Loading column Locating cone
Fins
C=f=t~~~tlct==r=-~ Linear displacement transducers
Plaster
865mm Dia. plate
Plan
Settlement Elevation measurement ______ _
points
50mm
Springs
Settlement point
NOT TO SCALE
865mm diameter loading plate with four-point sub-plate ground-deformation measuring system (after Marsland and Eason, 1973).
187

Plate pressure (kPa)
o 200 400 600 800 0.0 r-----,-~~~----,_--~----_,----~----~----~
.-. 0.1 tft "-'" 0 --.. CG '-.. C 0.2 CD E CD -= CD en
0.3
Fig. 2.3/5
o
Plate
1
2
3
4
Sub-plate settlement measurement points set at 150mm intervals
"
COWDEN TILL
" " " " " " " " " " " "
" " " " " " "
'. '.
Plate
4
3
2
1
Typical load-settlement curves from sub-plate deformation measurements (after Hird et aI., 1991).
Error In E (%)
40 80 HID, = 10 0.0 ~---r-----r-----'--:-:-:-:-;-;-;-;----:r~----'
0.5
z/Dr
1.0
1.5
Fig. 2.3/6
.: I ~ \
" " ...... ""'-
" " '\ \ , , , , , ,
Load factor 0.15 0.25 0.33 0.50
H
j z
Plate Dia. = Dp Rigid plate assumed poisson's ratio = 0.5
Error in modulus values derived from sub-plate deformation measurements (after Hillier, 1991).
188

Fig. 23/7
E or G
0.0001
Field strains around structures ...
0.001 0.01 0.1 1
Normal or shear strain (%)
10
Conventional triaxial apparatus ... Local measurement of axial strain
I I
Resonant column
Geophysics ...
Typical relationship between stiffness and strain for soils.
189

Fig. 2.3/8
(a) Seismic refraction
Continuous increase in velocity with depth
H--------e.I-.
(b) Crosshole
Uphole Downhole
• • Energy source
• Detector (geophone)
(c) Uphole and downhole
Vibrator
(d) Surface wave
Seismic methods for determining the variation of stifness with depth in soils and rocks.
190

...... ~ ......
w
30
25
C 0 Q)
> .8 20 as t/) Q) '-1i)
:E 15
10 o
Fig. 2.3/9
E VI dl ng
SH1 T4
Vo= 250m/s 0
D1 D D2
V1 = 700m/s
V2 = 1000m/s IV
III III
V3 = 1600m/s ~
II V 4= 2300m/s _ .. _ .. _ .. - .. _ .. _ .. _ .. _ .. - .. _ .. _ .. _ .. - .. _. .._ .. _ ..
20 40 60 80 Metres
Estimated water table: March 1970, based on borehole Information
D1 Sandy soli D1 Cryoturbated bed
Velocity profile along seismic line 7 at Mundford, Norfolk (after Grainger et al. 1973).

50
CD E 30 0-... ... 0;; c 20 ca ~
10
• Survey measurements 4 1
Sinh fit v 0 = 377m/s, k = 100s
O~------~------~----__ L-______ L-____ ~ o
Fig. 2.3/10
u10 E as ~8
W'TJ ...
tn tn CD C = i
6
4
() 0- 2 E ca
10 20 30 40 50
Distance from energy source (m)
Typical time-distance graph from a seismic refraction test at Mundford, Norfolk . (after Abbiss, 1979).
Estatic= 0.47E dynamic
~ 0 ~~~ __ L-______ L-____ ~L-____ ~-------L------~ 6 C 0
Fig. 2.3/11
2 4
Static stiffness, E static (GPa)
Relationship betWeen static and dynamic moduli for the chalk at Mundford, Norfolk (after Abiss, 1979).
192

-. 5 E ---~ C ca ... ~ 10 -CD .a ~ ... DCD Q 15
E (GPa) 4
• Seismic
• Finite element
.. Plate test
20 ~ __ -L ____ ~ __ ~ ____ ~ __ -L_
Fig. 2.3/12 Relationship between Young's modulus and depth for the Mundford chalk determined using seismic refraction, finite element analysis and plate loading tests (after Abbiss, 1979).
G (GPa) 00~ ______ 1~ ______ 2~ ______ 3~ ____ ~4
20
-. 40 E ---~ a CD 60 Q
80
I I I I I I
• ...
,
, \ ,
, , ,
Laboratory (static) tests Downhole
Cross hole
100 L-__ ---1 ___ .-.L ___ ---L----
Fig. 2.3/13 Shear modulus-depth profIles for chalk measured using cross-hole and downhole seiesmic tests (after Sigismond et al., 1983).
193

10000 • Field observations
• Newbury lab. tests
1000 J E (MPa)
100
10
1
Fig. 2.3/14
10000
1000
E (MPa)
100
10
1
. Fig. 2.3/15
o
o
Norwich plate test
~ •
10
• • •
20
~--Medway Bridge Newbury pile test
30 40 50 60
SPT 'N' value
,
j
70
Correlation of stiffness with standard penetration test results for chalk (after Wakeling, 1966).
Line B ". :
.~
0.01 % of width
/ ..... 1-- Large settlements 0.5% of width
~ Medway bridge 9.S*32.3m
Newbury pile test 1372mm
66 Line A £. .... Purfleet plate tests 445mm Dia.
• Norwich plate test 140mm Dia.
~ Cambridge plate test 140mm Dia.
VI
Mundford Chalk Grades
10 20 30 40 50 60
SPT 'N' value
70
• Mundford tank • Mundford Plate (E.) 0 Mundford plate (E, ) • Other sites
Correlation of stiffness with standard penetration test results for chalk (after
Wakeling, 1970).
194

-" \.0 U1
100000 ,,
-as D.. :E -tn ::J -::J "'C 0 :E
Co) .-... tn as -w
stroud (1988) 1S*N , .....
, ..... , ,
10000 I I J'" "d 7"
--...... -.: .. :>" ' ,
, , ,
.. , ;' ....... ~ .. ········.:..1 1000 I ., ." F 7' __ ~., ::: .. _ .. -.~
, ,
.--- ......
100 I L I l,J -'--',. ~ Ir"- ........ ' -1 .... - I I / () ____ ~n _ .. _.~ .....• . _ - 1
---Stroud r1988) 5.5*N
Lake & Simons (1970) 10 I _ -.:-:-:::':'''''1 r\.~e or. ,-",U:lpnilJll (l ~ I II
1 o
90)
10 20 30 40
SPT N Value
o Data from Powell et al. (1990)
50 60
Fig. 2.3/16 Comparison of empirical correlations between E and SPT 'N' value for the chalk.
70

50
40 E'
Nso 30
(MPa)
10
o
Fig. 2.3/17
--.
o
2
.5.. 4
= 6 ~ CD C 8
10
12
Fig. 2.3/18
0.1
* Ward et aI. (1968) • Burland et aL (1974)
fBB Hobbs et aI. (1979) t:j8 .(30 pie tests) • Wakeling (1966)
o Lake & Simons (1975) D Burland et at. (1969)
o Woodland et at. (1988)
- Fletcher et at. (1964)
.& • ~"""A .. ~ .... ~ .... .. .. 0 ...... - .. ----A. /\
----~-~------
0.2 0.3 0.4
Variation of E' /Nro with degree of loading for chalk (after Stroud, 1988).
SPT 'N' value
:~ :-: __ e .
• , .. ~ ••• • • l:. • • .. -. ::. .., .. -# •
• . : . I - .
100
•
•
•
•
e
• •
•
•
• •
•
•
Contractor C
180
• •
•
SPT 'N' value
• . . . . . .. ,:. .....
• ... . • •
~ -, :
180
•
Contractor 0
Comparison of the results of standard penetration tests carried out by different contractors at the same chalk site (after Mallard, 1977).
196

Fig. 2.3/19
104
I .. -;...~ I : I I : I I : I
3 I 10 Initial
I : I
I I : I I : I I : I
tangent ~-:_I i-;-:
: : :
modulus 2 I EI 10
(MPa)
10 II III IV V
104
Reported ranges of moduli and yield bearing pressure for in-situ chalk under foundation loading (after Clayton, 199Oa).
197

0 0
5
.-. E 10
----• ..I
• CJ 15 ~ 0 -CD .a
20 .z:. a CD c
25
30
35
Fig. 2.3/20
SPT 'N' value
10 20 30 40 50 , , . ' , YIN .: .. ~ , , V/IV : ~ ... , 0,
,0 .' ~.: 0·:
'~e: .e: IYIIII o ,-
~1. ' ~ '. ,. ~ : .. o:~r·: . ,
- ~ ,: Visual grading ~ , , • .. , , .. , • , ~8· .- • ~
8 e. e' • ••• 00 •• • • • , o 0' • • '. • • • • • r
• • ...-..-..-VI V IV III II I Wakeling's classification (1970)
S.I. of April 1972 S.I. of May 1981
Results of Standard Penetration Tests and visual grading of the chalk (after Burland and Bayliss, 1990).
198

2.4 Summary
The following points arise from this literature review:
• Most white chalks (ie Middle and Upper Chalk) exhibit a relatively
uniform chemical composition.
• Depositional, diagenetic and tectonic processes give rise to a wide
range of porosity (9% to 52%).
• Because of the uniform chemical composition, porosity is the principal
factor controlling the intact mechanical properties such as strength and
stiffness. It has been shown that the strength and stiffness of intact
chalk can be expected to vary through two orders of magnitude.
• Chalk exhibits yielding and in some cases collapse which is associated
with the breakdown of the bonded structure. The higher the porosity
of the chalk the more pronounced is the yield point and there is a
greater likelihood of collapse. Prior to yielding the rock material
behaves in a stiff and more or less elastic manner. After yield and
when the rock has become completely destructured it behaves as a
granular soil.
• The discontinuity pattern in the chalk is dominated by sub-horizontal
bedding discontinuities and at least two sets of sub-vertical joints
except in areas affected by intense tectonic activity. The areas affected
by intense tectonic activity account for only a small proportion of the
total outcrop area of the chalk in the UK. Hence most engineering
works will be on chalk with sub-horizontal and sub-vertical fracture.
199

• Weathering processes such as stress relief and frost action tend to
bring about an increase in frequency of discontinuities through the
development of new fractures. These fractures are not as persistent as
the primary discontinuities associated with diagenesis and tectonism.
They are however particularly abundant near the ground surface where
these weathering processes are most active.
• The general weathering profile for the chalk is characterised by
structureless chalk grading downwards into structured chalk with
discontinuity frequency and aperture reducing with depth. This profile
is largely the result of intense freezing during the Pleistocene.
• Dissolution has resulted in the widening of discontinuity apertures, and
the reduction in contact area across fractures through changes in
surface topography. There has been no study reported in the literature
concerning the rate and form of discontinuity dissolution.
• There has been no systematic study that examine the potential
relationship between the intact mechanical properties on the chalk and
the pattern of features within the weathering profile (weathering style)
for a given weathering regime. The only documented study on the
characterization of weathering style in the chalk was reported by Ward
et al. (1968).
• The introduction of discontinuities within a rock mass results in a
significant increase in compressibility.
• The stress distribution below a foundation on fractured rock is
controlled largely by the discontinuity geometry and hance cannot be
predicted using theories of continuum mechanics.
200

• The mass compressibility of most chalks will be dominated by the
normal stress-closure behaviour of sub-horizontal discontinuities. The
principal factors affecting the compressibility of such a rock mass when
subjected to a foundation loading include:
• stress-strain behaviour of the intact rock
• degree of contact across discontinuity walls ( contact area)
• discontinuity spacing in relation to the dimensions of the loaded
area
• discontinuity aperture
• discontinuity infill
• The available literature suggests that for a foundation placed on a
rock mass dominated vertical and horizontal discontinuities the load
settlement curve should be concave such that stiffness increases with
increasing load. However chalk with similar discontinuity orientations
the load-settlement curve (obtained from plate loading tests) is convex
such that above a certain load the stiffness is significantly reduced.
This behaviour is associated with yielding of the rock mass. The
mechanisms causing the rock mass to yield are not understood.
• Burland and Lord (1970) suggested that the load-settlement behaviour
of a plate or foundation may be modelled using five parameters:-
E· - initial modulus 1
Ey = post yield modulus
qe = yield bearing pressure (based on the onset of yield)
qy = yield bearing pressure (based on the establishment of E)
• Only six well documented case records on the behaviour of
foundations on chalk could be found in the literature. Of these only
four deal with foundations on structured chalk. The reliability of some
of these case records is brought into question because of the
assumptions made concerning the contact stresses and the stress
201

distribution with depth (eg Bury St Edmunds sugar silos and the
Mundford tank loading test).
• The case records highlighted the following points:
• Generally pre-yield settlements are small with settlement ratios
less than 0.05% at average foundation pressures up to 200kPa.
• Little is known about the post-yield load-settlement behaviour.
• Little is known about the mechanisms causing yield and the
magnitude of the yield bearing pressure.
• Little is known about the time-settlement behaviour of
foundations on chalk.
• Little is known about the influence of intact mechanical
properties of chalk on the mass compressibility behaviour.
• Little is known about the influence of weathering styles on the
mass compressibility behaviour of chalk.
• Only 11 well documented case records of plate loading tests on chalk
could be found in the literature. These shed little light on the points
listed above since the majority of them employed a plate diameter that
was too small to give reliable results. Also in many cases only Ei could
be determined and in all but one case no attention was paid to the
time-settlement behaviour of the chalk.
• Stiffness parameters for use in foundation settlement predictions may
be measured using the following in-situ tests:
• • • • •
Pressuremeter
Plate loading tests
Surface or borehole seismic surveys
The Standard Penetration Test
Visual assessment
202

It is clear from this review of past literature that the mechanisms which
control the mass compressibility behaviour of chalk are not fully understood.
This is largely as a result of a distinct lack of well documented records of
load-settlement relationships for large scale loading tests and full scale
foundations on chalk. This lack of understanding precluded the general (non
site specific) characterization of chalk in the mass for the purpose of
predicting compressibility behaviour.
This thesis attempts to improve the fundamental understanding of some of
the factors controlling the mass compressibility of chalk by performing a
series of large diameter plate loading tests on weathered chalk at sites which
display similar discontinuity characteristics but different intact strength and
stiffness properties. The results of such tests will provide valuable data for a
currently deficient database on foundation behaviour on chalk as well as
permitting progress to be made in characterizing the chalk.
This thesis also attempts to evaluate some of the methods discussed above for
determining stiffness parameters for the chalk. In particular the standard
penetration test and surface wave geophysics will be used to predict the mass
compressibility of the chalk at the locations of the plate loading tests.
203