mass haulage diagrams for emban ments...
TRANSCRIPT
MASS HAULAGE DIAGRAMS FOR EMBAN-MENTS WORKS – TILOS 8
1.TILOS 8 – Project management software forlinear projects
TILOS is planning and scheduling software for any type of linear project including roads, railways, tunnel, trans-mission and pipeline projects. It was developed by the German company Linear project GmbH and has been available since 1999.
1.1 Time-distance diagrams – concept
Traditional planning systems display their results in bar (Gantt) charts or network diagrams. Linear projects pres-ent unique challenges because the crews and equip-ment move along the construction site to perform their work. Time-distance diagrams (also known as time loca-tion diagrams, line of balance diagrams, march charts or French diagrams) clearly communicate the scope by showing the project details and the schedule in one view.
Due to the lack of decent software tools, many plans were drawn with software packages like CAD or Excel. The major flaw being that as soon as changes occurred, plans were constantly being amended as there was no easier way to process the data visually. TILOS combines both time and distance in one powerful project manage-ment tool:• Full CPM analysis. Display of critical path in Time-Dis-tance diagram• Full support of sub-projects. Bridges, pump stations orother bar activities can be planned in a separate sub-project and their major activities or milestones can be linked to Time-Distance-Diagram.• Full control over Quantities, work rates, resources andcosts connected to location information.• Easy monitoring of the production line.The key benefit of TILOS is the flow of visual data in terms of time and place on one plan. CPM schedules and net-work diagrams are more analytical, but they fail to pro-vide a visual connection between the project plan and the project itself.
The next version of Tilos – release 8 includes a new and in-novative special function called Mass Haulage.
2.Mass Haulage diagrams in TILOS 8
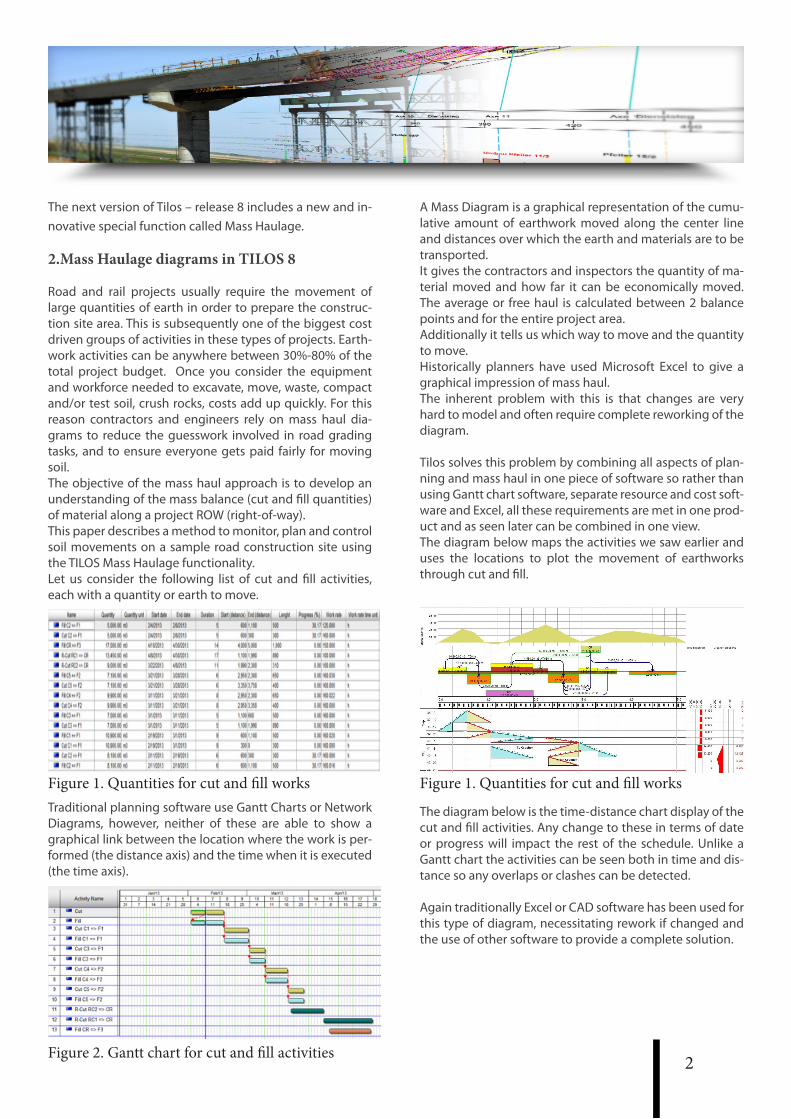
Road and rail projects usually require the movement of large quantities of earth in order to prepare the construc-tion site area. This is subsequently one of the biggest cost driven groups of activities in these types of projects. Earth-work activities can be anywhere between 30%-80% of the total project budget. Once you consider the equipment and workforce needed to excavate, move, waste, compact and/or test soil, crush rocks, costs add up quickly. For this reason contractors and engineers rely on mass haul dia-grams to reduce the guesswork involved in road grading tasks, and to ensure everyone gets paid fairly for moving soil. The objective of the mass haul approach is to develop an understanding of the mass balance (cut and fill quantities) of material along a project ROW (right-of-way). This paper describes a method to monitor, plan and control soil movements on a sample road construction site using the TILOS Mass Haulage functionality. Let us consider the following list of cut and fill activities, each with a quantity or earth to move.
Figure 1. Quantities for cut and fill worksTraditional planning software use Gantt Charts or Network Diagrams, however, neither of these are able to show a graphical link between the location where the work is per-formed (the distance axis) and the time when it is executed (the time axis).
Figure 2. Gantt chart for cut and fill activities
A Mass Diagram is a graphical representation of the cumu-lative amount of earthwork moved along the center line and distances over which the earth and materials are to be transported.It gives the contractors and inspectors the quantity of ma-terial moved and how far it can be economically moved. The average or free haul is calculated between 2 balance points and for the entire project area.Additionally it tells us which way to move and the quantity to move.Historically planners have used Microsoft Excel to give a graphical impression of mass haul. The inherent problem with this is that changes are very hard to model and often require complete reworking of the diagram.
Tilos solves this problem by combining all aspects of plan-ning and mass haul in one piece of software so rather than using Gantt chart software, separate resource and cost soft-ware and Excel, all these requirements are met in one prod-uct and as seen later can be combined in one view.The diagram below maps the activities we saw earlier and uses the locations to plot the movement of earthworks through cut and fill.
Figure 1. Quantities for cut and fill works
The diagram below is the time-distance chart display of the cut and fill activities. Any change to these in terms of date or progress will impact the rest of the schedule. Unlike a Gantt chart the activities can be seen both in time and dis-tance so any overlaps or clashes can be detected.
Again traditionally Excel or CAD software has been used for this type of diagram, necessitating rework if changed and the use of other software to provide a complete solution.
2

”Tekin is a Project Management Consultant with a 15-year service record, who has provided project management consulting services for more than 280 organizations in different sectors including Highway, Metro, Pipeline, Railway, Transmission, Bridge & Tunnel
project more 40 different Countries.
Tekin is the CEO and Founder of FND Future Network Development (International Global Solution Provider of TILOS).
”TEKİN GÜVERCİN
CEO and Founder of FND Future Network Development
3
Figure 4. Cut and fill activities in time-distance chart
Tilos is very strong when it comes to reporting. Below we can see a combination of progress entry and S-curves (for planned versus actual comparison) in one view. Traditional solutions require a combination of planning software and Excel or Business Intelligence tools
Figure 5. Cost histograms and progress S- Curve
Mass Haulage also requires labor, material and equipment to be planned to calculate the optimal cost of the work. Contractors also need to consider income and cash-flow. Once the work is underway it needs to be compared with the baseline to compare actual costs against the plan.
Using Tilos means we can do this in one piece of software and not rely on several solutions to come up with the an-swer.The diagram below shows how material, equipment and labor can be combined.
Figure 6. Combined costs histograms and resource bar chartAll of this can be included in one view in Tilos, meaning ev-ery bit of information including the Mass Haul diagram and Mass Haul Balance diagram. Uniquely these are all interac-tive so any changes are immediately reflected in the rest of the plan. For example the knock on effect of a shortage of labor can be fed through to the impacts on time and cost.
TVASTARENGINEERING SOLUTIONSF1/32, DLF Phase -1 Gurgaon - 122002 [email protected]
Phone:- +91 - 124 - 4011987Email:[email protected]:-www.tvastar.in