mass media advertising for the big retail banks in the
TRANSCRIPT

Mass Media Advertising for the Big Retail Banks in the United States: How Firms are Leveraging Television to Acquire Customers
Honors Thesis
Presented in Partial Fulfillment of the Requirements for the Bachelor of Science in Business Administration Degree with Honors Research Distinction in the Max M. Fisher
College of Business of The Ohio State University
By
Mitchell Benjamin Heller
Marketing Specialization in Business Administration
The Ohio State University
2015
Thesis Committee:
Mingyu “Max” Joo, Advisor
Curtis P. Haugtvedt
Patricia M. West

Copyright by
Mitchell Benjamin Heller
2015

ii
Abstract
In the retail banking industry, there is an assortment of factors that consumers consider
when choosing one bank over another. While studies have been conducted regarding
persuasive advertising elements, none of the studies has pertained to banks. American
banks are spending millions of dollars on television advertisements, but the reality is that
commercial views are on the decline with the growth of digital video recorders and online
video streaming. This journal will uncover what advertising strategies are most effective
for a variety of banking customer segments. The theory of consumer readiness involves
consumer ability and motivation. It was hypothesized that high ability and high
motivation individuals would respond more favorably to commercials with central cues
compared to low ability and low motivation individuals. A 34-question survey was
conducted to help identify which advertising types are most effective to each consumer
segments. A series of Z-tests and confidence intervals were run to determine the
statistical significance of the survey data. Results are directional, showing that the
hypothesis was correct, but only for certain criteria. The hope is that with groups of
consumers identified, consumer banks can develop more effective advertising strategies
to appeal to each segment. This research opens the door to comparing television, mobile,
online, and print advertising effectiveness. Additionally, this research could be replicated
by combining research methods, such as EKG studies and focus group interviews, in
order to decrease the biases of respondents that are commonly found in surveys.

iii
Dedicated to Grandpa Nathan
iv
Acknowledgments
I would like to express my gratitude to my advisor, Professor Mingyu “Max” Joo.
Professor Joo’s expertise, patience, and direction made this research thesis an incredible
learning experience. I appreciate his immense knowledge of conducting marketing
research and survey data analysis. At times, I struggled with analyzing the survey data
and I failed to draw conclusions from the many statistical tests I ran. Professor Joo taught
me to always consider the implications for conducting data analysis and that conducting
the statistical tests is only one part of interpreting survey results. I would also like to
thank the other two members of my thesis committee, Professor Curtis P. Haugtvedt and
Associate Dean Patricia M. West, whose time and consultation is invaluable to this thesis
and my overall experience. Additionally, I appreciate all of the assistance provided by my
academic advisor, Ms. Andrea Evans. If not for her guidance, encouragement, and
support I would have never considered conducting a research thesis. Ms. Jill O’Neill and
the Fisher Undergraduate Scholarship committee were also influential in my successful
completion of this thesis. The committee’s decision to award me with an undergraduate
research scholarship was instrumental in making this research possible. Lastly, I want to
thank my parents, my siblings, my Grandma Rita, and my girlfriend Taylor. Their love
and positive influence has always helped propel me through tough times, and I cannot
imagine life without them.

v
Vita
May 2011……………………………………Winston Churchill High School
March 2015………………………………….Second Place, Business/Education and
Human Ecology/Speech and Hearing
Science Category, Denman Undergraduate
Research Forum
2015…………………………………………B.S.B.A. Marketing, Max M. Fisher College
of Business, The Ohio State University
Fields of Study
Major Field: Business Administration
Marketing

vi
Table of Contents
Abstract……………………………………………………………………………………ii
Dedication………………………………………………………………………………...iii
Acknowledgments………………………………………………………………………..iv
Vita………………………………………………………………………………………...v
List of Tables…………………………………………………………………………….vii
List of Figures…………………………………………………………………………...viii
Chapter 1: Introduction……………………………………………………………………1
Chapter 2: Theoretical Context....…………………………………………………………5
Chapter 3: Situational Implications…………………………………………………….....9
Chapter 4: Research Methodology..……………………………………………………...13
Chapter 5: Results………………...……………………………………………………...19
Chapter 6: Discussion and Conclusion...………………………………………………...27
References………………………………………………………………………………..30
Appendix A: Survey Questionnaire...……………………………………………………34
Appendix B: Continuing or Starting Relationship with Bank After Viewing Ads…...….44

vii
List of Tables
Table 1. Proportions Summary 17A/23A………………………………………………..19
Table 2. Proportions Summary 17B/23B…………………………………………….…..19
Table 3. Proportions Summary 17C/23C…………………………………………….…..20
Table 4. Proportions Summary 17D/23D………………………………………………..20
Table 5. Proportions Summary 17E/23E………………………………………………...20
Table 6. Proportions Summary 17F/23F………………………………………………....20
Table 7. Breakdown of Responses: Understanding About Account & Policies…………26
viii
List of Figures
Figure 1. Screenshot of Screening Questions Regarding Motivation and Ability……….15
Figure 2. Screenshot of Attitudinal and Reactionary Statements After Video…………..16
Figure 3. Screenshot of Video Characteristics Analysis Statements After Video……….18
Figure 4. Chart of the Five Tests in the Direction that was Hypothesized………………21
Figure 5. Understanding About Account & Policies…………………………………….26

1
Chapter 1: Introduction
We have all watched television at least once in our lives. Some watch more than
others, but many people spend countless hours on the couch over the course of a week—
it’s not an opinion, it’s a fact. In the past week, approximately 84% of individuals aged
18 and up saw at least one television ad (Hulkower 2014). The National Football League
playoff championship, branded as the Super Bowl, attracted 114.4 million viewers in
2015, making it the “most watched broadcast in U.S. TV history” (Pallotta 2015). A
highly anticipated segment of the Super Bowl viewing experience is the commercial
breaks. This year’s price tag for a 30-second commercial spot during the Super Bowl was
$4.5 million (Poggi 2015). But why is it that firms are willing to spend top dollar for
impressions? The answer lies in the profound effect that commercials can have on
consumers. According to the YouGov BrandIndex, firms who put millions on the line
during the big game saw huge jumps in consumer word-of-mouth, the most influential
customer acquisition technique (O’Connor 2012). Additionally, many of these firms
gained tens of thousands of Facebook fans and Twitter followers, an essential platform
for increasing customer acquisition and retention (Poggi 2015, "Brands Like Mcd, Pizza
Hut, KFC Going The Digital, Social Media Way For Increasing Customer Retention,
Acquisition’ 2014) Most importantly, however, is that in the past month, it has been

2
reported that 19% of consumers aged 18 and over have bought a product or service
because of a television commercial (Hulkower 2014).
Some experts say that television commercials are in trouble. The prevalent use of
digital video recorders, or DVR, allows consumers to record any airing on television for
their viewing at a later time. The feature that is threatening to advertisers is that DVR
owners are engaging in ad-skipping, meaning they fast-forward through the commercials
and get back to their show without any restriction. With almost half of consumers owning
a DVR, advertisers are feeling the need to adopt new techniques to reach their target
segments (Hulkower 2014). Since advertisers pay the cable providers to air commercials,
the cable providers are feeling pressure to move customers to video on demand, or VOD
(Hulkower 2014). VOD still allows cable customers to view shows at a time other than
when they are aired, but it restricts the ability to fast forward and ad-skip. The expanding
role that DVR and VOD are playing is capping television advertising reach and growth
(Hulkower 2014).
Another video-watching medium that is threatening television advertising is
online streaming. According to comScore (2014), 56.7% of the American population
watched at least one online video in April 2014. In that same month, the average Internet
user spent 16 minutes and 49 seconds watching online video ads ("ComScore Releases
April 2014 U.S. Online Video Rankings” 2014). Firms are catching on because in 2013,
the Internet saw a 22% growth in online video advertisements (Hulkower 2014). In the
same way that advertisers prefer VOD to DVR because of the decreased risk of ad-
skipping, online videos also contain advertisements that are difficult to elude. Not only

3
are Internet video ads harder to dodge, they are also more targeted (Hulkower 2014).
Targeting makes for more effective advertising because it gives firms the ability to gain
insight on consumers and deliver messages that are more likely to pertain to them. Big
data enables firms to target consumers based on demographics, psychographics,
geography, behavior, and culture. For example, a television commercial for a luxury
watch is delivered to an entire zip code. Some of the people watching the show are not in
the market for the product, so the firm is wasting advertising dollars sending the message
to them. Big data allows the firm to segment the individuals viewing the online video and
determine if they are a potential consumer, thus saving them from waste. Since young
adults spend more time on the Internet, they are the most likely to see online ads and the
least likely to see television ads (Hulkower 2014). As the millennial population begins to
age, the use of online video ads can be projected to increase even more rapidly than it
already is, posing a big threat to the television commercial industry.
The retail banking industry draws nearly as many Americans as the auto industry.
A 2013 household survey conducted by the Federal Deposit Insurance Corporation, or
FDIC, found that around 88.4% of American households owned a checking account, a
number that is expected to increase as the U.S. economy continues to improve (Burhouse,
Chu, Goodstein, Northwood, Osaki and Sharma 2013). Interestingly, the 90.8% of
American households that owned a motor vehicle in 2012, a number that has decreased
every year since 2007 ("Hitchin' a Ride: Fewer Americans Have Their Own Vehicle”
2014). With these trends, it is not outrageous to consider that the retail banking industry
could surpass the auto industry within the next several years. Another mass appealing

4
factor about the retail banking industry is that anyone can have a bank account. Many
states require individuals under the age of 18 to have an adult co-signer to open a bank
account; however, while one must pass a test to operate a motor vehicle, there are no
qualifying tests to own an account. Furthermore, while a disabled individual may be
physically unable to operate a car, banks have adopted technology to improve the
accessibility to their services (“Accessible Banking” 2015).

5
Chapter 2: Theoretical Context
Everyone is different. Firms cannot simply create an advertisement and expect
that it will appeal to each type of consumer. Firms identify their target market and then
develop an advertisement that will appeal to that set of individuals. Successfully
identifying the target market can prove to be the pivotal factor of an advertising
campaign. When it comes to consumers, no two consumers are exactly alike, but firms
can group them into segments based on certain characteristics.
One framework that determines a segment’s willingness to process information
from advertisements is consumer readiness. Two factors of consumer readiness include
consumer motivation and consumer ability (MacInnis, Moorman, and Jaworski 1991).
Commonly referred to in related studies as “involvement”, motivation is best
defined as consumers’ determination to analyze the information presented in an
advertisement (MacInnis et al. 1991). A key driver of an individual’s motivation is the
personal relevance of the object at hand (Petty and Cacioppo 1983). When an individual
finds an object in an advertisement to be personally relevant, they recognize the influence
that the object has in fulfilling their “goals and [values]” (Petty and Cacippo 1984). For
example, an adult homeowner who is trying to improve the shape of his or her front lawn
will presumably have more motivation to pay attention and process a commercial for
weed killer than an adult who pays monthly rent at a high-rise apartment. The adult

6
homeowner used in this example would be classified as having high motivation to
“allocate processing resources” to the information in the ad due to the personal relevance
of the product (MacInnis et al. 1991). The high motivation this homeowner possesses
results in “[increased] production of support or counterarguments” in response to the
advertisement (Batra and Ray 1986). On the other hand, since apartment dwellers have
no lawn to maintain, weed killer has no personal relevance to a tenant. The apartment
tenant would have low motivation to give the weed killer advertisement a chance, and
would most likely avoid viewing it entirely. The lack of personal relevance leads to low
motivation, which in turn causes attention spans to focus on stimuli other than the
advertisement (MacInnis et al. 1991). The most likely option for a low motivation viewer
would be to switch to a different channel or to engage in other activities, such as reading
a magazine or completing household chores (Hulkower 2014). Ultimately, motivation
answers the question, “Why would I pay attention to this message?”
The other factor, ability, indicates a consumer’s proficiency in decoding
information in an advertisement (MacInnis et al. 1991). Higher knowledge about a
presented concept facilitates deeper processing capacity (Batra and Ray 1986). To
illustrate, consider a sports car commercial that includes material regarding horsepower,
gas mileage, and aerodynamic body design. A car enthusiast would probably be able
understand this advertisement more than a ten year old child. The car enthusiast’s
background and knowledge of automobiles would lead him to have a high ability to
comprehend and process information in the advertisement. In contrast, a child’s
unfamiliarity with automobile terms and statistics, coupled with having no an anchor for

7
comparison, would grade a child as having low ability to comprehend and process car
commercials. While the car enthusiast has a high ability in the sports car commercial, he
may have a low ability in processing information presented in a commercial for the
popular mobile game “Clash of Clans”. This is a fundamental element of ability; it varies
from object to object (Batra and Ray 1986). An individual’s ability is the answer to the
question, “Can I interpret this message?”
After defining consumer readiness, firms can shape their advertising strategies
using fragments of concepts outlined in prior research. The elaboration likelihood model,
or ELM, is highly regarded as being “among the most popular of [attitude change]
theories” (Eckert and Goldsby 1997). The ELM contains two types of cues in
persuasion—referred to as central and peripheral—that will be outlined so that banks can
understand who is most likely drawn by their ad message (Petty and Cacioppo 1983).
We will define central advertisements as those containing central cues. Central
cues involve rational (informational) appeals, which highlight the “core elements of the
object” in the commercial (Tsao 2014). Examples of central cues include tangible facts
about the firm, such as information about its products and services or any industry awards
won. The idea is that consumers will gain knowledge about the object in question, see the
utilitarian value of the message, and form an opinion based on the commercial’s
practicality (Tsao 2014). Returning to an example used previously, consider a sports car
commercial that includes facts about the car’s horsepower, gas mileage, and aerodynamic
body design. This advertisement would be considered high in central cues due to its
usage of informational appeals. Eckert and Goldsby (1997) consider this route to be more

8
valid in building “persistent, resistant to change” opinions; the opinions and attitudes
developed by consumers operating under central processing will last longer and will
withstand counterargument messages.
At the other end of the continuum lie peripheral advertisements containing
peripheral cues. Peripheral cues are those involving emotional appeals, such as an
attractive spokesperson, background music, or visual aesthetics (Petty and Cacioppo
1984). Advertisements that are laden with peripheral cues allow viewers “to be more
relaxed and enter another realm of life that brings them more happiness” (Tsao 2014,
Lehdonvirta 2009). To put this into perspective, picture a television commercial for a
steakhouse. There is jazz music playing in the background while the television screen
shows a video of a big, juicy steak that is glistening under the lights. A spokesperson with
a familiar voice, perhaps from a well-known show or movie, taunts and tempts the viewer
to satisfy their taste buds with this delicious meal. In this steakhouse example, not a
single tangible fact was communicated to the consumer. While the steakhouse could have
told the consumer details about their chef, customer reviews, or ranking in a local
magazine’s list of the top fifty local restaurants, they opted to capture the attention of the
consumer via peripheral cues.

9
Chapter 3: Situational Implications
To review, the goal is to determine what mass media advertising strategies are
most influential for consumers who have high versus low motivation/ability in the retail
bank purchase-decision process. When the concepts motivation and ability are cross
analyzed with central and peripheral advertising, there are disparities in how information
is processed. Here, we will examine studies that entail these disparities.
Highly motivated individuals are more likely to scrutinize advertisements, thus,
they have a tendency to be drawn by powerful central advertisements and disinterested in
peripheral advertisements (Eckert and Goldsby 1997). In a study conducted by Petty,
highly motivated individuals were presented with one high quality and one low quality
informational message (Petty and Cacioppo 1983). The subjects reported greater
effectiveness in messages containing high quality central cues than in messages
containing low quality central cues (Petty and Cacioppo 1983). The reasoning lies in
highly motivated individuals’ intrinsic desire to make the right purchase decision (Tsao
2014). Respondents in Petty’s study had high motivation about the topic at hand, and thus
processed the message more deeply, resulting in the repudiation of low quality arguments
and acceptance of high quality arguments. The more motivated a consumer is, the more
time they spend figuring out which product or service to purchase and the more carefully
they evaluate the alternatives ("Consumer Behavior: How People Make Buying

10
Decisions” n.d. ). Likewise, if an advertisement attempts to convince viewers by utilizing
peripheral cues instead of tangible information, the highly motivated consumer will
denounce the source and focus on the perceived weakness of the message (Petty and
Cacioppo 1984).
Less motivated consumers have a higher tendency to process peripheral elements
than central elements (Wang 2008). The Petty and Cacioppo (1983) study conducted with
highly motivated individuals also included low motivation individuals. The results
concluded that peripheral cues, such as source expertise and number of arguments, had
greater influence on low motivation respondents than did argument strength–a central cue
(Petty and Cacioppo 1983). The reasoning lies in the individuals’ lack of motivation; one
who does not want to process an advertisement does not want to “engage in message-
related thinking [so they resort to focusing] on available peripheral cues” (Cho 1999). If
they do not like the peripheral cues, they will dismiss the advertisement and cease
exposure, likely by changing the channel or engaging in other activities (Cho 1999).
According to these facts, let’s picture a young professional living in New York City, a
region with more than 50% of households lacking a motor vehicle (("Hitchin' a Ride:
Fewer Americans Have Their Own Vehicle” 2014). This individual would lack
motivation to process central cues in a car commercial due to the lack of product
relevance to the viewer. While miles per gallon and low down payments might appeal to
a suburban family seeking a new car, this NYC resident would put less focus on the facts
and more on the peripheral elements. If the music in the commercial was unappealing or

11
the spokesperson lacked perceived credibility, the young professional would stop paying
attention to the ad.
When it comes to high ability, central cues have a higher likelihood of being
understood due to consumers’ preexisting knowledge. The more knowledge an individual
has in a certain field, the more able they will be to analyze information in that field. A
paper conducted by Park and Kim (2006) identified consumers with high ability being
“more likely to engage in effortful cognitive activity [and greater] focus on the argument
quality” (Petty and Cacioppo 1984). Thus, in an advertisement with few or no facts
(peripheral advertisement) high ability viewers would be expected to focus on the low
quality of the argument. A commercial for a car dealership that says it is the best
dealership in town lacks concrete evidence. The low quality of the argument would lead
to a high ability individual’s rejection of the overall message in the advertisement.
Conversely, a high quality argument–one that is deep in factual information (central
advertisement)–would incite a high ability consumer to absorb the presented content. Had
the car dealership provided a high customer satisfaction rating based on a survey
conducted by an independent third party, the strength of the argument would presumably
be much greater, resulting in message absorption by a high ability consumer. In brief, a
strong argument in an advertisement will be more successful in influencing attitudes of
high ability consumers than would a weak argument that involves peripheral cues (Petty
and Cacioppo 1984).
A low ability consumer would be persuaded in an entirely different way from a
high ability consumer. Since this category of consumers has less prior knowledge or

12
expertise, their ability to comprehend facts in a message is minimal. As a result, low
ability consumers form attitudes by making inferences about simple cues rather than
focusing on concrete information or arguments (Petty and Cacioppo 1984). Rather than
judging the presented factual arguments, the low ability consumers will devote their
attention to peripheral cues, such as likability of the spokesperson, physical attractiveness
of the models, or sexual appeals embedded in the message (Geuens and De Pelsmacker
1998). The use of puffery, a common technique in peripheral advertising, leverages
emotional appeals without factual information. Firms will say they are the best in their
industry or that they are the most reliable, but they don’t substantiate their claims, and
they do so at the consumers’ expense. A lack of ability would make a consumer more
susceptible to believing the advertisement, despite a lack of claim substantiation. For
example, prior experiments found that when consumers have low ability, a spokesperson
with expert power builds the trustworthiness of the message, resulting in higher
persuasion (Petty and Cacioppo 1983). Even though the experts are typically paid top
dollar to make positive remarks in the television commercials we watch, one’s of
knowledge in their field, combined with the expert’s perceived position of power, renders
the message very persuasive. Picture a commercial about a carpet-cleaning product; a
scientist is featured in the advertisement claiming that the product is the best on the
market. Based on Petty and Cacioppo’s (1983) findings, we would say that even though
there is no proof backing the scientist’s claim, a viewer’s lack of knowledge about carpet-
cleaning products leads to their acceptance of the overall message.

13
Chapter 4: Research Methodology
Hypotheses
The two consumer characteristics–motivation and ability–that were previously
defined, in conjunction with the studies regarding central and peripheral advertisements,
are the basis of this journal. In order to apply these concepts to the retail banking
industry, a research study had to be designed employing television commercials produced
by a financial institution. Prior to determining a data collection method, hypotheses were
formed based on the motivation/ability and central/peripheral findings in previous
studies. This first set of hypotheses is formulated for the central advertisement scenario:
H1: High motivation bank consumers will respond more favorably to central ads
than will low motivation bank consumers
H2: High ability bank consumers will respond more favorably to central ads than
will low ability bank consumers
We formulate the following set of hypotheses to test for the peripheral advertisement
scenario:
H3: Low motivation bank consumers will respond more favorably to peripheral
ads than will high motivation bank consumers
H4: Low ability bank consumers will respond more favorably to peripheral ads
than will high ability bank consumers

14
Data Collection Method
An online survey questionnaire was identified as the preferred data collection
method to gather data from as many adults as possible in a short period of time. A 34-
question, three-part survey was designed using Qualtrics Survey Software. In order to
obtain a diverse sample size, respondents were found using various LinkedIn groups,
online blogs, and email listservs. Data was gathered for approximately three weeks from
491 respondents with I.P. addresses located across the country.
The first part of the three-part survey was designed to screen the motivation and
ability levels (high/low) of respondents. By coding the responses to each screening
question, respondents could be allocated a number of points that they earned toward their
motivation and ability scores. In order to decipher which individuals were high or low
motivation, a median-split technique was employed. Motivation was measured through
questions regarding typical purchasing decisions the respondent makes for their
household, the number of banks used, frequency of bank visits, and pre-purchase
information-searching and alternative-evaluating behavior (Figure 1). Additionally,
ability questions focused on: television/cable ownership and usage; comprehension of
account policies and financial terms; and employment in the financial services industry
(Figure 1).
Part two combined banking and television advertisements. Respondents were
shown two Capital One Bank television commercials that were uploaded to YouTube.

15
Figure 1. Screenshot of Screening Questions Regarding Motivation and Ability
The first video was a video intended to be a central advertisement. Central cues, such as
features of checking accounts at Capital One, dominated the overall message of the
advertisement. There was not a single human or physical object shown in the video.
Keywords would flash onto the screen as the spokesperson said them, and some light

16
background music played. Following the central advertisement, a series of attitudinal and
reactionary statements were responded to using a Likert scale (Figure 2). As a means of
confirming that the commercial was truly a central advertisement, respondents were
asked to analyze various characteristics of the video (Figure 3). The second video was
Figure 2. Screenshot of Attitudinal and Reactionary Statements After Video

17
supposed to be a peripheral advertisement. This ad mainly focused on the bank’s concern
for the local community. A banker from Capital One was shown going to a local
childcare center and bonding with the children there by joking, playing dress-up, riding
around on a tricycle, and painting with them. The video spokesperson, the owner of the
center, briefly mentions how the banker helped him get the financing needed to open two
new centers and how the bank helps local businesses grow. Following the peripheral
advertisement, the same series of attitudinal and reactionary statements found after the
central advertisement were responded to using the same Likert scale (Figure 2).
Respondents again analyzed characteristics of the video to confirm that the commercial
was truly a peripheral advertisement, as it was intended to be (Figure 3). If respondents
were Capital One customers, they were asked if each commercial made them want to
continue their relationship with the firm. If respondents were not Capital One customers,
they were asked if they thought each commercial made them want to start a relationship
with the firm.
Finally, part three was a standard demographic section (Appendix A). Not only
was the demographic section intended to identify demographic disparities in high and low
ability/motivation groups, but was also included to confirm that the sample was actually
diverse. Respondents were asked their age, marital status, household income, number of
children, number of persons in their household, and race/ethnicity. Respondents were not
required to answer any demographics questions—their responses were solely voluntary.

18
Figure 3. Screenshot of Video Characteristics Analysis Statements After Video
19
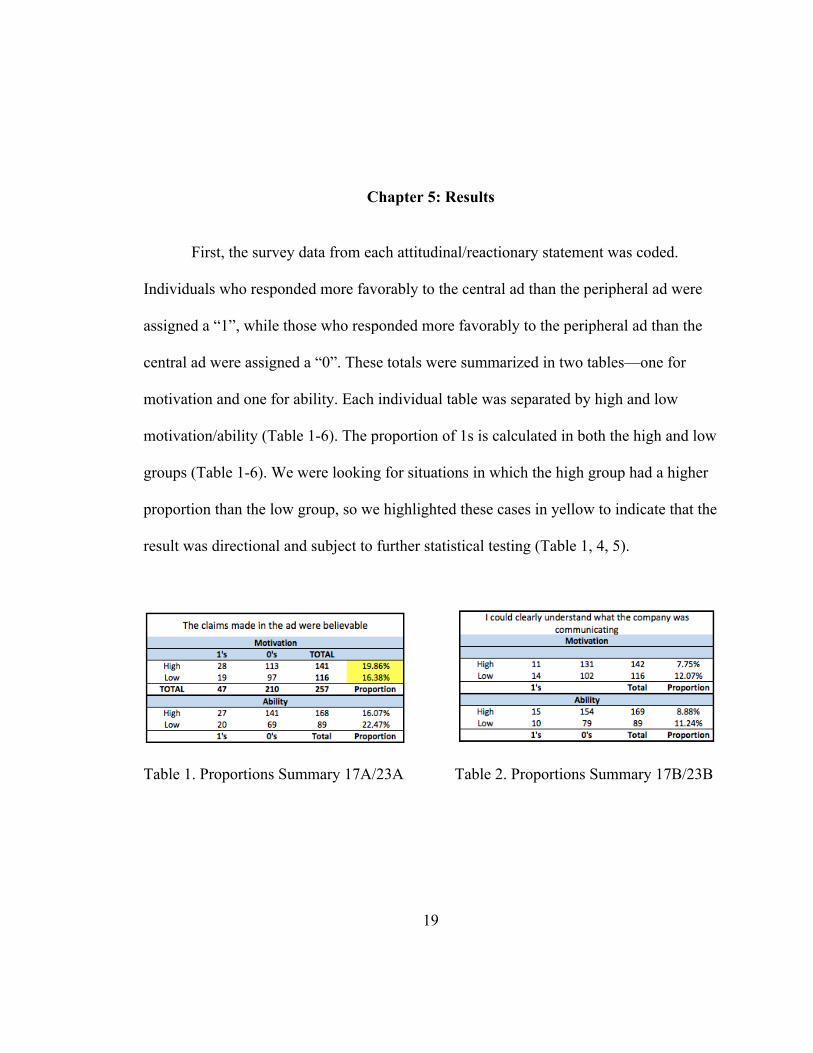
Chapter 5: Results
First, the survey data from each attitudinal/reactionary statement was coded.
Individuals who responded more favorably to the central ad than the peripheral ad were
assigned a “1”, while those who responded more favorably to the peripheral ad than the
central ad were assigned a “0”. These totals were summarized in two tables—one for
motivation and one for ability. Each individual table was separated by high and low
motivation/ability (Table 1-6). The proportion of 1s is calculated in both the high and low
groups (Table 1-6). We were looking for situations in which the high group had a higher
proportion than the low group, so we highlighted these cases in yellow to indicate that the
result was directional and subject to further statistical testing (Table 1, 4, 5).
Table 1. Proportions Summary 17A/23A Table 2. Proportions Summary 17B/23B

20
Table 3. Proportions Summary 17C/23C Table 4. Proportions Summary 17D/23D
Table 5. Proportions Summary 17E/23E Table 6. Proportions Summary 17F/23F
At this point, two-proportion Z-tests were conducted for each of the five yellow
cases. The p-values were all above the alpha value (0.05) except for the test involving
ability as seen in Table 5. With the p-value < 0.05 for the ability test, we reject the null
hypothesis that the proportion of 1s are equal in high and low ability respondents for the
statement “My willingness to purchase increased after viewing this ad”. To provide
further support to the statistical significance of the p-value, a confidence interval was
completed for the difference of the two population proportions—high and low ability.
The result proved that the true difference between the populations is reasonably anywhere
from .09% to 20% more high ability respondents reacting positively to the central ad than
the peripheral ad. Thus, it can be inferred with 95% confidence that in the American

21
population, more high ability bank consumers would have increased willingness to
purchase after watching a central ad versus a peripheral ad than low ability bank
consumers. These results support H2 and H4. Alternatively, based on the same tests it can
be inferred with 95% confidence that in the American population, more low ability bank
consumers would have increased willingness to purchase after watching a peripheral ad
versus a central ad than high ability bank consumers.
While only one out of twelve tests proved to have statistical significance, a total
of four out of the remaining eleven tests were directional in the way that they were
hypothesized (Figure 4).
Figure 4. Chart of the Five Tests in the Direction that was Hypothesized
High
Low
17/23A: 17/23D: 17/23D: 17/23E: 17/23E: Motivation Motivation Ability Motivation Ability

22
The results of the four directional tests are as follows, but can only be applied to the
sample population due to their lack of statistical significance:
Directionally more high motivation bank consumers versus low motivation bank
consumers saw the claims made in the central ad as more believable than claims
made in the peripheral ad (Table 1). Likewise, directionally more low motivation
bank consumers versus high motivation bank consumers saw the claims made in
the peripheral ad as more believable than claims made in the central ad (Table 1).
Directionally more high ability bank consumers versus low ability bank
consumers liked the central ad than the peripheral ad (Table 4). At the same time,
it was discovered that directionally more low ability bank consumers versus high
ability bank consumers liked the peripheral ad than the central ad (Table 4). The
same results were found for motivation (Table 4).
Directionally more high motivation bank consumers had increased willingness to
purchase after watching a central ad versus a peripheral ad than low motivation
bank consumers (Table 5). On the other hand, directionally more low motivation
bank consumers had increased willingness to purchase after watching a peripheral
ad versus a central ad than high motivation bank consumers (Table 5).

23
These results were expected to have more statistical significance so that we could apply
them to the U.S. population; however, the survey data was subject to several limitations
that will be outlined.
When analyzing the survey data, the mean responses for attitudinal/reactionary
and characteristics statements indicated that respondents from all four groups had a hard
time believing the claims or understanding the overall messages made in central and
peripheral ads. Despite this, they rated each ad moderately high on conveying their
intended messages. In other words, although individuals had difficulty believing and
comprehending the ads, they think that the banks conveyed their messages well. This
may speak to the preconceived perceptions that consumers have about banks.
To confirm that the videos watched were accurately labeled as central and
peripheral advertisements, we observed and compared responses to characteristics
statements (Appendix A). The first video (intended to be a central advertisement) was
identified by the sample as being less visually appealing and engaging, not very fun to
watch, and not at all humorous. It was also characterized as conveying the intended
message and relatively informative about products or services the company offers. These
responses are consistent with what a central advertisement typically entails—information
about the firm without captivating peripheral cues, such as humor or visually appealing
components. In contrast, the second video (intended to be a peripheral advertisement)
was identified by the sample as not very informative about products or services the
company offers and less effective at conveying the intended message. At the same time, it
was considered more visually appealing and engaging, more humorous, and fun to watch.

24
Fundamentally, this is what a peripheral advertisement aims to involve—peripheral cues
with little or no central cues. The second commercial incorporated visual elements to
capture the audience’s attention, humor to keep them entertained, and a lack of technical
jargon that could potentially go beyond the ability of its viewers.
There were negligible differences recorded between the central and peripheral
advertisement among all four groups regarding the questions about beginning a new
relationship with and starting a new relationship with Capital One. Responses to the
question about starting a new relationship with Capital One were predominantly negative
(Appendix B). This was not surprising, as it typically takes more than one advertisement
to generate an attitude change. In fact, according to the theory of effective frequency, it
typically takes at least three views of the same advertisement to build comfort,
familiarity, and acceptance of the brand and message (Jones 1997). Responses to the
question about continuing an existing relationship with Capital one generated a majority
of neutral or positive opinions about the idea (Appendix B). It was not anticipated that
there would be much disparity between respondent groups in this arena, as it typically
takes bad experiences or unexpected changes for consumers to have a desire to switch
from their current bank ("Why Consumers Exaggerate When They Threaten to Switch
Banks” 2013).
According to the demographics analysis, the high motivation and high ability
groups were mainly comprised of individuals with at least one college degree, 45 to 54
years of age, and an approximate household income of over $100,000. The low
motivation and low ability groups had an average age of the 35 to 44 years, with an

25
approximate household income under somewhere in the range of $75,000 and $99,999.
The low motivation/ability individuals also had a lower likelihood of having more than
one college degree. These noteworthy disparities between high and low
motivation/ability individuals are no coincidence. The longer someone is alive, the more
time they have accumulated managing their finances and using a bank. The same can be
said about income, as the further along someone is in their career path, the more money
they are likely to earn. Similarly, as individuals work in industry, they may be
encouraged to earn an additional degree to advance in the organizational chart. Also, the
average age of a graduate school student is mid- to late-thirties, suggesting that some
individuals in the low motivation/ability segments are currently considering going to or
are in graduate school (Martin 2012). With graduate school being an indicator of high
motivation/ability, one can expect that individuals in the age range of going to graduate
school could become high motivation/ability over time.
One intriguing finding centered upon consumers’ understanding of their accounts
and account policies. A summary of the screening data discovered that over one out of
four bank consumers lacks understanding or is unsure about their account and account
policies (Figure 5). Essentially, one out of four people is depositing their money into an
account at a bank with little or no clue as to what fees they may incur or what sort of
power their bank has over them. These consumers, in some cases, put their entire life
savings on the line due to their inability or lack of motivation to learn about their bank
account. As one may expect, an overwhelming majority of those who are unsure or

26
lacking understanding about their account and account policies are low ability bank
consumers (Table 7).
Figure 5. Understanding About Account & Policies
High Ability Low Ability Unsure 8 54
Lacking 26 40 Some/Complete 227 128
Table 7. Breakdown of Responses: Understanding About Account & Policies
13% 14%
73%
Lacking
Unsure
Some/Complete

27
Chapter 6: Discussion and Conclusion
There were some limitations associated with this research study that are worth
noting. For one, low ability respondents were under-represented. Low ability bank
consumers may be difficult to acquire when employing mainstream methods to acquire
respondents. Furthermore, low ability respondents may not be equipped to respond to a
survey they know little about. Additionally, the two videos in the survey were viewed
back-to-back and required that the respondents watch them with full attention. In a real-
life television-watching experience, viewers watch shows in between commercials or
casually watch commercials. In this research study, respondents were asked some
personal questions before being asked to put two videos under extensive review; it just is
not the same as casual television watching. Also, this study had a subjective evaluation of
respondents’ motivation and ability levels. This was a flaw of the overall survey, and as a
result, it is possible that some respondents were mislabeled. A more objective evaluation
would ensure higher validity in the screening phase of the survey. One very common
issue with surveys is the response biases that frequent survey respondents. Respondents
have a tendency to engage in extreme responding bias (i.e. Strongly Disagree/Agree) and
social desirability bias (i.e. responding in a way that makes you look or feel better).
Another potential issue with the survey was that all respondents viewed the central ad and
then the peripheral ad; the order could have influenced attitude formation. Finally, this
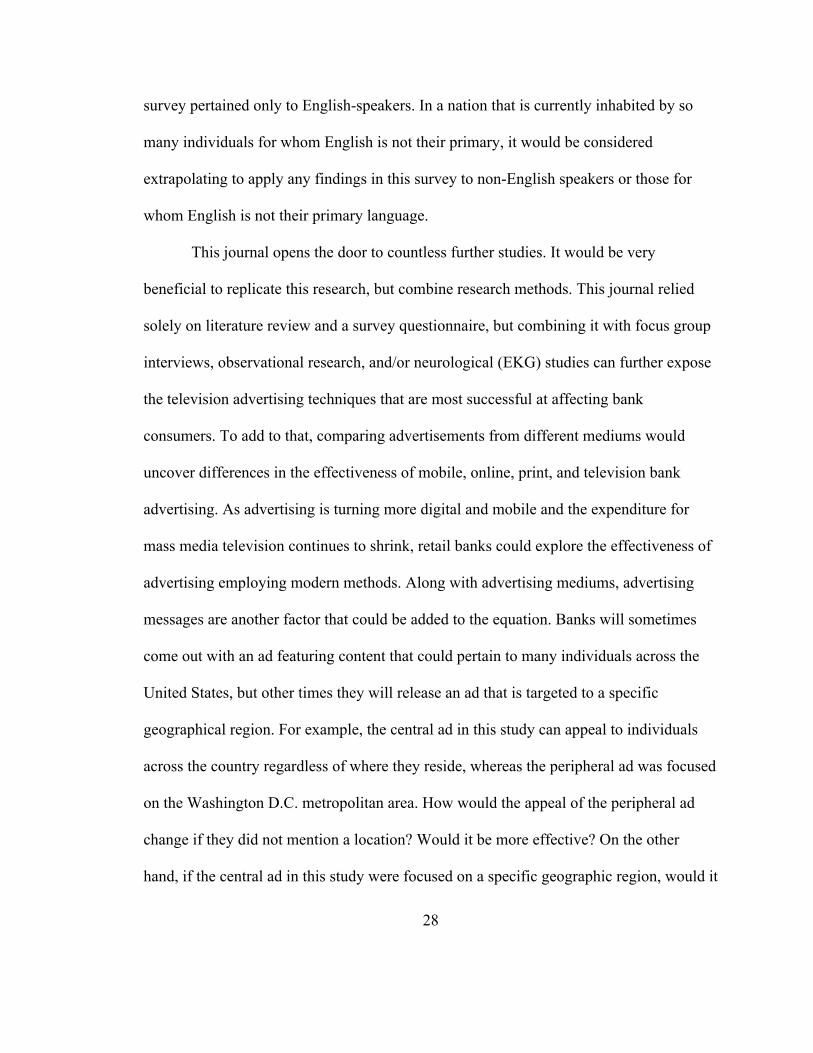
28
survey pertained only to English-speakers. In a nation that is currently inhabited by so
many individuals for whom English is not their primary, it would be considered
extrapolating to apply any findings in this survey to non-English speakers or those for
whom English is not their primary language.
This journal opens the door to countless further studies. It would be very
beneficial to replicate this research, but combine research methods. This journal relied
solely on literature review and a survey questionnaire, but combining it with focus group
interviews, observational research, and/or neurological (EKG) studies can further expose
the television advertising techniques that are most successful at affecting bank
consumers. To add to that, comparing advertisements from different mediums would
uncover differences in the effectiveness of mobile, online, print, and television bank
advertising. As advertising is turning more digital and mobile and the expenditure for
mass media television continues to shrink, retail banks could explore the effectiveness of
advertising employing modern methods. Along with advertising mediums, advertising
messages are another factor that could be added to the equation. Banks will sometimes
come out with an ad featuring content that could pertain to many individuals across the
United States, but other times they will release an ad that is targeted to a specific
geographical region. For example, the central ad in this study can appeal to individuals
across the country regardless of where they reside, whereas the peripheral ad was focused
on the Washington D.C. metropolitan area. How would the appeal of the peripheral ad
change if they did not mention a location? Would it be more effective? On the other
hand, if the central ad in this study were focused on a specific geographic region, would it

29
be more or less effective? Another potential focus could involve conducting a case study
on the Hispanic American population. With the Spanish-speaking population getting
more acclimated to American culture and their families cultivating second generation
Hispanic Americans, all marketers need to consider directing advertisements to this
growing demographic. There may be cultural and behavioral differences between
Americans and Hispanic immigrants. Replicating this study to solely Hispanic Americans
would be relatively simple compared to other further studies we have just outlined.
Furthermore, as the Millennial (Generation Y) population—the generation with the most
fear about their financial situation (Hulkower 2014)—enters the full-time workforce, it
will be interesting to see how their banking behavior differs from their parents’ and
grandparents’. What appeals to Baby Boomers and Generation X’ers may prove to be
ineffective to Millennials.
In order to fully understand how to advertise to consumers in any industry, firms
need to know their audience. With the introduction of Web 2.0 and data analytics in the
past decade, it is becoming easier than ever to gain insights about Americans. While this
is a luxury, it is also a huge task that leads to more problems to solve. Which customer
segments are the most profitable? Is it worth the marketing investment to try and gain
business from each customer segment or do you want to appeal to a niche market? And
lastly, how do you tailor advertisements to each customer segment and where do you
deliver these messages in order to capture the largest share of the desired segments? This
is an ongoing and dynamic task for marketers.

30
References
"Accessible Banking." Bank of America. Bank of America Corporation, 2015. Web. 08
Apr. 2015.
Batra, Rajeev, and Michael L. Ray. "Situational Effects of Advertising Repetition: The
Moderating Influence of Motivation, Ability, and Opportunity to Respond."
Journal of Consumer Research. 4th ed. Vol. 12. N.p.: Oxford UP, 1986. 432-45.
JSTOR. Web.
"Brands Like Mcd, Pizza Hut, KFC Going The Digital, Social Media Way For Increasing
Customer Retention, Acquisition." FRPT- Retail Snapshot (2014): 20. Business
Source Complete. Web. 31 Mar. 2015.
Burhouse, Susan, Karyen Chu, Ryan Goodstein, Joyce Northwood, Yazmin Osaki, and
Dhruv Sharma. "Executive Summary." 2013 FDIC National Survey of Unbanked
and Underbanked Households (2014): 2-11. FDIC. Federal Deposit Insurance
Corporation, Oct. 2014. Web. 8 Apr. 2015.
Cho, Chang-Hoan. "How Advertising Works on the WWW: Modified Elaboration
Likelihood Model." Journal of Current Issues and Research in Advertising 21.1
(1999): 34-50. Taylor & Francis Group. Informa Group, 8 May 2012. Web. 03
Apr. 2015.

31
"ComScore Releases April 2014 U.S. Online Video Rankings." ComScore. ComScore,
Inc, 21 May 2014. Web. 08 Apr. 2015.
"Consumer Behavior: How People Make Buying Decisions." Principles of Marketing.
N.p.: n.p., n.d. N. pag. Principles of Marketing. New Charter University. Web. 02
Apr. 2015.
Eckert, James A., and Thomas J. Goldsby. "Using the Elaboration Likelihood Model to
Guide Customer Service-Based Segmentation." International Journal of Physical
Distribution & Logistics Management 27.9 (1997): 600-15. ProQuest. Web. 1
Apr. 2015.
Geuens, Maggie, and Patrick De Pelsmacker (1998) ,"Need For Cognition and the
Moderating Role of the Intensity of Warm and Humorous Advertising Appeals",
in AP - Asia Pacific Advances in Consumer Research Volume 3, eds. Kineta
Hung and Kent B. Monroe, Provo, UT : Association for Consumer Research,
Pages: 74-80.
"Hitchin' a Ride: Fewer Americans Have Their Own Vehicle." Transportation Research
Institute. The Regents of the University of Michigan, 13 Jan. 2014. Web. 08 Apr.
2015.
Hulkower, Billy. "Television and Online Video Ads - US - April 2014." Mintel
Academic. Mintel Group Ltd, Apr. 2014. Web. 8 Apr. 2015.
Jones, John Philip. "What Does Effective Frequency Mean In 1997?." Journal Of
Advertising Research 37.4 (1997): 14-20. Communication & Mass Media
Complete. Web. 7 Apr. 2015.

32
Lehdonvirta, Vili. "Virtual Item Sales as a Revenue Model: Identifying Attributes That
Drive Purchase Decisions." Electronic Commerce Research 9.1-2 (2009): 97-113.
SpringerLink. Springer International Publishing AG, 10 Mar. 2009. Web. 02 Apr.
2015.
Maclnnis, Deborah J., Christine Moorman, and Bernard J. Jaworski. "Enhancing And
Measuring Consumers' Motivation, Opportunity, And Ability To Process Brand
Information From Ads." Journal Of Marketing 55.4 (1991): 32-53.
Communication & Mass Media Complete. Web. 1 Apr. 2015.
Martin, Don. "4 Graduate School Myths Debunked." US News. U.S. News & World
Report, 13 Apr. 2012. Web. 07 Apr. 2015.
O’Connor, Shawn P. "Word of Mouth Is the Best Ad." Bloomberg Business Week.
Bloomberg, Dec. 2012. Web. 08 Apr. 2015.
Pallotta, Frank. "Super Bowl XLIX Posts the Largest Audience in TV History."
CNNMoney. Cable News Network, 2 Feb. 2015. Web. 08 Apr. 2015. (intro)
Park, Do-Hyung, and Sara Kim. "The Effects of Consumer Knowledge on Message
Processing of Electronic Word-of-mouth via Online Consumer Reviews."
Electronic Commerce Research and Applications 7.4 (2008): 399-410.
ScienceDirect. Elsevier B.V., 8 Jan. 2008. Web. 03 Apr. 2015.
Petty, Richard E., and John T. Cacioppo. "Central and Peripheral Routes to Persuasion:
Application to Advertising." Advertising and Consumer Psychology (1983): 521-
31. UTS Web Server. University of Texas at Austin, Fall 2012. Web. 8 Apr. 2015.

33
Petty, Richard E., and John T. Cacioppo. "The Effects of Involvement on Responses to
Argument Quantity and Quality: Central and Peripheral Routes to Persuasion."
Journal of Personality and Social Psychology 64.1 (1984): 69-81. APA
PsychNET. American Psychological Association, 29 Mar. 2006. Web. 7 Apr.
2015.
Poggi, Jeanine. "Is The Super Bowl Worth The Price? For These Advertisers, It Might
Be." Advertising Age 86.3 (2015): 0008. Business Source Premier. Web. 31 Mar.
2015.
Tsao, Wen-Chin. "Exploring Routes to Persuasive Online Advertising." International
Journal of Business and Management 9.12 (2014): 35-48. Canadian Center of
Science and Education. 22 Nov. 2014. Web.
Wang, Sijun, Sharon E. Beatty, and David L. Mothersbaugh. "Congruity's Role in
Website Attitude Formation." Journal of Business Research 62.6 (2008): 609-15.
Electronic Journal Center. OhioLINK, June 2009. Web.
"Why Consumers Exaggerate When They Threaten to Switch Banks." The Financial
Brand. N.p., 16 Dec. 2013. Web. 07 Apr. 2015.

34
Appendix A: Survey Questionnaire

35

36
End of Part I: Screening Questions
Start of Part II: Advertising & Videos

37

38

39

40

41
End of Part II: Advertising and Videos
Start of Part III: Demographics

42

43
End of Part III: Demographics

44
Appendix B: Continuing or Starting a Relationship with Bank After Viewing Ads