massachusetts comprehensive assessment system - boston public
TRANSCRIPT
Massachusetts Comprehensive Assessment System Results of Spring 2011
ELA (Gr.3-8 & 10) Mathematics (Gr.3-8 & 10), Science (Gr. 5, 8, and high school)
Office of Research, Assessment and Evaluation
THE SCHOOL COMMITTEE OF THE CITY OF BOSTON
Rev. Gregory G. Groover, Sr, Chair
Marchelle Raynor, Vice-Chair
John F. Barros, Member
Alfreda J.Harris, Member
Claudio Martinez, Member
Michael D. O’Neill, Member
Mary Tamer, Member
SUPERINTENDENT OF SCHOOLS
Carol R. Johnson
OFFICE OF RESEARCH, ASSESSMENT, AND EVALUATION
Kamal Chavda, Assistant Superintendent
Prepared by the Office of Research, Assessment and Evaluation September 2011

TABLE OF CONTENTS
Executive Summary .................................................................................................................... 1 Summary of the 2011 Districtwide Results by Subject ............................................................ 4
ELA (grades 3-8 & 10) ......................................................................................................... 4
% Passing (Needs Improvement or higher) .......................................................................... 4
% Proficient & Advanced ........................................................................................................ 4
By Grade Level .................................................................................................................. 4
By Racial/Ethnic Groups .................................................................................................. 5
By Other AYP Subgroups ................................................................................................ 6
Mathematics (grades 3-8 & 10) ........................................................................................... 8
% Passing (Needs Improvement or higher) .......................................................................... 8
% Proficient & Advanced ........................................................................................................ 8
By Grade Level .................................................................................................................. 8
By Racial/Ethnic Groups .................................................................................................. 9
By Other AYP Subgroups .............................................................................................. 10
Long Term Trends in Racial/Ethnic Achievement Gap (Grade 10) ............................................... 11
Science (grades 5, 8 & high school) .................................................................................. 13
% Passing (Needs Improvement or higher) ........................................................................ 13
% Proficient & Advanced ...................................................................................................... 13
By Grade Level ................................................................................................................ 13
By Racial/Ethnic Groups ................................................................................................ 14
By Other AYP Subgroups .............................................................................................. 15
High School - Competency Determination Results ......................................................... 16
AppendixA: MCAS Background .................................................................................... A-1
Appendix B: 2006-2011 MCAS Results by Subgroup .................................................. B-1
Appendix C: 2011 MCAS Results by School ................................................................. C-1
1
Executive Summary
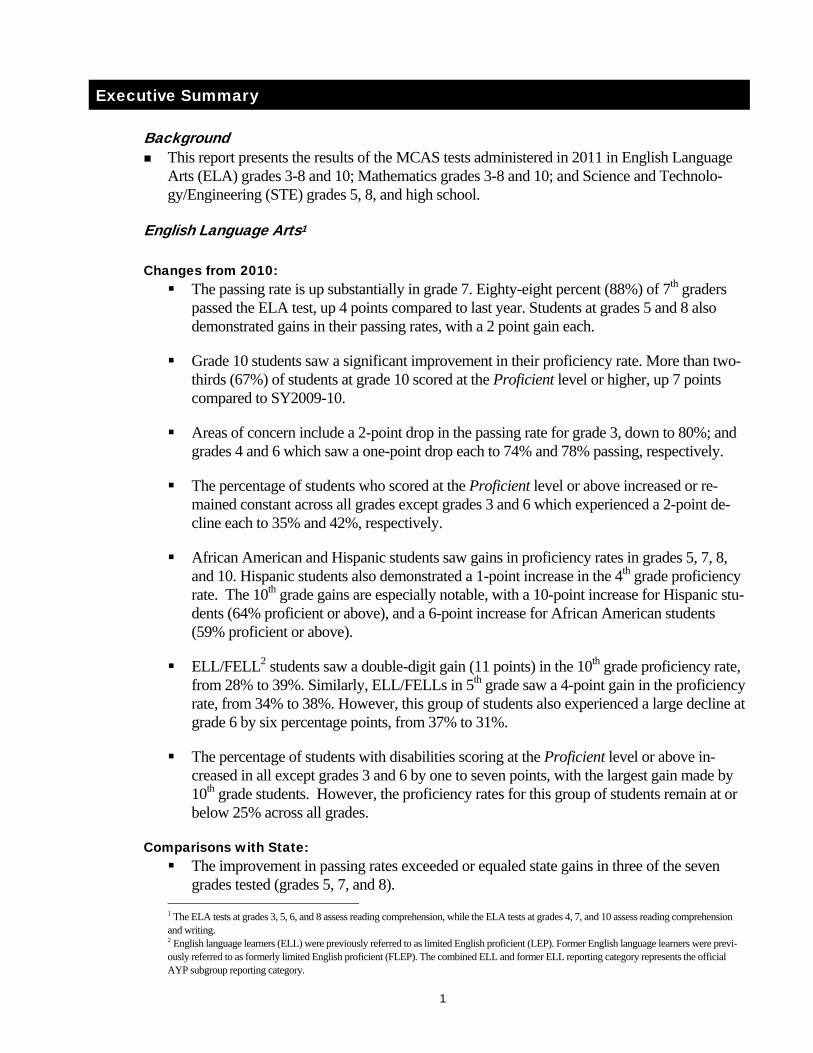
Background This report presents the results of the MCAS tests administered in 2011 in English Language
Arts (ELA) grades 3-8 and 10; Mathematics grades 3-8 and 10; and Science and Technolo-gy/Engineering (STE) grades 5, 8, and high school.
English Language Arts1 Changes from 2010: The passing rate is up substantially in grade 7. Eighty-eight percent (88%) of 7th graders
passed the ELA test, up 4 points compared to last year. Students at grades 5 and 8 also demonstrated gains in their passing rates, with a 2 point gain each.
Grade 10 students saw a significant improvement in their proficiency rate. More than two-thirds (67%) of students at grade 10 scored at the Proficient level or higher, up 7 points compared to SY2009-10.
Areas of concern include a 2-point drop in the passing rate for grade 3, down to 80%; and grades 4 and 6 which saw a one-point drop each to 74% and 78% passing, respectively.
The percentage of students who scored at the Proficient level or above increased or re-mained constant across all grades except grades 3 and 6 which experienced a 2-point de-cline each to 35% and 42%, respectively.
African American and Hispanic students saw gains in proficiency rates in grades 5, 7, 8, and 10. Hispanic students also demonstrated a 1-point increase in the 4th grade proficiency rate. The 10th grade gains are especially notable, with a 10-point increase for Hispanic stu-dents (64% proficient or above), and a 6-point increase for African American students (59% proficient or above).
ELL/FELL2 students saw a double-digit gain (11 points) in the 10th grade proficiency rate, from 28% to 39%. Similarly, ELL/FELLs in 5th grade saw a 4-point gain in the proficiency rate, from 34% to 38%. However, this group of students also experienced a large decline at grade 6 by six percentage points, from 37% to 31%.
The percentage of students with disabilities scoring at the Proficient level or above in-creased in all except grades 3 and 6 by one to seven points, with the largest gain made by 10th grade students. However, the proficiency rates for this group of students remain at or below 25% across all grades.
Comparisons with State: The improvement in passing rates exceeded or equaled state gains in three of the seven
grades tested (grades 5, 7, and 8). 1 The ELA tests at grades 3, 5, 6, and 8 assess reading comprehension, while the ELA tests at grades 4, 7, and 10 assess reading comprehension and writing. 2 English language learners (ELL) were previously referred to as limited English proficient (LEP). Former English language learners were previ-ously referred to as formerly limited English proficient (FLEP). The combined ELL and former ELL reporting category represents the official AYP subgroup reporting category.
2
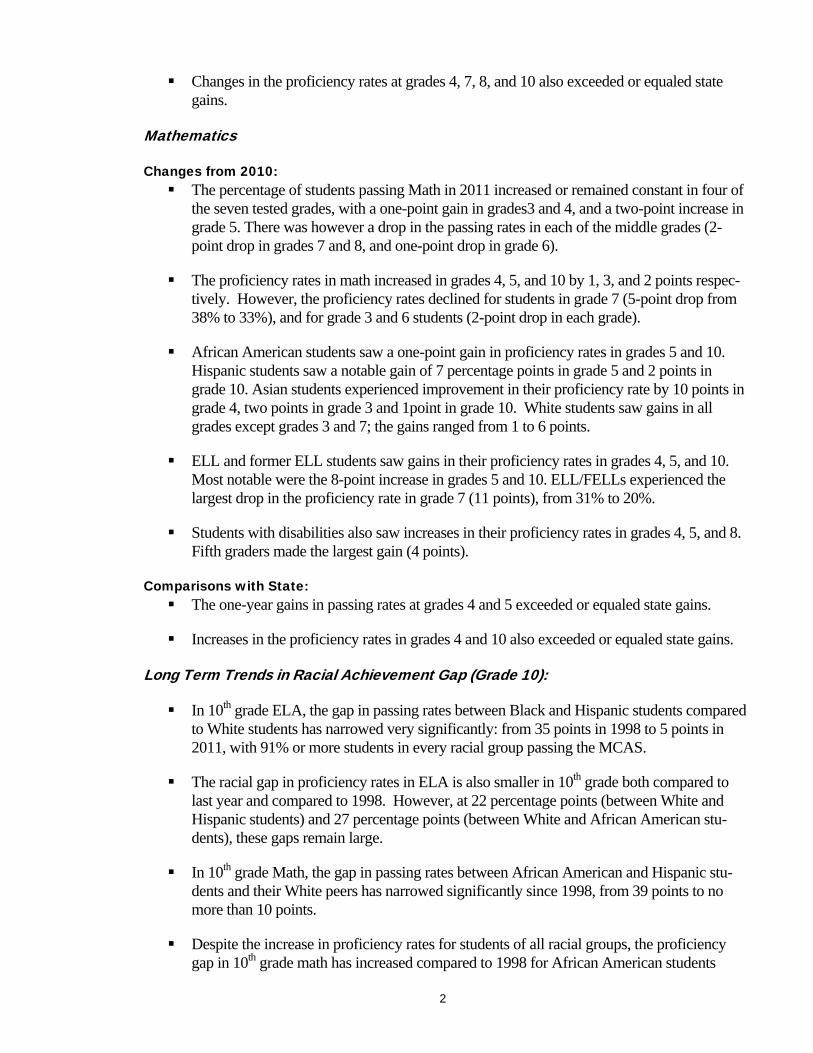
Changes in the proficiency rates at grades 4, 7, 8, and 10 also exceeded or equaled state gains.
Mathematics
Changes from 2010: The percentage of students passing Math in 2011 increased or remained constant in four of
the seven tested grades, with a one-point gain in grades3 and 4, and a two-point increase in grade 5. There was however a drop in the passing rates in each of the middle grades (2-point drop in grades 7 and 8, and one-point drop in grade 6).
The proficiency rates in math increased in grades 4, 5, and 10 by 1, 3, and 2 points respec-tively. However, the proficiency rates declined for students in grade 7 (5-point drop from 38% to 33%), and for grade 3 and 6 students (2-point drop in each grade).
African American students saw a one-point gain in proficiency rates in grades 5 and 10. Hispanic students saw a notable gain of 7 percentage points in grade 5 and 2 points in grade 10. Asian students experienced improvement in their proficiency rate by 10 points in grade 4, two points in grade 3 and 1point in grade 10. White students saw gains in all grades except grades 3 and 7; the gains ranged from 1 to 6 points.
ELL and former ELL students saw gains in their proficiency rates in grades 4, 5, and 10. Most notable were the 8-point increase in grades 5 and 10. ELL/FELLs experienced the largest drop in the proficiency rate in grade 7 (11 points), from 31% to 20%.
Students with disabilities also saw increases in their proficiency rates in grades 4, 5, and 8. Fifth graders made the largest gain (4 points).
Comparisons with State: The one-year gains in passing rates at grades 4 and 5 exceeded or equaled state gains.
Increases in the proficiency rates in grades 4 and 10 also exceeded or equaled state gains.
Long Term Trends in Racial Achievement Gap (Grade 10):
In 10th grade ELA, the gap in passing rates between Black and Hispanic students compared to White students has narrowed very significantly: from 35 points in 1998 to 5 points in 2011, with 91% or more students in every racial group passing the MCAS.
The racial gap in proficiency rates in ELA is also smaller in 10th grade both compared to last year and compared to 1998. However, at 22 percentage points (between White and Hispanic students) and 27 percentage points (between White and African American stu-dents), these gaps remain large.
In 10th grade Math, the gap in passing rates between African American and Hispanic stu-dents and their White peers has narrowed significantly since 1998, from 39 points to no more than 10 points.
Despite the increase in proficiency rates for students of all racial groups, the proficiency gap in 10th grade math has increased compared to 1998 for African American students
3
(from 28 to 31 points) compared to White students; it remains unchanged for Hispanic stu-dents (27 points).
Science
Changes from 2010: The percentage of students passing one of the four science tests (Biology, Physics, Chemis-
try, or Technology/Engineering) in grade 10 increased by 2 points, from 80% to 82%.
Students in grade 5 experienced a notable decline in both the passing and proficiency rates (10 and 4-point declines, respectively). Students in grade 8 also saw a decline the passing rate, from 53% to 50%.
All four major racial/ethnic groups in grade 10 saw an increase in the percentage of stu-dents scoring Proficient or higher on the science tests, with the largest gain made by White students (9 points). Asian students in grade 8 and all racial/ethnic groups in grade 5 saw a decline in their proficiency rates. The largest drop was experienced by Asian students in grade 5 (12- point decline).
Students with disabilities, low income students and English language learners experienced an improvement in their proficiency rates in science in grade 10, but saw a decline in grade 5.
Comparisons with State: In grade 10, where passing a science test is a graduation requirement, the one-year gain in
the passing rate exceeded statewide gains.
High School – Competency Determination
To date, 70% of the class of 2013 (grade10 students in SY2010-2011) has already met or par-tially met the state graduation requirements by passing the ELA, Mathematics, and Science tests. This represents a 13-point gain compared to the class of 2010 (57%), the 1st class that was required to pass Science as part of the new CD standard in order to be eligible to receive a high school diploma.
Forty-eight percent (48%) of the students in the class of 2013 have fully met the new CD standard by scoring at the Proficient level or higher in both ELA and Math and by scoring at the Needs Improvement level or higher in Science. This represents a 4-point gain compared to the classes of 2011 and 2012, and an 9-point increase compared to the class of 2010.
Results of the high school Science & Technology/Engineering tests show that a majority of students in the class of 2013 (77%) have already met their new STE competency determination requirement.
4
Summary of the 2011 Districtwide Results by Subject
MCAS English Language Arts Results Percent Difference in Passing, Proficient or Higher
2010 - 2011 English Language Arts % Passing (Needs Improvement or higher)
2007 2008 2009 2010 2011
Percentage Point Difference2011 - 2010 2007 2008 2009 2010 2011
Percentage Point Difference2011 - 2010
Grade 3 78% 74% 77% 82% 80% -2 91% 89% 90% 93% 91% -2
Grade 4 75% 73% 74% 75% 74% -1 90% 87% 89% 89% 88% -1
Grade 5 80% 80% 83% 79% 81% 2 91% 91% 92% 91% 91% 0
Grade 6 81% 80% 80% 79% 78% -1 92% 91% 90% 90% 91% 1
Grade 7 82% 82% 84% 84% 88% 4 92% 92% 93% 93% 94% 1
Grade 8 85% 85% 86% 85% 87% 2 93% 93% 93% 94% 94% 0
Grade 10 87% 91% 91% 92% 92% 0 95% 96% 96% 96% 97% 1
Exceed or equal State gains
StateBPS
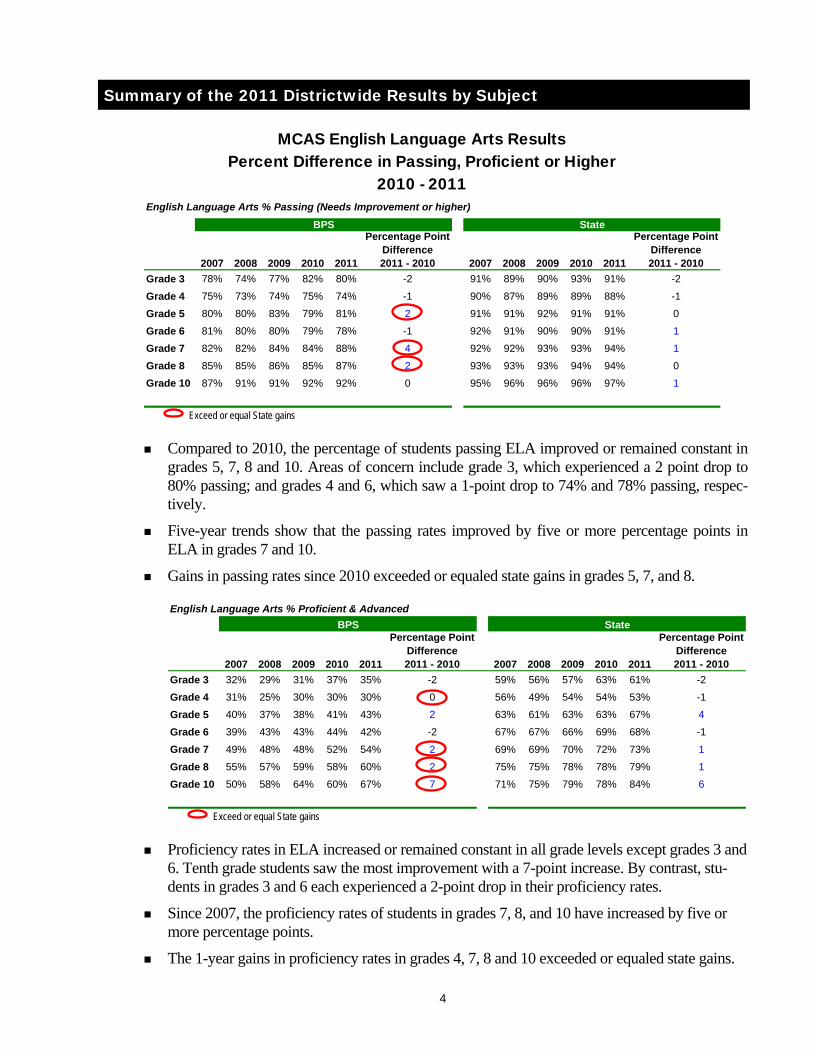
Compared to 2010, the percentage of students passing ELA improved or remained constant in grades 5, 7, 8 and 10. Areas of concern include grade 3, which experienced a 2 point drop to 80% passing; and grades 4 and 6, which saw a 1-point drop to 74% and 78% passing, respec-tively.
Five-year trends show that the passing rates improved by five or more percentage points in ELA in grades 7 and 10.
Gains in passing rates since 2010 exceeded or equaled state gains in grades 5, 7, and 8.
English Language Arts % Proficient & Advanced
2007 2008 2009 2010 2011
Percentage Point Difference2011 - 2010 2007 2008 2009 2010 2011
Percentage Point Difference2011 - 2010
Grade 3 32% 29% 31% 37% 35% -2 59% 56% 57% 63% 61% -2
Grade 4 31% 25% 30% 30% 30% 0 56% 49% 54% 54% 53% -1
Grade 5 40% 37% 38% 41% 43% 2 63% 61% 63% 63% 67% 4
Grade 6 39% 43% 43% 44% 42% -2 67% 67% 66% 69% 68% -1
Grade 7 49% 48% 48% 52% 54% 2 69% 69% 70% 72% 73% 1
Grade 8 55% 57% 59% 58% 60% 2 75% 75% 78% 78% 79% 1
Grade 10 50% 58% 64% 60% 67% 7 71% 75% 79% 78% 84% 6
Exceed or equal State gains
StateBPS
Proficiency rates in ELA increased or remained constant in all grade levels except grades 3 and 6. Tenth grade students saw the most improvement with a 7-point increase. By contrast, stu-dents in grades 3 and 6 each experienced a 2-point drop in their proficiency rates.
Since 2007, the proficiency rates of students in grades 7, 8, and 10 have increased by five or more percentage points.
The 1-year gains in proficiency rates in grades 4, 7, 8 and 10 exceeded or equaled state gains.
5
English Language Arts % Proficient & Advanced by Racial/Ethnic Group
2007 2008 2009 2010 2011
Percentage Points Difference
2011 – 2010 Grade 3 AA/Black 27% 24% 25% 33% 28% -5 Asian 46% 50% 45% 46% 51% 5 Latino/Hispanic 26% 23% 25% 32% 31% -1 White 54% 48% 55% 64% 62% -2
Grade 4 AA/Black 26% 19% 25% 23% 22% -1 Asian 52% 44% 51% 47% 51% 4 Latino/Hispanic 23% 20% 26% 24% 25% 1 White 56% 46% 49% 54% 52% -2
Grade 5 AA/Black 32% 31% 32% 34% 36% 2 Asian 60% 59% 60% 64% 64% 0 Latino/Hispanic 35% 30% 31% 36% 38% 2 White 61% 61% 59% 59% 64% 5
Grade 6 AA/Black 30% 37% 37% 38% 33% -5 Asian 63% 71% 66% 66% 67% 1 Latino/Hispanic 35% 38% 36% 40% 39% -1 White 62% 60% 65% 62% 60% -2
Grade 7 AA/Black 41% 39% 40% 42% 47% 5 Asian 69% 70% 75% 73% 72% -1 Latino/Hispanic 41% 40% 39% 45% 48% 3 White 72% 75% 68% 76% 76% 0
Grade 8 AA/Black 48% 49% 51% 52% 53% 1 Asian 74% 76% 80% 81% 76% -5 Latino/Hispanic 48% 51% 55% 52% 55% 3 White 80% 79% 82% 75% 80% 5
Grade 10 AA/Black 40% 48% 56% 53% 59% 6 Asian 76% 80% 81% 80% 84% 4 Latino/Hispanic 43% 50% 59% 54% 64% 10 White 74% 79% 85% 78% 86% 8
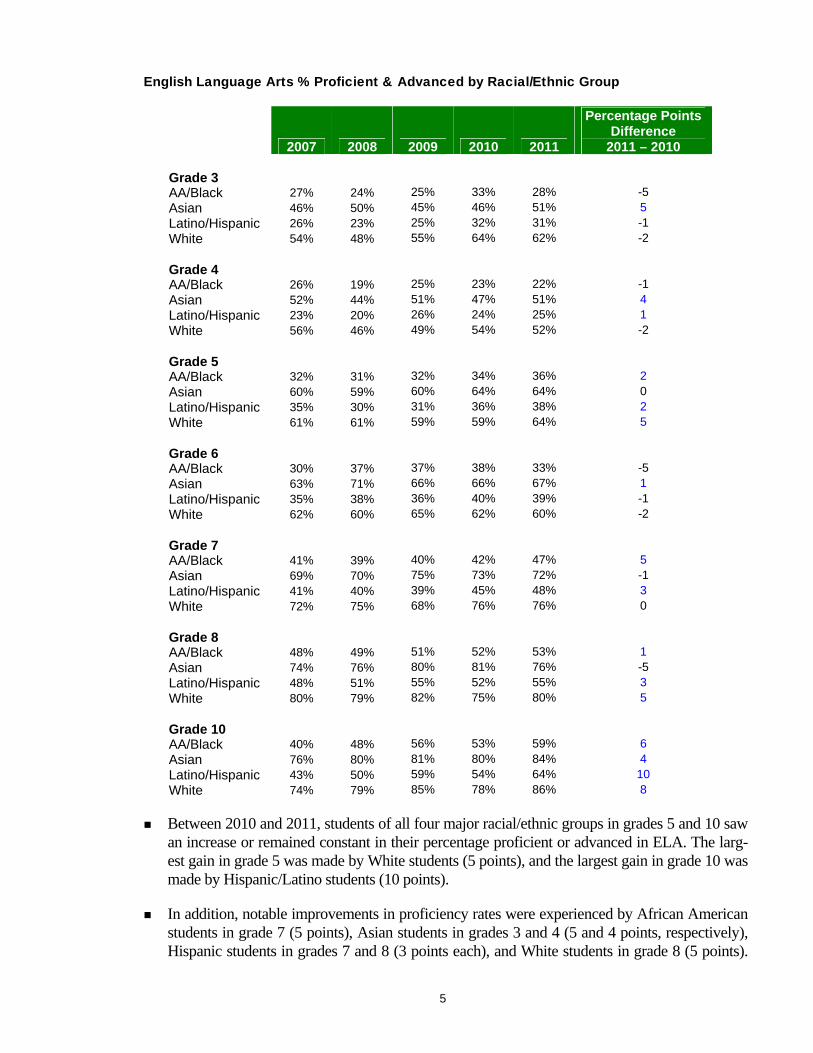
Between 2010 and 2011, students of all four major racial/ethnic groups in grades 5 and 10 saw
an increase or remained constant in their percentage proficient or advanced in ELA. The larg-est gain in grade 5 was made by White students (5 points), and the largest gain in grade 10 was made by Hispanic/Latino students (10 points).
In addition, notable improvements in proficiency rates were experienced by African American students in grade 7 (5 points), Asian students in grades 3 and 4 (5 and 4 points, respectively), Hispanic students in grades 7 and 8 (3 points each), and White students in grade 8 (5 points).
6
The largest drop in the ELA proficiency rate was experienced by African American students in grades 3 and 6, and Asian students in grade 8.
From 2010 to 2011, the proficiency gap between African American and White students wid-ened by 1 to 4 percentage points in grades 3, 5, 6 ,8, and 10, while the gap narrowed markedly by five points in grade 7 and 1point in grade 4. Hispanic students have narrowed the proficien-cy gap with White students in ELA by 1 to 3 percentage points in grades 3, 4, 6, 7, and 10.
English Language Arts % Proficient & Advanced by other AYP Subgroups
2007 2008 2009 2010 2011
Percentage Points Difference 2011 - 2010
Grade 3 Students w/ Disab 12% 10% 10% 14% 10% -4 ELL/FELL 26% 21% 22% 33% 32% -1 Low Income 27% 25% 26% 32% 30% -2
Grade 4 Students w/ Disab 7% 6% 7% 6% 7% 1 ELL/FELL 28% 18% 25% 27% 27% 0 Low Income 26% 21% 25% 25% 25% 0
Grade 5 Students w/ Disab 11% 8% 11% 11% 14% 3 ELL/FELL 37% 29% 29% 34% 38% 4 Low Income 36% 32% 33% 36% 39% 3
Grade 6 Students w/ Disab 9% 12% 12% 14% 13% -1 ELL/FELL 24% 30% 34% 37% 31% -6 Low Income 35% 39% 38% 40% 37% -3
Grade 7 Students w/ Disab 10% 9% 11% 14% 19% 5 ELL/FELL 26% 16% 30% 38% 33% -5 Low Income 43% 42% 41% 45% 48% 3
Grade 8 Students w/ Disab 18% 17% 21% 18% 24% 6 ELL/FELL 18% 20% 25% 35% 34% -1 Low Income 50% 51% 55% 53% 55% 2
Grade 10 Students w/ Disab 12% 19% 23% 18% 25% 7 ELL/FELL 23% 27% 23% 28% 39% 11 Low Income 45% 54% 59% 54% 63% 9
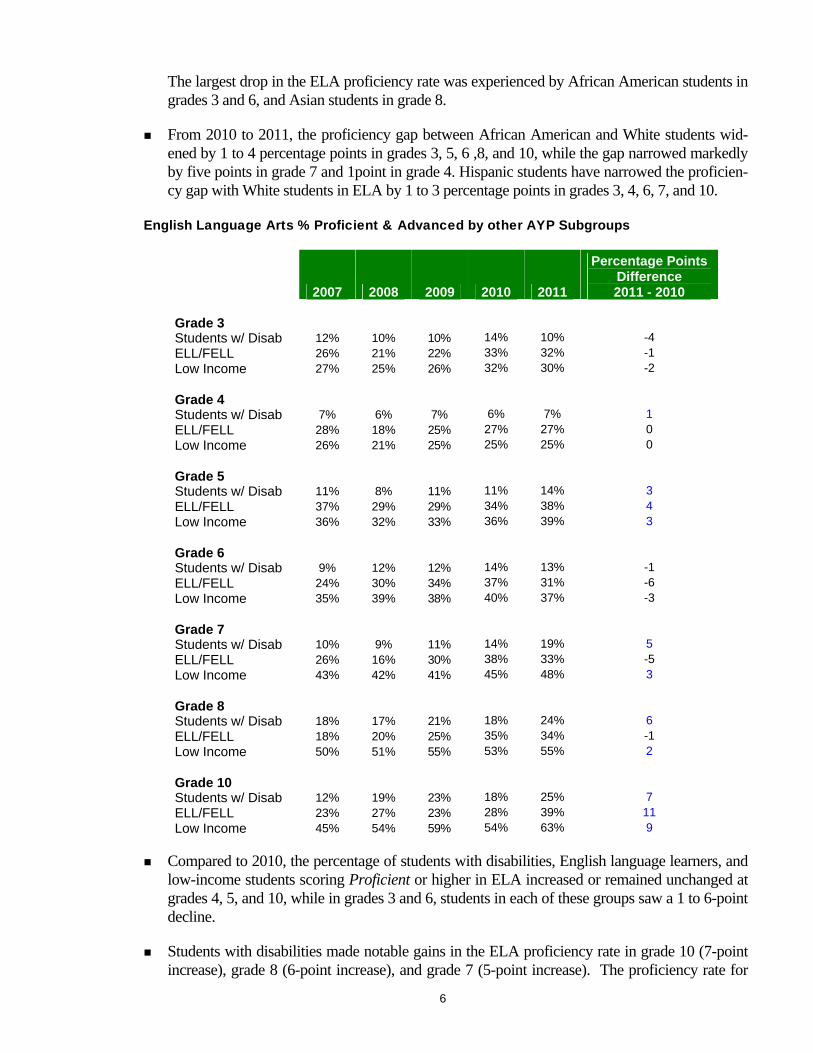
Compared to 2010, the percentage of students with disabilities, English language learners, and low-income students scoring Proficient or higher in ELA increased or remained unchanged at grades 4, 5, and 10, while in grades 3 and 6, students in each of these groups saw a 1 to 6-point decline.
Students with disabilities made notable gains in the ELA proficiency rate in grade 10 (7-point increase), grade 8 (6-point increase), and grade 7 (5-point increase). The proficiency rate for

7
ELL students improved by 11 points in grade 10 and four points in grade 4; and low-income students saw a 9-point gain in grade 10 and 3-point gains in grades 5 and 7.
Compared to five years ago, all three student groups also made notable gains in the percentage of students scoring Proficient or higher in ELA, with the exception of grade 4.

8
MCAS Mathematics Results Gains in Percent Passing, Proficient or Higher
2010 - 2011 Mathematics % Passing (Needs Improvement or higher)
2007 2008 2009 2010 2011
Percentage point Difference2011 - 2010 2007 2008 2009 2010 2011
Percentage point Difference2011 - 2010
Grade 3 67% 68% 68% 76% 77% 1 84% 86% 85% 89% 91% 2
Grade 4 73% 77% 75% 78% 79% 1 87% 87% 89% 89% 89% 0
Grade 5 67% 67% 67% 72% 74% 2 82% 82% 83% 83% 85% 2
Grade 6 60% 61% 64% 67% 66% -1 80% 82% 84% 84% 83% -1
Grade 7 56% 56% 60% 65% 63% -2 76% 76% 79% 80% 78% -1
Grade 8 58% 60% 56% 64% 62% -2 75% 76% 76% 79% 79% 0
Grade 10 82% 84% 86% 86% 86% 0 91% 91% 93% 92% 93% 1
Exceed or equal State gains
StateBPS
The percentage of students passing Mathematics improved districtwide between 2010 and 2011 in three of seven grade levels tested. The passing rate in 2011 ranged from 62% in grade 8 to 86% in grade 10. Grade 5 students experienced a 2-point gain, and grades 3 and 4 students saw a 1-point gain since 2010.
The improvement in passing rates exceeded or equaled the state-wide gains in grades 4 and 5.
Since 2007, the percentage of students scoring Needs Improvement or higher increased in eve-ry grade (ranging from 4 to 10 points); Grade 3 students have experienced the largest five-year gains (10 points).
Mathematics % Proficient & Advanced
2007 2008 2009 2010 2011
Percentage point Difference2011 - 2010 2007 2008 2009 2010 2011
Percentage point Difference2011 - 2010
Grade 3 36% 36% 33% 43% 41% -2 60% 61% 60% 65% 66% 1
Grade 4 27% 30% 27% 28% 29% 1 48% 49% 48% 48% 47% -1
Grade 5 33% 33% 33% 39% 42% 3 51% 52% 54% 55% 59% 4
Grade 6 29% 32% 33% 38% 36% -2 52% 56% 57% 59% 58% -1
Grade 7 26% 28% 28% 38% 33% -5 46% 47% 49% 53% 51% -2
Grade 8 27% 34% 28% 34% 34% 0 45% 49% 48% 51% 52% 1
Grade 10 55% 59% 62% 60% 62% 2 69% 72% 75% 75% 77% 2
Exceed or equal State gains
BPS State
Compared to 2010, students in grades 4, 5, and 10 saw improvements in their proficiency rates in Mathematics. The one-year gains were most significant in grade 5 (3-point increase). An ar-ea of particular concern is grade 7, which saw a 5-point decrease in its proficiency rate to 33%.
In grades 4 and 10, the 1-year gains in proficiency rates exceeded or equaled state gains.
Over a period of five years, the proficiency rates for all grades except grade 4 have increased by 5 points or more. Grade 5 students have seen 9-point gain since 2007.
9
Mathematics % Proficient & Advanced by Racial/Ethnic Group
2007 2008 2009 2010 2011
Percentage Points Difference 2011 - 2010
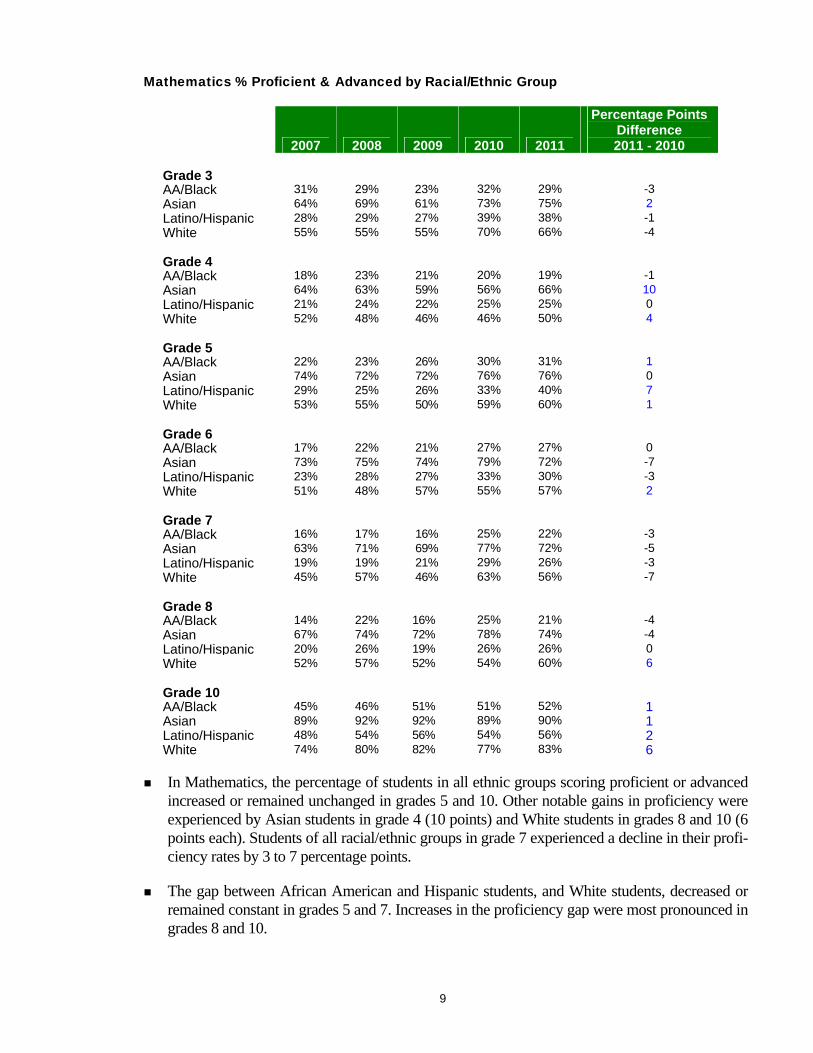
Grade 3 AA/Black 31% 29% 23% 32% 29% -3 Asian 64% 69% 61% 73% 75% 2 Latino/Hispanic 28% 29% 27% 39% 38% -1 White 55% 55% 55% 70% 66% -4 Grade 4 AA/Black 18% 23% 21% 20% 19% -1 Asian 64% 63% 59% 56% 66% 10 Latino/Hispanic 21% 24% 22% 25% 25% 0 White 52% 48% 46% 46% 50% 4 Grade 5 AA/Black 22% 23% 26% 30% 31% 1 Asian 74% 72% 72% 76% 76% 0 Latino/Hispanic 29% 25% 26% 33% 40% 7 White 53% 55% 50% 59% 60% 1 Grade 6 AA/Black 17% 22% 21% 27% 27% 0 Asian 73% 75% 74% 79% 72% -7 Latino/Hispanic 23% 28% 27% 33% 30% -3 White 51% 48% 57% 55% 57% 2 Grade 7 AA/Black 16% 17% 16% 25% 22% -3 Asian 63% 71% 69% 77% 72% -5 Latino/Hispanic 19% 19% 21% 29% 26% -3 White 45% 57% 46% 63% 56% -7 Grade 8 AA/Black 14% 22% 16% 25% 21% -4 Asian 67% 74% 72% 78% 74% -4 Latino/Hispanic 20% 26% 19% 26% 26% 0 White 52% 57% 52% 54% 60% 6 Grade 10 AA/Black 45% 46% 51% 51% 52% 1 Asian 89% 92% 92% 89% 90% 1 Latino/Hispanic 48% 54% 56% 54% 56% 2 White 74% 80% 82% 77% 83% 6
In Mathematics, the percentage of students in all ethnic groups scoring proficient or advanced increased or remained unchanged in grades 5 and 10. Other notable gains in proficiency were experienced by Asian students in grade 4 (10 points) and White students in grades 8 and 10 (6 points each). Students of all racial/ethnic groups in grade 7 experienced a decline in their profi-ciency rates by 3 to 7 percentage points.
The gap between African American and Hispanic students, and White students, decreased or remained constant in grades 5 and 7. Increases in the proficiency gap were most pronounced in grades 8 and 10.

10
Mathematics % Proficient & Advanced by other AYP Subgroups
2007 2008 2009 2010 2011
Percentage Points Difference 2011 - 2010
Grade 3 Students w/ Disab 16% 19% 13% 20% 17% -3
ELL/FELL 35% 33% 29% 44% 42% -2
Low Income 33% 32% 27% 38% 36% -2
Grade 4
Students w/ Disab 10% 11% 9% 8% 10% 2
ELL/FELL 29% 28% 26% 30% 32% 2
Low Income 23% 26% 23% 24% 25% 1
Grade 5
Students w/ Disab 10% 10% 9% 12% 16% 4
ELL/FELL 37% 30% 30% 36% 44% 8
Low Income 29% 30% 29% 34% 38% 4
Grade 6
Students w/ Disab 5% 8% 8% 12% 9% -3
ELL/FELL 21% 25% 31% 33% 28% -5
Low Income 25% 29% 29% 34% 31% -3
Grade 7
Students w/ Disab 4% 4% 5% 9% 8% -1
ELL/FELL 16% 13% 21% 31% 20% -11
Low Income 20% 22% 22% 31% 27% -4
Grade 8
Students w/ Disab 4% 6% 5% 6% 7% 1
ELL/FELL 12% 15% 16% 22% 21% -1
Low Income 23% 28% 22% 29% 29% 0
Grade 10
Students w/ Disab 16% 19% 25% 22% 21% -1 ELL/FELL 39% 47% 49% 43% 51% 8 Low Income 52% 57% 58% 56% 57% 1
Since 2010, the proficiency rate in math for students with disabilities, English language learn-
ers, and low-income students improved in both grades 4 and grade 5. ELLs and low-income students also saw gains in grade 10. However, all three subgroups experienced a drop in grades 3, 6, and 7.
In 2011, less than a quarter of students with disabilities scored Proficient or higher in any grade level tested in math. The proficiency rate for English language learners ranged from 20% in grade 7 to 51% in grade 10; and for low income students, it ranged from 25% in grade 4 to 57% in grade 10.
Since 2007, all three subgroups made notable gains in the percentage of students scoring Profi-cient or higher in Mathematic in almost all grades.

11
Long Term Trends in Racial Achievement Gap (Grade 10)
Since 1998, students of all races / ethnicities in grade 10 have seen a substantial improvement in their ELA passing and proficiency rates. African American and Hispanic students have seen the largest gains.
The gap in passing rates for African American and Hispanic students compared to White stu-dents has reduced significantly over the 13 years period, and the proficiency gap also narrowed considerably.
0
10
20
30
40
50
60
70
80
90
100
% o
f st
uden
ts S
corin
g N
eeds
Im
prov
emen
t or
Hig
her
Black 35 36 34 62 61 66 72 69 82 84 88 88 90 91
White 67 69 69 85 87 88 89 90 92 93 94 96 95 96
Asian 61 66 64 78 86 89 90 91 97 96 98 95 95 96
Hispanic 32 36 33 55 60 63 72 64 82 84 89 89 91 92
1998 1999 2000 2001 2002 2003 2004* 2005 2006 2007 2008 2009 2010 2011
MCAS Grade 10 ELA Results – Percent Needs Improvement or Higher by Race/Ethnicity
* Beginning with 2004, the race/ethnicity data are based on SIMS file
0
10
20
30
40
50
60
70
80
90
100
% o
f st
uden
ts S
corin
g P
rofic
ient
or
high
er
Black 10 10 13 25 27 28 30 27 42 40 48 56 53 59
White 46 45 47 68 68 69 68 67 76 74 79 85 78 86
Asian 32 32 38 48 62 61 62 69 76 76 80 81 80 84
Hispanic 8 10 12 21 24 24 28 27 40 43 50 59 54 64
1998 1999 2000 2001 2002 2003 2004* 2005 2006 2007 2008 2009 2010 2011
MCAS Grade 10 ELA Results – Percent Proficient and Advanced by Race/Ethnicity
* Beginning with 2004, the race/ethnicity data are based on SIMS file
12
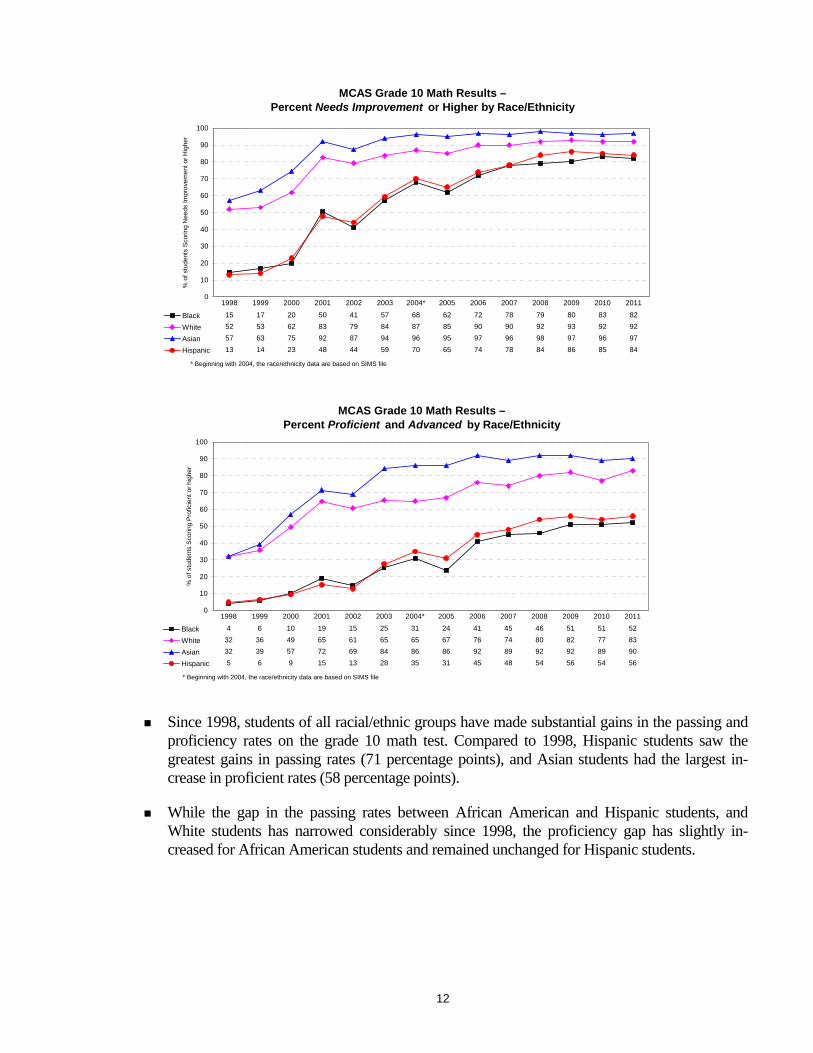
Since 1998, students of all racial/ethnic groups have made substantial gains in the passing and proficiency rates on the grade 10 math test. Compared to 1998, Hispanic students saw the greatest gains in passing rates (71 percentage points), and Asian students had the largest in-crease in proficient rates (58 percentage points).
While the gap in the passing rates between African American and Hispanic students, and White students has narrowed considerably since 1998, the proficiency gap has slightly in-creased for African American students and remained unchanged for Hispanic students.
0
10
20
30
40
50
60
70
80
90
100
% o
f st
uden
ts S
corin
g N
eeds
Im
prov
emen
t or
Hig
her
Black 15 17 20 50 41 57 68 62 72 78 79 80 83 82
White 52 53 62 83 79 84 87 85 90 90 92 93 92 92
Asian 57 63 75 92 87 94 96 95 97 96 98 97 96 97
Hispanic 13 14 23 48 44 59 70 65 74 78 84 86 85 84
1998 1999 2000 2001 2002 2003 2004* 2005 2006 2007 2008 2009 2010 2011
MCAS Grade 10 Math Results – Percent Needs Improvement or Higher by Race/Ethnicity
* Beginning with 2004, the race/ethnicity data are based on SIMS file
0
10
20
30
40
50
60
70
80
90
100
% o
f st
uden
ts S
corin
g P
rofic
ient
or
high
er
Black 4 6 10 19 15 25 31 24 41 45 46 51 51 52
White 32 36 49 65 61 65 65 67 76 74 80 82 77 83
Asian 32 39 57 72 69 84 86 86 92 89 92 92 89 90
Hispanic 5 6 9 15 13 28 35 31 45 48 54 56 54 56
1998 1999 2000 2001 2002 2003 2004* 2005 2006 2007 2008 2009 2010 2011
MCAS Grade 10 Math Results – Percent Proficient and Advanced by Race/Ethnicity
* Beginning with 2004, the race/ethnicity data are based on SIMS file
13
MCAS Science Results Gains in Percent Passing, Proficient or Higher
2010 - 2011 Science and Technology / Engineering % Passing (Needs Improvement or higher)
2007 2008 2009 2010 2011
Percentage Point Difference2011 - 2010 2007 2008 2009 2010 2011
Percentage Point Difference2011 - 2010
Grade 5 69% 63% 65% 68% 58% -10 88% 88% 88% 89% 86% -3
Grade 8 46% 48% 49% 53% 50% -3 77% 78% 79% 81% 81% 0
Grade 10* N/A 71% 79% 80% 82% 2 N/A 88% 90% 93% 94% 1
Exceed or equal State gains * Grade 10 STE results are reported based on students' best performance on any STE test taken in grade 9 or grade 10;
only students continuously enrolled in the same district from fall of grade 9 through spring of grade 10 are included.
BPS State
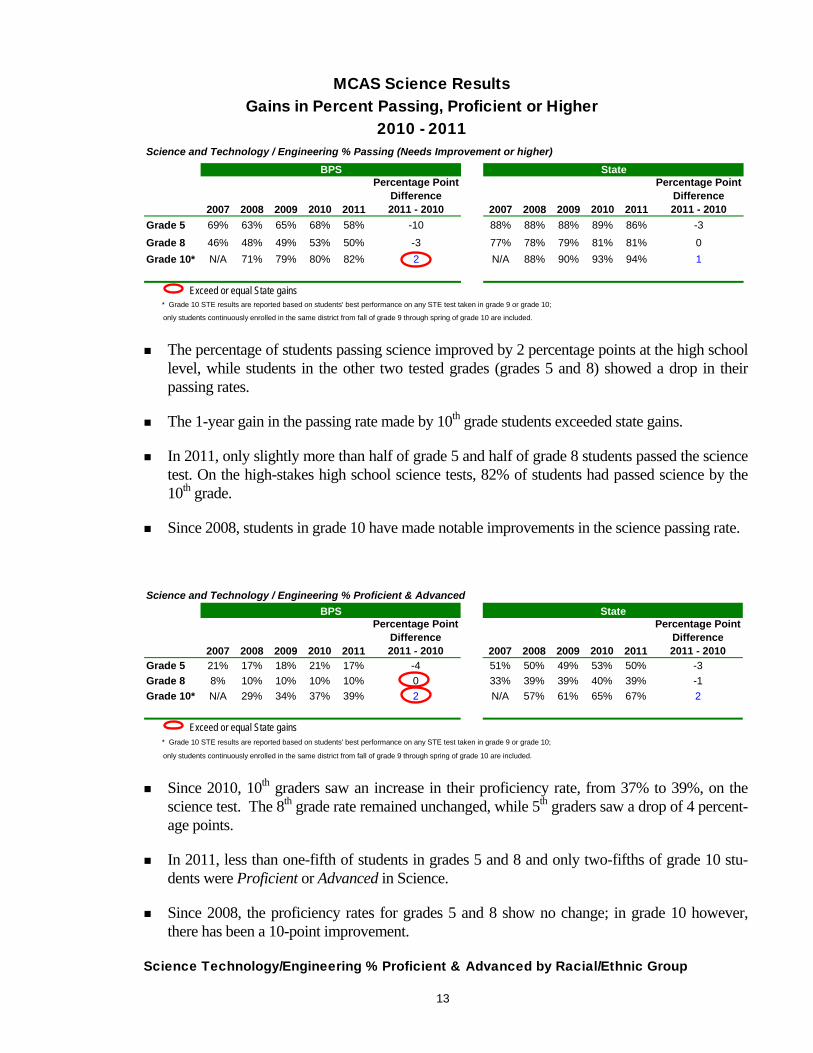
The percentage of students passing science improved by 2 percentage points at the high school level, while students in the other two tested grades (grades 5 and 8) showed a drop in their passing rates.
The 1-year gain in the passing rate made by 10th grade students exceeded state gains.
In 2011, only slightly more than half of grade 5 and half of grade 8 students passed the science test. On the high-stakes high school science tests, 82% of students had passed science by the 10th grade.
Since 2008, students in grade 10 have made notable improvements in the science passing rate.
Science and Technology / Engineering % Proficient & Advanced
2007 2008 2009 2010 2011
Percentage Point Difference2011 - 2010 2007 2008 2009 2010 2011
Percentage Point Difference2011 - 2010
Grade 5 21% 17% 18% 21% 17% -4 51% 50% 49% 53% 50% -3
Grade 8 8% 10% 10% 10% 10% 0 33% 39% 39% 40% 39% -1
Grade 10* N/A 29% 34% 37% 39% 2 N/A 57% 61% 65% 67% 2
Exceed or equal State gains * Grade 10 STE results are reported based on students' best performance on any STE test taken in grade 9 or grade 10;
only students continuously enrolled in the same district from fall of grade 9 through spring of grade 10 are included.
StateBPS
Since 2010, 10th graders saw an increase in their proficiency rate, from 37% to 39%, on the science test. The 8th grade rate remained unchanged, while 5th graders saw a drop of 4 percent-age points.
In 2011, less than one-fifth of students in grades 5 and 8 and only two-fifths of grade 10 stu-dents were Proficient or Advanced in Science.
Since 2008, the proficiency rates for grades 5 and 8 show no change; in grade 10 however, there has been a 10-point improvement.
Science Technology/Engineering % Proficient & Advanced by Racial/Ethnic Group

14
2007 2008 2009 2010 2011
Percentage Points Difference 2011 - 2010
Grade 5 AA/Black 13% 10% 10% 13% 10% -3
Asian 46% 42% 44% 50% 38% -12
Latino/Hispanic 16% 11% 13% 17% 13% -4
White 45% 39% 38% 41% 36% -5
Grade 8
AA/Black 4% 5% 6% 5% 5% 0
Asian 22% 28% 24% 30% 26% -4
Latino/Hispanic 4% 5% 6% 6% 6% 0
White 19% 24% 22% 22% 22% 0
Grade 10*
AA/Black N/A 17% 22% 26% 28% 2
Asian N/A 66% 67% 65% 70% 5
Latino/Hispanic N/A 17% 25% 28% 31% 3
White N/A 55% 63% 60% 69% 9
* Grade 10 STE results are reported based on students' best performance on any STE test taken in grade 9 or grade 10; only stu-dents continuously enrolled in the same district from fall of grade 9 through spring of grade 10 are included.
The percentage of students reaching proficiency increased for all racial/ethnic groups in grade 10 by two to nine percentage points, with the largest gain made by White students; Asian stu-dents also saw a notable increase (five points). However, students of all racial/ethnic groups in grade 5 experienced declines in their proficiency rates.
African American and Hispanic students have narrowed slightly the proficiency gap compared to their White peers in grade 5 science, but the gaps are significantly higher in high school sci-ence, and about the same in grade 8.

15
Science Technology/Engineering % Proficient & Advancedby other AYP Subgroups
2007 2008 2009 2010 2011
Percentage Points Difference 2011 - 2010
Grade 5 Students w/ Disab 6% 4% 6% 7% 5% -2
ELL/FELL 21% 14% 14% 16% 14% -2
Low Income 17% 13% 14% 17% 13% -4
Grade 8
Students w/ Disab 1% 1% 2% 1% 2% 1
ELL/FELL 3% 3% 4% 5% 4% -1
Low Income 5% 6% 7% 7% 6% -1
Grade 10*
Students w/ Disab N/A 5% 7% 8% 9% 1
ELL/FELL N/A 18% 12% 17% 20% 3
Low Income N/A 23% 27% 29% 32% 3
* Grade 10 STE results are reported based on students' best performance on any STE test taken in grade 9 or grade 10; only stu-dents continuously enrolled in the same district from fall of grade 9 through spring of grade 10 are included.
On the high school science tests, students with disabilities, ELL/FELLs, and Low Income stu-dents all saw some gains in proficiency rates. Students with disabilities in grade 8 also saw a 1-point gain.
There is little change in the proficiency rates for 5th and 8th graders in science since 2008. Only 10th graders who are members of these three student groups have seen progress.
16
Competency Determination Results
To earn a high school diploma, students in Massachusetts must meet the Commonwealth’s Compe-tency Determination (CD) standard in addition to all local graduation requirements. The CD require-ment was established as part of the Massachusetts Education Reform Act of 1993 to ensure that stu-dents graduating from school have the knowledge and skills they need to succeed in college and workplace.
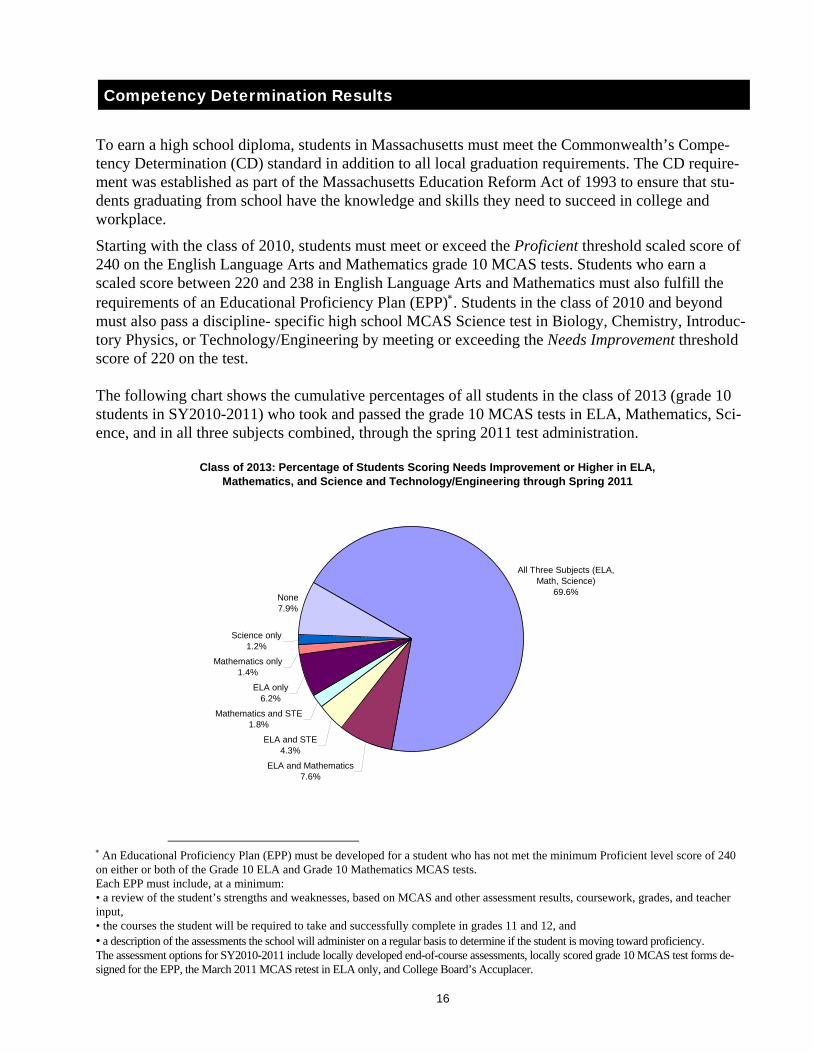
Starting with the class of 2010, students must meet or exceed the Proficient threshold scaled score of 240 on the English Language Arts and Mathematics grade 10 MCAS tests. Students who earn a scaled score between 220 and 238 in English Language Arts and Mathematics must also fulfill the requirements of an Educational Proficiency Plan (EPP). Students in the class of 2010 and beyond must also pass a discipline- specific high school MCAS Science test in Biology, Chemistry, Introduc-tory Physics, or Technology/Engineering by meeting or exceeding the Needs Improvement threshold score of 220 on the test. The following chart shows the cumulative percentages of all students in the class of 2013 (grade 10 students in SY2010-2011) who took and passed the grade 10 MCAS tests in ELA, Mathematics, Sci-ence, and in all three subjects combined, through the spring 2011 test administration.
An Educational Proficiency Plan (EPP) must be developed for a student who has not met the minimum Proficient level score of 240 on either or both of the Grade 10 ELA and Grade 10 Mathematics MCAS tests. Each EPP must include, at a minimum: • a review of the student’s strengths and weaknesses, based on MCAS and other assessment results, coursework, grades, and teacher input, • the courses the student will be required to take and successfully complete in grades 11 and 12, and • a description of the assessments the school will administer on a regular basis to determine if the student is moving toward proficiency. The assessment options for SY2010-2011 include locally developed end-of-course assessments, locally scored grade 10 MCAS test forms de-signed for the EPP, the March 2011 MCAS retest in ELA only, and College Board’s Accuplacer.
All Three Subjects (ELA, Math, Science)
69.6%
ELA and Mathematics7.6%
ELA and STE4.3%
Mathematics and STE1.8%
ELA only6.2%
Mathematics only1.4%
None7.9%
Science only1.2%
Class of 2013: Percentage of Students Scoring Needs Improvement or Higher in ELA, Mathematics, and Science and Technology/Engineering through Spring 2011
17
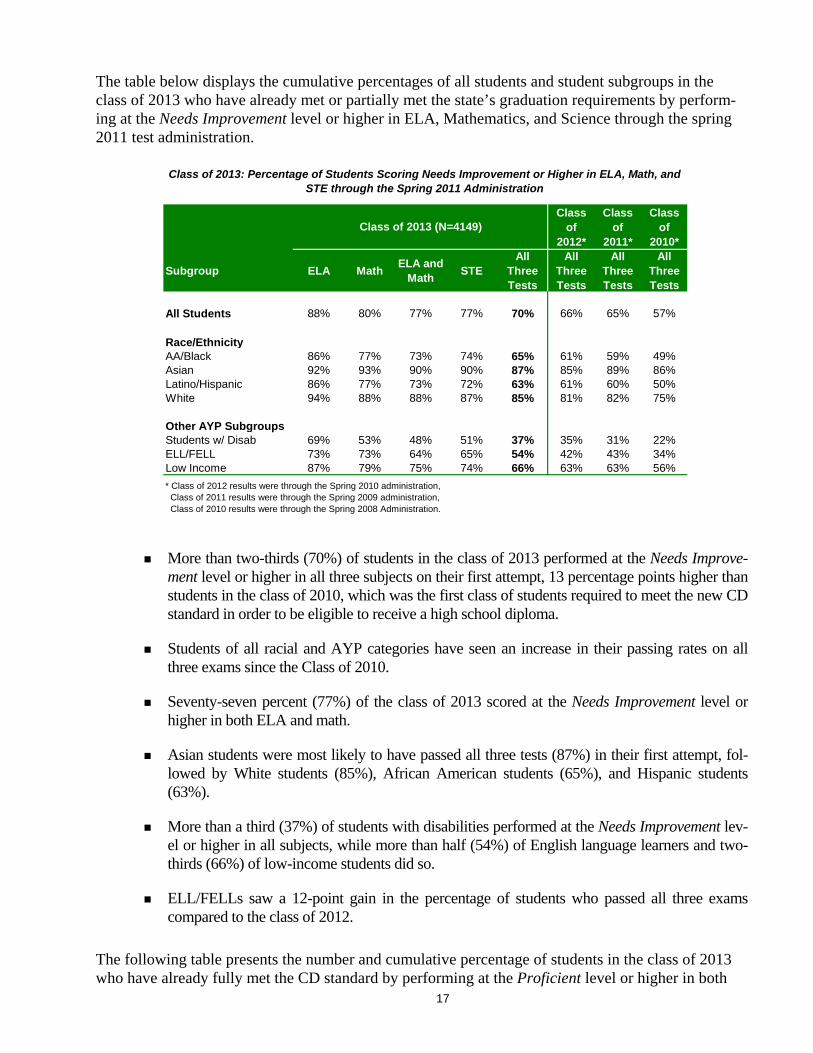
The table below displays the cumulative percentages of all students and student subgroups in the class of 2013 who have already met or partially met the state’s graduation requirements by perform-ing at the Needs Improvement level or higher in ELA, Mathematics, and Science through the spring 2011 test administration.
More than two-thirds (70%) of students in the class of 2013 performed at the Needs Improve-ment level or higher in all three subjects on their first attempt, 13 percentage points higher than students in the class of 2010, which was the first class of students required to meet the new CD standard in order to be eligible to receive a high school diploma.
Students of all racial and AYP categories have seen an increase in their passing rates on all three exams since the Class of 2010.
Seventy-seven percent (77%) of the class of 2013 scored at the Needs Improvement level or higher in both ELA and math.
Asian students were most likely to have passed all three tests (87%) in their first attempt, fol-lowed by White students (85%), African American students (65%), and Hispanic students (63%).
More than a third (37%) of students with disabilities performed at the Needs Improvement lev-el or higher in all subjects, while more than half (54%) of English language learners and two-thirds (66%) of low-income students did so.
ELL/FELLs saw a 12-point gain in the percentage of students who passed all three exams compared to the class of 2012.
The following table presents the number and cumulative percentage of students in the class of 2013 who have already fully met the CD standard by performing at the Proficient level or higher in both
Class of
2012*
Class of
2011*
Class of
2010*
Subgroup ELA MathELA and
MathSTE
All Three Tests
All Three Tests
All Three Tests
All Three Tests
All Students 88% 80% 77% 77% 70% 66% 65% 57%
Race/EthnicityAA/Black 86% 77% 73% 74% 65% 61% 59% 49%Asian 92% 93% 90% 90% 87% 85% 89% 86%Latino/Hispanic 86% 77% 73% 72% 63% 61% 60% 50%White 94% 88% 88% 87% 85% 81% 82% 75%
Other AYP SubgroupsStudents w/ Disab 69% 53% 48% 51% 37% 35% 31% 22%ELL/FELL 73% 73% 64% 65% 54% 42% 43% 34%Low Income 87% 79% 75% 74% 66% 63% 63% 56%
Class of 2013: Percentage of Students Scoring Needs Improvement or Higher in ELA, Math, and STE through the Spring 2011 Administration
Class of 2013 (N=4149)
* Class of 2012 results were through the Spring 2010 administration, Class of 2011 results were through the Spring 2009 administration, Class of 2010 results were through the Spring 2008 Administration.
18
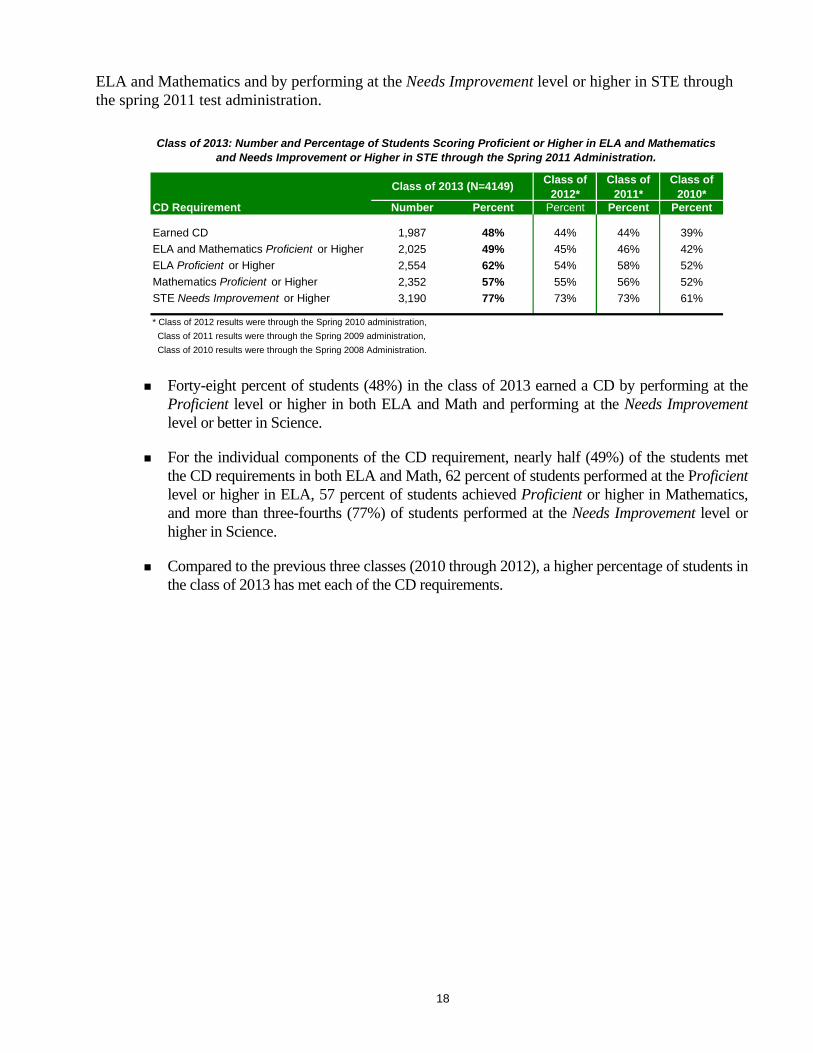
ELA and Mathematics and by performing at the Needs Improvement level or higher in STE through the spring 2011 test administration.
Forty-eight percent of students (48%) in the class of 2013 earned a CD by performing at the Proficient level or higher in both ELA and Math and performing at the Needs Improvement level or better in Science.
For the individual components of the CD requirement, nearly half (49%) of the students met the CD requirements in both ELA and Math, 62 percent of students performed at the Proficient level or higher in ELA, 57 percent of students achieved Proficient or higher in Mathematics, and more than three-fourths (77%) of students performed at the Needs Improvement level or higher in Science.
Compared to the previous three classes (2010 through 2012), a higher percentage of students in the class of 2013 has met each of the CD requirements.
Class of 2012*
Class of 2011*
Class of 2010*
CD Requirement Number Percent Percent Percent Percent
Earned CD 1,987 48% 44% 44% 39%
ELA and Mathematics Proficient or Higher 2,025 49% 45% 46% 42%
ELA Proficient or Higher 2,554 62% 54% 58% 52%
Mathematics Proficient or Higher 2,352 57% 55% 56% 52%
STE Needs Improvement or Higher 3,190 77% 73% 73% 61%
* Class of 2012 results were through the Spring 2010 administration,
Class of 2011 results were through the Spring 2009 administration,
Class of 2010 results were through the Spring 2008 Administration.
Class of 2013 (N=4149)
Class of 2013: Number and Percentage of Students Scoring Proficient or Higher in ELA and Mathematics and Needs Improvement or Higher in STE through the Spring 2011 Administration.
A - 1
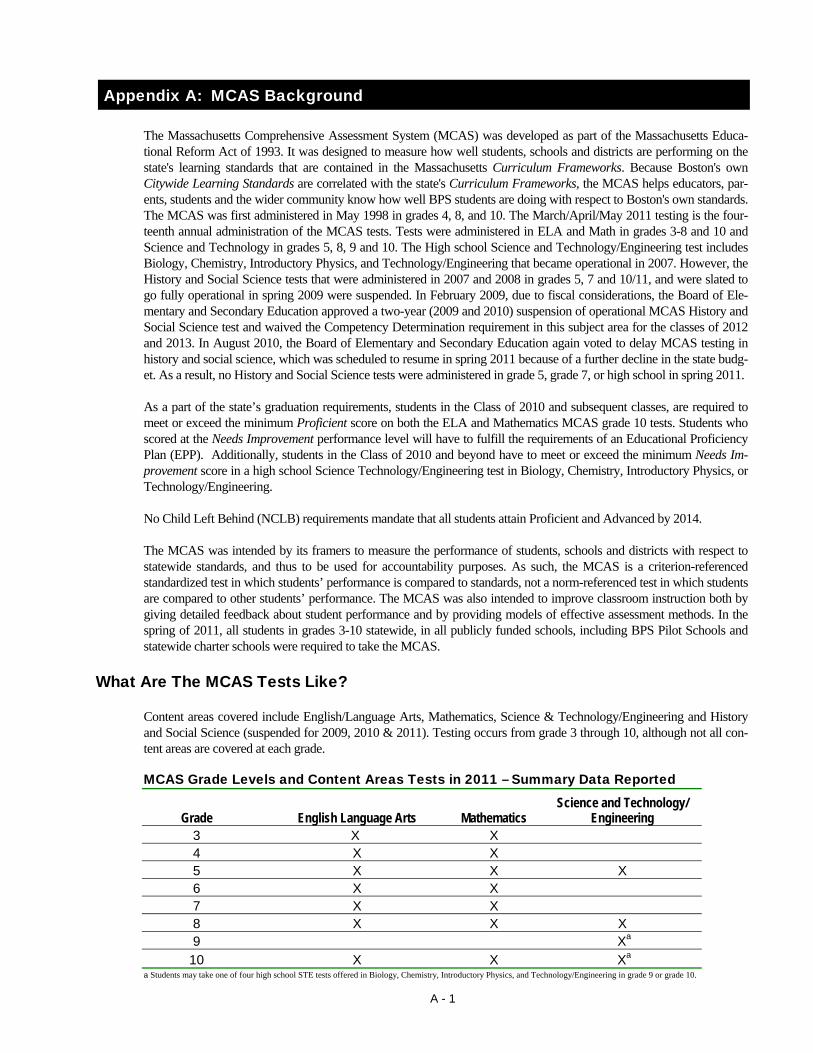
Appendix A: MCAS Background
The Massachusetts Comprehensive Assessment System (MCAS) was developed as part of the Massachusetts Educa-tional Reform Act of 1993. It was designed to measure how well students, schools and districts are performing on the state's learning standards that are contained in the Massachusetts Curriculum Frameworks. Because Boston's own Citywide Learning Standards are correlated with the state's Curriculum Frameworks, the MCAS helps educators, par-ents, students and the wider community know how well BPS students are doing with respect to Boston's own standards. The MCAS was first administered in May 1998 in grades 4, 8, and 10. The March/April/May 2011 testing is the four-teenth annual administration of the MCAS tests. Tests were administered in ELA and Math in grades 3-8 and 10 and Science and Technology in grades 5, 8, 9 and 10. The High school Science and Technology/Engineering test includes Biology, Chemistry, Introductory Physics, and Technology/Engineering that became operational in 2007. However, the History and Social Science tests that were administered in 2007 and 2008 in grades 5, 7 and 10/11, and were slated to go fully operational in spring 2009 were suspended. In February 2009, due to fiscal considerations, the Board of Ele-mentary and Secondary Education approved a two-year (2009 and 2010) suspension of operational MCAS History and Social Science test and waived the Competency Determination requirement in this subject area for the classes of 2012 and 2013. In August 2010, the Board of Elementary and Secondary Education again voted to delay MCAS testing in history and social science, which was scheduled to resume in spring 2011 because of a further decline in the state budg-et. As a result, no History and Social Science tests were administered in grade 5, grade 7, or high school in spring 2011.
As a part of the state’s graduation requirements, students in the Class of 2010 and subsequent classes, are required to meet or exceed the minimum Proficient score on both the ELA and Mathematics MCAS grade 10 tests. Students who scored at the Needs Improvement performance level will have to fulfill the requirements of an Educational Proficiency Plan (EPP). Additionally, students in the Class of 2010 and beyond have to meet or exceed the minimum Needs Im-provement score in a high school Science Technology/Engineering test in Biology, Chemistry, Introductory Physics, or Technology/Engineering.
No Child Left Behind (NCLB) requirements mandate that all students attain Proficient and Advanced by 2014.
The MCAS was intended by its framers to measure the performance of students, schools and districts with respect to statewide standards, and thus to be used for accountability purposes. As such, the MCAS is a criterion-referenced standardized test in which students’ performance is compared to standards, not a norm-referenced test in which students are compared to other students’ performance. The MCAS was also intended to improve classroom instruction both by giving detailed feedback about student performance and by providing models of effective assessment methods. In the spring of 2011, all students in grades 3-10 statewide, in all publicly funded schools, including BPS Pilot Schools and statewide charter schools were required to take the MCAS.
What Are The MCAS Tests Like?
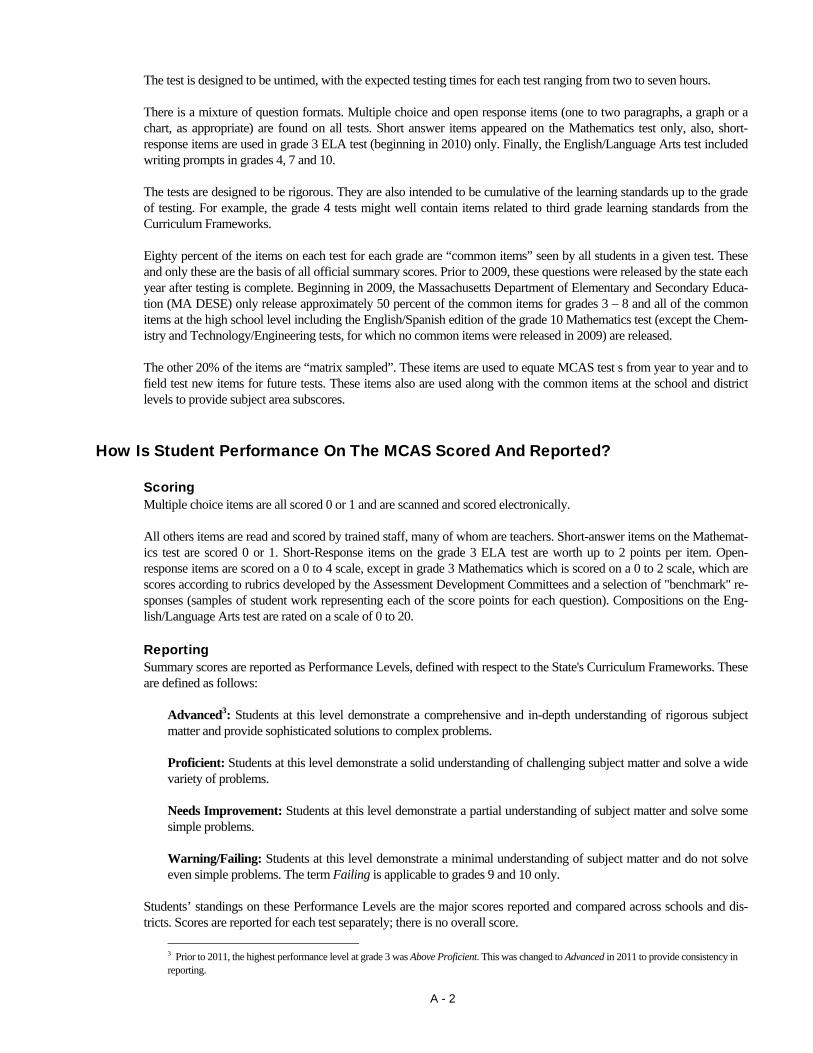
Content areas covered include English/Language Arts, Mathematics, Science & Technology/Engineering and History and Social Science (suspended for 2009, 2010 & 2011). Testing occurs from grade 3 through 10, although not all con-tent areas are covered at each grade.
MCAS Grade Levels and Content Areas Tests in 2011 – Summary Data Reported
Grade English Language Arts Mathematics Science and Technology/
Engineering 3 X X 4 X X 5 X X X 6 X X 7 X X 8 X X X 9 Xa
10 X X Xa a Students may take one of four high school STE tests offered in Biology, Chemistry, Introductory Physics, and Technology/Engineering in grade 9 or grade 10.
A - 2
The test is designed to be untimed, with the expected testing times for each test ranging from two to seven hours.
There is a mixture of question formats. Multiple choice and open response items (one to two paragraphs, a graph or a chart, as appropriate) are found on all tests. Short answer items appeared on the Mathematics test only, also, short-response items are used in grade 3 ELA test (beginning in 2010) only. Finally, the English/Language Arts test included writing prompts in grades 4, 7 and 10.
The tests are designed to be rigorous. They are also intended to be cumulative of the learning standards up to the grade of testing. For example, the grade 4 tests might well contain items related to third grade learning standards from the Curriculum Frameworks.
Eighty percent of the items on each test for each grade are “common items” seen by all students in a given test. These and only these are the basis of all official summary scores. Prior to 2009, these questions were released by the state each year after testing is complete. Beginning in 2009, the Massachusetts Department of Elementary and Secondary Educa-tion (MA DESE) only release approximately 50 percent of the common items for grades 3 – 8 and all of the common items at the high school level including the English/Spanish edition of the grade 10 Mathematics test (except the Chem-istry and Technology/Engineering tests, for which no common items were released in 2009) are released.
The other 20% of the items are “matrix sampled”. These items are used to equate MCAS test s from year to year and to field test new items for future tests. These items also are used along with the common items at the school and district levels to provide subject area subscores.
How Is Student Performance On The MCAS Scored And Reported?
Scoring Multiple choice items are all scored 0 or 1 and are scanned and scored electronically.
All others items are read and scored by trained staff, many of whom are teachers. Short-answer items on the Mathemat-ics test are scored 0 or 1. Short-Response items on the grade 3 ELA test are worth up to 2 points per item. Open-response items are scored on a 0 to 4 scale, except in grade 3 Mathematics which is scored on a 0 to 2 scale, which are scores according to rubrics developed by the Assessment Development Committees and a selection of "benchmark" re-sponses (samples of student work representing each of the score points for each question). Compositions on the Eng-lish/Language Arts test are rated on a scale of 0 to 20.
Reporting Summary scores are reported as Performance Levels, defined with respect to the State's Curriculum Frameworks. These are defined as follows:
Advanced3: Students at this level demonstrate a comprehensive and in-depth understanding of rigorous subject matter and provide sophisticated solutions to complex problems.
Proficient: Students at this level demonstrate a solid understanding of challenging subject matter and solve a wide variety of problems.
Needs Improvement: Students at this level demonstrate a partial understanding of subject matter and solve some simple problems.
Warning/Failing: Students at this level demonstrate a minimal understanding of subject matter and do not solve even simple problems. The term Failing is applicable to grades 9 and 10 only.
Students’ standings on these Performance Levels are the major scores reported and compared across schools and dis-tricts. Scores are reported for each test separately; there is no overall score.
3 Prior to 2011, the highest performance level at grade 3 was Above Proficient. This was changed to Advanced in 2011 to provide consistency in reporting.
A - 3
Test performance is also reported as scaled scores ranging from 200 to 280 for all grades. At grade 3, 2010 was the first year in which student results are reported as scaled scores; prior to 2010, only raw score points representing the total number of points a student earned were reported. The scaled scores provide information concerning students’ relative standing within a Performance Level. The scaled score range corresponding to each performance level is as follows: Advanced - 260 to 280, Proficient - 240 to 258, Needs Improvement - 220 to 238, and Warning/Failing - 200 to 218.
Testing Population
In keeping with state and federal regulations, virtually all students statewide are tested.
Students with Disabilities Students with Disabilities were defined as those who either had an Individualized Education Plan (IEP) or received in-structional accommodations provided under Section 504 of the Rehabilitation Act of 1973.
Students with Disabilities were expected to take the test in accordance with the Massachusetts Education Reform Act and a 1997 amendment to the federal Individuals with Disabilities Education Act (IDEA). Testing accommodations were permitted if specified in the student's Individualized Education Plan (IEP) or 504 plans. The state’s detailed list of approved accommodations included modifications to the timing and scheduling of the test, the setting of the test, how the items were presented to the student, and how the student provided the answers. The actual test content could not be modified. Students with significant cognitive disabilities who are unable to take the standard MCAS tests even with ac-commodations are required to take the MCAS Alternate Assessment (MCAS-Alt). The MCAS-Alt enables these stu-dents to submit portfolios of their wok that demonstrate their performance on the curriculum framework learning stand-ards.
English Language Learners According to MA DESE definitions, a English language learner (ELL)4 student is “a student whose first language is a language other than English who is unable to perform ordinary classroom work in English.” All ELL students must par-ticipate in MCAS tests scheduled for their grades regardless of the program and services they are receiving or the amount of time they have been in the United States. The sole exception to this requirement applies to first-year ELL students (i.e., students who first enrolled in school in the United States after March 1, 2010). While schools have the op-tion of testing first-year ELL students in English Language Arts (ELA), as per Federal guidelines issued in February 2004, all first-year ELL students must be assessed in Mathematics and Science and Technology/Engineering (STE) as required by the NCLB Law.
For MCAS reporting purposes, the results of first-year ELL students in 2011 who took the English Language Arts tests was not factored into school or district performance results, nor the results of these students’ Mathematics and Science ant Technology/Engineer tests, in accordance with NCLB allowances.
The federal government requires that states/districts continue to monitor the progress of ELL students who has transi-tioned out of ELL status (i.e., Former ELL) during the current school year or within the past two school years, the per-formance of combined ELL and former ELL students are reported and this reporting category represents the official AYP subgroup reporting category.
A Spanish version of the grade 10 Mathematics test was developed for Spanish-speaking ELL students. Grade 10 Span-ish-speaking ELL students who could read and write at grade 10 level or above in Spanish took the available Spanish-language Mathematics.
4 English language learner (ELL) was previously referred to as limited English proficient (LEP).

A - 4

A P NI W A P NI W A P NI W A P NI W
All Students All Students
2011 4 32 44 20 11 50 30 9 2011 6 35 36 23 14 52 25 10
2010 5 32 45 18 14 49 30 8 2010 11 31 34 24 25 40 24 11
2009 4 27 46 24 12 45 33 10 2009 7 26 35 33 20 40 25 15
2008 6 23 45 26 15 41 33 11 2008 10 26 32 32 25 36 25 14
2007 5 27 46 22 14 45 32 9 2007 7 29 31 33 19 41 24 16
2006 6 24 48 22 18 40 34 8 2006 1 29 35 34 4 48 32 16
Stud. w/ Disab Stud. w/ Disab
2011 0 10 41 50 2 22 45 32 2011 2 15 36 47 3 28 36 33
2010 1 13 41 45 2 23 46 29 2010 3 17 33 47 6 24 35 34
2009 1 9 39 51 2 21 44 33 2009 1 12 27 60 5 23 31 42
2008 1 9 39 51 3 20 42 36 2008 4 15 27 55 7 22 30 41
2007 1 11 41 47 3 24 44 29 2007 1 15 29 56 5 23 30 42
2006 2 9 44 45 5 24 47 25 2006 1 14 30 55 1 22 36 41
ELL/FELL* ELL/FELL*
2011 3 29 48 20 3 30 46 22 2011 6 36 37 20 7 37 35 21
2010 4 29 50 17 4 30 47 19 2010 10 34 35 21 12 31 34 23
2009 2 20 45 33 3 26 46 25 2009 5 24 32 39 8 28 32 33
2008 4 17 42 37 4 22 44 30 2008 8 25 33 35 12 28 30 30
2007 3 23 46 28 4 25 46 25 2007 7 28 30 36 7 28 29 36
2006 5 20 49 26 5 22 49 24 2006 1 29 35 35 2 28 34 36
Low-Income Low-Income
2011 2 28 48 22 4 36 44 16 2011 4 32 39 25 6 40 35 19
2010 3 28 49 20 6 37 43 14 2010 8 29 36 26 11 34 34 20
2009 2 24 48 26 4 31 46 19 2009 4 23 37 36 7 31 34 28
2008 4 21 47 29 5 27 46 23 2008 8 24 33 35 11 30 32 27
2007 3 24 48 24 4 32 46 18 2007 5 28 33 35 7 31 31 31
2006 4 21 51 24 7 28 48 17 2006 1 27 36 36 1 30 38 31
AA/Black AA/Black
2011 2 26 47 25 3 34 45 18 2011 2 27 39 31 4 35 38 23
2010 4 28 48 20 6 36 43 15 2010 6 25 39 29 9 31 37 24
2009 2 23 50 25 4 31 45 20 2009 3 20 38 39 6 27 36 31
2008 4 20 48 28 6 27 45 23 2008 6 23 33 38 10 27 33 30
2007 3 24 49 23 5 31 47 18 2007 4 27 32 37 6 29 32 33
2006 3 24 50 22 7 29 49 15 2006 1 24 37 39 1 28 39 32
Asian Asian
2011 7 44 40 9 17 52 24 7 2011 16 59 20 5 26 53 15 5
2010 7 39 40 14 18 49 27 6 2010 27 45 20 7 40 38 17 6
2009 5 40 40 16 17 47 28 7 2009 19 42 27 12 34 38 19 9
% of Students at Each Perf Level
% of Students at Each Perf Level
GRADE 3 - READING GRADE 3 - MATHEMATICS
% of Students at Each Perf Level
BPS State BPS State
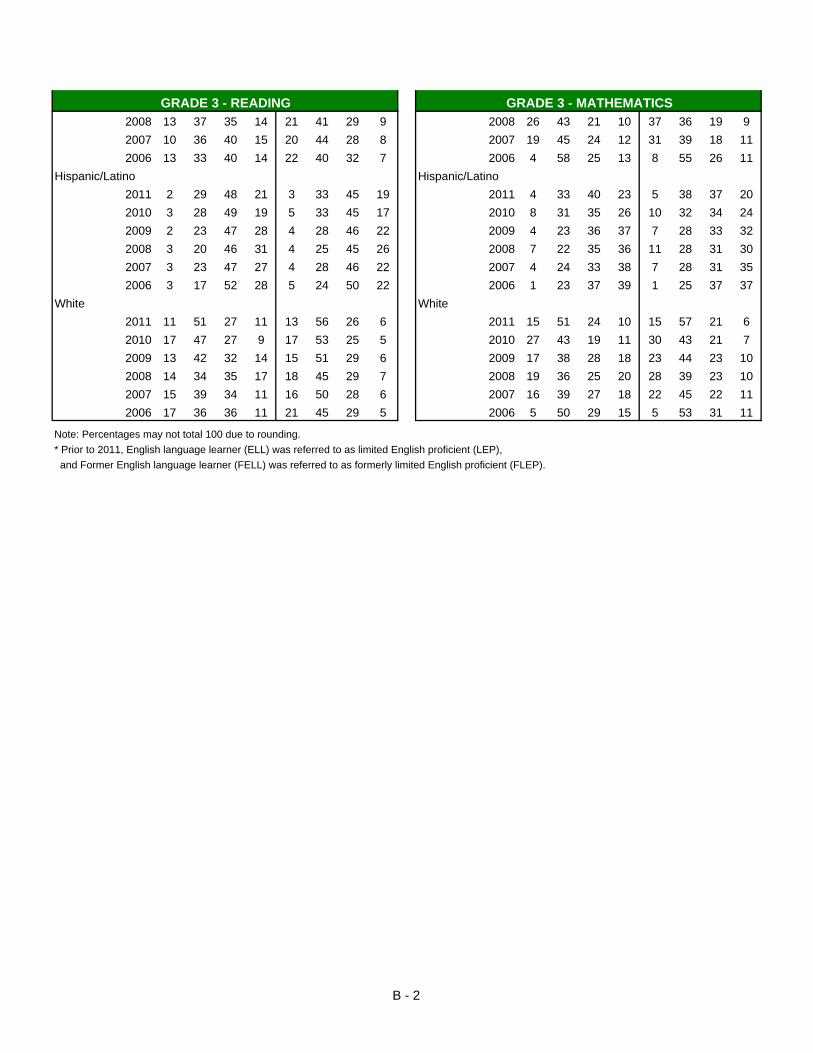
Appendix B: 2006-2011 MCAS Results by Subgroup
by Grade then Subject
% of Students at Each Perf Level
B - 1
GRADE 3 - READING GRADE 3 - MATHEMATICS2008 13 37 35 14 21 41 29 9 2008 26 43 21 10 37 36 19 9
2007 10 36 40 15 20 44 28 8 2007 19 45 24 12 31 39 18 11
2006 13 33 40 14 22 40 32 7 2006 4 58 25 13 8 55 26 11
Hispanic/Latino Hispanic/Latino
2011 2 29 48 21 3 33 45 19 2011 4 33 40 23 5 38 37 20
2010 3 28 49 19 5 33 45 17 2010 8 31 35 26 10 32 34 24
2009 2 23 47 28 4 28 46 22 2009 4 23 36 37 7 28 33 32
2008 3 20 46 31 4 25 45 26 2008 7 22 35 36 11 28 31 30
2007 3 23 47 27 4 28 46 22 2007 4 24 33 38 7 28 31 35
2006 3 17 52 28 5 24 50 22 2006 1 23 37 39 1 25 37 37
White White
2011 11 51 27 11 13 56 26 6 2011 15 51 24 10 15 57 21 6
2010 17 47 27 9 17 53 25 5 2010 27 43 19 11 30 43 21 7
2009 13 42 32 14 15 51 29 6 2009 17 38 28 18 23 44 23 10
2008 14 34 35 17 18 45 29 7 2008 19 36 25 20 28 39 23 10
2007 15 39 34 11 16 50 28 6 2007 16 39 27 18 22 45 22 11
2006 17 36 36 11 21 45 29 5 2006 5 50 29 15 5 53 31 11
Note: Percentages may not total 100 due to rounding.
* Prior to 2011, English language learner (ELL) was referred to as limited English proficient (LEP),
and Former English language learner (FELL) was referred to as formerly limited English proficient (FLEP).
B - 2
A P NI W A P NI W A P NI W A P NI W
All Students All Students
2011 4 25 44 26 10 43 35 12 2011 7 22 49 21 15 32 42 11
2010 4 26 45 25 11 43 35 12 2010 7 21 50 22 16 32 41 11
2009 4 26 44 25 11 42 35 11 2009 6 21 48 24 16 32 41 11
2008 2 23 48 27 8 41 39 13 2008 9 21 47 23 20 29 38 13
2007 4 27 44 26 10 46 34 10 2007 8 19 46 27 19 29 39 13
2006 3 23 46 28 8 42 39 12 2006 8 18 47 27 15 25 45 15
Stud. w/ Disab Stud. w/ Disab
2011 0 7 31 61 1 14 44 41 2011 2 8 41 48 3 13 48 36
2010 0 6 36 58 1 15 44 40 2010 1 7 43 49 3 13 48 36
2009 0 7 34 60 1 15 44 39 2009 1 8 39 53 3 13 47 37
2008 0 6 34 60 1 13 44 42 2008 2 9 41 48 4 14 44 39
2007 0 7 37 56 1 18 47 34 2007 2 8 37 53 4 13 46 37
2006 - 6 35 59 1 15 48 36 2006 1 8 38 52 3 12 46 39
ELL/FELL* ELL/FELL*
2011 3 24 47 26 3 25 45 28 2011 7 24 50 19 7 21 48 24
2010 2 25 49 24 3 23 46 28 2010 6 24 51 19 7 21 48 24
2009 2 23 43 32 3 22 45 30 2009 6 20 48 26 6 20 47 27
2008 1 17 49 34 1 17 48 33 2008 8 20 48 24 9 19 44 29
2007 3 25 43 28 3 24 46 28 2007 9 20 45 26 8 18 45 29
2006 4 22 43 31 2 20 46 31 2006 10 19 44 28 7 15 46 32
Low-Income Low-Income
2011 3 22 47 28 3 29 46 22 2011 5 20 52 23 6 22 52 20
2010 2 23 48 27 3 28 47 23 2010 4 20 52 24 6 22 51 21
2009 3 22 47 28 3 26 48 23 2009 4 19 50 26 6 22 51 22
2008 1 20 50 29 2 24 49 25 2008 7 19 49 25 8 21 47 24
2007 2 24 46 28 3 29 48 21 2007 6 17 48 29 7 20 48 25
2006 2 21 47 30 2 25 49 24 2006 6 17 48 29 6 15 51 28
AA/Black AA/Black
2011 2 20 47 31 3 27 46 24 2011 3 16 53 28 5 18 53 25
2010 2 21 48 29 3 26 47 23 2010 3 16 53 27 5 20 52 24
2009 3 22 46 29 3 26 47 24 2009 3 18 49 30 5 20 51 25
2008 1 18 51 29 2 23 50 25 2008 5 18 50 28 7 19 48 26
2007 2 24 47 28 3 29 48 21 2007 4 14 48 33 6 17 50 27
2006 2 18 49 31 2 25 49 24 2006 3 15 50 33 4 14 52 30
Asian Asian
2011 11 40 33 16 18 47 27 8 2011 26 40 28 6 32 36 27 6
2010 9 39 41 12 19 45 29 8 2010 19 37 37 7 32 33 29 6
2009 8 43 36 14 19 43 29 9 2009 21 38 31 9 29 36 29 6
2008 5 39 41 15 13 43 34 10 2008 28 35 32 6 38 28 26 7
2007 11 41 34 13 17 46 29 8 2007 28 36 31 6 32 31 30 7
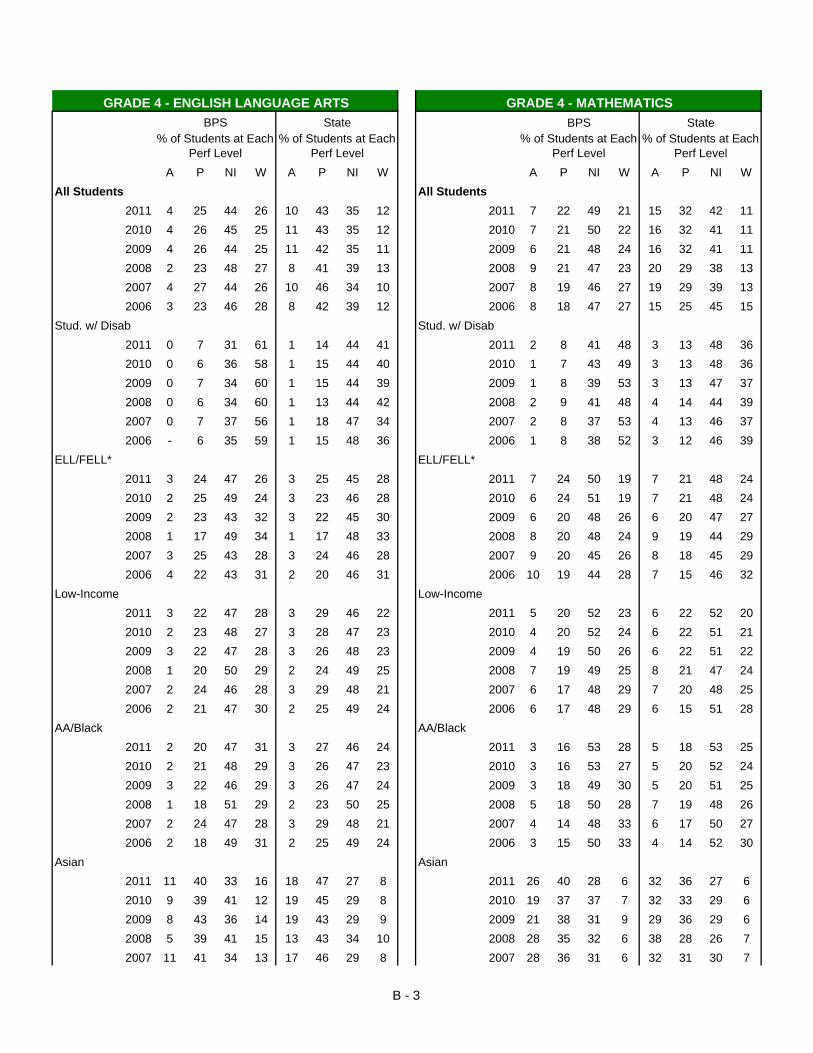
StateBPS
GRADE 4 - ENGLISH LANGUAGE ARTS GRADE 4 - MATHEMATICS
% of Students at Each Perf Level
% of Students at Each Perf Level
% of Students at Each Perf Level
% of Students at Each Perf Level
BPS State
B - 3

GRADE 4 - ENGLISH LANGUAGE ARTS GRADE 4 - MATHEMATICS
2006 15 35 38 12 14 43 33 9 2006 30 28 34 7 28 29 34 9
Hispanic/Latino Hispanic/Latino
2011 3 23 47 28 3 26 45 26 2011 5 21 52 22 5 20 51 23
2010 2 22 49 27 3 25 46 26 2010 5 20 52 23 6 21 50 11
2009 2 24 46 28 3 25 46 26 2009 5 17 54 24 5 20 50 25
2008 1 19 48 31 2 21 48 29 2008 6 18 50 26 8 20 45 27
2007 2 21 46 31 2 26 47 25 2007 5 16 49 30 6 18 48 28
2006 2 19 46 33 2 22 48 29 2006 6 15 48 31 5 13 49 33
White White
2011 13 39 34 15 11 48 32 8 2011 17 33 39 11 17 36 39 7
2010 11 43 32 13 13 48 31 8 2010 15 31 43 12 18 36 39 7
2009 10 39 37 14 14 47 32 7 2009 14 32 41 14 18 36 39 7
2008 7 39 39 15 10 46 36 9 2008 18 30 39 14 23 33 36 9
2007 11 45 31 13 12 51 30 6 2007 17 35 38 11 21 33 37 9
2006 6 42 38 14 9 47 37 7 2006 19 30 39 12 17 28 44 10
Note: Percentages may not total 100 due to rounding.
* Prior to 2011, English language learner (ELL) was referred to as limited English proficient (LEP),
and Former English language learner (FELL) was referred to as formerly limited English proficient (FLEP).
B - 4
A P NI W A P NI W A P NI W A P NI W
All Students All Students
2011 6 37 38 19 17 50 24 9 2011 11 30 32 26 25 34 26 15
2010 7 33 39 21 16 47 28 10 2010 14 25 34 28 25 30 28 17
2009 7 31 45 18 15 48 29 8 2009 10 23 34 33 22 32 29 18
2008 6 31 43 20 13 48 30 8 2008 11 22 34 34 22 30 30 17
2007 7 33 40 21 15 48 28 9 2007 11 22 34 33 19 32 31 18
2006 7 28 43 22 15 44 31 9 2006 8 17 35 40 17 26 34 23
Stud. w/ Disab Stud. w/ Disab
2011 1 13 41 46 2 25 41 32 2011 2 15 28 55 5 17 32 46
2010 1 10 35 55 2 21 43 35 2010 2 10 29 59 4 14 32 50
2009 1 10 43 46 2 22 47 29 2009 1 8 27 63 4 14 32 50
2008 0 8 43 49 2 21 47 30 2008 2 8 25 65 4 14 33 49
2007 1 10 37 52 2 23 43 31 2007 2 8 26 64 3 14 33 50
2006 0 7 40 53 2 22 47 28 2006 1 4 25 70 3 11 31 55
ELL/FELL* ELL/FELL*
2011 5 34 42 20 4 31 40 25 2011 10 33 32 25 10 26 31 33
2010 4 30 44 22 4 27 42 28 2010 12 24 38 26 10 20 33 37
2009 4 25 49 22 4 25 47 24 2009 10 20 36 35 9 20 32 39
2008 4 25 45 27 3 23 47 26 2008 10 20 36 34 9 19 34 38
2007 5 32 40 23 4 26 42 28 2007 12 25 32 30 8 21 33 38
2006 6 26 42 27 3 22 46 29 2006 9 19 36 36 7 15 32 46
Low-Income Low-Income
2011 4 34 41 20 5 40 38 17 2011 8 30 33 28 9 28 34 28
2010 5 30 42 23 5 35 40 19 2010 10 24 36 30 10 23 37 30
2009 5 28 48 19 5 35 45 16 2009 8 21 35 35 8 21 35 35
2008 4 28 46 22 4 33 46 18 2008 9 21 35 35 8 22 37 32
2007 4 32 42 22 4 34 43 18 2007 8 21 35 35 7 22 38 33
2006 5 26 45 23 4 30 47 18 2006 6 16 36 42 6 16 37 42
AA/Black AA/Black
2011 4 33 44 20 6 40 38 16 2011 5 26 35 34 8 27 35 30
2010 4 30 43 23 6 34 40 19 2010 7 23 36 34 9 22 36 33
2009 4 28 48 20 5 34 45 16 2009 6 20 36 39 8 23 36 33
2008 3 28 48 22 4 33 46 17 2008 5 18 36 41 8 20 39 33
2007 3 29 44 24 4 35 43 18 2007 5 17 36 42 5 20 38 36
2006 4 23 48 25 5 30 47 18 2006 3 12 35 49 4 14 37 44
Asian Asian
2011 14 50 23 13 27 48 18 7 2011 36 40 17 7 47 30 15 8
2010 19 45 28 8 26 45 21 7 2010 45 31 16 8 46 28 18 9
2009 19 41 31 9 26 44 24 6 2009 38 34 19 9 44 29 18 9
2008 17 42 30 11 22 46 25 7 2008 40 32 20 8 42 29 20 9
2007 14 46 32 8 23 45 25 7 2007 37 37 17 9 36 34 21 9
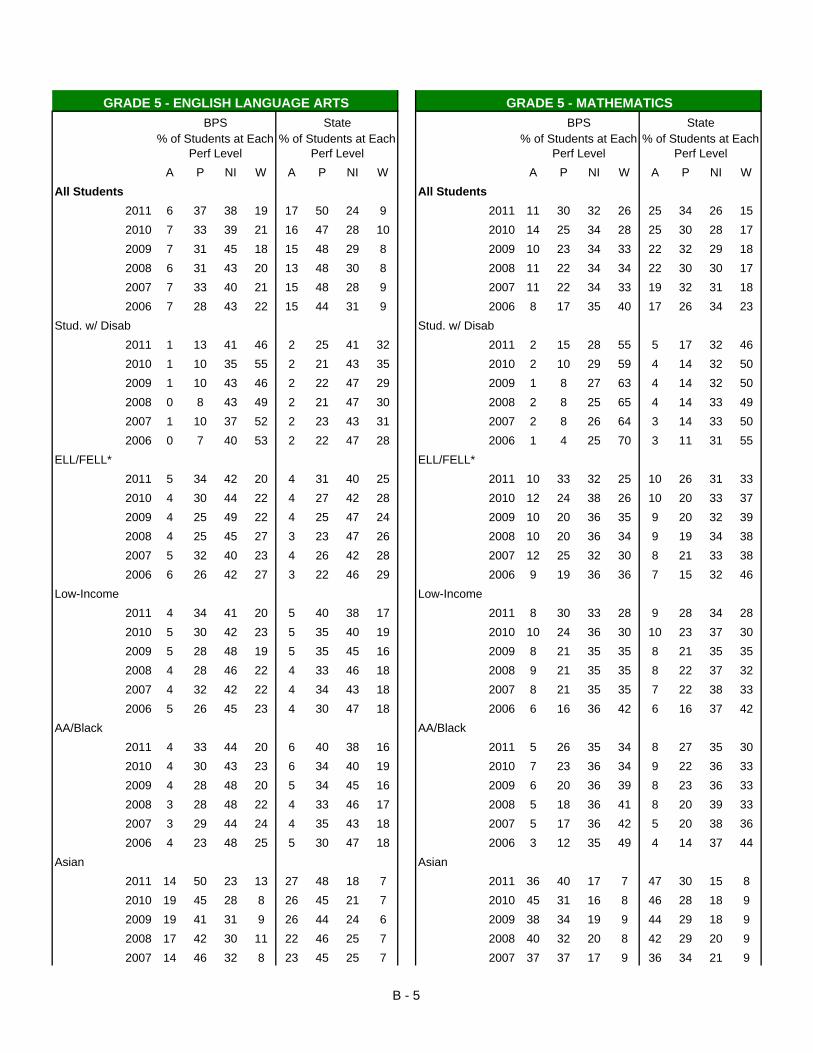
BPS State% of Students at Each
Perf Level% of Students at Each
Perf Level% of Students at Each
Perf Level% of Students at Each
Perf Level
BPS State
GRADE 5 - ENGLISH LANGUAGE ARTS GRADE 5 - MATHEMATICS
B - 5

GRADE 5 - ENGLISH LANGUAGE ARTS GRADE 5 - MATHEMATICS
2006 18 41 30 10 22 43 27 8 2006 33 30 28 8 32 28 27 13
Hispanic/Latino Hispanic/Latino
2011 4 34 41 21 5 36 38 21 2011 8 32 34 27 8 27 33 32
2010 5 31 40 24 5 32 41 22 2010 10 23 38 29 9 21 35 35
2009 4 27 49 20 4 31 47 18 2009 6 20 38 37 7 21 35 37
2008 4 26 48 23 3 29 47 21 2008 6 19 37 37 7 20 37 37
2007 5 30 42 23 4 30 43 23 2007 7 22 37 35 6 20 36 39
2006 4 24 46 26 3 25 48 24 2006 5 16 37 42 4 14 34 48
White White
2011 14 50 25 11 20 54 20 5 2011 26 33 23 17 28 38 23 11
2010 15 44 29 12 19 51 24 6 2010 27 32 23 17 29 33 27 12
2009 17 42 32 9 18 53 25 5 2009 17 33 28 21 25 35 27 13
2008 16 45 27 12 16 53 26 5 2008 24 31 28 17 26 33 29 13
2007 17 44 26 13 17 53 24 5 2007 22 31 29 18 21 36 30 13
2006 18 44 27 11 18 50 27 5 2006 18 29 34 19 19 29 34 17
Note: Percentages may not total 100 due to rounding.
* Prior to 2011, English language learner (ELL) was referred to as limited English proficient (LEP),
and Former English language learner (FELL) was referred to as formerly limited English proficient (FLEP).
B - 6
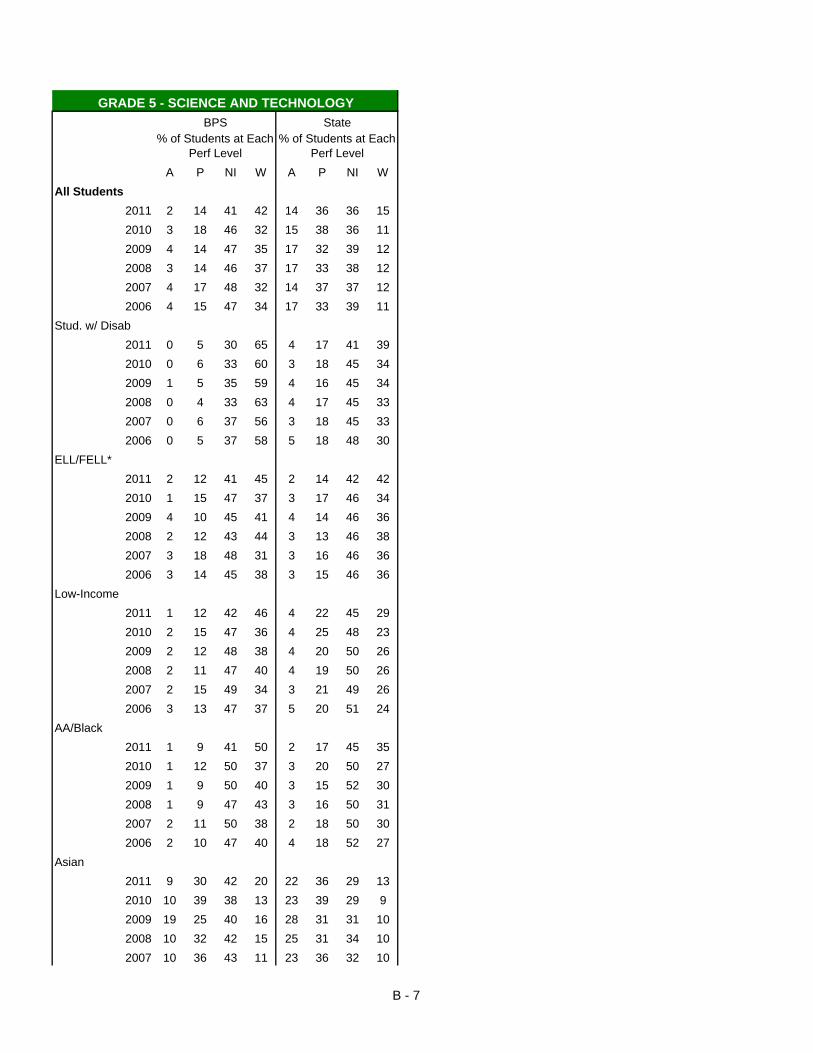
A P NI W A P NI W
All Students
2011 2 14 41 42 14 36 36 15
2010 3 18 46 32 15 38 36 11
2009 4 14 47 35 17 32 39 12
2008 3 14 46 37 17 33 38 12
2007 4 17 48 32 14 37 37 12
2006 4 15 47 34 17 33 39 11
Stud. w/ Disab
2011 0 5 30 65 4 17 41 39
2010 0 6 33 60 3 18 45 34
2009 1 5 35 59 4 16 45 34
2008 0 4 33 63 4 17 45 33
2007 0 6 37 56 3 18 45 33
2006 0 5 37 58 5 18 48 30
ELL/FELL*
2011 2 12 41 45 2 14 42 42
2010 1 15 47 37 3 17 46 34
2009 4 10 45 41 4 14 46 36
2008 2 12 43 44 3 13 46 38
2007 3 18 48 31 3 16 46 36
2006 3 14 45 38 3 15 46 36
Low-Income
2011 1 12 42 46 4 22 45 29
2010 2 15 47 36 4 25 48 23
2009 2 12 48 38 4 20 50 26
2008 2 11 47 40 4 19 50 26
2007 2 15 49 34 3 21 49 26
2006 3 13 47 37 5 20 51 24
AA/Black
2011 1 9 41 50 2 17 45 35
2010 1 12 50 37 3 20 50 27
2009 1 9 50 40 3 15 52 30
2008 1 9 47 43 3 16 50 31
2007 2 11 50 38 2 18 50 30
2006 2 10 47 40 4 18 52 27
Asian
2011 9 30 42 20 22 36 29 13
2010 10 39 38 13 23 39 29 9
2009 19 25 40 16 28 31 31 10
2008 10 32 42 15 25 31 34 10
2007 10 36 43 11 23 36 32 10
GRADE 5 - SCIENCE AND TECHNOLOGY
% of Students at Each Perf Level
% of Students at Each Perf Level
BPS State
B - 7

GRADE 5 - SCIENCE AND TECHNOLOGY
2006 11 30 41 17 23 33 36 9
Hispanic/Latino
2011 1 11 42 45 3 18 44 34
2010 1 16 46 37 3 21 48 28
2009 1 12 47 39 4 17 50 29
2008 2 9 46 43 4 15 50 31
2007 2 14 50 34 3 17 49 31
2006 3 11 47 39 3 16 50 31
White
2011 6 30 39 25 17 42 33 8
2010 11 30 39 19 18 44 32 6
2009 9 29 42 19 20 37 36 7
2008 11 28 44 17 20 38 35 7
2007 10 35 39 17 17 42 34 7
2006 11 28 47 14 20 38 36 6
Note: Percentages may not total 100 due to rounding.
* Prior to 2011, English language learner (ELL) was referred to as limited English proficient (LEP),
and Former English language learner (FELL) was referred to as formerly limited English proficient (FLEP).
B - 8

A P NI W A P NI W A P NI W A P NI W
All Students All Students
2011 5 36 36 22 17 51 23 9 2011 13 23 30 34 26 32 25 16
2010 6 38 34 21 15 54 21 9 2010 13 25 30 33 27 32 25 16
2009 7 36 37 20 16 50 24 9 2009 11 22 31 37 24 33 27 16
2008 6 37 37 19 15 52 24 8 2008 10 22 29 39 23 33 26 18
2007 4 35 42 20 9 58 25 7 2007 9 20 31 41 20 32 28 20
2006 4 32 42 22 10 54 28 8 2006 6 14 30 50 17 29 29 25
Stud. w/ Disab Stud. w/ Disab
2011 1 12 36 51 2 26 40 32 2011 1 8 22 69 4 15 31 50
2010 0 14 35 51 1 27 38 33 2010 2 11 26 62 4 15 31 49
2009 0 12 42 46 2 24 41 33 2009 1 7 24 68 4 15 32 49
2008 0 12 42 46 2 26 42 31 2008 1 7 21 70 4 14 29 53
2007 0 9 44 46 1 26 45 28 2007 0 5 22 72 3 13 30 54
2006 0 7 40 53 1 25 46 28 2006 0 2 18 80 2 11 27 60
ELL/FELL* ELL/FELL*
2011 1 29 42 28 3 28 39 29 2011 6 21 34 39 8 20 31 40
2010 3 34 38 25 3 33 37 27 2010 10 24 32 34 10 22 30 38
2009 4 30 41 25 5 28 38 29 2009 8 23 29 40 9 21 30 40
2008 2 28 40 30 3 28 41 28 2008 7 18 29 46 8 20 28 44
2007 1 23 43 34 1 26 44 29 2007 5 16 29 50 6 17 28 48
2006 1 17 37 45 1 23 44 31 2006 3 10 27 60 5 13 27 56
Low-Income Low-Income
2011 3 34 39 24 5 42 36 17 2011 9 22 33 36 11 26 33 30
2010 4 36 37 23 5 43 34 18 2010 10 24 31 35 11 26 32 30
2009 5 33 41 21 6 38 38 18 2009 8 21 32 39 9 25 35 31
2008 4 35 40 21 4 40 38 17 2008 8 21 30 41 9 24 32 35
2007 3 32 45 20 2 40 42 16 2007 7 18 32 43 7 22 33 38
2006 2 30 44 23 2 36 45 17 2006 4 13 31 51 5 17 32 46
AA/Black AA/Black
2011 3 31 42 25 5 40 38 17 2011 7 20 30 43 10 24 32 34
2010 3 35 38 25 5 43 34 18 2010 6 21 33 41 9 25 33 33
2009 4 33 41 22 6 39 38 16 2009 5 16 34 45 8 24 36 32
2008 2 35 42 22 5 42 37 16 2008 4 18 32 47 7 23 33 37
2007 2 28 48 22 3 40 43 15 2007 3 14 32 51 6 21 33 41
2006 2 27 47 25 3 37 44 16 2006 2 9 29 59 5 16 32 48
Asian Asian
2011 14 53 21 12 28 49 17 6 2011 40 32 17 11 49 27 16 8
2010 20 45 24 10 30 49 14 6 2010 46 33 14 8 51 28 14 7
2009 17 49 26 8 29 47 18 6 2009 39 35 18 8 45 31 15 8
2008 20 51 22 7 29 49 17 5 2008 43 32 16 9 45 31 15 9
2007 12 51 27 10 17 55 22 6 2007 40 33 19 8 40 31 19 10
BPS State BPS State% of Students at Each
Perf Level% of Students at Each
Perf Level
GRADE 6 - ENGLISH LANGUAGE ARTS GRADE 6 - MATHEMATICS
% of Students at Each Perf Level
% of Students at Each Perf Level
B - 9

GRADE 6 - ENGLISH LANGUAGE ARTS GRADE 6 - MATHEMATICS
2006 10 53 29 8 18 52 24 6 2006 28 32 26 14 32 30 22 15
Hispanic/Latino Hispanic/Latino
2011 3 35 38 24 5 37 37 21 2011 9 22 35 35 9 24 33 34
2010 3 37 36 24 5 40 35 20 2010 8 25 32 35 10 24 32 34
2009 5 31 41 23 5 35 38 22 2009 6 21 33 41 7 22 34 36
2008 4 34 40 22 4 36 39 21 2008 6 22 30 43 8 22 31 40
2007 2 33 43 22 2 36 42 20 2007 4 19 34 43 6 19 32 44
2006 2 28 44 26 2 31 45 22 2006 2 13 33 52 4 14 30 53
White White
2011 15 45 28 12 21 56 18 5 2011 28 29 24 20 30 36 23 11
2010 13 49 27 11 18 59 18 6 2010 24 30 26 20 31 35 23 11
2009 16 49 23 11 19 55 21 6 2009 25 32 22 21 27 36 25 11
2008 15 45 26 14 17 57 20 5 2008 22 26 27 25 27 36 24 13
2007 11 51 29 8 11 64 21 4 2007 19 32 27 21 24 36 27 13
2006 12 47 28 13 12 60 23 5 2006 14 23 30 33 19 33 30 18
Note: Percentages may not total 100 due to rounding.
* Prior to 2011, English language learner (ELL) was referred to as limited English proficient (LEP),
and Former English language learner (FELL) was referred to as formerly limited English proficient (FLEP).
B - 10
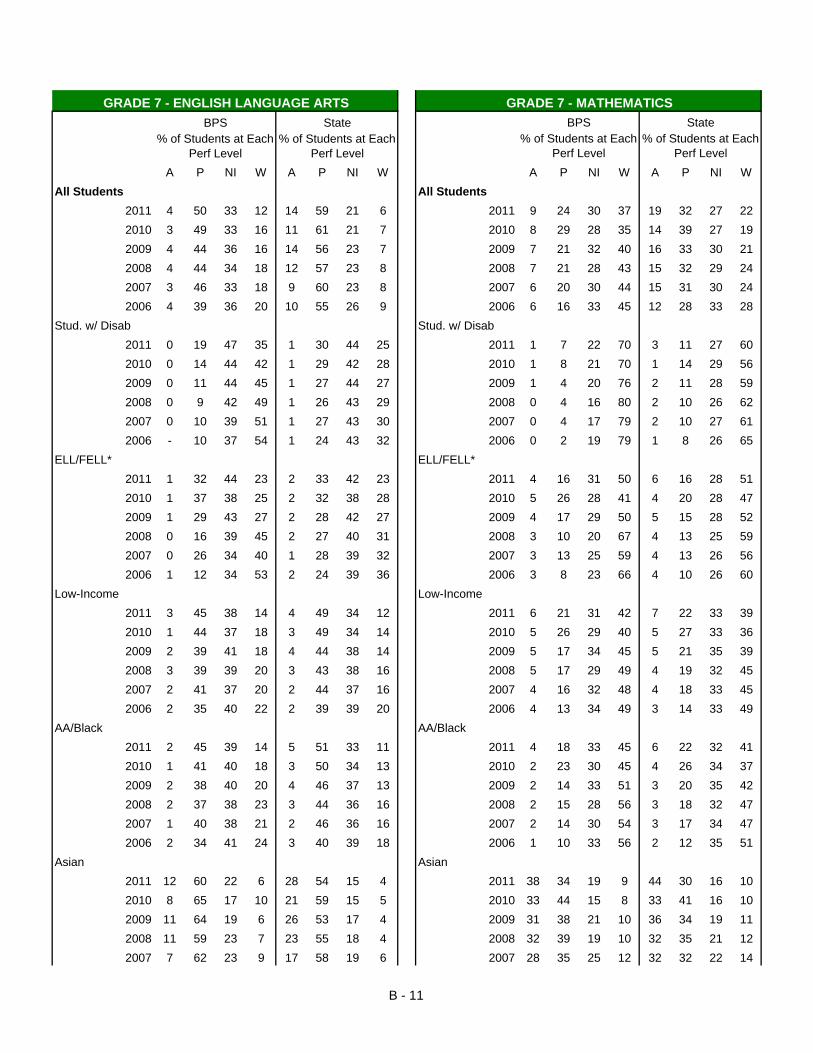
A P NI W A P NI W A P NI W A P NI W
All Students All Students
2011 4 50 33 12 14 59 21 6 2011 9 24 30 37 19 32 27 22
2010 3 49 33 16 11 61 21 7 2010 8 29 28 35 14 39 27 19
2009 4 44 36 16 14 56 23 7 2009 7 21 32 40 16 33 30 21
2008 4 44 34 18 12 57 23 8 2008 7 21 28 43 15 32 29 24
2007 3 46 33 18 9 60 23 8 2007 6 20 30 44 15 31 30 24
2006 4 39 36 20 10 55 26 9 2006 6 16 33 45 12 28 33 28
Stud. w/ Disab Stud. w/ Disab
2011 0 19 47 35 1 30 44 25 2011 1 7 22 70 3 11 27 60
2010 0 14 44 42 1 29 42 28 2010 1 8 21 70 1 14 29 56
2009 0 11 44 45 1 27 44 27 2009 1 4 20 76 2 11 28 59
2008 0 9 42 49 1 26 43 29 2008 0 4 16 80 2 10 26 62
2007 0 10 39 51 1 27 43 30 2007 0 4 17 79 2 10 27 61
2006 - 10 37 54 1 24 43 32 2006 0 2 19 79 1 8 26 65
ELL/FELL* ELL/FELL*
2011 1 32 44 23 2 33 42 23 2011 4 16 31 50 6 16 28 51
2010 1 37 38 25 2 32 38 28 2010 5 26 28 41 4 20 28 47
2009 1 29 43 27 2 28 42 27 2009 4 17 29 50 5 15 28 52
2008 0 16 39 45 2 27 40 31 2008 3 10 20 67 4 13 25 59
2007 0 26 34 40 1 28 39 32 2007 3 13 25 59 4 13 26 56
2006 1 12 34 53 2 24 39 36 2006 3 8 23 66 4 10 26 60
Low-Income Low-Income
2011 3 45 38 14 4 49 34 12 2011 6 21 31 42 7 22 33 39
2010 1 44 37 18 3 49 34 14 2010 5 26 29 40 5 27 33 36
2009 2 39 41 18 4 44 38 14 2009 5 17 34 45 5 21 35 39
2008 3 39 39 20 3 43 38 16 2008 5 17 29 49 4 19 32 45
2007 2 41 37 20 2 44 37 16 2007 4 16 32 48 4 18 33 45
2006 2 35 40 22 2 39 39 20 2006 4 13 34 49 3 14 33 49
AA/Black AA/Black
2011 2 45 39 14 5 51 33 11 2011 4 18 33 45 6 22 32 41
2010 1 41 40 18 3 50 34 13 2010 2 23 30 45 4 26 34 37
2009 2 38 40 20 4 46 37 13 2009 2 14 33 51 3 20 35 42
2008 2 37 38 23 3 44 36 16 2008 2 15 28 56 3 18 32 47
2007 1 40 38 21 2 46 36 16 2007 2 14 30 54 3 17 34 47
2006 2 34 41 24 3 40 39 18 2006 1 10 33 56 2 12 35 51
Asian Asian
2011 12 60 22 6 28 54 15 4 2011 38 34 19 9 44 30 16 10
2010 8 65 17 10 21 59 15 5 2010 33 44 15 8 33 41 16 10
2009 11 64 19 6 26 53 17 4 2009 31 38 21 10 36 34 19 11
2008 11 59 23 7 23 55 18 4 2008 32 39 19 10 32 35 21 12
2007 7 62 23 9 17 58 19 6 2007 28 35 25 12 32 32 22 14
% of Students at Each Perf Level
% of Students at Each Perf Level
BPS State
GRADE 7 - MATHEMATICS
% of Students at Each Perf Level
% of Students at Each Perf Level
BPS State
GRADE 7 - ENGLISH LANGUAGE ARTS
B - 11
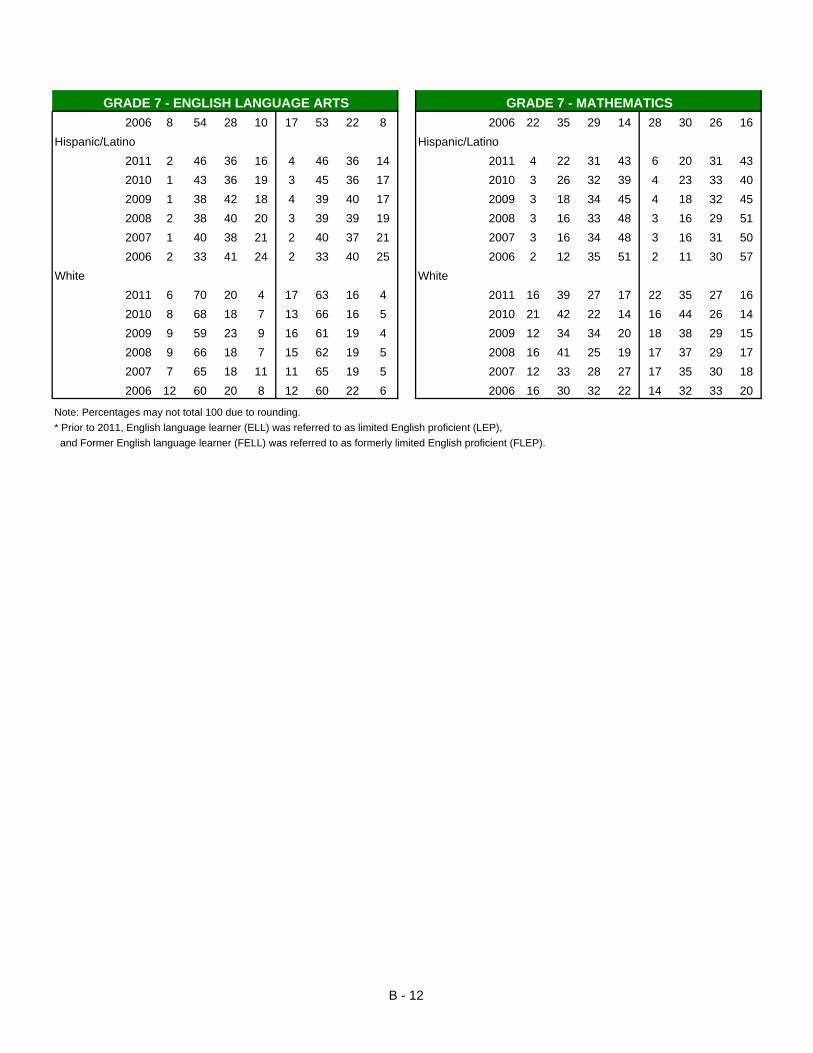
GRADE 7 - MATHEMATICSGRADE 7 - ENGLISH LANGUAGE ARTS
2006 8 54 28 10 17 53 22 8 2006 22 35 29 14 28 30 26 16
Hispanic/Latino Hispanic/Latino
2011 2 46 36 16 4 46 36 14 2011 4 22 31 43 6 20 31 43
2010 1 43 36 19 3 45 36 17 2010 3 26 32 39 4 23 33 40
2009 1 38 42 18 4 39 40 17 2009 3 18 34 45 4 18 32 45
2008 2 38 40 20 3 39 39 19 2008 3 16 33 48 3 16 29 51
2007 1 40 38 21 2 40 37 21 2007 3 16 34 48 3 16 31 50
2006 2 33 41 24 2 33 40 25 2006 2 12 35 51 2 11 30 57
White White
2011 6 70 20 4 17 63 16 4 2011 16 39 27 17 22 35 27 16
2010 8 68 18 7 13 66 16 5 2010 21 42 22 14 16 44 26 14
2009 9 59 23 9 16 61 19 4 2009 12 34 34 20 18 38 29 15
2008 9 66 18 7 15 62 19 5 2008 16 41 25 19 17 37 29 17
2007 7 65 18 11 11 65 19 5 2007 12 33 28 27 17 35 30 18
2006 12 60 20 8 12 60 22 6 2006 16 30 32 22 14 32 33 20
Note: Percentages may not total 100 due to rounding.
* Prior to 2011, English language learner (ELL) was referred to as limited English proficient (LEP),
and Former English language learner (FELL) was referred to as formerly limited English proficient (FLEP).
B - 12
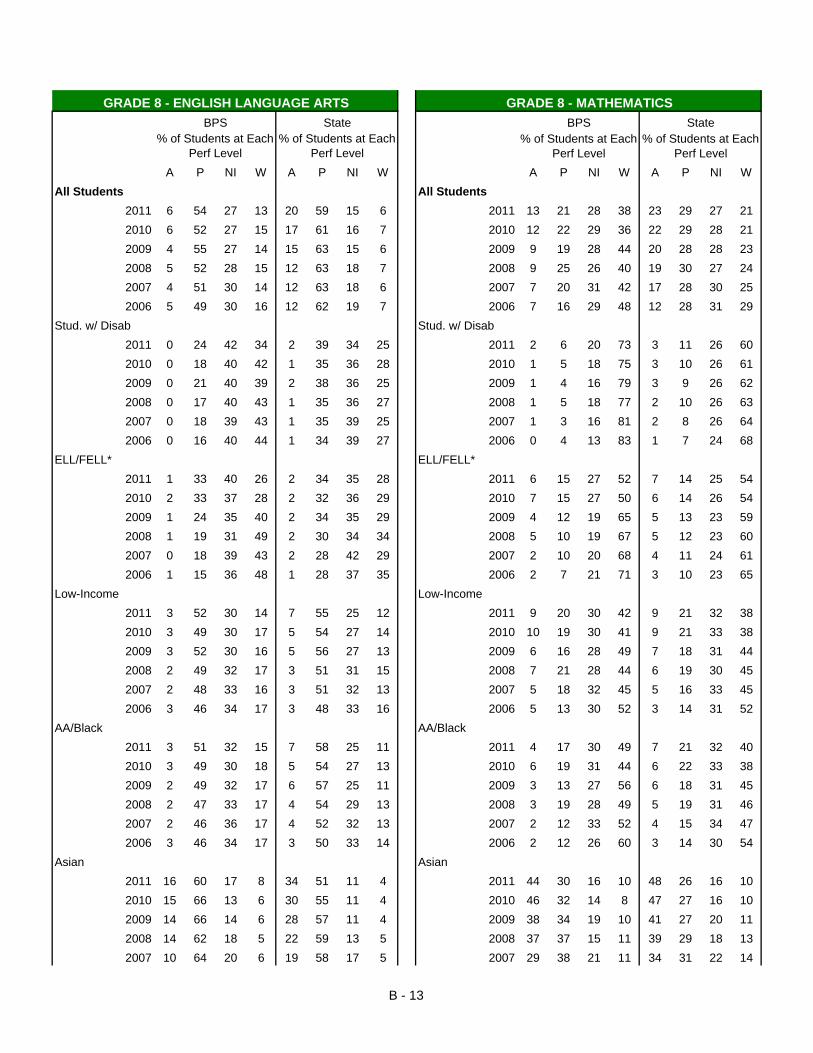
A P NI W A P NI W A P NI W A P NI W
All Students All Students
2011 6 54 27 13 20 59 15 6 2011 13 21 28 38 23 29 27 21
2010 6 52 27 15 17 61 16 7 2010 12 22 29 36 22 29 28 21
2009 4 55 27 14 15 63 15 6 2009 9 19 28 44 20 28 28 23
2008 5 52 28 15 12 63 18 7 2008 9 25 26 40 19 30 27 24
2007 4 51 30 14 12 63 18 6 2007 7 20 31 42 17 28 30 25
2006 5 49 30 16 12 62 19 7 2006 7 16 29 48 12 28 31 29
Stud. w/ Disab Stud. w/ Disab
2011 0 24 42 34 2 39 34 25 2011 2 6 20 73 3 11 26 60
2010 0 18 40 42 1 35 36 28 2010 1 5 18 75 3 10 26 61
2009 0 21 40 39 2 38 36 25 2009 1 4 16 79 3 9 26 62
2008 0 17 40 43 1 35 36 27 2008 1 5 18 77 2 10 26 63
2007 0 18 39 43 1 35 39 25 2007 1 3 16 81 2 8 26 64
2006 0 16 40 44 1 34 39 27 2006 0 4 13 83 1 7 24 68
ELL/FELL* ELL/FELL*
2011 1 33 40 26 2 34 35 28 2011 6 15 27 52 7 14 25 54
2010 2 33 37 28 2 32 36 29 2010 7 15 27 50 6 14 26 54
2009 1 24 35 40 2 34 35 29 2009 4 12 19 65 5 13 23 59
2008 1 19 31 49 2 30 34 34 2008 5 10 19 67 5 12 23 60
2007 0 18 39 43 2 28 42 29 2007 2 10 20 68 4 11 24 61
2006 1 15 36 48 1 28 37 35 2006 2 7 21 71 3 10 23 65
Low-Income Low-Income
2011 3 52 30 14 7 55 25 12 2011 9 20 30 42 9 21 32 38
2010 3 49 30 17 5 54 27 14 2010 10 19 30 41 9 21 33 38
2009 3 52 30 16 5 56 27 13 2009 6 16 28 49 7 18 31 44
2008 2 49 32 17 3 51 31 15 2008 7 21 28 44 6 19 30 45
2007 2 48 33 16 3 51 32 13 2007 5 18 32 45 5 16 33 45
2006 3 46 34 17 3 48 33 16 2006 5 13 30 52 3 14 31 52
AA/Black AA/Black
2011 3 51 32 15 7 58 25 11 2011 4 17 30 49 7 21 32 40
2010 3 49 30 18 5 54 27 13 2010 6 19 31 44 6 22 33 38
2009 2 49 32 17 6 57 25 11 2009 3 13 27 56 6 18 31 45
2008 2 47 33 17 4 54 29 13 2008 3 19 28 49 5 19 31 46
2007 2 46 36 17 4 52 32 13 2007 2 12 33 52 4 15 34 47
2006 3 46 34 17 3 50 33 14 2006 2 12 26 60 3 14 30 54
Asian Asian
2011 16 60 17 8 34 51 11 4 2011 44 30 16 10 48 26 16 10
2010 15 66 13 6 30 55 11 4 2010 46 32 14 8 47 27 16 10
2009 14 66 14 6 28 57 11 4 2009 38 34 19 10 41 27 20 11
2008 14 62 18 5 22 59 13 5 2008 37 37 15 11 39 29 18 13
2007 10 64 20 6 19 58 17 5 2007 29 38 21 11 34 31 22 14
State% of Students at Each
Perf Level% of Students at Each
Perf Level
BPS State BPS
GRADE 8 - ENGLISH LANGUAGE ARTS GRADE 8 - MATHEMATICS
% of Students at Each Perf Level
% of Students at Each Perf Level
B - 13

GRADE 8 - ENGLISH LANGUAGE ARTS GRADE 8 - MATHEMATICS
2006 13 63 15 8 20 56 18 6 2006 31 32 24 13 27 32 24 18
Hispanic/Latino Hispanic/Latino
2011 3 52 30 15 6 52 27 15 2011 7 19 31 42 8 19 30 43
2010 4 48 32 16 5 50 29 16 2010 7 18 31 43 7 18 31 43
2009 2 53 30 16 4 52 28 16 2009 3 16 31 49 6 16 29 49
2008 2 49 31 18 3 47 32 18 2008 5 21 30 44 5 17 28 50
2007 2 46 33 19 3 45 35 17 2007 3 17 33 48 4 14 30 52
2006 2 42 37 19 2 42 35 21 2006 3 11 32 55 3 12 29 57
White White
2011 15 65 14 5 23 61 11 4 2011 29 31 23 17 27 32 26 16
2010 13 62 17 8 20 64 12 4 2010 21 33 29 17 25 33 27 15
2009 10 72 13 6 18 67 12 4 2009 19 33 29 19 24 32 27 17
2008 12 67 14 8 14 67 14 4 2008 16 41 22 21 22 34 27 17
2007 10 70 16 5 15 68 14 4 2007 17 35 28 20 20 32 30 18
2006 14 66 13 7 14 67 14 4 2006 15 31 31 23 14 32 32 22
Note: Percentages may not total 100 due to rounding.
* Prior to 2011, English language learner (ELL) was referred to as limited English proficient (LEP),
and Former English language learner (FELL) was referred to as formerly limited English proficient (FLEP).
B - 14
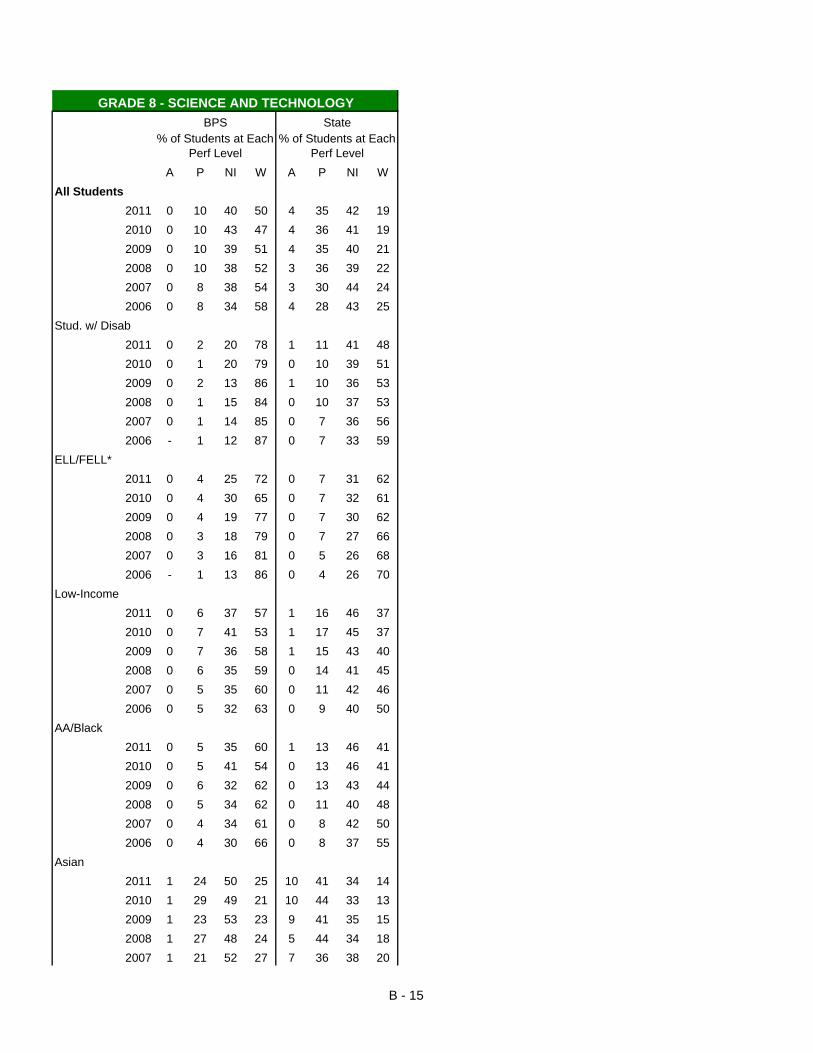
A P NI W A P NI W
All Students
2011 0 10 40 50 4 35 42 19
2010 0 10 43 47 4 36 41 19
2009 0 10 39 51 4 35 40 21
2008 0 10 38 52 3 36 39 22
2007 0 8 38 54 3 30 44 24
2006 0 8 34 58 4 28 43 25
Stud. w/ Disab
2011 0 2 20 78 1 11 41 48
2010 0 1 20 79 0 10 39 51
2009 0 2 13 86 1 10 36 53
2008 0 1 15 84 0 10 37 53
2007 0 1 14 85 0 7 36 56
2006 - 1 12 87 0 7 33 59
ELL/FELL*
2011 0 4 25 72 0 7 31 62
2010 0 4 30 65 0 7 32 61
2009 0 4 19 77 0 7 30 62
2008 0 3 18 79 0 7 27 66
2007 0 3 16 81 0 5 26 68
2006 - 1 13 86 0 4 26 70
Low-Income
2011 0 6 37 57 1 16 46 37
2010 0 7 41 53 1 17 45 37
2009 0 7 36 58 1 15 43 40
2008 0 6 35 59 0 14 41 45
2007 0 5 35 60 0 11 42 46
2006 0 5 32 63 0 9 40 50
AA/Black
2011 0 5 35 60 1 13 46 41
2010 0 5 41 54 0 13 46 41
2009 0 6 32 62 0 13 43 44
2008 0 5 34 62 0 11 40 48
2007 0 4 34 61 0 8 42 50
2006 0 4 30 66 0 8 37 55
Asian
2011 1 24 50 25 10 41 34 14
2010 1 29 49 21 10 44 33 13
2009 1 23 53 23 9 41 35 15
2008 1 27 48 24 5 44 34 18
2007 1 21 52 27 7 36 38 20
GRADE 8 - SCIENCE AND TECHNOLOGY
BPS State% of Students at Each
Perf Level% of Students at Each
Perf Level
B - 15

GRADE 8 - SCIENCE AND TECHNOLOGY
2006 1 18 52 28 8 31 39 23
Hispanic/Latino
2011 0 6 37 57 1 12 42 45
2010 0 6 40 54 1 12 42 45
2009 0 6 36 58 1 12 40 48
2008 0 5 34 61 0 11 37 52
2007 0 4 31 65 0 7 37 55
2006 0 4 28 68 0 7 35 57
White
2011 1 21 54 24 5 41 43 11
2010 1 22 52 26 4 43 41 12
2009 0 22 55 23 5 42 40 13
2008 0 24 50 26 3 44 40 13
2007 0 19 54 27 3 36 45 15
2006 0 23 49 28 5 34 45 17
Note: Percentages may not total 100 due to rounding.
* Prior to 2011, English language learner (ELL) was referred to as limited English proficient (LEP),
and Former English language learner (FELL) was referred to as formerly limited English proficient (FLEP).
B - 16
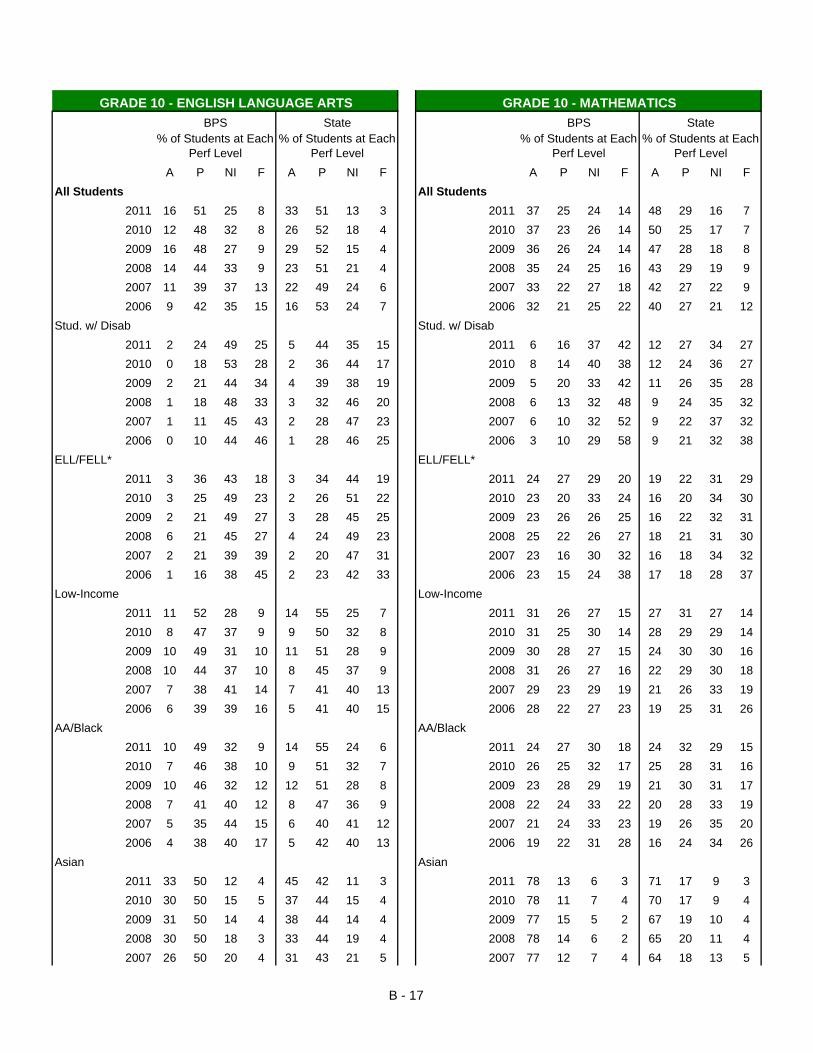
A P NI F A P NI F A P NI F A P NI F
All Students All Students
2011 16 51 25 8 33 51 13 3 2011 37 25 24 14 48 29 16 7
2010 12 48 32 8 26 52 18 4 2010 37 23 26 14 50 25 17 7
2009 16 48 27 9 29 52 15 4 2009 36 26 24 14 47 28 18 8
2008 14 44 33 9 23 51 21 4 2008 35 24 25 16 43 29 19 9
2007 11 39 37 13 22 49 24 6 2007 33 22 27 18 42 27 22 9
2006 9 42 35 15 16 53 24 7 2006 32 21 25 22 40 27 21 12
Stud. w/ Disab Stud. w/ Disab
2011 2 24 49 25 5 44 35 15 2011 6 16 37 42 12 27 34 27
2010 0 18 53 28 2 36 44 17 2010 8 14 40 38 12 24 36 27
2009 2 21 44 34 4 39 38 19 2009 5 20 33 42 11 26 35 28
2008 1 18 48 33 3 32 46 20 2008 6 13 32 48 9 24 35 32
2007 1 11 45 43 2 28 47 23 2007 6 10 32 52 9 22 37 32
2006 0 10 44 46 1 28 46 25 2006 3 10 29 58 9 21 32 38
ELL/FELL* ELL/FELL*
2011 3 36 43 18 3 34 44 19 2011 24 27 29 20 19 22 31 29
2010 3 25 49 23 2 26 51 22 2010 23 20 33 24 16 20 34 30
2009 2 21 49 27 3 28 45 25 2009 23 26 26 25 16 22 32 31
2008 6 21 45 27 4 24 49 23 2008 25 22 26 27 18 21 31 30
2007 2 21 39 39 2 20 47 31 2007 23 16 30 32 16 18 34 32
2006 1 16 38 45 2 23 42 33 2006 23 15 24 38 17 18 28 37
Low-Income Low-Income
2011 11 52 28 9 14 55 25 7 2011 31 26 27 15 27 31 27 14
2010 8 47 37 9 9 50 32 8 2010 31 25 30 14 28 29 29 14
2009 10 49 31 10 11 51 28 9 2009 30 28 27 15 24 30 30 16
2008 10 44 37 10 8 45 37 9 2008 31 26 27 16 22 29 30 18
2007 7 38 41 14 7 41 40 13 2007 29 23 29 19 21 26 33 19
2006 6 39 39 16 5 41 40 15 2006 28 22 27 23 19 25 31 26
AA/Black AA/Black
2011 10 49 32 9 14 55 24 6 2011 24 27 30 18 24 32 29 15
2010 7 46 38 10 9 51 32 7 2010 26 25 32 17 25 28 31 16
2009 10 46 32 12 12 51 28 8 2009 23 28 29 19 21 30 31 17
2008 7 41 40 12 8 47 36 9 2008 22 24 33 22 20 28 33 19
2007 5 35 44 15 6 40 41 12 2007 21 24 33 23 19 26 35 20
2006 4 38 40 17 5 42 40 13 2006 19 22 31 28 16 24 34 26
Asian Asian
2011 33 50 12 4 45 42 11 3 2011 78 13 6 3 71 17 9 3
2010 30 50 15 5 37 44 15 4 2010 78 11 7 4 70 17 9 4
2009 31 50 14 4 38 44 14 4 2009 77 15 5 2 67 19 10 4
2008 30 50 18 3 33 44 19 4 2008 78 14 6 2 65 20 11 4
2007 26 50 20 4 31 43 21 5 2007 77 12 7 4 64 18 13 5
State BPS StateBPS
GRADE 10 - ENGLISH LANGUAGE ARTS GRADE 10 - MATHEMATICS
% of Students at Each Perf Level
% of Students at Each Perf Level
% of Students at Each Perf Level
% of Students at Each Perf Level
B - 17

GRADE 10 - ENGLISH LANGUAGE ARTS GRADE 10 - MATHEMATICS
2006 25 51 21 3 24 49 21 6 2006 79 13 5 3 63 17 14 7
Hispanic/Latino Hispanic/Latino
2011 10 55 27 8 11 52 28 9 2011 27 29 29 16 23 29 30 18
2010 7 47 37 9 8 48 35 9 2010 27 28 31 15 23 26 32 19
2009 8 51 30 11 9 48 31 12 2009 27 29 30 14 20 28 32 19
2008 8 42 39 10 7 42 40 11 2008 24 30 30 16 19 27 32 23
2007 5 38 41 16 6 37 41 16 2007 24 24 30 21 18 24 34 24
2006 4 36 42 18 3 36 41 20 2006 20 25 29 27 14 22 32 32
White White
2011 36 50 10 4 38 51 9 2 2011 65 18 10 8 54 29 13 4
2010 27 51 16 5 30 54 13 2 2010 60 17 15 8 56 25 14 4
2009 37 48 11 4 33 53 11 3 2009 63 19 11 7 53 28 15 5
2008 29 50 15 5 27 53 17 3 2008 61 19 12 9 48 30 16 6
2007 28 46 19 6 25 52 19 3 2007 55 19 16 11 46 29 19 6
2006 23 53 16 7 18 57 20 4 2006 59 17 14 10 45 28 19 8
Note: Percentages may not total 100 due to rounding.
* Prior to 2011, English language learner (ELL) was referred to as limited English proficient (LEP),
and Former English language learner (FELL) was referred to as formerly limited English proficient (FLEP).
B - 18
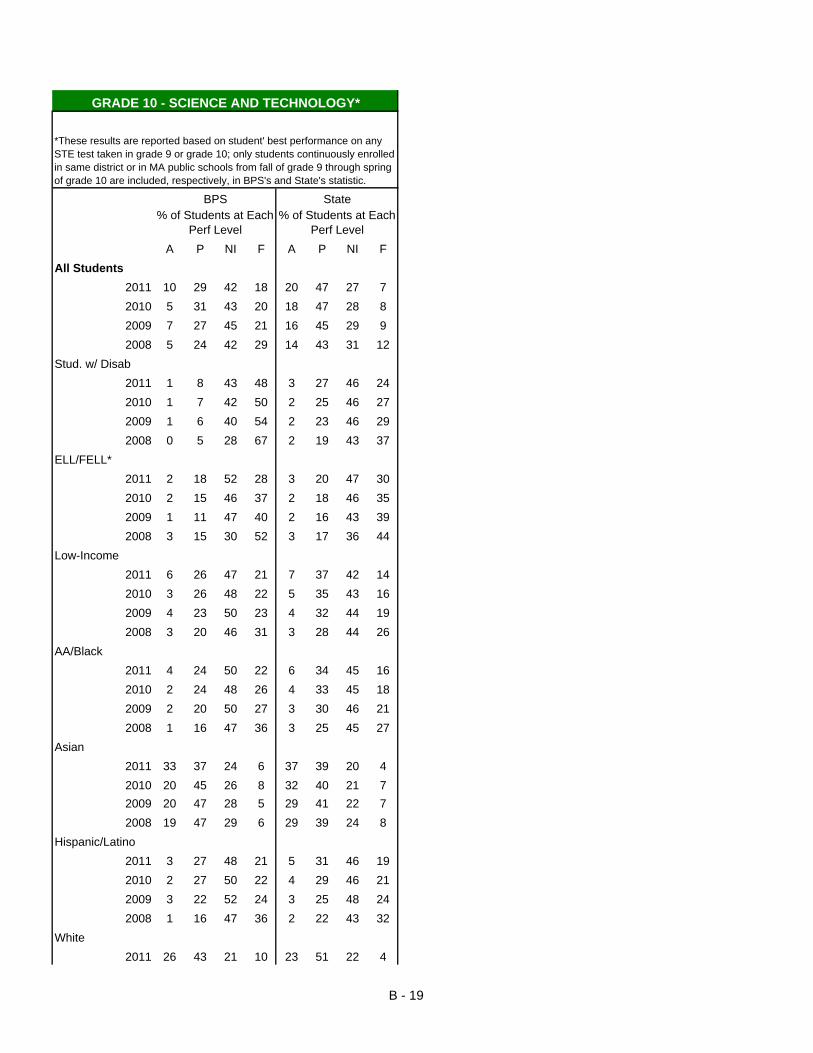
A P NI F A P NI F
All Students
2011 10 29 42 18 20 47 27 7
2010 5 31 43 20 18 47 28 8
2009 7 27 45 21 16 45 29 9
2008 5 24 42 29 14 43 31 12
Stud. w/ Disab
2011 1 8 43 48 3 27 46 24
2010 1 7 42 50 2 25 46 27
2009 1 6 40 54 2 23 46 29
2008 0 5 28 67 2 19 43 37
ELL/FELL*
2011 2 18 52 28 3 20 47 30
2010 2 15 46 37 2 18 46 35
2009 1 11 47 40 2 16 43 39
2008 3 15 30 52 3 17 36 44
Low-Income
2011 6 26 47 21 7 37 42 14
2010 3 26 48 22 5 35 43 16
2009 4 23 50 23 4 32 44 19
2008 3 20 46 31 3 28 44 26
AA/Black
2011 4 24 50 22 6 34 45 16
2010 2 24 48 26 4 33 45 18
2009 2 20 50 27 3 30 46 21
2008 1 16 47 36 3 25 45 27
Asian
2011 33 37 24 6 37 39 20 4
2010 20 45 26 8 32 40 21 7
2009 20 47 28 5 29 41 22 7
2008 19 47 29 6 29 39 24 8
Hispanic/Latino
2011 3 27 48 21 5 31 46 19
2010 2 27 50 22 4 29 46 21
2009 3 22 52 24 3 25 48 24
2008 1 16 47 36 2 22 43 32
White
2011 26 43 21 10 23 51 22 4
GRADE 10 - SCIENCE AND TECHNOLOGY*
% of Students at Each Perf Level
% of Students at Each Perf Level
BPS State
*These results are reported based on student' best performance on any STE test taken in grade 9 or grade 10; only students continuously enrolled in same district or in MA public schools from fall of grade 9 through spring of grade 10 are included, respectively, in BPS's and State's statistic.
B - 19

GRADE 10 - SCIENCE AND TECHNOLOGY*
2010 12 48 29 10 21 52 23 4
2009 19 44 27 10 19 51 25 5
2008 11 44 31 14 16 49 28 7
Note: Percentages may not total 100 due to rounding.
* Prior to 2011, English language learner (ELL) was referred to as limited English proficient (LEP),
and Former English language learner (FELL) was referred to as formerly limited English proficient (FLEP).
B - 20

School%
Advanced%
Proficient% Needs
Improvement% Warning /
Failing
Total N (N less than 10
not reported)
ELA Average
CPI
Median SGP (N
less than 20 not
reported)
Change in ELA
CPI 2010 to 2011
Adams Elementary 0% 22% 52% 26% 90 61.9 48.0 -6.8
Agassiz Elementary 1% 29% 52% 17% 204 67.2 45.0 1.8
Alighieri Elementary 6% 40% 49% 6% 53 77.8 48.0 2.4
Another Course College 21% 55% 21% 2% 42 89.9 50.0 0.5
Bates Elementary 8% 36% 39% 17% 146 75.5 50.5 0.9
Beethoven Elementary 9% 42% 44% 4% 45 81.1 2.5
Blackstone Elementary 1% 17% 44% 38% 231 52.6 38.0 -.9
Boston Arts Academy 18% 66% 16% 0% 95 95.3 50.0 1.9
Boston Comm Lead Acad 6% 65% 21% 7% 112 90.6 57.0 1.8
Boston International 4% 36% 60% 0% 50 79.5 14.4
Boston Latin 38% 61% 1% 0% 1149 99.7 38.0 -0.1
Boston Latin Academy 19% 78% 3% 0% 827 98.9 38.0 0.6
Bradley Elementary 10% 61% 26% 3% 128 88.1 65.5 0.9
Brighton High 4% 50% 38% 8% 207 80.0 56.0 -5.2
Brook Farm Academy 1% 61% 35% 3% 71 85.6 32.5 3.0
BTU K8 Pilot 3% 50% 40% 7% 112 81.3 46.5 -4.1
Burke High 1% 40% 44% 16% 128 71.9 30.5 6.6
Carter Center 4
Channing Elementary 5% 28% 51% 15% 144 69.1 35.5 -3.0
Charlestown High 8% 47% 29% 16% 182 84.1 51.0 -0.2
Chittick Elementary 2% 29% 48% 21% 119 68.7 41.5 -0.6
Clap Elementary 2% 29% 40% 29% 58 68.5 59.0 7.3
Comm Acad Sci Health 0% 55% 42% 3% 62 84.3 67.0 6.0
Community Academy 0% 67% 33% 0% 3
Condon Elementary 5% 24% 40% 31% 347 61.7 34.5 -3.7
Conley Elementary 4% 48% 38% 11% 80 76.9 49.5 6.2
Curley K8 8% 35% 34% 23% 442 71.7 47.0 -0.9
Dearborn Middle 1% 31% 43% 25% 211 64.5 54.0 5.7
Dever Elementary 1% 19% 47% 34% 193 54.4 48.0 -4.0
Dorchester Academy 4% 55% 38% 4% 55 83.2 38.0 1.5
E Greenwood Leadership 3% 28% 49% 21% 156 64.6 52.0 7.4
East Boston High 15% 49% 25% 12% 226 84.5 52.0 8.0
Edison K8 3% 36% 38% 23% 463 67.8 39.5 -0.7
Edwards Middle 5% 59% 27% 8% 476 84.5 74.0 4.9
Eliot K8 10% 62% 21% 7% 173 89.5 64.0 4.2
Ellis Elementary 0% 21% 49% 31% 101 58.2 39.0 -14.0
Ellison/Parks EES 3% 34% 38% 25% 32 67.2
Emerson Elementary 1% 14% 50% 35% 105 53.3 44.0 0.1
Engineering School 3% 52% 11% 33% 63 84.9 49.0 3.2
English High 5% 40% 40% 16% 106 75.7 47.5 2.6
Everett Elementary 2% 34% 50% 13% 126 72.8 45.0 0.8
Excel High 8% 58% 33% 2% 52 86.1 62.0 5.2
Farragut Elementary 12% 28% 45% 16% 94 71.8 56.5 3.6
Fenway High 13% 82% 6% 0% 71 98.6 58.0 6.5
Appendix C: 2011 MCAS Results by School - English Language Arts
C-1

School%
Advanced%
Proficient% Needs
Improvement% Warning /
Failing
Total N (N less than 10
not reported)
ELA Average
CPI
Median SGP (N
less than 20 not
reported)
Change in ELA
CPI 2010 to 2011
Appendix C: 2011 MCAS Results by School - English Language Arts
Fifield Elementary 0% 34% 46% 20% 133 66.7 36.5 -3.5
Frederick Pilot Middle 1% 38% 40% 21% 578 74.4 47.0 1.8
Gardner Pilot Academy 3% 28% 43% 26% 145 73.1 23.0 -4.6
Gavin Middle 1% 32% 34% 33% 424 71.8 41.0 0.3
Greater Egleston High 0% 39% 50% 11% 18 72.2
Greenwood Sarah K8 3% 38% 41% 17% 185 70.9 47.0 -6.3
Grew Elementary 0% 22% 58% 20% 110 63.0 30.0 -7.0
Guild Elementary 1% 26% 47% 27% 132 59.8 54.0 1.9
Hale Elementary 10% 60% 27% 3% 70 90.4 78.5 9.2
Haley Elementary 8% 30% 44% 18% 117 69.7 57.0 0.4
Harbor School 3% 44% 41% 12% 240 78.0 54.5 5.7
Harvard/Kent Elementary 4% 37% 38% 21% 191 72.4 57.0 7.0
Henderson Elementary 11% 41% 33% 14% 99 84.8 48.0 -3.4
Hennigan Elementary 4% 26% 44% 26% 266 65.8 42.5 0.1
Hernandez K8 6% 45% 42% 7% 208 80.2 54.0 2.7
Higginson/Lewis K8 0% 32% 43% 25% 189 68.8 31.5 -2.4
Holland Elementary 0% 12% 50% 37% 298 55.3 35.0 -.9
Holmes Elementary 2% 23% 51% 24% 123 61.6 30.0 -10.7
Horace Mann 0% 9% 16% 76% 58 71.1 2.2
Hurley K8 11% 38% 31% 19% 159 73.0 46.5 6.7
Irving Middle 5% 39% 41% 15% 515 72.7 44.0 0.8
Jackson/Mann K8 5% 36% 37% 21% 403 71.5 44.5 0.1
Kennedy John F Elemen 3% 32% 43% 22% 173 65.9 32.0 2.7
Kennedy Patrick Elem 1% 39% 53% 7% 100 74.8 62.0 -3.0
Kenny Elementary 2% 22% 44% 32% 117 57.9 51.0 -2.7
Kilmer K8 12% 57% 30% 2% 242 89.8 39.0 -2.2
King K8 0% 46% 44% 10% 173 76.3 37.0 -0.2
Lee Academy 5% 29% 41% 24% 95 67.9 46.0 5.4
Lee Elementary 8% 41% 42% 9% 168 84.2 43.0 -4.7
Lyndon K8 10% 54% 22% 14% 309 85.5 56.0 -1.8
Lyon 912 17% 65% 17% 0% 23 93.5
Lyon K8 18% 64% 15% 4% 80 92.5 64.0 2.1
Madison Park High 1% 32% 48% 19% 271 66.9 34.0 2.0
Manning Elementary 5% 36% 41% 17% 58 72.0 39.5 -6.8
Marshall Elementary 1% 19% 48% 33% 223 56.3 39.5 0.1
Mason Elementary 6% 37% 51% 6% 83 78.6 53.0 1.4
Mather Elementary 5% 33% 44% 18% 226 70.2 42.0 -1.9
Mattahunt Elementary 1% 18% 46% 35% 242 58.1 31.0 -7.4
McCormack Middle 2% 37% 39% 23% 518 68.2 31.0 -2.8
McKay K8 2% 43% 43% 12% 444 75.6 55.0 3.8
Mckinley School 0% 15% 32% 52% 151 61.8 38.5 5.5
Media Comm Tech High 1% 43% 51% 4% 90 76.1 42.0 -2.0
Mendell Elementary 3% 27% 53% 17% 70 65.7 37.0 -6.2
Middle School Academy 3
C-2

School%
Advanced%
Proficient% Needs
Improvement% Warning /
Failing
Total N (N less than 10
not reported)
ELA Average
CPI
Median SGP (N
less than 20 not
reported)
Change in ELA
CPI 2010 to 2011
Appendix C: 2011 MCAS Results by School - English Language Arts
Mildred Avenue K8 0% 22% 43% 34% 571 61.3 35.0 -4.1
Mission Hill K8 7% 48% 31% 14% 95 79.2 62.0 6.8
Monument High 5% 53% 39% 3% 59 83.1 40.0 6.6
Mozart Elementary 2% 31% 45% 22% 58 72.8 34.0 -8.3
Murphy K8 8% 49% 32% 12% 637 82.1 46.0 -1.0
New Mission High 7% 65% 27% 0% 55 92.3 46.5 1.2
O'Bryant Math & Sci. 17% 75% 8% 0% 518 97.7 40.0 0.3
O'Donnell Elementary 2% 30% 51% 17% 112 71.7 59.0 -3.3
Odyssey High 3% 55% 27% 15% 62 79.4 42.0 5.6
Ohrenberger 9% 42% 37% 12% 501 78.6 55.0 -0.5
Orchard Gardens K8 0% 30% 41% 28% 444 63.9 63.0 5.2
Otis Elementary 5% 41% 44% 11% 133 73.9 68.0 -1.5
Parkway Tech & Health 0% 60% 38% 2% 42 82.1 14.0 5.2
Perkins Elementary 7% 32% 36% 25% 75 74.3 18.0 -2.0
Perry K8 2% 31% 50% 18% 131 67.9 25.0 -7.7
Philbrick Elementary 16% 46% 30% 8% 61 82.4 70.0 0.9
Quincy Elementary 12% 44% 37% 7% 388 82.3 71.0 0.9
Quincy Upper School 8% 50% 35% 8% 359 81.8 40.5 1.6
Rogers Middle 2% 40% 44% 14% 570 73.9 41.0 -3.6
Roosevelt K8 7% 58% 30% 6% 306 85.5 62.0 0.3
Russell Elementary 2% 27% 48% 24% 157 63.2 47.0 -9.3
Snowden International 1% 71% 26% 1% 76 90.1 42.0 4.1
Social Justice Academy 4% 56% 36% 4% 45 80.6 54.0 2.3
Sumner Elementary 5% 37% 43% 16% 200 77.0 65.0 2.5
Taylor Elementary 11% 40% 36% 12% 210 77.0 63.0 1.1
TechBoston Acad 1012 7% 63% 29% 0% 95 90.0 58.0 1.4
TechBoston Acad 69 3% 39% 41% 18% 306 71.1 45.0 2.5
Timilty Middle 2% 42% 37% 19% 665 71.7 43.5 -1.7
Tobin K8 2% 25% 49% 25% 265 62.4 46.0 -0.1
Trotter Elementary 0% 20% 56% 23% 124 60.7 52.0 -1.9
Tynan Elementary 5% 27% 35% 34% 124 74.0 28.0 -13.3
Umana Middle 2% 38% 35% 26% 430 71.7 36.0 1.0
Urban Science Academy 10% 63% 15% 12% 59 96.2 68.0 1.0
Warren/Prescott K8 14% 56% 25% 6% 280 91.4 40.0 -0.3
Winship Elementary 0% 39% 48% 13% 77 74.0 36.0 0.5
Winthrop Elementary 3% 30% 51% 16% 116 68.5 57.0 4.3
Young Achievers K8 2% 36% 47% 16% 292 69.4 35.5 -3.4
C-3

School%
Advanced%
Proficient% Needs
Improvement% Warning /
Failing
Total N (N less than 10
not reported)
Math Average
CPI
Median SGP (N
less than 20 not
reported)
Change in Math
CPI 2010 to 2011
Adams Elementary 1% 26% 50% 23% 90 68.1 54.0 -2.0
Agassiz Elementary 4% 34% 43% 19% 204 69.4 58.0 4.0
Alighieri Elementary 9% 43% 43% 4% 53 82.5 36.0 16.8
Another Course College 45% 23% 23% 10% 40 81.9 75.0 -3.1
Bates Elementary 14% 25% 33% 27% 146 69.7 36.0 -2.4
Beethoven Elementary 20% 45% 30% 5% 44 86.4 10.4
Blackstone Elementary 1% 20% 47% 32% 231 57.7 60.0
Boston Arts Academy 19% 38% 35% 8% 97 80.4 38.0 -2.0
Boston Comm Lead Acad 30% 36% 22% 12% 110 87.0 77.0 -5.9
Boston International 43% 31% 20% 6% 49 87.2 5.1
Boston Latin 70% 24% 6% 0% 1152 97.9 53.0 -.3
Boston Latin Academy 42% 36% 19% 3% 833 91.2 47.5 -2.3
Bradley Elementary 14% 44% 39% 3% 128 83.6 44.0 -.5
Brighton High 15% 28% 39% 18% 195 70.3 52.5 -8.7
Brook Farm Academy 29% 33% 24% 14% 72 78.8 59.0 4.9
BTU K-8 Pilot 5% 31% 44% 21% 111 67.8 59.5 -3.4
Burke High 8% 31% 41% 21% 130 67.3 51.5 6.5
Carter Center 4
Channing Elementary 10% 24% 47% 19% 141 69.1 38.5 -3.4
Charlestown High 29% 20% 27% 24% 177 78.5 55.5 -1.4
Chittick Elementary 1% 26% 52% 21% 119 66.4 51.0 2.9
Clap Elementary 2% 22% 36% 41% 59 53.8 64.0 4.2
Comm Acad Sci Health 18% 34% 37% 11% 62 78.2 67.5 -.2
Community Academy 4
Condon Elementary 8% 24% 41% 28% 345 63.0 50.0 -1.4
Conley Elementary 14% 34% 37% 15% 79 75.9 45.0 3.0
Curley K-8 10% 19% 34% 36% 439 60.2 50.0 2.2
Dearborn Middle 5% 19% 30% 45% 207 51.8 60.0 3.5
Dever Elementary 4% 31% 43% 23% 194 65.7 68.0 9.6
Dorchester Academy 23% 25% 36% 17% 53 71.7 70.0 -2.0
E Greenwood Leadership 6% 26% 38% 29% 156 61.9 43.0 6.5
East Boston High 22% 32% 28% 18% 219 78.8 47.0 5.1
Edison K-8 9% 21% 36% 34% 459 59.5 48.0 -2.2
Edwards Middle 8% 31% 37% 24% 476 68.0 66.0 .2
Eliot K-8 25% 35% 30% 10% 173 83.5 72.5 2.4
Ellis Elementary 4% 22% 54% 19% 103 64.6 71.0 -5.7
Ellison/Parks EES 3% 35% 35% 26% 31 64.5 -8.1
Emerson Elementary 1% 15% 48% 36% 105 53.6 43.0 -8.2
Engineering School 17% 25% 20% 38% 60 75.4 53.5 -3.4
English High 18% 27% 27% 27% 106 66.5 45.0 -.1
Everett Elementary 7% 36% 42% 15% 126 73.0 59.0 1.8
Excel High 27% 37% 31% 6% 52 84.1 74.0 -2.1
Farragut Elementary 15% 23% 32% 30% 94 64.6 35.0 -2.9
Fenway High 41% 43% 16% 0% 70 95.4 56.0 2.4
Fifield Elementary 0% 30% 41% 29% 133 61.1 26.0 -5.2
Frederick Pilot Middle 3% 18% 35% 44% 578 57.7 58.0 7.5
Gardner Pilot Academy 6% 32% 35% 27% 143 76.7 30.0 1.7
Gavin Middle 6% 19% 28% 48% 435 61.6 52.0 -3.3
Greater Egleston High 0% 8% 46% 46% 13 44.2
Greenwood Sarah K-8 3% 22% 43% 32% 186 59.4 20.0 -15.1
Grew Elementary 4% 26% 45% 25% 110 63.2 37.0 -3.0
Guild Elementary 5% 35% 38% 23% 133 68.4 79.0 8.9
Hale Elementary 10% 43% 46% 1% 70 85.0 72.0 5.9
Haley Elementary 5% 22% 50% 23% 118 62.9 57.0 -1.2
Harbor School 3% 13% 37% 48% 238 51.4 44.0 -.9
Harvard/Kent Elementary 18% 38% 30% 15% 192 79.8 60.0 4.7
Henderson Elementary 21% 40% 24% 15% 100 86.8 64.0 -1.8
Appendix C: 2011 MCAS Results by School - Mathematics
C-4

School%
Advanced%
Proficient% Needs
Improvement% Warning /
Failing
Total N (N less than 10
not reported)
Math Average
CPI
Median SGP (N
less than 20 not
reported)
Change in Math
CPI 2010 to 2011
Appendix C: 2011 MCAS Results by School - Mathematics
Hennigan Elementary 4% 22% 40% 34% 268 60.4 54.0 1.4
Hernandez K-8 10% 36% 38% 16% 208 74.2 59.0 -.7
Higginson/Lewis K-8 1% 11% 29% 59% 194 46.1 31.0 -2.5
Holland Elementary 3% 19% 44% 34% 303 59.8 48.0 2.8
Holmes Elementary 1% 25% 49% 25% 122 61.1 37.0 -8.1
Horace Mann 2% 12% 24% 63% 59 64.8 .3
Hurley K-8 18% 31% 33% 18% 159 73.0 59.5 7.8
Irving Middle 6% 13% 31% 50% 525 48.8 33.0 -4.7
Jackson/Mann K-8 9% 21% 36% 34% 414 62.0 42.0 -2.2
Kennedy John F Elemen 14% 41% 32% 13% 173 78.9 62.0 13.7
Kennedy Patrick Elem 3% 35% 50% 12% 100 73.0 76.0 2.7
Kenny Elementary 7% 20% 47% 26% 117 61.1 69.0 -.2
Kilmer K-8 23% 44% 28% 5% 241 86.4 48.5 -1.0
King K-8 5% 23% 43% 30% 173 59.2 40.0 -2.8
Lee Academy 5% 20% 43% 32% 95 61.6 43.0 -.7
Lee Elementary 5% 24% 47% 24% 169 68.9 28.5 -8.3
Lyndon K-8 13% 35% 31% 22% 309 75.6 45.0 -4.7
Lyon 9-12 43% 30% 22% 4% 23 87.0
Lyon K-8 37% 35% 25% 3% 79 88.9 58.0 -2.9
Madison Park High 4% 27% 47% 22% 270 64.2 42.0 1.3
Manning Elementary 3% 33% 36% 28% 58 64.7 59.5 -8.0
Marshall Elementary 3% 14% 53% 30% 224 55.5 63.0 2.1
Mason Elementary 10% 39% 45% 7% 83 80.7 65.0 6.0
Mather Elementary 8% 29% 51% 13% 231 71.8 49.5 3.9
Mattahunt Elementary 2% 14% 40% 45% 240 53.2 36.0 -1.9
McCormack Middle 9% 21% 29% 41% 524 56.0 36.0 -9.0
McKay K-8 5% 28% 43% 24% 445 65.8 59.0 1.4
Mckinley School 3% 9% 24% 64% 151 54.3 56.0 3.9
Media Comm Tech High 7% 35% 42% 15% 85 71.8 45.5 -6.0
Mendell Elementary 9% 17% 46% 29% 70 59.3 23.5 1.3
Middle School Academy 3
Mildred Avenue K-8 1% 7% 30% 62% 568 42.7 39.0 -4.1
Mission Hill K-8 11% 36% 29% 24% 95 70.5 66.5 8.8
Monument High 5% 38% 46% 11% 56 75.4 58.0 2.7
Mozart Elementary 7% 39% 30% 23% 56 78.6 35.0 .1
Murphy K-8 18% 33% 27% 22% 635 74.7 50.0 -3.1
New Mission High 43% 34% 23% 0% 53 92.0 82.0 1.8
O'Bryant Math & Sci. 53% 35% 10% 2% 512 94.9 57.0 -.1
O'Donnell Elementary 3% 23% 51% 23% 112 66.1 33.0 -11.3
Odyssey High 6% 32% 30% 32% 63 61.9 25.0 -.2
Ohrenberger 10% 28% 39% 23% 500 69.0 45.0 -5.7
Orchard Gardens K-8 6% 29% 32% 33% 444 63.9 79.0 13.5
Otis Elementary 11% 43% 37% 9% 133 79.5 64.5 -4.9
Parkway Tech & Health 33% 28% 33% 5% 39 83.3 66.0 8.7
Perkins Elementary 1% 42% 30% 27% 74 75.3 24.0 -5.6
Perry K-8 3% 20% 48% 28% 132 60.2 41.0 -3.4
Philbrick Elementary 13% 34% 43% 10% 61 76.6 45.0 -4.0
Quincy Elementary 25% 47% 22% 6% 390 88.0 78.0 2.2
Quincy Upper School 19% 30% 28% 22% 358 72.1 42.0 -3.8
Rogers Middle 5% 17% 29% 49% 570 51.4 35.0 -9.4
Roosevelt K-8 11% 34% 35% 19% 306 72.6 49.0 -6.3
Russell Elementary 5% 33% 41% 21% 157 67.7 66.5 -.3
Snowden International 15% 42% 29% 14% 73 78.4 42.0 -5.1
Social Justice Academy 11% 21% 32% 36% 47 59.0 46.5 -1.1
Sumner Elementary 8% 37% 37% 19% 200 77.1 75.0 9.2
Taylor Elementary 12% 37% 38% 13% 210 76.5 57.0 -.5
TechBoston Acad 10-12 22% 46% 28% 4% 98 86.5 65.0 .7
C-5

School%
Advanced%
Proficient% Needs
Improvement% Warning /
Failing
Total N (N less than 10
not reported)
Math Average
CPI
Median SGP (N
less than 20 not
reported)
Change in Math
CPI 2010 to 2011
Appendix C: 2011 MCAS Results by School - Mathematics
TechBoston Acad 6-9 1% 9% 33% 58% 304 41.2 30.5 .9
Timilty Middle 7% 20% 35% 39% 664 56.3 47.0 -7.4
Tobin K-8 3% 19% 45% 34% 271 56.3 63.0 2.9
Trotter Elementary 1% 18% 47% 34% 123 55.1 69.0 4.0
Tynan Elementary 5% 25% 40% 31% 124 74.6 30.0 -10.9
Umana Middle 8% 20% 28% 44% 431 57.3 47.0 2.1
Urban Science Academy 16% 33% 28% 23% 57 82.0 57.0 -7.5
Warren/Prescott K-8 21% 43% 28% 7% 278 88.5 57.5 -1.2
Winship Elementary 9% 39% 39% 13% 77 76.9 35.0 7.8
Winthrop Elementary 2% 29% 44% 25% 115 65.0 55.0 6.1
Young Achievers K-8 2% 22% 44% 31% 291 57.7 40.5 -3.5
C-6