massachusetts municipal wholesale electric company
TRANSCRIPT

Massachusetts Municipal Wholesale Electric Company Financial Statements and Supplementary Information Years Ended December 31, 2020 and 2019

Massachusetts Municipal Wholesale Electric Company
FINANCIAL STATEMENTS Years Ended December 31, 2020 and 2019
C O N T E N T S
Page Independent Auditors’ Report ............................................................................................................ 1-2 Required Supplementary Information
Management’s Discussion and Analysis (unaudited) ........................................................... 3-11 Financial Statements
Balance Sheets ..................................................................................................................... 12 Statements of Revenues, Expenses and Changes in Net Position ...................................... 13 Statements of Cash Flows .................................................................................................... 14-15 Fiduciary Financial Statements ............................................................................................. 16
Notes to Financial Statements .............................................................................................. 17-54
Required Supplementary Information (unaudited)……………………………………………………….. 55-58 Supplementary Information
Project Balance Sheets ......................................................................................................... 59 Project Statement of Revenues, Expenses and Changes in Net Position ........................... 60 Project Statement of Cash Flows .......................................................................................... 61 Combining Fiduciary Financial Statements........................................................................... 62
Other Information (unaudited)
Debt Service Coverage Calculation ...................................................................................... 63

Independent Auditors' Report
To the Board of Directors ofMassachusetts Municipal Wholesale Electric Company
Report on the Financial Statements
We have audited the accompanying financial statements of Massachusetts Municipal Wholesale ElectricCompany, as of and for the years ended December 31, 2020 and 2019 and the related notes to the financialstatements, which collectively comprise the Massachusetts Municipal Wholesale Electric Company's basicfinancial statements as listed in the table of contents.
Management’s Responsibility for the Financial Statements
Management is responsible for the preparation and fair presentation of these financial statements inaccordance with accounting principles generally accepted in the United States of America; this includes thedesign, implementation and maintenance of internal control relevant to the preparation and fair presentation offinancial statements that are free from material misstatement, whether due to fraud or error.
Auditors’ Responsibility
Our responsibility is to express an opinion on these financial statements based on our audits. We conductedour audits in accordance with auditing standards generally accepted in the United States of America. Thosestandards require that we plan and perform the audits to obtain reasonable assurance about whether thefinancial statements are free from material misstatement.
An audit involves performing procedures to obtain audit evidence about the amounts and disclosures in thefinancial statements. The procedures selected depend on the auditors’ judgment, including the assessment ofthe risks of material misstatement of the financial statements, whether due to fraud or error. In making thoserisk assessments, the auditor considers internal control relevant to the Massachusetts Municipal WholesaleElectric Company's preparation and fair presentation of the financial statements in order to design auditprocedures that are appropriate in the circumstances, but not for the purpose of expressing an opinion on theeffectiveness of the Massachusetts Municipal Wholesale Electric Company's internal control. Accordingly, weexpress no such opinion. An audit also includes evaluating the appropriateness of accounting policies usedand the reasonableness of significant accounting estimates made by management, as well as evaluating theoverall presentation of the financial statements.
We believe that the audit evidence we have obtained is sufficient and appropriate to provide a basis for ouraudit opinion.
Opinion
In our opinion, the financial statements referred to above present fairly, in all material respects, the financialposition of Massachusetts Municipal Wholesale Electric Company as of December 31, 2020 and 2019 and therespective changes in financial position and cash flows thereof for the years then ended in accordance withaccounting principles generally accepted in the United States of America.
1
Baker Tilly US, LLP, trading as Baker Tilly, is a member of the global network of Baker Tilly International Ltd., the members of which are separate and independent legal entities.

Other Matters
Required Supplementary Information
Accounting principles generally accepted in the United States of America require that the requiredsupplementary information as listed in the table of contents be presented to supplement the basic financialstatements. Such information, although not a part of the basic financial statements, is required by theGovernmental Accounting Standards Board who considers it to be an essential part of financial reporting forplacing the basic financial statements in an appropriate operational, economic or historical context. We haveapplied certain limited procedures to the required supplementary information in accordance with auditingstandards generally accepted in the United States of America, which consisted of inquiries of managementabout the methods of preparing the information and comparing the information for consistency withmanagement's responses to our inquiries, the basic financial statements and other knowledge we obtainedduring our audit of the basic financial statements. We do not express an opinion or provide any assurance onthe information because the limited procedures do not provide us with sufficient evidence to express an opinionor provide any assurance.
Supplementary Information
Our audits were conducted for the purpose of forming an opinion on the financial statements as a whole. Thesupplemental information as listed in the table of contents are presented for purposes of additional analysisand is not a required part of the basic financial statements. Such information is the responsibility ofmanagement and was derived from and relates directly to the underlying accounting and other records used toprepare the basic financial statements. The information has been subjected to the auditing procedures appliedin the audit of the basic financial statements and certain additional procedures, including comparing andreconciling such information directly to the underlying accounting and other records used to prepare the basicfinancial statements or to the basic financial statements themselves and other additional procedures inaccordance with auditing standards generally accepted in the United States of America. In our opinion, thesupplemental information is fairly stated in all material respects in relation to the basic financial statements as awhole.
Other Information
Our audit was conducted for the purpose of forming an opinion on the basic financial statements as a whole.The debt coverage calculation as identified in the table of contents is presented for purposes of additionalanalysis and is not a required part of the basic financial statements. Such information has not been subjectedto the auditing procedures applied in the audit of the basic financial statements and accordingly, we express noopinion or provide any assurance on it.
Madison, WisconsinMarch 30, 2021
2

Page 3
Massachusetts Municipal Wholesale Electric Company Management’s Discussion and Analysis (unaudited) Years Ended December 31, 2020 and 2019
The following discussion and analysis of the Massachusetts Municipal Wholesale Electric Company (MMWEC) provides an overview and analysis of MMWEC’s financial performance during the years ended December 31, 2020 and 2019. This discussion and analysis should be read in conjunction with MMWEC’s financial statements and the accompanying notes. OVERVIEW OF THE FINANCIAL STATEMENTS MMWEC is a public corporation and a political subdivision of the Commonwealth of Massachusetts formed to be a joint action agency to develop a bulk power supply for its member Massachusetts cities and towns having municipal electric systems (Members) and other utilities. Among other things, MMWEC is authorized to construct, own or purchase ownership interests in energy facilities and to issue revenue bonds for such purposes. MMWEC’s ownership interest in energy generation facilities is through various Projects. Pursuant to its General Bond Resolution (GBR), the bonds of any bond issue relating to a Project are secured solely by revenues derived from that Project. Project revenues are derived primarily from Power Sales Agreements (PSAs) with MMWEC’s Members and other utilities that are Participants in a Project (Project Participants). MMWEC’s bulk power supply program consists of power purchase arrangements, power brokering services, related planning and other financial services. MMWEC has a fiduciary responsibility over two defined benefit pension plans that are provided to its employees and has included fiduciary financial statements and disclosures for these pension plans. The accounting records of MMWEC are maintained using the Governmental Accounting Standards Board (GASB), the Uniform System of Accounts of the Federal Energy Regulatory Commission (FERC) and the Generally Accepted Accounting Principles of the United States (GAAP) using the economic resources measurement focus and the accrual basis of accounting. Application of the accounting methods for regulatory operations is also included in these financial statements. This accounting guidance relates to the deferral of revenues and expenses to future periods in which the revenues are earned or the expenses are recovered through the rate-making process, which is governed by the Board of Directors. MMWEC’s financial statements include the Balance Sheets, Statements of Revenues, Expenses and Changes in Net Position, Statements of Cash Flows, Statements of Fiduciary Net Position and Statements of Changes in Fiduciary Net Position. The Balance Sheets report year-end assets and liabilities based on the original cost adjusted for any depreciation, amortization or unrealized gains/losses as appropriate. The Statements of Revenues, Expenses and Changes in Net Position present MMWEC’s operating revenues and expenses incurred as a result of MMWEC’s business activity. The Statements of Cash Flows report the cash provided and used for operating activities, as well as investing activities and capital and noncapital related financing activities. The Statements of Fiduciary Net Position report the financial resources available for future benefits for MMWEC’s administrative and union pension plans. The Statements of Changes in Fiduciary Net Position reflect the additions, deductions and net increase or decrease in net position held in trust for pension benefits. MMWEC FINANCIAL ANALYSIS An analysis of MMWEC’s financial position begins with the review of the Balance Sheets, the Statements of Revenues, Expenses and Changes in Net Position and the Statements of Cash Flows. A summary of MMWEC’s Condensed Balance Sheets is presented in Table 1. The Condensed Statements of Revenues, Expenses and Changes in Net Position are summarized in Table 2 and the Condensed Statements of Cash Flows is summarized in Table 3.

Page 4
Massachusetts Municipal Wholesale Electric Company Management’s Discussion and Analysis (unaudited) Years Ended December 31, 2020 and 2019
MMWEC FINANCIAL ANALYSIS...continued
Restated 2020 2019 2018
Current assets, less current portions of designated
and restricted special funds including interest 90,377$ 78,952$ 100,863$ Restricted special funds, including interest receivable and current portion of restricted special funds 33,225 36,661 85,112 Other assets 375,843 361,883 287,384 Capital assets 536,884 543,713 544,922 Deferred outflows of resources 80,708 79,456 83,475
Total assets and deferred outflows of resources 1,117,037$ 1,100,665$ 1,101,756$
Current liabilities, less current maturities of long-term
debt and accrued interest 158,729$ 148,776$ 175,093$ Long-term debt, net of premiums, including current
maturities and accrued interest 40,178 43,772 26,504 Noncurrent liabilities 252,452 253,888 262,530 Deferred Inflow of resources 665,678 654,229 637,629
Total liabilities and deferred inflows of resources 1,117,037$ 1,100,665$ 1,101,756$
Table 1
(In Thousands)
Condensed Balance Sheets

Page 5
Massachusetts Municipal Wholesale Electric Company Management’s Discussion and Analysis (unaudited) Years Ended December 31, 2020 and 2019
MMWEC FINANCIAL ANALYSIS...continued
Restated2020 2019 2018
Operating revenues $ 227,889 $ 228,328 $ 264,632
Depreciation expense 21,708 20,798 16,675 Other operating expenses 216,637 220,245 251,760 Total operating expenses 238,345 241,043 268,435
Operating income (loss) (10,456) (12,715) (3,803)
Investment income (loss) 19,271 27,653 (1,082)Interest and amortization expense (1,576) (1,415) (1,841)Gain on disposition of property - 1,044 - (Increase) Decrease in amounts payable under terms of the power sales agreements (7,239) (14,567) 6,726 Total non-operating income (expenses) 10,456 12,715 3,803
Change in net position $ - $ - $ -
(In Thousands)
Table 2
Condensed Statements of Revenues, Expenses and Changes in Net Position
Restated
2020 2019 2018
Net cash provided by operating activities 27,688$ 13,715$ 19,640$
Net cash provided by (used in) investing activities (15,090) 9,610 (37,450)
Net cash used in capital and related financing activities (28,625) (14,637) (8,840)
Net cash provided by (used in) noncapital financingactivities (945) (28,675) 21,967
Net change in cash and cash equivalents (16,972) (19,987) (4,683)
Cash and cash equivalents – beginning of year 53,675 73,662 78,345
Cash and cash equivalents – end of year $ 36,703 $ 53,675 $ 73,662
Condensed Statements of Cash Flows
Table 3
(In Thousands)

Page 6
Massachusetts Municipal Wholesale Electric Company Management’s Discussion and Analysis (unaudited) Years Ended December 31, 2020 and 2019
BALANCE SHEETS The majority of MMWEC’s Balance Sheet consists of the financial activity relating to various Projects, representing ownership interests in various electric generation facilities for which MMWEC has corresponding PSAs with each Project Participant. MMWEC’s joint ownership interests are shown in Note 14 – Project Joint Ownership Agreements in the accompanying notes of the accompanying financial statements. Comparison of 2019 Financial Results to 2018 Financial Results Current assets, excluding the current portions of restricted and designated funds, decreased by $21.9 million. Cash and temporary investments decreased by $14.5 million, largely due to less cash being held in bank accounts and increased cash held in investment accounts, classified as noncurrent designated funds on the balance sheet. The decrease in accounts receivable and unbilled revenue of $10.0 million is chiefly attributable to a lower capacity prices in 2019 than in the prior year and continued depressed energy prices the last quarter of 2019 than in the prior year, reducing outstanding invoice amounts. Inventories increased $960,000 primarily due the lower of cost or market allowance offset by fuel used during 2019 for generation without offsetting replacement purchases for Stony Brook Intermediate and Peaking Projects, and the sale of fuel for Wyman Project. Current and noncurrent restricted special funds, including related interest receivable, decreased by $48.5 million, primarily driven by decreases in Seabrook bond reserves of $44.0 million due to bond retirements in 2019 and pooled loan funds of $4.5 million being used during the year. Other assets increased by $75.4 million from 2018 to 2019, reflecting increases in designated funds ($39.4 million) primarily due to reclassification of investments due to the maturity of outstanding bonds and collections for future Project capital expenditures and maintenance outages, increases in nuclear decommissioning trust funds and pension assets ($28.4 million) due to investment performance and market valuation of assets, which was higher as of December 31, 2019 than in 2018. In addition, lead owner advances increased $900,000 due to actual costs coming in under budgeted billings. Non-current accounts receivable increased $6.7 million due to increased activity in MMWEC’s pooled loan program. In 2019, total capital assets had a net decrease of $1.2 million due primarily to the sale of Wyman and continued depreciation and amortization of $11.2 offset by capital asset additions and construction work in progress reclassifications $10.0 million. Deferred outflows of resources decreased by $4.0 million due to the lower deferrals of losses on pension assets ($1.3 million) and asset retirement obligations ($2.7 million). The $26.3 million decrease in current liabilities, excluding current maturities of long-term debt and accrued interest, was attributable to the refinancing of short-term loans issued through MMWEC’s pooled loan program (net $27.9 million) into fixed long-term debt and decreased accounts payable and accrued expenses ($8.8 million) due to timing of vendor payments, offset by increased advances by Members for Project operating expenses in advance of outages ($10.4 million) considered as current.

Page 7
Massachusetts Municipal Wholesale Electric Company Management’s Discussion and Analysis (unaudited) Years Ended December 31, 2020 and 2019
BALANCE SHEETS…continued Comparison of 2019 Financial Results to 2018 Financial Results…continued Long-term debt, including current maturities and accrued interest, increased by $17.2 million primarily due to issuing long-term debt related to MMWEC’s pooled loan program offset by principal payments made and maturities of long-term debt during 2019. Other noncurrent liabilities, excluding long-term debt, decreased $8.6 million due to the release of asset retirement obligations related to Wyman offset by accretion of asset retirement obligations related to Seabrook and Millstone and decreased member and participant advances classified as long-term on the Balance Sheet. Deferred inflows of resources increased by $16.6 million due to increases in deferred gain on pension assets ($2.9 million), amounts payable under the terms of the PSAs ($13.8 million), which include temporary offsets of unbilled expenses, such as depreciation, unrealized gains/losses, and bond payment activity, offset by continued amortization of deferred gain on extinguishment of debt ($57,000) and decreased pension regulatory credit ($81,000). Comparison of 2020 Financial Results to 2019 Financial Results Current assets, excluding the current portions of restricted and designated funds, including interest, increased by $11.4 million. Cash and temporary investments increased by $16.7 million, largely due to an increase in working capital and power purchase cash. The increase is due to timing of year end purchase power payments and an overall decrease in purchase power expense for the year. In addition, more cash was held in bank accounts and in investment accounts, less cash and investments were classified as noncurrent designated funds on the balance sheet. The decrease in current and long-term accounts receivable and unbilled revenue of $4.8 million is primarily due to reduced power bills at year-end and a decrease in long term accounts receivables related to the Pooled Loan program. Inventories decreased $2.8 million primarily due to market value adjustment for Stony Brook Intermediate fuel. Current and noncurrent restricted special funds, including related interest receivable, decreased by $3.4 million, primarily driven by pooled loan funds being used during the year. Other assets increased by $17.1 million from 2019 to 2020, reflecting increases in nuclear decommissioning trust funds and pension assets ($23.3 million) due to investment performance and market valuation of assets, which was higher as of December 31, 2020 than in 2019. In addition, lead owner advances increased $6.3 million due to actual costs coming in under budgeted billings. This increase is offset by a decrease in Seabrook and Millstone designated funds. Seabrook and Millstone funds previously collected were used toward 2020 outage maintenance. In 2020, total capital assets had a net decrease of $6.8 million due continued depreciation and amortization of $17.6 million offset by capital asset additions and construction work in progress reclassifications $10.8 million.

Page 8
Massachusetts Municipal Wholesale Electric Company Management’s Discussion and Analysis (unaudited) Years Ended December 31, 2020 and 2019
BALANCE SHEETS…continued Comparison of 2020 Financial Results to 2019 Financial Results…continued Deferred outflows of resources increased by $1.3 million due to higher asset retirement obligations due to inflationary changes in estimates ($2.4 million) offset by lower deferrals of losses on pension assets ($1.1 million). The $10.0 million increase in current liabilities, excluding current maturities of long-term debt and accrued interest, was attributable to increases in accounts payable and accrued expenses ($5.8 million) due to timing of vendor payments and increased advances by Members for Project operating expenses in advance of outages ($4.8 million) considered as current. This increase is offset by decreased short term debt ($600,000) due to final payments on Pooled Loan line of credit and the net activity on the power purchase line of credit. Long-term debt, including current maturities and accrued interest, decreased by $3.6 million primarily due to principal payments being made. Other noncurrent liabilities, excluding long-term debt, decreased $1.4 million due to decreased member and participant advances classified as long-term on the Balance Sheet offset by increase in inflationary adjustments of asset retirement obligations related to Seabrook and Millstone. Deferred inflows of resources increased by $11.4 million due to increases in deferred gain on pension assets ($2.3 million), pension regulatory credit ($1.9 million), and amounts payable under the terms of the PSAs ($7.2 million), which include temporary offsets of unbilled expenses, such as depreciation and unrealized gains/losses. STATEMENTS OF REVENUES, EXPENSES AND CHANGES IN NET POSITION The majority of MMWEC’s Statements of Revenues, Expenses and Changes in Net Position consist of the financial activity relating to revenues and expenses from power purchases and the PSAs for the Projects. Project revenues are derived, primarily, from PSAs with Project Participants. Under all PSAs, the Project Participants are required to pay their respective shares of MMWEC’s actual costs relating to the Projects, including debt service. Thus, MMWEC’s revenues for an individual Project are dependent on debt service and the costs associated with that particular Project. Revenues for the individual Projects vary from year to year as the costs MMWEC incurs relating to a Project vary. Comparison of 2019 Financial Results to 2018 Financial Results For 2019, revenue decreased by $36.3 million due to lower capacity and energy prices and lower generation across all Projects, except Seabrook. MMWEC’s share of Wyman in July 2019 and no further revenues were generated. Purchased power expenses decreased by $14.8 million during 2019 as compared to 2018 primarily due to decreases in capacity rates and lower locational marginal pricing, driven by moderate temperatures and reduced demand. The $12.9 million decrease in fuel used in electric generation was driven by decreased generation at Stony Brook Intermediate and Peaking, Millstone, and Wyman due to a milder year in 2019 compared to 2018’s extreme temperatures in early January and early September, offset by increased generation at Seabrook, as Seabrook had an outage in 2018.

Page 9
Massachusetts Municipal Wholesale Electric Company Management’s Discussion and Analysis (unaudited) Years Ended December 31, 2020 and 2019
STATEMENTS OF REVENUES, EXPENSES AND CHANGES IN NET POSITION…continued Comparison of 2019 Financial Results to 2018 Financial Results…continued Other operating expense decreased $832,000 primarily driven by lower lead owner administration costs on Projects in 2019. Maintenance expense decreased $2.7 million from the prior year due to less significant maintenance outage work at Stony Brook and no maintenance outage at Seabrook in 2019, while there was a Seabrook outage in 2018. In 2019, depreciation expense increased $4.1 million, as a result of depreciation from fixed asset additions and asset retirement obligations, offset by retirements during 2019. Taxes other than income were essentially level from 2018 to 2019. Investment income, which is a result of varying fund balances and interest rates, increased by $28.7 million in 2019, primarily due to market gains on decommissioning and pension assets and an overall increased interest rate environment and account balances in the current year as opposed to the prior year. Interest expense increased $609,000 due to interest on additional long-term debt issued in 2019 for the Pooled Loan program, offset by lower interest costs incurred in 2019 than 2018 as a result of reduced short-term debt and nuclear project long-term debt due to scheduled principal payments and maturities. Amortization expense decreased by $183,000 due to continued amortization of premiums and gains associated with various bond issues. On July 17, 2019, MMWEC sold its full ownership interest in Wyman 4, resulting in a gain on the sale of property of $1.0 million. The increase in amounts payable under terms of the PSAs is primarily due to unrealized losses on the decommissioning funds offset by ongoing bond payments made during the period and is discussed in Notes 1 and 7 of the accompanying financial statements. Comparison of 2020 Financial Results to 2019 Financial Results For 2020, revenue decreased by $400,000 due to lower capacity and energy prices and lower generation across all Projects, except Seabrook. Purchased power expenses decreased by $9.9 million during 2020 as compared to 2019 primarily due to decreases in capacity rates and lower locational marginal pricing, driven by moderate temperatures and reduced demand. The $3.8 million increase in fuel used in electric generation was driven by increased generation at Stony Brook Intermediate offset by decreased generation at Seabrook and Millstone, as both had outages in 2020. Other operating expense decreased $190,000 primarily driven by lower lead owner administration and employee pension and benefits costs at Millstone. In addition, there were no operating costs for Wyman verses a half year of costs in 2019. These decreases were offset by an increase in lead owner administration costs at Seabrook. There was also in increase in other operating expenses as Stony Brook related to safety equipment.

Page 10
Massachusetts Municipal Wholesale Electric Company Management’s Discussion and Analysis (unaudited) Years Ended December 31, 2020 and 2019
STATEMENTS OF REVENUES, EXPENSES AND CHANGES IN NET POSITION…continued Comparison of 2020 Financial Results to 2019 Financial Results…continued. Maintenance expense increased $2.8 million from the prior year due to maintenance outage work at Seabrook and Millstone in 2020. This increase was offset by a decrease at Stony Brook. In the prior year, Stony Brook had higher maintenance costs related to the gas turbines and cooling towers. In 2020, depreciation expense increased $910,000, as a result of depreciation from fixed asset additions and asset retirement obligations, offset by retirements during 2020. Taxes other than income were essentially level from 2019 to 2020. Investment income, which is a result of varying fund balances and interest rates, decreased by $8.4 million in 2020, primarily due to decreased interest income and lower unrealized market gains on decommissioning funds. In addition, there was lower interest income on designated and restricted funds. Interest expense was essentially level from 2019 to 2020 Amortization expense was essentially level from 2019 to 2020. On July 17, 2019, MMWEC sold its full ownership interest in Wyman 4, resulting in a gain on the sale of property of $1.0 million. The decrease in amounts payable under terms of the PSAs is primarily due to unrealized losses on the decommissioning funds offset by ongoing bond payments made during the period and is discussed in Notes 1 and 7 of the accompanying financial statements. STATEMENTS OF CASH FLOWS For purposes of the Statements of Cash Flows, cash equivalents are cash and investments having an original maturity of three months or less from the date of acquisition. Cash and cash equivalents decreased by $20.0 million from 2018 to 2019. This is primarily due to principal payments on short term debt. Cash and cash equivalents decreased by $17.0 million from 2019 to 2020. This is primarily due to purchases of investments offset by proceeds from sales and maturities of investments. DEBT SERVICE COVERAGE For the PSAs’ contract years ended June 30, 2019 and June 30, 2018, MMWEC met the GBR debt service coverage requirements for all of MMWEC’s Projects. In accordance with the provisions of MMWEC's GBR, MMWEC covenants that it will fix, revise and collect rates, tolls, rents and other fees and charges sufficient to produce revenues to pay all Project operating and maintenance expenses as well as principal, premium, if any, and interest on the Bonds associated with each Project. Revenues for each Project, which include applicable interest earnings from investments associated with funds required to be maintained by the GBR, are required to equal 1.10 times the annual debt service for the PSA contract year ending June 30, after deduction of certain operating and maintenance expenses and exclusive of depreciation. Further details can be found in the Supplementary Information to the financial statements.

Page 11
Massachusetts Municipal Wholesale Electric Company Management’s Discussion and Analysis (unaudited) Years Ended December 31, 2020 and 2019
MMWEC PROJECT OPERATIONS The following tables provide operating information for the MMWEC Projects for the corresponding years for which financial information and analysis was presented above. See Note 13 – Project Joint Ownership Agreements in the accompanying financial statements for additional information.
MMWEC Project Operations January 1 through December 31, 2020
Stony Brook
Intermediate Stony Brook Peaking Seabrook Millstone 3
Availability 93.99% 94.48% 90.88% 84.35% Capacity Factor 3.17% 0.11% 90.14% 95.50% Generation MWH 86,260 1,516 1,143,660 433,079
The capacity factor represents the percentage of electricity actually produced as compared with potential production.
MMWEC Project Operations January 1 through December 31, 2019, unless otherwise noted
Stony Brook
Intermediate Stony Brook Peaking Seabrook Millstone 3 Wyman
Availability 93.40% 94.84% 100.00% 82.52% 99.04% Capacity Factor 1.47% 0.11% 99.93% 81.15% 0.001% Generation MWH 40,617 1,521 1,264,408 455,649 12
Note: Wyman numbers are reported January 1 through June 30, 2019. CONTACT INFORMATION This financial report is designed to provide a general overview of MMWEC’s finances. Questions or requests for additional information should be addressed to MMWEC Attn: Director of Financial Reporting & Corporate Technology, 327 Moody Street, Ludlow, Massachusetts 01056.

Page 12
Massachusetts Municipal Wholesale Electric CompanyBalance Sheet
December 31, 2020 and 2019
(In Thousands)
2020 2019
ASSETS
Current assets:
Cash and temporary investments 22,716$ 6,008$
Accounts receivable 22,403 21,875
Unbilled revenues 20,009 22,211
Inventories 22,995 25,754
Prepaid expenses 2,254 3,104
Current portion of restricted special funds 33,170 36,549
Interest receivable restricted special funds 55 112
Current portion of designated funds 3,455 5,590
Total current assets 127,057 121,203
Noncurrent assets:
Restricted assets:
Nuclear decommissioning trust 161,491 143,521
Net pension asset 11,105 5,730
Noncurrent charges:
Designated funds 157,464 167,433
Designated funds interest receivable 317 744
Long-term accounts receivable 19,368 22,522
Other noncurrent charges 22,643 16,343
Total noncurrent assets 372,388 356,293
Capital assets:
In service 1,411,137 1,402,151
Accumulated depreciation (916,666) (899,657)
Construction work in progress 21,601 19,763
Nuclear fuel, net of amortization 20,812 21,456
Total capital assets 536,884 543,713
DEFERRED OUTFLOWS OF RESOURCESDeferred loss on pension asset 377 1,541 Deferred asset retirement obligations 80,331 77,915
Total deferred outflows of resources 80,708 79,456
Total assets and deferred outflows of resources 1,117,037$ 1,100,665$
LIABILITIES
Current liabilities:
Accounts payable 13,807$ 7,937$
Member and participant advances 124,226 119,470
Short-term debt 2 620
Accrued expenses 20,694 20,749
Current liabilities payable from restricted assets:
Accrued interest payable 308 398
Current maturities of long-term debt, net of premiums 3,566 3,504
Total current liabilities 162,603 152,678
Noncurrent liabilities:
Long-term debt, net of premiums and current maturities 36,304 39,870
Asset retirement obligations 164,081 159,018
Long-term member and participant advances 88,371 94,870
Total noncurrent liabilities 288,756 293,758
DEFERRED INFLOWS OF RESOURCES
Pension regulatory credit 4,709 2,833
Amounts payable under terms of the power sales agreements 655,112 647,873
Deferred gain on pension asset 5,857 3,523
Total deferred inflows of resources 665,678 654,229
Total liabilities and deferred inflows of resources 1,117,037$ 1,100,665$
The accompanying notes are an integral part of these financial statements.

Page 13
Massachusetts Municipal Wholesale Electric CompanyStatements of Revenues, Expenses and Changes in Net Position
Years Ended December 31, 2020 and 2019
(In Thousands)
2020 2019
Operating revenues:
Revenues 227,889$ 228,328$
Operating expenses:
Fuel used in electric generation 13,686 9,879
Purchased power 148,169 158,053
Other operating 37,465 37,655
Maintenance 13,336 10,512
Depreciation 21,708 20,798
Taxes other than income 3,981 4,146
238,345 241,043
Operating income (loss) (10,456) (12,715)
Non-operating revenues (expenses):
Investment income (loss) 19,271 27,653
Interest expense on long-term debt (1,576) (1,513)
Amortization of premium - 41
Amortization of gain on extinguishment of debt - 57
Gain on sale of property - 1,044
Decrease (Increase) in amounts payable under terms of the
power sales agreements (7,239) (14,567)
Total non-operating revenues (expenses) 10,456 12,715
Change in net position - -
Net position, beginning of year - -
Net position, end of year -$ -$
The accompanying notes are an integral part of these financial statements.

Page 14
Massachusetts Municipal Wholesale Electric CompanyStatements of Cash Flows
Years Ended December 31, 2020 and 2019
(In Thousands)
2020 2019
Cash flows from operating activities:
Received from sales to members and participants 230,873$ 236,046$
Return of sale proceeds to participants - (1,797)
Paid to suppliers for goods and services (192,800) (210,732)
Paid to employees (10,385) (9,802)
Net cash provided by operating activities 27,688 13,715
Cash flows from investing activities:
Purchases of investments (488,266) (345,386)
Proceeds from sales and maturities of investments 470,069 350,039
Investment income (loss) received 3,107 4,957
Net cash provided by (used in) investing activities (15,090) 9,610
Cash flows from capital and related financing activities:
Construction expenditures and purchases of nuclear fuel (22,460) (31,491)
Gain on sale of assets - 1,797
Proceeds from issuance of long-term debt - 26,300
Principal payments on long-term debt (3,504) (8,684)
Decommissioning trust payments (1,322) (1,558)
Interest payments on long-term debt (1,339) (1,001)
Net cash used in capital and related financing activities (28,625) (14,637)
Cash flows from noncapital financing activities:
Proceeds from issuance of short-term debt 3,684 15,115
Principal payments on short-term debt (4,302) (42,971)
Interest payments on short-term debt (327) (819)
Net cash provided by (used in) noncapital financing activities (945) (28,675)
Net change in cash and cash equivalents (16,972) (19,987)
Cash and cash equivalents, beginning of year 53,675 73,662
Cash and cash equivalents, end of year 36,703$ 53,675$
The accompanying notes are an integral part of these financial statements.

Page 15
Massachusetts Municipal Wholesale Electric CompanyStatements of Cash Flows…continued
Years Ended December 31, 2020 and 2019
(In Thousands)
2020 2019
Reconciliation of operating income to net cash provided by
operating activities:
Operating income (10,456)$ (12,715)$
Noncash items included in operating income:
Depreciation 21,708 20,798
Amortization of nuclear fuel and asset retirement obligations 12,644 10,208
Changes in assets and liabilities:
(Increase) decrease in:
Accounts receivable (528) 15,644
Unbilled revenues 2,202 (3,448)
Inventories 2,759 (1,732)
Prepaid expenses 850 (1,700)
Net pension asset (5,375) (4,275)
Long term accounts receivable 3,154 (8,861)
Other deferred charges (6,300) (897)
Increase (decrease) in:
Accounts payable 5,870 (4,959)
Member and participant advances (1,642) 2,635
Accrued expenses (55) (3,860)
Long term member and participant advances (101) (49)
Pension regulatory liability 1,876 (81)
Changes in deferred outflows of resources 509 3,772
Changes in deferred inflows of resources 573 3,235 Net cash provided by operating activities 27,688$ 13,715$
Reconciliation of cash and cash equivalents to the statement of net position:
Cash and temporary investments 22,716$ 6,008$
Total restricted and designated funds 194,089 209,572
Total cash and investments 216,805 215,580
Less - investments included in restricted and designated funds
and decommissioning trust (180,102) (161,905)
Total cash and cash equivalents 36,703$ 53,675$
Supplemental disclosures of cash flow information:
Noncash investing, capital and financing transactions:
Amortization of debt premiums -$ 41$
Amortization of gain on extinguishment of debt -$ 57$
The accompanying notes are an integral part of these financial statements.

Page 16
Massachusetts Municipal Wholesale Electric CompanyFiduciary Financial Statements
December 31, 2020 and 2019
(In Thousands)
STATEMENTS OF FIDUCIARY NET POSITION2020 2019
ASSETSInvestments at fair value:
Mutual funds 30,592$ 29,026$ Guaranteed income funds 1,326 988
Total investments 31,918 30,014
Net position available for pension benefits 31,918$ 30,014$
STATEMENTS OF CHANGES IN FIDUCIARY NET POSITION2020 2019
ADDITIONSEmployer contributions 495$ 750$
Investment activity:Interest and dividends 28 29 Net depreciation in fair value of investments 5,788 6,570
Total investment activity 5,816 6,599
Total additions 6,311 7,349
DEDUCTIONSBenefits paid directly to participants 4,387 2,182 Administrative expenses 20 20
4,407 2,202
Total deductions 4,407 2,202
Net increase (decrease) in net position 1,904 5,147
Net position available for pension benefits, beginning of year 30,014 24,867
Net position available for pension benefits, end of year 31,918$ 30,014$
The accompanying notes are an integral part of these financial statements.

Page 17
Massachusetts Municipal Wholesale Electric Company Notes to Financial Statements Years Ended December 31, 2020 and 2019
1. SUMMARY OF SIGNIFICANT ACCOUNTING POLICIES AND NATURE OF OPERATIONS
Reporting Entity/Nature of Business The Massachusetts Municipal Wholesale Electric Company (MMWEC) is a public corporation and a political subdivision of the Commonwealth of Massachusetts formed to be a joint action agency to develop a bulk power supply for its member Massachusetts cities and towns having municipal electric systems (Members) and other utilities, both public and private. Among other things, MMWEC is authorized to construct, own, or purchase ownership interests in energy facilities and to issue revenue bonds for such purposes. MMWEC’s ownership interests in energy generation facilities are through various Projects (Note 14 – Project Joint Ownership Agreements). Pursuant to its General Bond Resolution (GBR), the bonds of any bond issue relating to a Project are secured solely by revenues derived from that Project. Project revenues are derived primarily from Power Sales Agreements (PSAs) with MMWEC’s Members and other utilities who are Participants in a Project (Project Participants). MMWEC’s bulk power supply program consists of power purchase arrangements, power brokering services, planning and financial services, and the Projects relating to generating facilities built and operated either by MMWEC or other entities. A Massachusetts city or town having a municipal electric system, authorized by majority vote of the city or town, may become a Member of MMWEC by applying for admission and agreeing to comply with the terms and conditions of membership as MMWEC By-Laws may require. As of December 31, 2020 and 2019, twenty (20) Massachusetts cities and towns having municipal electric systems were Members. MMWEC has determined it has a fiduciary responsibility over two defined benefit pension plans that are provided to its employees. The financial statement presentation includes business-type activities and the fiduciary fund financial statements for the defined benefit pension plans. Measurement Focus, Basis of Accounting and Financial Statement Presentation The accounting records of MMWEC are maintained using the Governmental Accounting Standards Board (GASB), the Uniform System of Accounts of the Federal Energy Regulatory Commission (FERC) and the Generally Accepted Accounting Principles of the United States of America (GAAP) using the economic resources measurement focus and the accrual basis of accounting. Application of the accounting methods for regulatory operations is also included in these financial statements. This accounting guidance relates to the deferral of revenues and expenses to future periods in which the revenues are earned or the expenses are recovered through the rate-making process, which is governed by the Board of Directors. Assets, Deferred Outflows of Resources, Liabilities and Deferred Inflows of Resources
Cash and Investments For purposes of the Statements of Cash Flows, cash equivalents are cash and investments having an original maturity of three months or less from the date of acquisition. Unrestricted cash and cash equivalents are presented within cash and temporary investments in the accompanying Balance Sheets. Restricted cash and cash equivalents are presented within the current or long-term portion of restricted special funds in the accompanying Balance Sheets. Decommissioning Trust investments are excluded from the cash equivalents on the Statement of Cash Flows.

Page 18
Massachusetts Municipal Wholesale Electric Company Notes to Financial Statements Years Ended December 31, 2020 and 2019
1. SUMMARY OF SIGNIFICANT ACCOUNTING POLICIES AND NATURE OF
OPERATIONS...continued Assets, Deferred Outflows of Resources, Liabilities and Deferred Inflows of Resources …continued
Cash and Investments…continued MMWEC has adopted an investment policy, which is approved annually by MMWEC’s Board of Directors as required by MMWEC’s GBR. Although certain cash and temporary investment amounts used for power purchases and working capital requirements of MMWEC are not subject to the provisions of the GBR, they are subject to the provisions of the investment policy. Investments are stated at fair value, as defined under fair value measurements above. No investments are reported at amortized cost. Adjustments necessary to record investments at fair value are recorded in the Statements of Revenues, Expenses and Changes in Net Position as increases or decreases in investment income. Through its investment policy, MMWEC is restricted to investing in certain types of securities and investments, which are:
a. Direct obligations of the United States of America b. Bonds, debentures, notes or other indebtedness issued
by various federal agencies c. New housing authority bonds issued by public agencies or municipalities d. Bonds or notes issued by states and municipalities that are rated
in one of the two highest rated categories by rating agencies e. Bank time deposits f. Repurchase agreements g. Federal funds or bankers acceptances h. Investment agreements
Accounts Receivable Accounts receivable are stated at the amount management expects to collect from outstanding balances. Based on the validity of contracts and collection history, an allowance for doubtful accounts is not considered necessary. Should these circumstances change, an allowance for doubtful accounts would be provided for those accounts receivable considered to be uncollectible at the end of the year, and the bad debts would be written off against the allowance when identified. Other accounts receivable are considered long-term, as of December 31, 2020 and 2019, long-term accounts receivable were $19.4 million and $22.5 million, respectively. Unbilled Revenue Unbilled revenues are revenues that are not yet billed under the MMWEC Member and Participant agreements and other power arrangements and represent a portion of December services rendered that are collectible in January of the subsequent year. Prepaid Expenses Prepaid expenses represent insurance premiums, property taxes, payment in lieu of taxes and other similar contracts and arrangements paid in the current fiscal year benefiting future periods.

Page 19
Massachusetts Municipal Wholesale Electric Company Notes to Financial Statements Years Ended December 31, 2020 and 2019
1. SUMMARY OF SIGNIFICANT ACCOUNTING POLICIES AND NATURE OF
OPERATIONS…continued
Assets, Deferred Outflows of Resources, Liabilities and Deferred Inflows of Resources …continued Inventories Fuel oil and spare parts inventories are valued at the lower of cost or market and recorded and accounted for by the average cost method. At December 31, 2020 and 2019, total fuel oil inventory was at $8.3 million and $11.3 million, respectively, and spare parts inventory amounted to $14.7 million and $14.5 million, respectively.
Adjustments resulting from valuation of inventory are operating costs charged to fuels used in electric generation on the accompanying Statements of Revenues, Expenses and Changes in Net Position. Restricted Funds MMWEC’s practice is to use restricted funds on hand before using unrestricted funds when an expense is incurred for purposes for which both restricted and unrestricted funds are available.
Nuclear Decommissioning Trust
As required by the Nuclear Regulatory Commission (NRC) and respective state statutes and/or regulations, as well as MMWEC’s own determinations, MMWEC has funded trust funds maintained by external trustees to provide for the estimated future decommissioning activities of Millstone Unit 3 and Seabrook Station. The balances at December 31, 2020 and 2019 for Millstone Unit 3 were $66.0 million and $57.9 million, respectively, and for Seabrook Station were of $95.5 million and $85.7 million, respectively, and are stated at fair value and are included in restricted assets and amounts recoverable (payable) under terms of the PSAs on the Balance Sheets. Decommissioning balances for the Seabrook Station include funds in the New Hampshire Nuclear Decommissioning Trust and in an escrow account into which payments are made by MMWEC as a funding assurance mechanism. Depending on future circumstances, the funds held in the escrow account will be placed either in the Decommissioning Trust Fund for Seabrook Station, or will be returned to MMWEC, per order of the Nuclear Decommissioning Financing Committee of the State of New Hampshire.
Net Pension Asset
The Massachusetts Municipal Wholesale Electric Company Pension Plans (Plans) are two single-employer, defined benefit pension plans administered by MMWEC. One plan covers union employees (Union Plan) and the other plan covers non-union employees (Administration Plan). All full-time active administration employees hired before December 1, 2006, and all full-time active union employees hired before January 1, 2008 are covered by their respective plans. At December 31, 2020 and 2019, the net pension asset was $11.1 million and $5.7 million, respectively. The calculation and related assumptions of the net pension asset and terms of the Plans are discussed in Note 13 – Benefit Plans. Designated Funds Designated funds are held by MMWEC for a specific internal use.

Page 20
Massachusetts Municipal Wholesale Electric Company Notes to Financial Statements Years Ended December 31, 2020 and 2019
1. SUMMARY OF SIGNIFICANT ACCOUNTING POLICIES AND NATURE OF
OPERATIONS…continued Assets, Deferred Outflows of Resources, Liabilities and Deferred Inflows of Resources …continued
Other Noncurrent Charges MMWEC advances both Millstone Unit 3 and Seabrook Station operating and capital expenditures based on budgeted levels. These advances are reduced when actual expenditures are incurred. At December 31, 2020 and 2019 these advances totaled $21.7 million and $15.8 million, respectively and are included in other noncurrent charges on the Balance Sheets. The remaining balance of noncurrent charges is primarily comprised of MMWEC’s equity investment in Hydro-Quebec Phase II interconnection as described in Note 16 - Contracts and Commitments. Capital Assets – In Service Capital assets – in service are generally defined by MMWEC as assets with an initial, individual cost of more than $1,000 and an estimated useful life in excess of one year. Capital assets of MMWEC are recorded at cost at the date of acquisition. MMWEC capitalizes interest as an element of the cost of electric plant and nuclear fuel in process. The amount of interest capitalized is based on the cost of debt, including amortization of premiums, related to each Project, net of investment gains and losses, and interest income derived from unexpended restricted special funds. MMWEC capitalized no interest costs for the years ended December 31, 2020 and 2019, respectively. Provisions for depreciation are computed using the straight-line method based on estimated useful lives for the underlying assets at Stony Brook and the administrative and general office on MMWEC’s site (Service). Seabrook Station, Millstone and Wyman are depreciated based on the group life basis. The lives are as follows:
Stony Brook Building 25 years Building improvements 20 years Equipment 20-30 years Computer equipment and vehicles 3-4 years Service Office equipment and software 3-8 years Other Generation Facilities Seabrook Station 60 years Millstone Unit 3 60 years W.F. Wyman No. 4 51 years
On March 12, 2019, NextEra Energy Seabrook, LLC, the lead owner of Seabrook Station, received approval from the Nuclear Regulatory Commission to extend Seabrook Station’s operating license for an additional 20 years to 2050.

Page 21
Massachusetts Municipal Wholesale Electric Company Notes to Financial Statements Years Ended December 31, 2020 and 2019
1. SUMMARY OF SIGNIFICANT ACCOUNTING POLICIES AND NATURE OF
OPERATIONS…continued Assets, Deferred Outflows of Resources, Liabilities and Deferred Inflows of Resources …continued
Construction Work in Progress Construction work in progress is stated at cost. Any internal costs that are capitalized are limited to those costs that can be directly identified with the design, engineering or construction of a specific Project and do not include any costs related to production, general corporate overhead or similar activities. Depreciation of these costs will commence once placed in service. Nuclear Fuel Nuclear fuel, net of amortization, includes MMWEC's ownership interest in spent nuclear fuel, fuel in reactor, in stock and in process for both Millstone Unit 3 and Seabrook Station. The cost of nuclear fuel is amortized to fuel used in electric generation for each nuclear unit based on the relationship of energy produced in the current period to total expected energy production for fuel in the reactor. Fuel amortization expense of $8.2 million as of December 31, 2020 and $9.5 million as of December 31, 2019, respectively, is included in operating expense on the accompanying Statements of Revenues, Expenses and Changes in Net Position. MMWEC, along with all of the other joint owners of both Millstone Unit 3 and Seabrook Station, has filed claims against the U.S. Department of Energy (DOE) in the United States Court of Claims for partial breach of the provisions for fuel disposal costs that were previously assessed by the DOE under the Energy Policy Act of 1992, for the cost of decontamination and decommissioning of uranium enrichment plants operated by the DOE. As the DOE has agreed in principle to settlements in regard to ongoing costs incurred related to the disposal contracts, accounts receivable related to these ongoing cost settlements have been recorded at December 31, 2020 and 2019 in the amount of $332,000 and $183,000, respectively. During 2019, $762,000 was refunded to MMWEC for costs incurred related to spent fuel facilities and disposal. In 2020, $1.6 million was refunded to MMWEC for costs incurred related to spent fuel facilities and disposal. Deferred Outflows of Resources Deferred outflows of resources are comprised of pension-related amounts and asset retirement obligations.
Accounts Payable and Accrued Expenses At December 31, 2020, accounts payable and accrued liabilities total $34.8 million which include $13.8 million related to standard operating supplier and vendor accounts payable; $16.3 million for power purchase accruals; $308,000 for accrued interest on long term debt; and $4.4 million for other miscellaneous accounts payable and accrued liabilities.

Page 22
Massachusetts Municipal Wholesale Electric Company Notes to Financial Statements Years Ended December 31, 2020 and 2019
1. SUMMARY OF SIGNIFICANT ACCOUNTING POLICIES AND NATURE OF
OPERATIONS…continued Assets, Deferred Outflows of Resources, Liabilities and Deferred Inflows of Resources …continued
Accounts Payable and Accrued Expenses…continued At December 31, 2019, accounts payable and accrued liabilities total $29.1 million which include $7.9 million related to standard operating supplier and vendor accounts payable; $17.7 million for power purchase accruals; $398,000 for accrued interest on long term debt; and $3.1 million for other miscellaneous accounts payable and accrued liabilities. Member and Participant Advances and Reserves MMWEC maintains numerous operating reserves and advances from its Members and Project Participants in accordance with the PSAs, Power Purchase Agreements (PPAs) and other contractual arrangements. Member and Participant advances that are considered current liabilities were $124.2 million and $119.5 million for the years ended December 31, 2020 and 2019, respectively. Other Member and Participant reserves for 2020 and 2019, which are considered long-term, were $88.4 million and $94.9 million, respectively. A reconciliation of the beginning and ending aggregate carrying amount of long-term Member and Participant Advances for the years ended December 31, 2020 and 2019 is as follows:
2020 2019
Long-term member and participant advances, beginning of year 94,870$ 102,642$
Additions 37 352
Deletions (6,536) (8,124)
Long-term member and participant advances, end of year 88,371$ 94,870$
(In Thousands)
Asset Retirement Obligations MMWEC identified certain asset retirement obligations (AROs), which are primarily associated with the decommissioning of MMWEC’s ownership interest in Millstone Unit 3 and Seabrook Station. The recognition of the AROs at current value also results in a corresponding deferred outflow of resources, which is amortized over the remaining useful life of the underlying asset. Amortization expense is included in depreciation expenses in the Statements of Revenues, Expenses and Changes in Net Position. Long-term Obligations
Long-term debt and other obligations are reported as noncurrent liabilities. Bond premiums are amortized over the life of the bonds using the effective interest method. The balance at year end for premiums is shown as an increase to long-term debt in the liability section of the accompanying Balance Sheets.

Page 23
Massachusetts Municipal Wholesale Electric Company Notes to Financial Statements Years Ended December 31, 2020 and 2019
1. SUMMARY OF SIGNIFICANT ACCOUNTING POLICIES AND NATURE OF OPERATIONS…continued
Assets, Deferred Outflows of Resources, Liabilities and Deferred Inflows of Resources …continued
Deferred Inflows of Resources
Deferred inflows of resources are comprised of pension-related amounts. Amounts Payable Under Terms of the Power Sales Agreements Billings to Project Participants are structured to recover costs in accordance with the PSAs, which generally provide for billing debt service, operating expenses and reserve requirements. Expenses are reflected in the Statements of Revenues, Expenses and Changes in Net Position in accordance with GAAP. The timing difference between amounts billed and expensed is charged, or credited, to amounts recoverable (payable) under terms of the PSAs. The principal differences include depreciation, fuel amortization, costs associated with canceled Projects (or assets abandoned within a Project), asset retirement obligations, cost of refinancing, billing for certain interest, reserves, net unrealized gains or losses on investments and other costs. In accordance with the PSAs, these amounts have been offset in amounts payable under terms of the PSAs on the Balance Sheets. The December 31, 2020 and 2019 amounts payable balances of $655.1 million and $647.9 million, respectively, reflect the Statements of Revenues, Expenses and Changes in Net Position net increase of $7.2 million and net increase of $14.6 million for the years then ended.
Revenues and Expenses Revenues Operating revenues include electric sales for resale provided through MMWEC’s bulk power supply program. Revenues consist, in significant part, of billings under the PSAs, PPAs, and other power arrangements, net of debt service refunds to participants. MMWEC also records service revenues by providing its Members with power supply planning and related services, which are billed pursuant to the MMWEC Service Agreement or the All-Requirements Bulk Power Sales Agreement. Revenues related to financing and other activities are reflected as non-operating. Revenues are comprised of the following:
2020 2019
Electric sales for resale 220,516$ 220,369$
Service and other 7,373 7,959
227,889$ 228,328$
(In Thousands)

Page 24
Massachusetts Municipal Wholesale Electric Company Notes to Financial Statements Years Ended December 31, 2020 and 2019
1. SUMMARY OF SIGNIFICANT ACCOUNTING POLICIES AND NATURE OF
OPERATIONS…continued
Revenues and Expenses Taxes Chapter 775 of the Massachusetts Acts of 1975 (the Act) specifically exempts MMWEC from paying any taxes upon its income, existence or franchise, and any revenues from the transfer or sale of bonds issued by MMWEC. Chapter 775 exempts real and personal property situated within the Commonwealth from property taxation. However, the Act requires MMWEC to pay an amount in lieu of property taxes with respect to MMWEC assets in Massachusetts to any governmental body authorized to levy local taxes in Massachusetts. MMWEC pays an amount in lieu of property taxes for its interest in the Stony Brook Peaking and Intermediate fossil-fuel burning plants located in Ludlow, Massachusetts. MMWEC pays property taxes for its ownership interest in Millstone Unit 3 located in Waterford, Connecticut, and Seabrook Station, which is mostly located in Seabrook, New Hampshire.
Gain on sale of property On July 17, 2019, MMWEC sold its full ownership interest in Wyman 4, resulting in a gain on the sale of property of $1.0 million. The gain on the sale was recorded against MMWEC’s amounts payable under terms of the power sales agreements. MMWEC made the gross sale proceeds available to the Wyman 4 Project Participants for distribution through checks or billing credits, resulting in a reduction of amounts payable under terms of the power sales agreement. As a result of the sale, MMWEC ceased accounting for operating activity of Wyman 4 after June 30, 2019. MMWEC maintains cash and investments for Wyman that were previously collected from Wyman Participants for operating reserves and working capital. MMWEC will distribute the remaining cash and investments to the Wyman Participants once the potential for claims from the seller has expired.
Use of Estimates The preparation of financial statements in conformity with U.S. GAAP requires management to make estimates and assumptions that affect the amounts reported in the financial statements and accompanying notes, and disclosure of contingent liabilities at the date of the financial statements. Estimates are used for, but not limited to, the selection of the useful lives of capital assets, provision necessary for contingent liabilities, accrued expenses, asset retirement obligations and other similar charges. Management believes that the estimates utilized in preparing its financial statements are reasonable and prudent. Actual results could differ from these estimates. Comparative Data Certain prior year data has been reclassified to conform to the current year’s presentation with no impact on Net Position.

Page 25
Massachusetts Municipal Wholesale Electric Company Notes to Financial Statements Years Ended December 31, 2020 and 2019
1. SUMMARY OF SIGNIFICANT ACCOUNTING POLICIES AND NATURE OF
OPERATIONS…continued Effect of Future Accounting Standards on Current Period Financial Statements
GASB has approved Statement No. 87, Leases, Statement No. 89, Accounting for Interest Cost Incurred before the End of a Construction Period, Statement No. 91, Debt Conduit Obligations, Statement No. 92, Omnibus 2020, Statement No. 93, Replacement of Interbank Offered Rates, Statement No. 94, Public-Private and Public-Public Partnerships and Availability Payment Arrangements, Statement No. 96, Subscription-Based Information Technology Arrangements, and Statement No. 97, Certain Component Unit Criteria, and Accounting and Financial Reporting for Internal Revenue Code Section 457 Deferred Compensation Plans. When they become effective, application of these standards may restate portions of these financial statements.
Page 26
Massachusetts Municipal Wholesale Electric Company Notes to Financial Statements Years Ended December 31, 2020 and 2019
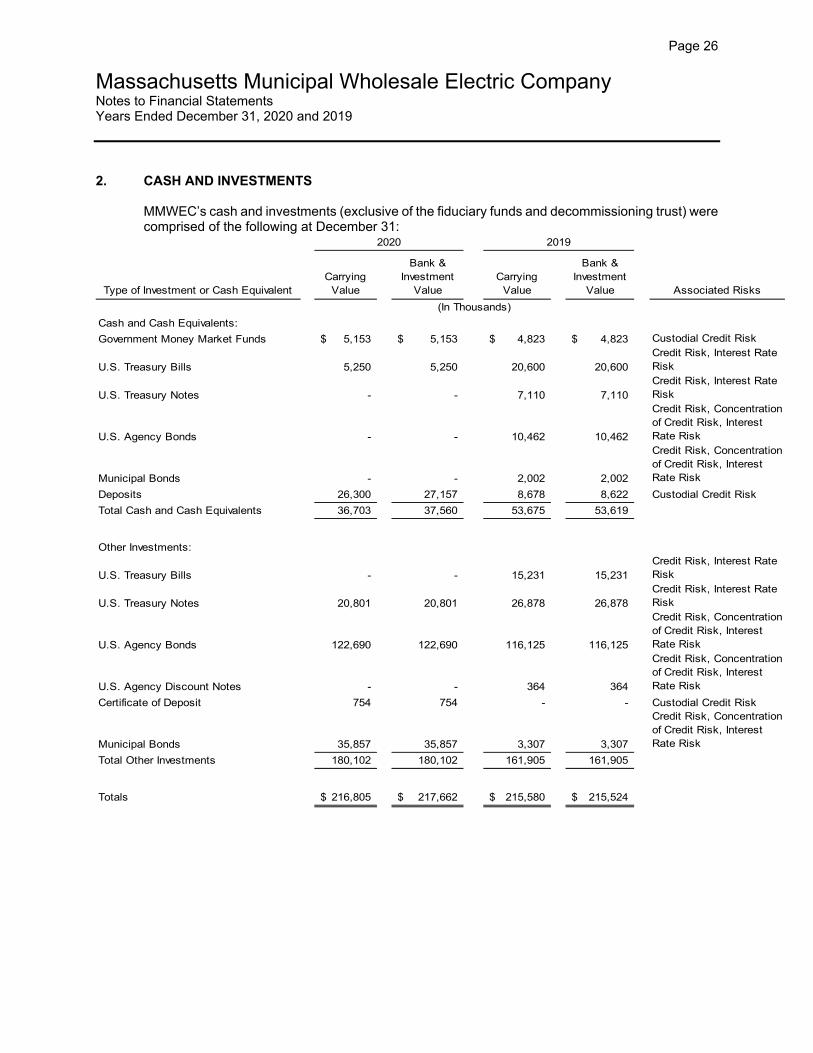
2. CASH AND INVESTMENTS
MMWEC’s cash and investments (exclusive of the fiduciary funds and decommissioning trust) were comprised of the following at December 31:
Type of Investment or Cash EquivalentCarrying
Value
Bank & Investment
Value Carrying
Value
Bank & Investment
Value Associated Risks
Cash and Cash Equivalents:
Government Money Market Funds 5,153$ 5,153$ 4,823$ 4,823$ Custodial Credit Risk
U.S. Treasury Bills 5,250 5,250 20,600 20,600 Credit Risk, Interest Rate Risk
U.S. Treasury Notes - - 7,110 7,110 Credit Risk, Interest Rate Risk
U.S. Agency Bonds - - 10,462 10,462
Credit Risk, Concentration of Credit Risk, Interest Rate Risk
Municipal Bonds - - 2,002 2,002
Credit Risk, Concentration of Credit Risk, Interest Rate Risk
Deposits 26,300 27,157 8,678 8,622 Custodial Credit Risk
Total Cash and Cash Equivalents 36,703 37,560 53,675 53,619
Other Investments:
U.S. Treasury Bills - - 15,231 15,231 Credit Risk, Interest Rate Risk
U.S. Treasury Notes 20,801 20,801 26,878 26,878 Credit Risk, Interest Rate Risk
U.S. Agency Bonds 122,690 122,690 116,125 116,125
Credit Risk, Concentration of Credit Risk, Interest Rate Risk
U.S. Agency Discount Notes - - 364 364
Credit Risk, Concentration of Credit Risk, Interest Rate Risk
Certificate of Deposit 754 754 - - Custodial Credit Risk
Municipal Bonds 35,857 35,857 3,307 3,307
Credit Risk, Concentration of Credit Risk, Interest Rate Risk
Total Other Investments 180,102 180,102 161,905 161,905
Totals 216,805$ 217,662$ 215,580$ 215,524$
(In Thousands)
2020 2019

Page 27
Massachusetts Municipal Wholesale Electric Company Notes to Financial Statements Years Ended December 31, 2020 and 2019
2. CASH AND INVESTMENTS…continued
MMWEC’s investments in the Decommissioning Trust are held by independent trustees. Investments are limited to those defined by the investment policy, and are comprised of the following at December 31:
Type of Investment or Cash EquivalentCarrying
Value
Bank & Investment
ValueCarrying
Value
Bank & Investment
Value Associated Risks
Cash and Cash Equivalents:
Money Market Fund 14,173$ 14,173$ 15,507$ 15,507$ Custodial Credit Risk
Total Cash and Cash Equivalents 14,173 14,173 15,507 15,507
Other Investments:
Mutual Funds - equity 69,091 69,091 59,090 59,090 Credit Risk, Concentration of Credit Risk
FPL Minority Owner Trust 34,906 34,906 32,610 32,610 Credit Risk, Interest Rate Risk,
Common stock - equities 16,851 16,851 14,224 14,224
Concentration of Credit Risk, Credit Risk, Concentration of Credit Risk
US Treasury securities 7,951 7,951 6,872 6,872 Credit Risk, Interest Rate Risk, Concentration of Credit Risk
Corporate Bonds 12,156 12,156 10,163 10,163 Credit Risk, Interest Rate Risk, Concentration of Credit Risk
US Agency Securities 4,303 4,303 3,659 3,659 Credit Risk, Interest Rate Risk, Concentration of Credit Risk
Municipal Bonds 1,332 1,332 1,172 1,172 Credit Risk, Interest Rate Risk, Concentration of Credit Risk
Mutual Funds - fixed 728 728 224 224 Credit Risk, Concentration of Credit Risk
Total Other Investments 147,318 147,318 128,014 128,014
Totals 161,491$ 161,491$ 143,521$ 143,521$
2020 2019
(In Thousands)

Page 28
Massachusetts Municipal Wholesale Electric Company Notes to Financial Statements Years Ended December 31, 2020 and 2019
2. CASH AND INVESTMENTS…continued
MMWEC’s investments in the defined benefit pension plans fiduciary funds are held by an independent trustee. Investments are limited to those defined by the investment policy, and are comprised of the following at December 31:
Type of Investment or Cash Equivalent
Carrying Value
Bank & Investment
ValueCarrying
Value
Bank & Investment
Value Associated Risks
Other Investments:
Mutual Funds - equity 27,582$ 27,582$ 25,909$ 25,909$ Credit Risk, Concentration of Credit Risk
Mutual Funds - bonds 3,009 3,009 3,118 3,118 Credit Risk, Interest Rate Risk, Concentration of Credit Risk
Guaranteed Income Account 1,327 1,327 988 988 Credit Risk, Concentration of Credit Risk
Total Other Investments 31,918$ 31,918$ 30,015$ 30,015$
(In Thousands)
2020 2019
Investments are stated at fair value, which is the amount at which an investment could be exchanged in a current transaction between willing parties. Fair values are based on methods and inputs as outlined below. No investments are reported at amortized cost. The difference between the bank and investment value and carrying value is due to outstanding checks and/or deposits in transit. MMWEC Custodial Credit Risk
Deposits and Money Market Funds Custodial credit risk is the risk that, in the event of a financial institution failure, MMWEC’s deposits may not be returned to MMWEC. The aggregate amount of noninterest bearing and interest bearing accounts are insured by the FDIC up to at least $250,000. There was $32.8 million and $13.2 million uninsured and uncollateralized bank balances subject to custodial credit risk at December 31, 2020 and 2019, respectively. There was $13.4 million and $14.8 million uninsured and uncollateralized decommissioning trust balances subject to custodial credit risk at December 31, 2020 and 2019, respectively. MMWEC’s investment policy and decommissioning trust investment policy do not address custodial credit risk. Investments For an investment, custodial credit risk is the risk that, in the event of the failure of the counterparty, MMWEC will not be able to recover the value of its investment or collateral securities that are in the possession of the custodians. At December 31, 2020 and 2019, all investments were held in MMWEC's name by custodians consisting of the Bond Fund Trustee (as defined in the GBR), or MMWEC's depository bank.

Page 29
Massachusetts Municipal Wholesale Electric Company Notes to Financial Statements Years Ended December 31, 2020 and 2019
2. CASH AND INVESTMENTS…continued
Credit Risk Credit risk is the risk that an issuer or other counterparty to an investment will not fulfill its obligations. As of December 31, MMWEC's investments were rated as follows:
Investments Type 2020 2019 Credit Rating
U.S. Agency 122,690$ 126,951$ AAA - AA+
Municipal Bonds 35,857 5,309 AAA - AA-
U.S. Treasuries 26,051 69,819 NR
Totals 184,598$ 202,079$
Fair Value
(In Thousands)
MMWEC’s investment policy addresses credit risk by defining allowable investments and a maximum allocation to each asset class. Concentration of Credit Risk Concentration of credit risk is the risk of loss attributed to the magnitude of MMWEC’s investment in a single issuer.
At December 31, 2020 and 2019, MMWEC's investment portfolio, excluding decommissioning trust and fiduciary funds, was concentrated as follows:
Percentage of Portfolio
Issuer Investment Type 2020 2019
Federal National Mortgage Assn. U.S. Agency Securities 0.00% 10.60%
Federal Farm Credit Bank U.S. Agency Securities 41.79% 12.76%
Federal Home Loan Bank U.S. Agency Securities 1.77% 25.48%
Federal Home Loan Mortgage U.S. Agency Securities
13.03%
9.83%
MMWEC’s investment policy minimizes concentration of credit risk in a single issuer by diversification of investment types using the following maximum limits, which are established for MMWEC’s total portfolio at December 31, 2020 and 2019, as follows: Repurchase Agreements 10% Certificates of Deposits 10% U.S. Treasury Securities 100% U.S. Agencies 65% Municipal Securities 20%

Page 30
Massachusetts Municipal Wholesale Electric Company Notes to Financial Statements Years Ended December 31, 2020 and 2019
2. CASH AND INVESTMENTS…continued
Concentration of Credit Risk…continued Deviation from the approved portfolio limits requires written authorization and approval from the MMWEC Board of Directors. Interest Rate Risk Interest rate risk is the risk that changes in interest rates will adversely affect the fair value of an investment. At December 31, 2020, the maturities of MMWEC’s investments were as follows:
Investment Type Fair Value Less than 1 1 – 5 Over 5
U.S. Treasury Securities 26,051 5,250$ 16,825$ 3,976$
U.S. Agency Securities 122,690 30,622 91,863 205
Municipal Bonds 35,857 755 19,900 15,202
Totals 184,598$ 36,627$ 128,588$ 19,383$
Maturity In Years
(In Thousands)
At December 31, 2019, the maturities of MMWEC’s investments were as follows:
Investment Type Fair Value Less than 1 1 – 5 Over 5
U.S. Treasury Securities 69,819$ 67,698$ 1,700$ 421$
U.S. Agency Securities 126,951 50,165 68,270 8,516
Municipal Bonds 5,309 5,309 - -
Totals 202,079$ 123,172$ 69,970$ 8,937$
Maturity In Years
(In Thousands)
MMWEC’s investment policy specifies that MMWEC shall seek to maximize the return on investments consistent with requirements for safety, minimization of risk and liquidity. Monies will not be invested for terms in excess of the projected use of funds nor exceed an average life of ten years.

Page 31
Massachusetts Municipal Wholesale Electric Company Notes to Financial Statements Years Ended December 31, 2020 and 2019
2. CASH AND INVESTMENTS…continued
Decommissioning Trust - Credit Risk, Interest Rate Risk and Concentration of Credit Risk As of December 31, 2020, MMWEC's decommissioning trust investments were rated as follows:
Investment Type Credit Rating Fair Value Less than 1 1 – 5 Over 5
U.S. Treasuries n/a 7,952$ 228$ 5,090$ 2,634$
Corporate Bonds AAA - BBB-, n/a 12,156 394 5,350 6,412
U.S. Agency Securities AAA, n/a 4,303 - 21 4,282
Municipal Bonds AAA - A-, n/a 1,332 - 194 1,138
Totals 25,743$ 622$ 10,655$ 14,466$
(In Thousands)
Maturity In Years
As of December 31, 2019, MMWEC's decommissioning trust investments were rated as follows:
Investment Type Credit Rating Fair Value Less than 1 1 – 5 Over 5
U.S. Treasuries n/a 6,872$ 1,326$ 3,372$ 2,174$
Corporate Bonds AAA - BBB, n/a 10,163 645 4,954 4,564
U.S. Agency Securities AAA, n/a 3,658 - 34 3,624
Municipal Bonds AA+ - A-, n/a 1,172 66 188 918
Totals 21,865$ 2,037$ 8,548$ 11,280$
(In Thousands)
Maturity In Years
Investments held in mutual funds and common stock are not rated and do not have a specified maturity date. MMWEC’s decommissioning trust investment policy does not address credit risk or interest rate risk. In accordance with the investment policy for the decommissioning trust, exposure to concentration of credit risk is managed through diversification by limiting investments to no more than 5% of the total portfolio’s value in one single issuer, with the exception of fixed income permissible direct investments listed below: Foreign Securities 10% Mortgage-backed Securities 25% Individual Corporate Sector 20% Fiduciary Funds - Credit Risk, Interest Rate Risk and Concentration of Credit Risk MMWEC’s investments in the defined benefit pension fiduciary funds were rated as follows at December 31:
Investment Type 2020 2019Credit Rating
Maturity Date
Mutual Funds - bonds 3,009$ 3,118$ BBB Less than 1 year
Fair Value
(In Thousands)

Page 32
Massachusetts Municipal Wholesale Electric Company Notes to Financial Statements Years Ended December 31, 2020 and 2019
2. CASH AND INVESTMENTS…continued
Investments held in equity mutual funds and guaranteed income account are not rated and do not have a specified maturity date. MMWEC’s fiduciary fund investment policy does not address credit risk or interest rate risk. In accordance with the investment guidelines for the defined benefit pension fiduciary funds, assets should be invested to provide a rate of return sufficient to meet the investment assumptions inherent in the actuarial projection for the plans. Investment Income For the year ended December 31, 2020, net unrealized gains on investments totaled $13.0 million. For the year ended December 31, 2019, net unrealized gains on investments totaled $16.7 million. The net unrealized losses and gains are excluded from operating revenue and are reported within investment income on the Statements of Revenues, Expenses and Changes in Net Position.
During the years ended December 31, 2020 and 2019, investment income (loss) consisted of interest income, realized gains/(losses) and unrealized gains/(losses) for investments, including the decommissioning trusts, as follows:
2020 2019
Interest income:
Unrestricted funds 945$ 1,207$
Restricted funds 282 1,491
Designated funds 859 2,089
Decommissioning funds 4,168 6,269
Total interest income 6,254 11,056
Realized gains (losses):
Unrestricted funds (67) (33)
Restricted funds 47 (83)
Designated funds 47 (6)
Decommissioning funds - -
Net realized gains 27 (122)
Unrealized gains (losses):
Restricted funds 67 76
Designated funds 443 390
Decommissioning funds 12,480 16,253
Net unrealized gains 12,990 16,719
Total investment income (loss) 19,271$ 27,653$
(In Thousands)

Page 33
Massachusetts Municipal Wholesale Electric Company Notes to Financial Statements Years Ended December 31, 2020 and 2019
3. RESTRICTED AND DESIGNATED ASSETS
Mandatory segregations of assets are presented as restricted funds. Such segregations are required by bond agreements and other external parties. Segregations of assets determined internally by MMWEC management are presented as designated funds.
Numerous restricted funds are required by the GBR pursuant to which MMWEC issued its long-term debt. The restricted funds are invested in accordance with the provisions of the GBR. Certain working capital and other funds are not mandated by the GBR and are classified as restricted funds, they are invested in accordance with the provisions of the investment policy under the GBR. The composition of restricted and designated fund is as follows for the year ended December 31:
2020 2019
Restricted Funds
Funds obtained from terminated power purchase contract 5,164$ 5,132$
Working Capital Funds to maintain funds to cover operating expenses 18,885 22,330
Pooled loan lines of credit 9,176 9,199
Total Restricted Funds and Interest Receivable 33,225 36,661
Less – current portion (33,170) (36,549)
Interest receivable (55) (112)
Total Restricted Funds, Long-term -$ -$
Nuclear Decommissioning Funds
Nuclear decommissioning funds 161,491$ 143,521$
Designated Funds
Other Funds for indemnification or purchase of insurance, funds contributed for an agreement where MMWEC acts as agent and long-term investments for the Nuclear Mix No. 1, Nuclear Project 3,4,and 5 Intermediate, Peaking and Wyman Projects and fuel line of credit 161,236$ 173,767$
Designated Funds and Interest Receivable 161,236 173,767
Less - current portion (3,455) (5,590)
Interest receivable (317) (744)
Total Designated Funds, Long-Term 157,464$ 167,433$
(In Thousands)
For financial reporting purposes, interest receivable has been disclosed separately on the Balance Sheets.

Page 34
Massachusetts Municipal Wholesale Electric Company Notes to Financial Statements Years Ended December 31, 2020 and 2019
4. CHANGES IN CAPITAL ASSETS
A summary of changes in capital assets for 2019 and 2018 is as follows:
Balance Additions/ Deletions/ Balance
1/1/2020 Reclassifications Reclassifications 12/31/2020
Capital assets not being depreciated:
Land 3,849$ -$ -$ 3,849$
Capital assets being depreciated:
Plant in service 1,398,302 11,036 (2,050) 1,407,288
Less - accumulated depreciation 899,657 19,058 (2,049) 916,666
Net plant 502,494$ (8,022)$ (1)$ 494,471$
(In Thousands)
Balance Additions/ Deletions/ Balance
1/1/2019 Reclassifications Reclassifications 12/31/2019
Capital assets not being depreciated:
Land 3,869$ -$ (20)$ 3,849$
Capital assets being depreciated:
Plant in service 1,378,963 29,049 (9,710) 1,398,302
Less - accumulated depreciation 890,322 18,146 (8,811) 899,657
Net plant 492,510$ 10,903$ (919)$ 502,494$
(In Thousands)
A summary of changes in construction work in progress for 2020 and 2019 is as follows:
Year
Balance at January 1, Additions
Transfers to In
Service
Balance at December
31,
2020 19,763$ 2,215$ (377)$ 21,601$
2019 29,054$ 3,544$ (12,835)$ 19,763$
(In Thousands)

Page 35
Massachusetts Municipal Wholesale Electric Company Notes to Financial Statements Years Ended December 31, 2020 and 2019
4. CHANGES IN CAPITAL ASSETS…continued
A summary of changes in nuclear fuel for 2020 and 2019 is as follows:
Year
Balance at January 1, Additions Deletions Amortization
Balance at December 31,
2020 21,456$ 7,582$ ‐$ (8,226)$ 20,812$
2019 23,358$ 10,208$ (2,582)$ (9,528)$ 21,456$
(In Thousands)
5. SHORT-TERM DEBT
MMWEC maintains a $25.0 million loan facility which allows for borrowings by MMWEC to finance, temporarily, certain power purchases made by MMWEC for resale to the Members and other municipal systems under various power contracts between MMWEC and the municipal systems (Power Contracts). Borrowings attributable to a Power Contract under this loan facility are secured by the following: a lien on and/or security interest in all proceeds of any loans prior to disbursement by MMWEC, all amounts payable to MMWEC by the Power Contract Participants under the Power Contract, and earnings from MMWEC’s temporary investments of such proceeds and amounts payable. The amount payable by a Power Contract Participant with respect to a Power Contract is limited to the amount allocated to that Participant. At December 31, 2020 and 2019, there was $2,000 and $21,400, respectively, outstanding under the loan facility. During 2020 and 2019, the maximum outstanding balance under the line of credit was $1.7 million and $3.6 million, respectively. The interest rate for the borrowings under this line of credit is at MMWEC’s election prior to the last day of any interest period of either the LIBOR rate plus 1.50% per annum, or at a variable rate selected by MMWEC, which is either the prime rate or the BBA LIBOR Daily Floating Rate plus 1.50%. In addition, a commitment fee of .250% per annum is charged on the unused portion of the loan facility based on the average daily principal amount of the borrowing outstanding. This loan facility expires December 13, 2021. MMWEC has historically renewed this line of credit annually. MMWEC also maintains a $15.0 million revolving line of credit for the purpose of financing purchases of fuel oil and selling such fuel oil from the Stony Brook Fuel Oil Project to the Intermediate and Peaking Projects. Borrowings under this line of credit are secured by the following: a lien on and/or security interest in all proceeds of any borrowings prior to disbursement by MMWEC, all amounts payable by the Intermediate and Peaking Projects to the Stony Brook Fuel Oil Project for fuel oil, and all earnings from MMWEC’s investments of any such proceeds and amounts payable to the bank. There were no borrowings outstanding under the loan facility as of December 31, 2020 and 2019. During 2020 and 2019, the maximum outstanding balance under the line of credit was $0 and $0, respectively. The interest rate for the borrowings under this line of credit is at MMWEC’s election prior to the last day of any interest period of either the LIBOR rate plus 1.50% per annum, or at a variable rate selected by MMWEC, which is either the prime rate or the BBA LIBOR Daily Floating Rate plus 1.50%. If no such selection is made, the variable rate is in effect.

Page 36
Massachusetts Municipal Wholesale Electric Company Notes to Financial Statements Years Ended December 31, 2020 and 2019
5. SHORT-TERM DEBT…continued
In addition, a commitment fee of .250% per annum is charged on the unused portion of the loan facility based on the average daily principal amount of the borrowing outstanding. This line of credit expires December 13, 2021. MMWEC has historically renewed this line of credit annually. In 2014, MMWEC established a $50.0 million short term revolving facility for the purpose of borrowing funds to either make loans to Members to finance the acquisition of various utility assets, or to purchase various utility assets to be leased to Members. In March 2017, MMWEC converted a portion of the short-term debt outstanding under the Pooled Loan Program to individual term loans for each of the three Members in the Program. At December 31, 2020 and 2019, the outstanding balance under this line of credit was $0 and $0.6 million, respectively. The maximum outstanding balance during 2020 and 2019 was $1.7 million and $28.4 million, respectively. Subject to certain tax and default events, the interest rate for the borrowings under the line of credit is set at a rate per annum equal to the sum of (i) 70% of the LIBOR daily floating rate plus (ii) 1.15%. At December 31, 2019, the outstanding borrowings were at 2.4395%. There was no outstanding borrowings at December 31, 2020. In addition, a commitment fee of .250% per annum is charged on the unused portion of the revolving loan facility based on the average daily principal amount of the borrowing outstanding. On December 15, 2017, this loan facility was amended to $42.5 million. On September 11, 2018, this loan facility was amended to $30.2 million. On March 22, 2019, this loan facility was amended to $2.0 million. This loan facility expires March 22, 2021. The following short-term debt activity occurred in 2020 and 2019:
Year
Balance at January 1, Additions Payments
Balance at December 31,
2020 620$ 3,684$ (4,302)$ 2$
2019 28,476$ 15,115$ (42,971)$ 620$
(In Thousands)
6. LONG-TERM DEBT
Term Notes from Direct Borrowings
Pooled Loan Program Bond Series 2017A In March 2017, MMWEC converted a portion of the short-term debt outstanding under the Pooled Loan Program to individual term loans from direct borrowings for three Members in the Program. The loans issued totaled $20.2 million with fixed interest rates ranging between 3.05% and 3.15% and terms ranging between ten and fifteen years. Principal, interest and any fees associated with the loans are payable solely by each Member for which each loan was issued and the Member assets secure
Pooled Loan Program Bond Series 2019A In March 2019, MMWEC converted a portion of the short-term debt outstanding under the Pooled Loan Program to a note from direct borrowings for five Members in the Program. The note issued totaled $26.3 million with a fixed interest rate of 3.20% and a fifteen year term. Principal, interest and any fees associated with the note are payable solely by each Member for which the note was issued.

Page 37
Massachusetts Municipal Wholesale Electric Company Notes to Financial Statements Years Ended December 31, 2020 and 2019
6. LONG-TERM DEBT…continued
Per the borrowing agreements, MMWEC maintains reserves equal to 10% of the principal on the outstanding bonds, which can be accessed by the issuer in the event of default. At December 31, 2020 and 2019, the portion of long-term debt comprised of term notes from direct borrowings is as follows:
Issue - Notes from direct borrowingsNet Interest
Cost 2020 2019
Pooled Loan Program Bond Series 2017A - Term Note 3.05% - 3.15% 15,552$ 17,100$ Pooled Loan Program Bond Series 2019A - Note 3.20% 24,318 26,274
Total Debt 39,870 43,374
Less: Current maturities (3,566) (3,504) Total Long-Term Debt 36,304$ 39,870$
(In Thousands)
December 31,
The following is a summary of total debt service requirements for long-term debt outstanding at December 31, 2020:
Principal Interest Total
2021 3,566$ 1,222$ 4,788$
2022 3,630 1,109 4,739
2023 3,696 988 4,684
2024 3,765 871 4,636
2025 3,835 748 4,583
2026-2030 15,884 1,998 17,882
2031-2034 5,494 279 5,773
Totals 39,870$ 7,215$ 47,085$
Notes from Direct Borrowings
(In Thousands)
The following summarizes changes in long-term notes from direct borrowings for 2020 and 2019:
Year
Balance at January 1, Additions Payments
Balance at December 31,
2020 43,374$ -$ (3,504)$ 39,870$
2019 18,648$ 26,300$ (1,574)$ 43,374$
(In Thousands)
Interest paid for notes from direct borrowings during 2020 and 2019 was $1.3 million and $1.0 million, respectively.

Page 38
Massachusetts Municipal Wholesale Electric Company Notes to Financial Statements Years Ended December 31, 2020 and 2019
6. LONG-TERM DEBT…continued
General Bond Resolution and Power Supply System Revenue Bonds MMWEC issued separate issues of Bonds for each Project, which are payable solely from, and secured solely by, the revenues derived from the Project to which such issue relates, plus available funds pledged under the GBR for the Bonds of such issues. The revenues derived from each Project are used solely to provide for the payment of the Bonds of any Bond issue relating to such Project, and to pay MMWEC’s cost of owning and operating such Project, and are not used to provide for the payment of the Bonds of any Bond issue relating to any other Project.
Pursuant to all of the Project PSAs, each Project Participant is obligated to pay its share of the actual costs relating to the Project’s generating units, and its share of all principal, premium and interest associated with the Bonds for the Projects in which the Project Participant has a PSA, and for which the Project Participant is obligated to set rates at levels sufficient to pay such costs. These obligations are not contingent upon the operational status of the Project’s units.
MMWEC’s issuance of debt, other than obligations with a maturity of less than one year, requires authorization by the Massachusetts Department of Public Utilities.
Series 2011 Revenue Bonds Interest on the Series 2011 bonds dated June 2011 is payable in semi-annual installments on January 1 and July 1. The Series 2011 bonds bear interest at a fixed rate ranging from 4.0% to 5.0% for the various issues. The Series 2011 bonds were fully retired July 1, 2019. Series One Revenue Bonds The Series One bonds dated November 2001 of each issue are subject to redemption at the option of MMWEC, in whole or in part, at a redemption price of 100% of the principal amount. The interest rates on the Series One variable rate Bonds may be converted, at the option of MMWEC, to a daily, weekly, flexible, term or fixed mode. The realized interest rate on the Series One variable rate Bonds during 2019 and 2018 was 4.18% and 2.87%, respectively. The Series One bonds were fully redeemed in February 2019.
The following summarizes changes in long-term bonds debt, net of premiums, for 2019:
Bonds
Year
Balance at January 1, Additions Payments
Amortization of Premium
Balance at December 31,
2019 25,799$ -$ (25,758)$ (41)$ -$
(In Thousands)
Interest paid for long-term bond debt during 2019 was $279,000.

Page 39
Massachusetts Municipal Wholesale Electric Company Notes to Financial Statements Years Ended December 31, 2020 and 2019
7. ASSET RETIREMENT OBLIGATIONS
MMWEC has identified certain asset retirement obligations (AROs), which are primarily associated with the decommissioning of MMWEC’s ownership interest in Millstone Unit 3 and Seabrook Station and Wyman 4, which was sold in 2019. The ARO liabilities are measured using decommissioning studies provided by the majority owner for each Unit, which represented the current value of outlays expected to be incurred, and are allocated by MMWEC based on percentage of ownership in each Project as discussed in Note 14 – Project Joint Ownership Agreements. MMWEC maintains assets in the nuclear decommissioning trust as discussed in Note 3 – Restricted and Designated Assets to meet legally required funding levels. ARO activity for the year ended December 31, 2020 is as follows:
Unit
Remaining Useful Life
Balance at January 1
Inflation Adjustment
Balance at December 31
Seabrook Station 29 Years 124,731$ 4,365 129,096$
Millstone Unit 3 25 Years 34,287$ 698 34,985$
Total 159,018$ 5,063$ 164,081$
(In Thousands)
ARO activity for the year ended December 31, 2019 is as follows:
Unit
Remaining Useful Life
Balance at January 1 Sale of Wyman 4
Balance at December 31
Seabrook Station 30 Years 124,731$ - 124,731$
Wyman 4 N/A 870$ (870) -$
Millstone Unit 3 26 Years 34,287$ - 34,287$
Total 159,888$ (870)$ 159,018$
(In Thousands)
The recognition of the AROs at current value also results in a corresponding deferred outflow of resources. A reconciliation of the beginning and ending aggregate deferred outflow of resources related to AROs for the years ended December 31, 2020 and 2019 is as follows:
2020 2019
Deferred outflow of resources - AROs, beginning of year 77,915$ 80,565$
Inflationary increase 5,063 -
Amortization (2,647) (2,650)
Deferred outflow of resources - AROs, end of year 80,331$ 77,915$
(In Thousands)
Amortization expense is included in depreciation expenses in the Statements of Revenues, Expenses and Changes in Net Position.

Page 40
Massachusetts Municipal Wholesale Electric Company Notes to Financial Statements Years Ended December 31, 2020 and 2019
8. AMOUNTS PAYABLE UNDER TERMS OF THE POWER SALES AGREEMENTS
Differences between amounts billed to Members and Project Participants and revenues and expenses recognized are included in amounts payable under the terms of the power sales agreements. These differences are made up of debt service collections, net of amounts returned to Participants, capital expenditures funded through reserve billings and unbilled operating and non-operating expenses and revenues. A summary of the items included in amounts payable in the future under the terms of the power sales contract for the years ended December 31, 2020 and 2019 is as follows:
2020 2019
Beginning balance - January 1 647,873$ 634,123$
Unbilled operating and nonoperating expenses and revenues:
Depreciation/amortization (21,708) (12,606)
Accretion - 645
Financing costs 718 691
Amortization of bond premiums and discounts - 41
Fuel inventory (gain) loss due to market adjustment (2,807) 2,042
Realized and unrealized gains and interest income 17,028 23,482
Lease revenue 38 38
Capital funded through reserve billings 12,648 11,289
Decommissioning fund contributions, net of fees 1,322 1,559
Gain on disposition of property - (9,027)
Debt service collections:
Principal on long-term debt billed (returned) - (4,404)
Ending Balance - December 31 655,112$ 647,873$
(In Thousands)
9. FAIR VALUE MEASUREMENT
MMWEC records assets and liabilities in accordance with GASB Statement No. 72, Fair Value Measurement and Application, which determines fair value, establishes a framework for measuring fair value and expands disclosures about fair value measurement. Fair value is defined in Statement No. 72 as the price that would be received to sell an asset or paid to transfer a liability in an orderly transaction between market participants at the measurement date (an exit price). Fair value is a market-based measurement for a particular asset or liability based on assumptions that market participants would use in pricing the asset or liability. Such assumptions include observable and unobservable inputs of market data, as well as assumptions about risk and the risk inherent in the inputs to the valuation technique.

Page 41
Massachusetts Municipal Wholesale Electric Company Notes to Financial Statements Years Ended December 31, 2020 and 2019
9. FAIR VALUE MEASUREMENT…continued
As a basis for considering market participant assumptions in fair value measurements, Statement No. 72 establishes a fair value hierarchy that prioritizes the inputs to valuation techniques used to measure fair value into three broad levels: Level 1 inputs are quoted prices (unadjusted) for identical assets or liabilities in active markets
that a government can access at the measurement date. Equity securities and U.S. Government Treasury securities are examples of Level 1 inputs.
Level 2 inputs are inputs other than quoted prices included within Level 1 that are observable
for the asset or liability, either directly or indirectly. Government agency and mortgage-backed securities are examples of Level 2 inputs.
Level 3 inputs are unobservable inputs that reflect MMWEC’s own assumptions about factors
that market participants would use in pricing the asset or liability (including assumptions about risk).
Valuation methods of the primary fair value measurements disclosed below are as follows:
The majority of investments in equity securities are valued using Level 1 measurements.
Investments in equity securities are typically valued at the closing price in the principal active market. For equity securities, these markets include published exchanges such as the National Association of Securities Dealers Automated Quotations and the New York Stock Exchange.
Most investments in debt securities are valued using Level 2 measurements because the valuations use interest rate curves and credit spreads applied to the terms of the debt instrument (maturity and coupon interest rate) and consider the counterparty credit rating.
Commodity derivatives, such as futures, swaps and options, which are ultimately settled using prices at locations quoted through clearinghouses are valued using level 1 inputs. Options included in this category are those with an identical strike price quoted through a clearinghouse.
Financial assets and liabilities are classified in their entirety based on the lowest level of input that is significant to the fair value measurement. MMWEC’s assessment of the significance of a particular input to the fair value measurement requires judgment and may affect the valuation of fair value assets and liabilities and their place within the fair value hierarchy levels.

Page 42
Massachusetts Municipal Wholesale Electric Company Notes to Financial Statements Years Ended December 31, 2020 and 2019
9. FAIR VALUE MEASUREMENT…continued
The following table presents fair value balances and their levels within the fair value hierarchy as of December 31, 2020 and 2019: MMWEC
Investments and Cash Equivalents Level 1 Level 2 Level 3 Total Level 1 Level 2 Level 3 Total
U.S. Treasury Bills 5,250$ - - 5,250$ 35,831$ - - 35,831$
U.S. Treasury Notes 20,801 - - 20,801 33,988 - - 33,988
U.S. Agency Bonds - 122,690 - 122,690 - 126,587 - 126,587
U.S. Agency Discount Notes - - - - - 364 - 364
Municipal Bonds - 35,857 - 35,857 - 5,309 - 5,309
Investments and Cash Equivalents 26,051$ 158,547$ -$ 184,598$ 69,819$ 132,260$ -$ 202,079$
Decommissioning
Investments and Cash Equivalents Level 1 Level 2 Level 3 Total Level 1 Level 2 Level 3 Total
Mutual Funds-Equity - 69,091$ - 69,091$ - 59,090$ - 59,090$
FPL Minority Owner Trust 34,906 - 34,906 32,610 - 32,610
Common Stock-Equity 16,851 - - 16,851 14,224 - - 14,224
U.S. Treasury Securities 7,951 - - 7,951 6,872 - - 6,872
Corporate Bonds - 12,156 - 12,156 - 10,163 - 10,163
U.S. Agency Securities - 4,303 - 4,303 - 3,659 - 3,659
Municipal Bonds - 1,332 - 1,332 - 1,172 - 1,172
Mutual Funds-Fixed - 728 - 728 - 224 - 224
Investments and Cash Equivalents 59,708$ 87,610$ -$ 147,318$ 53,706$ 74,308$ -$ 128,014$
Fiduciary Funds
Investments and Cash Equivalents Level 1 Level 2 Level 3 Total Level 1 Level 2 Level 3 Total
Mutual Funds-Equity - 27,582$ - 27,582$ - 25,909$ - 25,909$
Mutual Funds-Fixed - 3,009 - 3,009 - 3,118 - 3,118
Investments and Cash Equivalents -$ 30,591$ -$ 30,591$ -$ 29,027$ -$ 29,027$
(In Thousands)
2019
2019
2019
2020
2020
2020
(In Thousands)
(In Thousands)
10. LABOR AGREEMENTS
At December 31, 2020, approximately 29% of MMWEC’s 77 employees work under collective bargaining agreements, whose existing labor agreements expire on December 31, 2022. At December 31, 2019, approximately 29% of MMWEC’s 79 employees work under collective bargaining agreements.

Page 43
Massachusetts Municipal Wholesale Electric Company Notes to Financial Statements Years Ended December 31, 2020 and 2019
11. POOLED LOAN PROGRAM
In 2014, MMWEC began a Pooled Loan Program which enables MMWEC to borrow funds to either make loans to Members that would be used by the utility to finance the acquisition of various utility assets, or purchase and own various utility assets that would be leased to member utilities. The Program utilizes a short term revolving loan facility to provide initial funding of the loans and leases, as described in Note 5 – Short-term Debt. In March 2017, MMWEC converted a portion of the short-term debt outstanding under the Pooled Loan Program to individual term loans for three Members in the program.
MMWEC issues Promissory Notes to Members who borrow funds under this program and the interest and any fees associated with the Notes are payable solely by each Member who utilizes the program funds for their portion of the funds used. As of December 31, 2020, total loans receivable of $22.0 million are included in accounts receivable on the accompanying Balance Sheet, of which $2.6 million is classified short term accounts receivable and $19.4 million is classified as long term accounts receivable. As of December 31, 2019, total loans receivable of $25.1 million are included in accounts receivable on the accompanying Balance Sheet, of which $2.6 million is classified short term accounts receivable and $22.5 million is classified as long term accounts receivable. The accounts receivable relate to six Members as of December 31, 2020 and 2019.
12. LEASES
During 2018, MMWEC entered into contracts with three Members which qualify as capital leases. Under the contracts, MMWEC acts as lessor of certain generating facilities to each Member. The generating facilities were placed in service during 2019 and are included in capital assets on the accompanying Balance Sheet. The following is a summary of total future minimum lease payments at December 31, 2020:
2021 1,260$ 2022 1,257 2023 1,254 2024 1,251 2025 1,317
2026-2030 4,704 2031-2034 1,341
Totals 12,384$
(In Thousands)

Page 44
Massachusetts Municipal Wholesale Electric Company Notes to Financial Statements Years Ended December 31, 2020 and 2019
13. BENEFIT PLANS
Defined Benefit Plans The Massachusetts Municipal Wholesale Electric Company Pension Plans (Plans) are two single-employer, defined benefit pension plans administered by MMWEC. One plan covers union employees (union plan) and the other plan covers non-union employees (administration plan). All full-time active administration employees hired before December 1, 2006, and all full-time active union employees hired before January 1, 2008 are covered by their respective plans. The Plans provide a defined benefit to employees based on years of service and average earnings. The Plans provide retirement, disability, and death benefits to plan members and beneficiaries. Administrative or union employees hired after these dates qualify for a Defined Contribution plan as described below. Certain other financial information concerning the plans, in addition to the information contained here, is provided annually to plan participants. No standalone financial statements are issued for the Plans.
Defined Benefit Plans…continued Plan participants providing the basis of the actuarial valuations used to calculate, as of the measurement dates, the net pension liability for the years ended December 31, were:
Status 2020 2019 2020 2019
Active 18 19 7 7
Terminated vested 23 24 12 15
Retirees and beneficiaries 24 23 4 4
65 66 23 26
Administrative Union
All MMWEC employees are eligible to make a voluntary contribution in accordance with prescribed annual dollar limits to a deferred compensation plan sponsored by the Commonwealth of Massachusetts. The deferred compensation plan is maintained pursuant to Section 457(b) of the Internal Revenue Code and the General Laws of Massachusetts. MMWEC’s net pension asset at December 31, 2020 and 2019 was measured as of December 31, 2020 and 2019, respectively. The total pension liability used to calculate the net pension asset was determined by actuarial valuations as of January 1, 2020 and 2019 rolled forward using generally accepted actuarial procedures to the December 31, 2020 and 2019, measurement dates, respectively. MMWEC recorded $0.5 million and $0.8 million in pension expense related to these Plans for the years ended December 31, 2020 and 2019, respectively, which are included in other operating expenses on the accompanying Statements of Revenues, Expenses and Changes in Net Position. The annual contribution was determined as part of the January 1 actuarial valuation using the entry age normal with frozen initial liability cost method. All contributions to the plans are authorized by the Board of Directors and made by MMWEC. The actuarial assumptions for both Plans included a 7.0% investment rate of return, a discount rate of 7.0% on Plan liabilities and a 3.0% projected salary increase.

Page 45
Massachusetts Municipal Wholesale Electric Company Notes to Financial Statements Years Ended December 31, 2020 and 2019
13. BENEFIT PLANS…continued
Effective January 1, 2020, mortality rates for the Administrative Plan were based on the Pri-2012 White Collar Employee Annuitant Table for Males or Females, as appropriate, projected using Scale MP-2020 generational improvements. Mortality rates for the Union Plan in 2020 were based on the Pri-2012 Blue Collar Table for Males or Females, as appropriate, projected using Scale MP-2020 generational improvements. In 2019, mortality rates for the Administrative Plan were based on the RP-2014 White Collar Employee Annuitant Table for Males or Females, as appropriate, projected using Scale MP-2018 generational improvements from 2006. Mortality rates for the Union Plan in 2019 were based on the RP-2014 Blue Collar Table for Males or Females, as appropriate, projected using Scale MP-2018 generational improvements from 2006. The long-term expected rate of return on Plan investments was determined based on a blend of historical performance data and future expectations for each major asset class, while also reflecting current capital market conditions, developed on a geometric basis.
Defined Benefit Plans…continued MMWEC’s change in net pension asset for the years ended December 31, 2020 and 2019 are as follows:
2020 2019 2020 2019
Total pension liability
Service cost 117$ 124$ 72$ 79$
Interest cost 1,319 1,251 317 335
Difference between expected and actual experience (31) 991 (19) (188)
Changes of assumptions 40 190 (900) 271
Changes of benefit terms - - - -
Benefit payments (2,827) (1,558) (1,560) (622)
Net change in total pension liability (1,382) 998 (2,090) (125)
Total pension liability, beginning of period 19,520 18,522 4,765 4,890
Total pension liability, end of period 18,138$ 19,520$ 2,675$ 4,765$
Plan fiduciary net position
Employer contributions 245$ 500$ 250$ 250$
Net investment income 4,951 5,590 864 1,008
Benefit payments (2,827) (1,558) (1,560) (622)
Administrative expenses (10) (10) (10) (10)
Net change in fiduciary net position 2,359 4,522 (456) 626
Fiduciary net position, beginning of period 24,792 20,270 5,223 4,597
Fiduciary net position, end of period 27,151 24,792 4,767 5,223
Net pension (asset) liability, end of period (9,013)$ (5,272)$ (2,092)$ (458)$
(In Thousands)
Union PlanAdministration Plan

Page 46
Massachusetts Municipal Wholesale Electric Company Notes to Financial Statements Years Ended December 31, 2020 and 2019
13. BENEFIT PLANS…continued
The assumed allocation and expected real rates of return for each major asset class are summarized in the following table:
Administrative Union
Asset Class
Target Asset
Allocation
Long Term Expected Rate of Return
Target Asset Allocation
Long Term Expected Rate
of Return Fixed income 13.00% 2.00% 17.00% 2.00%
Mutual Funds 87.00% 7.50% 83.00% 8.60%
Total investments 100.00% 100.00%
Defined Benefit Plans…continued The following table presents the sensitivity of net pension (asset) liability calculation to a 1% increase and 1% decrease in the discount rate to measure the total pension (asset) liability:
2020 2019 2020 2019
Discount rate
1% decrease - 6.0% (7,233)$ (3,444)$ (1,786)$ (88)$
Current discount rate - 7.0% (9,013) (5,272) (2,092) (458)
1% increase - 8.0% (10,540) (6,837) (2,338) (780)
Administrative Union
(In Thousands)
The following table presents information about the pension-related deferred outflows and inflows of resources at December 31:
Deferred outflows (inflows) of resources
Difference between expected and actual experience 277$ (19)$ 908$ -$
Changes of assumptions 77 - 121 (8)
Difference between projected and actual earnings on
plan investments - (4,624) - (2,746)
Total deferred outflows (inflows) of resources 354$ (4,643)$ 1,029$ (2,754)$
(In Thousands)
2020 2019
Administration Plan

Page 47
Massachusetts Municipal Wholesale Electric Company Notes to Financial Statements Years Ended December 31, 2020 and 2019
13. BENEFIT PLANS…continued
Deferred outflows (inflows) of resources
Difference between expected and actual experience -$ (42)$ 55$ (343)$
Changes of assumptions 23 (451) 457 (9)
Difference between projected and actual earnings on
plan investments - (721) - (417)
Total deferred outflows (inflows) of resources 23$ (1,214)$ 512$ (769)$
Union Plan
2020 2019
(In Thousands)
Defined Benefit Plans…continued The following table presents the future amortization of pension-related deferred outflows (inflows) of resources, which will be recognized in pension expense, at December 31:
Administration Union
2021 (1,123)$ (696)$
2022 (1,023) (153)
2023 (1,492) (239)
2024 (651) (103)
(4,289)$ (1,191)$
(In Thousands)
The Required Supplementary Information following the Notes to the Financial Statements presents additional multiyear trend information demonstrating the components of change in the net pension liability from year to year, as well as trends in related statistical information and employer contributions to the Plans. Defined Contribution Plan In 2007, MMWEC established a defined contribution (DC) pension plan in compliance with Section 401 (a) of the Internal Revenue Code for non-union employees hired after December 1, 2006 and for union employees hired after January 1, 2008. Thereafter, all new employees are no longer eligible to participate in MMWEC Defined Benefit plans. Under the DC plan, MMWEC contributes 6% of an employee’s base salary and matches 50% of employee contributions to the defined contribution plan up to a maximum employee contribution of 6%. For the years ended December 31, 2020 and 2019, MMWEC contributed $379,000 and $337,000 and the employees contributed $23,000 and $6,000, respectively.

Page 48
Massachusetts Municipal Wholesale Electric Company Notes to Financial Statements Years Ended December 31, 2020 and 2019
13. BENEFIT PLANS…continued
Employee Savings Plan MMWEC contributes to an employee savings plan administered by a mutual insurance company. All eligible full-time employees meeting the service and eligibility requirements participate in this plan. Under the provisions of the plan, MMWEC's contributions are vested immediately. For the years ended December 31, 2020 and 2019, MMWEC contributed $50,000 and $52,000, respectively, and the employees contributed $87,000 and $100,000, respectively. All employees eligible or participating in the DC pension plan established in 2007 are not eligible to participate in the employee savings plan. Benefit provisions of all plans are determined and authorized by the MMWEC Board of Directors.
14. PROJECT JOINT OWNERSHIP AGREEMENTS MMWEC's power supply capacity includes ownership interests in the Stony Brook Peaking and Stony Brook Intermediate Units, both of which MMWEC operates. MMWEC is a nonoperating joint owner in the Millstone Unit 3 and Seabrook Station. On July 17, 2019, MMWEC sold its full ownership interest in Wyman 4. Electric plant in service and construction work in progress also includes assets related to MMWEC's service company operations, which totaled $28.1 million and $27.4 million at December 31, 2020 and 2019, respectively.
The following is a summary of the balances by Project included in electric plant in service and construction work in progress, as well as MMWEC’s share of capability in megawatts (MW).
Projects 2020 2019
Peaking Project Stony Brook 172.7 60,485$ 59,723$
Intermediate Project Stony Brook 321.3 180,603 179,031
Nuclear Project No. 3 Millstone Unit 3 39.5 149,825 148,043
Nuclear Mix No. 1 Millstone Unit 3 19.8 61,436 60,543
Nuclear Mix No. 1 Seabrook Station 2.0 10,178 10,106
Nuclear Project No. 4 Seabrook Station 54.0 301,211 299,311
Nuclear Project No. 5 Seabrook Station 13.7 81,563 81,082
Project No. 6 Seabrook Station 74.7 559,227 556,645
Totals 1,404,528$ 1,394,484$
Amount as of December 31,
(In Thousands)
Facility and MMWECShare of Capability in MW

Page 49
Massachusetts Municipal Wholesale Electric Company Notes to Financial Statements Years Ended December 31, 2020 and 2019
15. RELATED PARTY TRANSACTIONS
MMWEC, together with Massachusetts municipal utility systems, has formed six cooperatives under Massachusetts General Laws to conduct business for the mutual benefit of the members of the cooperatives. The following is a summary of each Cooperative and the associated Cooperative members and purpose for each Cooperative.
Cooperative Name Other Cooperative
Members Year
Founded Cooperative Purpose
Southwest Cooperative Corporation
Westfield Gas & Electric Light Department (WG&E)
2006
Financing, constructing and operating a natural gas pipeline to provide natural gas transportation service to WG&E
Massachusetts Municipal Light Department Wind Energy Cooperative Corporation
Templeton Municipal Light Department
2007
Financing, owning, constructing and operating wind generation facilities located in the town of Templeton
Berkshire Wind Power Cooperative Corporation
Sixteen municipal light departments
2008
Financing, owning, constructing and operating wind turbines and ancillary equipment located in Hancock and Lanesborough, Massachusetts
Massachusetts Municipal Light Department Solar Energy Cooperative Corporation
West Boylston Municipal Light Plant
2008
Financing, owning, constructing and operating a solar energy production facility in West Boylston, Massachusetts
Wakefield Municipal Cooperative Corporation
Wakefield Municipal Gas & Light Department
2012
Financing, constructing, purchasing, owning, leasing, maintaining and operating real and personal property located in Wakefield
Massachusetts Clean Energy Cooperative Corporation
Holyoke Gas & Electric Department (HG&E)
2013
Purchasing, acquiring, generating, transforming, distributing, selling, reselling, supplying and providing energy, telecommunications, or any related products or service and financing, owning, leasing or otherwise acquiring, holding, using and improving interests therein for the benefit of HG&E

Page 50
Massachusetts Municipal Wholesale Electric Company Notes to Financial Statements Years Ended December 31, 2020 and 2019
15. RELATED PARTY TRANSACTIONS…continued
Pursuant to contracts, MMWEC provides accounting, financial, power supply and administrative services to all six of these cooperatives. As such, although MMWEC is a member of each cooperative and has one representative on the Board of each cooperative, MMWEC has no rights to the entities’ assets nor has management oversight of the six cooperatives. Thus, the entities are not required to be reported as component units of MMWEC under rules established GASB 61, The Financial Reporting Entity. MMWEC billed a total of $590,000 and $841,000 for MMWEC services and outside professional services during 2020 and 2019, respectively, for all cooperatives. At December 31, 2020 and 2019, $57,000 and $92,000 was due to MMWEC from all cooperatives.
16. CONTRACTS AND COMMITMENTS Letter of Credit MMWEC has posted a letter of credit in the amount of $12.8 million with a power counterparty in order to meet its collateral obligations under the bilateral agreement with the counterparty. Long-Term Contracts – Cooperatives MMWEC has contracts with each Cooperative described in Note 15 – Related Party Transactions, whereby MMWEC is to serve as the Cooperative’s agent in the sale of power, transportation or lease to the municipal utility systems. The sale agreements between MMWEC and the Cooperatives are offset in each case by a purchase agreement between the Cooperative and the municipal utility systems, the revenues and expenses associated with these agreements are not included in the accompanying Statements of Revenues, Expenses and Changes in Net Position and are disclosed below. Contract 2020 2019
Transportation Agreement between MMWEC and the Southwest Cooperative Corporation 540$ 540$
Power Sales Agreement between MMWEC and the Massachusetts Municipal Light Department Wind Energy Cooperative Corporation 230 223
Power Sales Agreement between MMWEC and the Berkshire Wind Power Cooperative Corporation 8,170 5,830
Power Sales Agreement between MMWEC and the Massachusetts Municipal Light Department Solar Energy Cooperative Corporation 105 115
Lease Agreement between MMWEC and the Wakefield Municipal Cooperative Corporation 202 219
Power Sales Agreement between MMWEC and the Massachusetts Clean Energy Cooperative Corporation 82 63
Total 9,329$ 6,990$
(In Thousands)
Page 51
Massachusetts Municipal Wholesale Electric Company Notes to Financial Statements Years Ended December 31, 2020 and 2019
16. CONTRACTS AND COMMITMENTS…continued
Long-Term Contracts – Power Purchases MMWEC entered into agreements for participation in the transmission interconnection between New England utilities and the Hydro-Quebec electric system near Sherbrooke, Quebec (Phase I), which began commercial operation in October 1986. The New England portion of the interconnection was constructed at a total cost of approximately $140.0 million, of which 3.65% (or initially $5.0 million) was MMWEC's share to support Phase I. In 1990, MMWEC’s participation share in Phase I changed to 3.45%. MMWEC also entered into similar agreements for participation in the interconnection between New England utilities and the Hydro-Quebec electric system. This agreement is for the expansion of the Hydro-Quebec interconnection (Phase II), which went into commercial operation in November 1990. MMWEC's Phase II equity investment is approximately 0.6% (or initially $3.3 million). MMWEC has corresponding agreements with certain of its Members and another utility to recover MMWEC's share of the costs associated with the Phase II interconnection. Beginning in 1995, capital refunds from Phase II have been received, reducing MMWEC’s total equity investment. The equity balance of $182,000 at December 31, 2020 and 2019, is included in other noncurrent charges on the Balance Sheet. The Phase I and Phase II participation agreements were renewed effective November 1, 2020. MMWEC’s entitlement for Phase I and Phase II was increased to 3.47% and .65%, respectively, as of the renewal date On a limited basis, MMWEC may enter into agreements providing financial assurance to third parties. At December 31, 2020 and 2019, there were no outstanding guarantees related to its equity interest in the Hydro-Quebec transmission companies. Management believes that the likelihood MMWEC would be required to perform or otherwise incur any significant losses associated with this guarantee is remote. In 2013, MMWEC entered into a twenty-year power purchase agreement with Clement Dam Hydroelectric LLC, Franklin Power LLC, Greggs Falls Hydroelectric Associates LP, Pembroke Hydro Associates LP and HDI Associates I Partnership for 100% of the output of five hydroelectric generating facilities in New Hampshire with a combined nominal rating at 11.53 MW, effective January 1, 2014. This resource has been subscribed to by thirteen Members. Power purchased under this contract totaled $1.7 million and $2.1 million for the years ended December 31, 2020 and 2019, respectively. Also, in 2013, MMWEC entered into a twenty-five year power purchase agreement with Hancock Wind LLC for 73.5% of the output of a wind generating facility in Hancock County, Maine (Hancock Facility) with a nominal rating at 51 MW. This resource has been subscribed to by seventeen Members. The Hancock Facility began commercial operations on December 14, 2016. The total power purchased under this contract was $5.3 million and $5.8 million for the years ended December 31, 2020 and 2019, respectively. Claims and Judgments
MMWEC is involved in various legal actions. Management believes that the ultimate resolution of litigation in which MMWEC is currently involved will not have a material, adverse effect on the financial position of MMWEC.

Page 52
Massachusetts Municipal Wholesale Electric Company Notes to Financial Statements Years Ended December 31, 2020 and 2019
17. RISK MANAGEMENT
MMWEC is exposed to various risks of loss related to torts; theft of, damage to, or destruction of assets; errors and omissions; workers compensation; and health care of its employees. These risks are covered through the purchase of commercial insurance, with minimal deductibles. There were no settled claims in any of the past three years. There has been no material decrease in insurance coverage of MMWEC in the past year. Nuclear Insurance The Price-Anderson Act (the Act), a federal statute, mandates an industry-wide program of liability insurance for nuclear facilities. The $375.0 million primary layer of insurance for the liability has been purchased in the commercial insurance market. Secondary coverage is to be provided through an assessment on each of the currently licensed nuclear units in the United States of approximately $137.6 million, not to exceed $20.5 million per incident in any year. The assessment is to be adjusted for inflation every five years. Under the Act, MMWEC's ownership interests in Millstone Unit 3 and Seabrook Station could result in a maximum assessment of approximately $6.6 million and $16.0 million, respectively, limited to payments of $1.3 million and $2.4 million per incident per year, respectively. Originally enacted in 1957, the Act has been renewed several times and in July 2005, Congress extended the Act until the end of 2025, as part of the Energy Policy Act of 2005. Insurance has been purchased from Nuclear Electric Insurance Limited (NEIL) to cover the cost of repair, replacement, decontamination or premature decommissioning of utility property resulting from insured occurrences at Millstone Unit 3 and Seabrook Station. The NEIL insurance is subject to retroactive assessments if losses exceed the accumulated funds available to the insurer. MMWEC is potentially subject to a $1.3 million and $2.4 million assessment for its participation in Millstone Unit 3 and Seabrook Station, respectively, for excess property damage, decontamination and premature decommissioning.
18. CONCENTRATION OF CREDIT RISK / SIGNIFICANT CUSTOMERS Credit risk represents the risk of loss that would occur if customers do not meet their financial obligations to MMWEC. Concentration of credit risk occurs when significant customers possess similar characteristics that would cause their ability to meet contractual obligations to be affected by the same events.
As of December 31, 2020, MMWEC had two municipal customers who were considered significant customers, which accounted for approximately $35.8 million (16%) and $32.9 million (15%) of MMWEC revenues in 2020. In 2019, MMWEC had two municipal customers who were considered significant customers, which accounted for approximately $37.8 million (16%) and $34.9 million (15%) of MMWEC revenues in 2019. As of December 31, 2020, one municipal customer had significant account receivable balances of $3.2 million (17%). At December 31, 2019, one municipal customer had significant account receivable balances of $3.2 million (18%).

Page 53
Massachusetts Municipal Wholesale Electric Company Notes to Financial Statements Years Ended December 31, 2020 and 2019
19. ENVIRONMENTAL AND OTHER ISSUES
Nothing has come to management's attention concerning any material pollution liability claims made during 2020 and 2019 or outstanding as of December 31, 2020 and 2019.
MMWEC has established a trust fund to enhance its Directors' and Officers' liability coverage. The purpose of the trust fund is to make available funds for the purchase of Directors' and Officers' liability insurance and/or as a supplement to insurance for indemnification of the Directors or Officers. At December 31, 2020 and 2019, MMWEC has $10.8 million and $10.6 million, respectively, recorded in designated funds related to the trust fund with a corresponding liability in the same amount, representing advances from Members. MMWEC has a guaranty with ISO New England, Inc. (ISO-NE) with respect to certain MMWEC Members’ financial assurance obligations to ISO-NE. These Members do not have credit ratings and MMWEC provides financial assurances for their transactions in ISO-NE. MMWEC’s financial assurance is backed by the NEPEX Account Agreement between MMWEC and each of these Members. Pursuant to the NEPEX Account Agreement, each Member has an absolute and unconditional obligation to pay MMWEC for its respective ISO-NE transactions. Management believes that the likelihood MMWEC would be required to perform or otherwise incur any significant losses associated with this guarantee is remote.
20. SEGMENT INFORMATION
MMWEC issues separate revenue bonds for each Project, which are payable solely from, and secured solely by, the revenues derived from the Project to which such bond issue relates, plus available funds pledged under the GBR for the bonds of such issues. Each Project operates various electric generation facilities, as shown in Note 14 – Project Joint Ownership Agreements. All Project revenue bonds were fully retired July 1, 2019. Following is a summary of the financial information for each Project.
2019
NUCLEAR
CONDENSED BALANCE SHEET PROJ. 6
(In Thousands)
Assets:
Advances from projects 8$
Other current assets 7,195
Noncurrent assets 83,962
Capital assets, net 240,776
Deferred outflows of resources: 32,640
Total assets and deferred outflows of resources: 364,581
Liabilities:
Current liabilities 32,125
Noncurrent liabilities 64,742
Deferred inflows of resources: 267,714
Total liabilities and deferred inflows of resources: 364,581

Page 54
Massachusetts Municipal Wholesale Electric Company Notes to Financial Statements Years Ended December 31, 2020 and 2019
20. SEGMENT INFORMATION...continued
2019
NUCLEAR
PROJ. 6
(In Thousands)
CONDENSED STATEMENT OF REVENUES,
EXPENSES AND CHANGES IN NET POSITION
Operating revenues 12,073$
Depreciation (8,545)
Other operating expenses (13,298)
Operating loss (9,770)
Non-operating revenues (expenses):
Investment loss 7,684
Interest expense on long-term debt (142)
Other nonoperating expenses 98
Decrease in amounts payable under terms of the power sales agreements 2,130
Total non-operating revenues 9,770
Change in net position -
Net position, beginning of year -
Net position, end of year -$
CONDENSED STATEMENT OF CASH FLOWS
Net cash provided by (used in):
Operating activities 4,984$
Investing activities 17,172
Capital and related financing activities (16,915)
Net change in cash and cash equivalents 5,241
Cash and cash equivalents, beginning of year 3,675
Cash and cash equivalents, end of year 8,916$
21. SUBSEQUENT EVENTS
MMWEC has evaluated subsequent events through March 30, 2021, the date which the financial statements were available to be issued, and did not note any additional subsequent events requiring recording or disclosure in the financial statements for the year ended December 31, 2020.

REQUIRED SUPPLEMENTARY INFORMATION

Page 55
Massachusetts Municipal Wholesale Electric CompanyRequired Supplementary Information (Unaudited)Years Ended December 31, 2020 and 2019
2020 2019 2018 2017 2016 2015 2014Total pension liability
Service cost 117$ 124$ 130$ 155$ 139$ 191$ 210$ Interest cost 1,319 1,251 1,271 1,433 1,401 1,353 1,156 Difference between expected and actual experience (31) 991 1,037 602 (391) 748 26 Changes of assumptions 40 190 (31) (73) 1,395 (200) 1,789 Changes in benefit terms - - 426 - - - - Benefit payments (2,827) (1,558) (3,347) (4,078) (1,789) (1,275) (313) Net change in total pension liability (1,382) 998 (514) (1,961) 755 817 2,868 Total pension liability, beginning of period 19,520 18,522 19,036 20,997 20,242 19,425 16,556 Total pension liability, end of period 18,138 19,520 18,522 19,036 20,997 20,242 19,424
Plan fiduciary net positionEmployer contributions 245$ 500$ 275$ 361$ 174$ 480$ 877$ Net investment income 4,951 5,590 (709) 3,807 1,303 314 1,593 Benefit payments (2,827) (1,558) (3,347) (4,078) (1,789) (1,275) (313) Administrative expenses (10) (10) (11) (16) (19) (16) (16) Net change in fiduciary net position 2,359 4,522 (3,792) 74 (331) (497) 2,141 Fiduciary net position, beginning of year 24,792 20,270 24,062 23,988 24,319 24,816 22,675 Fiduciary net position, end of year 27,151 24,792 20,270 24,062 23,988 24,319 24,816
Net pension (asset) liability, end of period (9,013)$ (5,272)$ (1,748)$ (5,026)$ (2,991)$ (4,077)$ (5,392)$
149.69% 127.01% 109.44% 126.40% 114.25% 120.14% 127.76%
Covered -employee payroll 2,046$ 1,874$ 2,060$ 2,354$ 2,371$ 2,785$ 3,104$
(440.43%) (281.35%) (84.86%) (213.48%) (126.19%) (146.30%) (173.60%)
Annual money-weighted rate of return 21.04% 29.11% (3.05%) 17.09% 5.73% 1.28% 6.93%
The following schedules present Administration Plan multiyear trend information that demonstrates the components of change in the net pension (asset) liability from year-to-year, as well as trends in related statistical information. Information is present related to all periods for which the required data is available. Amounts presented are determined as of the measurement date of the net pension liability for the following years ended December 31:
Plan fiduciary net position as a percentage of the total pension liability
Net pension (asset) liability as a percentage of covered - employee payroll
Administrative Plan
(In Thousands)

Page 56
Massachusetts Municipal Wholesale Electric CompanyRequired Supplementary Information (Unaudited)Years Ended December 31, 2020 and 2019
2020 2019 2018 2017 2016 2015 2014Total pension liability
Service cost 72$ 79$ 96$ 109$ 89$ 106$ 106$ Interest cost 317 335 312 299 327 340 338 Difference between expected and actual experience (19) (188) (142) (128) (764) 709 226 Changes of assumptions (900) 271 200 (15) 1,238 (52) 191 Changes in benefit terms - - - - - - - Benefit payments (1,560) (623) (46) (46) (1,302) (1,281) (856) Net change in total pension liability (2,090) (126) 420 219 (412) (178) 5 Total pension liability, beginning of period 4,764 4,890 4,470 4,251 4,663 4,841 4,836 Total pension liability, end of period 2,674 4,764 4,890 4,470 4,251 4,663 4,841
Plan fiduciary net positionEmployer contributions 250$ 250$ 119$ 657$ 197$ 118$ 255$ Net investment income 864 1,008 (106) 626 194 104 416 Benefit payments (1,560) (623) (46) (45) (1,302) (1,281) (856) Administrative expenses (10) (10) (10) (10) (10) (10) (10) Net change in fiduciary net position (456) 625 (43) 1,228 (921) (1,069) (195) Fiduciary net position, beginning of year 5,222 4,597 4,640 3,412 4,333 5,402 5,597 Fiduciary net position, end of year 4,766 5,222 4,597 4,640 3,412 4,333 5,402
Net pension (asset) liability, end of period (2,092)$ (458)$ 293$ (170)$ 839$ 330$ (561)$
178.22% 109.61% 94.02 103.81% 80.27% 92.91% 111.59%
Covered -employee payroll 622$ 609$ 776$ 903$ 1,067$ 1,232$ 1,210$
(336.11%) (75.24%) 37.69% (18.86%) 78.59% 26.83% (46.38%)
Annual money-weighted rate of return 17.58 23.75% (2.24%) 17.46% 5.61% 2.21% 7.77%
The following schedules present Union Plan multiyear trend information that demonstrates the components of change in the net pension (asset) liability from year-to-year, as well as trends in related statistical information. Information is present related to all periods for which the required data is available. Amounts presented are determined as of the measurement date of the net pension liability for the following years ended December 31:
UnionPlan
Plan fiduciary net position as a percentage of the total pension liability
Net pension (asset) liability as a percentage of covered - employee payroll
(In Thousands)

Page 57
Massachusetts Municipal Wholesale Electric Company Required Supplementary Information (Unaudited) Years Ended December 31, 2020 and 2019
The following schedules present multiyear trend information regarding employer contributions to the Plans. Information is presented related to all periods for which the required data is available. The amounts presented are determined as of the years ended December 31:
Year
Actuarial Determined Contribution
Contributions in Relation to the
Actuarially Determined Contribution
Contribution Deficiency (Excess)
Covered-Employee
Payroll
Contributions as a
Percentage of Covered-
Employee Payroll
2020 23$ 245$ (222)$ 2,046$ 11.99%
2019 485 500 (15) 1,874 26.68%
2018 56 275 (219) 2,060 13.35%
2017 435 361 74 2,354 15.31%
2016 334 174 159 2,371 7.35%
2015 1 480 (479) 2,785 17.24%
2014 48 877 (829) 3,104 28.25%
(In Thousands)
Administration Plan
Year
Actuarial Determined Contribution
Contributions in Relation to the
Actuarially Determined Contribution
Contribution Deficiency (Excess)
Covered-Employee
Payroll
Contributions as a
Percentage of Covered-
Employee Payroll
2020 29$ 250$ (221)$ 622$ 40.16%
2019 132 250 (118) 609 41.07%
2018 110 119 (9) 776 15.33%
2017 233 658 (425) 903 72.78%
2016 175 197 (22) 1,067 18.48%
2015 123 118 5 1,232 9.57%
2014 65 255 (190) 1,210 21.10%
Union Plan
(In Thousands)

Page 58
Massachusetts Municipal Wholesale Electric Company Required Supplementary Information (Unaudited) Years Ended December 31, 2020 and 2019
The information presented in the required supplementary schedules was determined as part of the actuarial valuations at the dates indicated. Additional information as of the latest valuation follows:
Administration Plan Union Plan
Valuation date 1/1/2020 1/1/2020
Actuarial cost method Entry Age Normal with Frozen
Initial Liability Entry Age Normal with Frozen
Initial Liability
Amortization method Level dollar open Level dollar open
Remaining amortization period 30 years 30 years
Asset valuation method Fair Market Value Fair Market Value
Actuarial assumptions:
Investment rate of return 7.0% 7.0% Projected salary increases 3.0% 3.0% Cost-of-living adjustments N/A N/A Mortality Pri-2012 White Collar with Scale
MP-2020 Generational Improvements (Male/Female)
Pri-2012 Blue Collar with Scale MP-2020 Generational
Improvements (Male/Female)
There were no changes in benefit terms, in the size or composition of the population covered by the benefit terms that significantly affected trends from year to year in the amounts reported in the required supplementary information above. In 2019, mortality rates for the Administrative Plan were based on the RP-2014 White Collar Employee Annuitant Table for Males or Females, as appropriate, projected using Scale MP-2018 generational improvements from 2006. Mortality rates for the Union Plan in 2019 were based on the RP-2014 Blue Collar Table for Males or Females, as appropriate, projected using Scale MP-2018 generational improvements from 2006.

SUPPLEMENTARY INFORMATION

Page 59
Massachusetts Municipal Wholesale Electric CompanyProject Balance Sheet
December 31, 2020
(In Thousands)
NUCLEAR NUCLEAR NUCLEAR NUCLEAR
SERVICE MIX 1 PROJ. 3 PROJ. 4 PROJ. 5 PROJ. 6 PEAKING INTERMEDIATE WYMAN TOTAL
ASSETS
Current assets:
Cash and temporary investments 12,671$ 552$ 1,069$ 1,940$ 721$ 2,207$ 94$ 1,834$ 1,628$ 22,716$
Accounts receivable 14,834 635 1,058 1,552 403 2,382 311 1,228 - 22,403
Unbilled revenues 20,009 - - - - - - - - 20,009
Inventories - 106 - 2,809 711 3,890 1,669 13,810 - 22,995
Advances to (from) projects 348 (11) (20) (11) (8) 2 9 (308) (1) -
Prepaid expenses 758 131 238 318 81 441 66 221 - 2,254
Current portion of restricted special funds 33,170 - - - - - - - - 33,170
Interest receivable retricted special funds 55 - - - - - - - - 55
Current portion of designated funds 1,837 - - - - - - 116 1,502 3,455
Total current assets 83,682 1,413 2,345 6,608 1,908 8,922 2,149 16,901 3,129 127,057
Noncurrent assets:
Restricted assets:
Nuclear decommissioning trust - 23,388 43,989 35,675 9,030 49,409 - - - 161,491
Net pension asset 9,013 - - - - - - 2,092 - 11,105
Noncurrent charges:
Designated funds 10,415 9,463 14,820 20,314 5,247 30,962 14,004 52,239 - 157,464
Designated funds interest receivable 38 (8) (3) 57 4 107 17 105 - 317
Long-term accounts receivable 19,368 - - - - - - - - 19,368
Other noncurrent charges 182 2,293 4,136 5,787 1,463 8,014 20 748 - 22,643
Total noncurrent assets 39,016 35,136 62,942 61,833 15,744 88,492 14,041 55,184 - 372,388
Capital assets:
In service 21,772 69,835 146,462 298,767 80,944 555,892 59,296 178,169 - 1,411,137
Accumulated depreciation (8,191) (43,582) (95,244) (171,271) (46,858) (330,842) (57,419) (163,259) - (916,666)
Construction work in progress 6,388 1,779 3,363 2,444 619 3,385 1,189 2,434 - 21,601
Nuclear fuel, net of amortization - 2,503 4,601 5,196 1,315 7,197 - - - 20,812
Total capital assets 19,969 30,535 59,182 135,136 36,020 235,632 3,066 17,344 - 536,884
DEFERRED OUTFLOWS OF RESOURCES Deferred loss on pension asset 354 - - - - - - 23 - 377 Defferred asset retirement obligation - 5,923 9,980 24,422 6,182 33,824 - - - 80,331
Total deferred outflows of resources 354 5,923 9,980 24,422 6,182 33,824 - 23 - 80,708
Total assets and deferred outflows of resources 143,021$ 73,007$ 134,449$ 227,999$ 59,854$ 366,870$ 19,256$ 89,452$ 3,129$ 1,117,037$
LIABILITIES
Current liabilities:
Accounts payable 2,859$ 774$ 1,302$ 3,238$ 819$ 4,483$ 45$ 287$ -$ 13,807$
Member and Participant advances 34,915 8,059 13,797 18,641 4,871 26,555 4,358 11,398 1,632 124,226
Short-term debt 2 - - - - - - - - 2
Accrued expenses 18,367 27 - 706 179 978 86 351 - 20,694
Current liabilities payable from restricted assets:
Accrued interest payable 308 - - - - - - - - 308
Current maturities of long-term debt 3,566 - - - - - - - - 3,566
Total current liabilities 60,017 8,860 15,099 22,585 5,869 32,016 4,489 12,036 1,632 162,603
Noncurrent liabilities:
Long-term debt 36,304 - - - - - - - - 36,304
Asset retirement obligations - 13,499 23,300 48,248 12,212 66,822 - - - 164,081
Long-term member and participant advances, net of current maturities 36,283 5 - 124 31 171 2,667 49,090 - 88,371
Total noncurrent liabilities 72,587 13,504 23,300 48,372 12,243 66,993 2,667 49,090 - 288,756
DEFERRED INFLOWS OF RESOURCES
Pension regulatory credit 3,966 - - - - - - 743 - 4,709
Amounts payable under terms of
the power sales agreements 1,807 50,643 96,050 157,042 41,742 267,861 12,100 26,370 1,497 655,112 Deferred gain on pension asset 4,644 - - - - - - 1,213 - 5,857
Total deferred inflows of resources 10,417 50,643 96,050 157,042 41,742 267,861 12,100 28,326 1,497 665,678
Total liabilities and deferred inflows of resources 143,021$ 73,007$ 134,449$ 227,999$ 59,854$ 366,870$ 19,256$ 89,452$ 3,129$ 1,117,037$

Page 60
Massachusetts Municipal Wholesale Electric CompanyProject Statement of Revenues, Expenses and Changes in Net Position
Year Ended December 31, 2020
(In Thousands)
NUCLEAR NUCLEAR NUCLEAR NUCLEAR
SERVICE MIX 1 PROJ. 3 PROJ. 4 PROJ. 5 PROJ. 6 PEAKING INTERMEDIATE WYMAN TOTAL
Operating revenues:
Revenues 155,067$ 6,958$ 12,801$ 13,515$ 3,505$ 18,658$ 4,010$ 13,399$ (24)$ 227,889$
Operating expenses:
Fuel used in electric generation - 983 1,806 2,061 522 2,854 196 5,264 - 13,686
Purchased power 148,169 - - - - - - - - 148,169
Other operating 4,253 3,339 6,234 5,390 1,439 7,436 2,296 7,067 11 37,465
Maintenance 95 1,300 2,392 2,669 676 3,697 592 1,915 - 13,336
Depreciation 1,793 1,211 2,368 5,065 1,344 8,672 154 1,101 - 21,708
Taxes other than income 139 262 467 733 186 1,015 281 898 - 3,981
Total operating expenses 154,449 7,095 13,267 15,918 4,167 23,674 3,519 16,245 11 238,345
Operating income (loss) 618 (137) (466) (2,403) (662) (5,016) 491 (2,846) (35) (10,456)
Non-operating revenues (expenses):
Investment income (loss) 364 2,791 5,350 3,795 919 5,163 158 696 35 19,271
Interest expense on long-term debt (1,546) - - - - - (10) (20) - (1,576)
Amortization of premium - - - - - - - - - -
Amortization of gain on extinguishment of debt - - - - - - - - - -
Gain on disposition of property - - - - - - - - - -
(Increase) decrease in amounts payable under
terms of the power sales agreements 564 (2,654) (4,884) (1,392) (257) (147) (639) 2,170 - (7,239)
Total non-operating revenues (expenses) (618) 137 466 2,403 662 5,016 (491) 2,846 35 10,456
Change in net position -$ -$ -$ -$ -$ -$ -$ -$ -$ -$

Page 61
Massachusetts Municipal Wholesale Electric CompanyProject Statement of Cash Flows
Year Ended December 31, 2020
(In Thousands)
NUCLEAR NUCLEAR NUCLEAR NUCLEAR PROJECT
SERVICE MIX 1 PROJ. 3 PROJ. 4 PROJ. 5 PROJ. 6 PEAKING INTERMEDIATE WYMAN TOTAL
Cash flows from operating activities:
Received from sales to members and participants 162,270$ 6,370$ 11,905$ 12,736$ 3,262$ 16,594$ 3,866$ 13,877$ (7)$ 230,873$
Return of sale proceeds to participants - - - - - - - - - -
Paid to suppliers for goods and services (147,031) (3,605) (6,451) (9,547) (2,499) (13,161) (2,307) (8,200) 1 (192,800)
Paid to employees (4,634) - - - - - (1,248) (4,503) - (10,385)
Net cash provided by (used in) operating activities 10,605 2,765 5,454 3,189 763 3,433 311 1,174 (6) 27,688
Cash flows from investing activities:
Purchases of investments (121,989) (24,196) (43,756) (41,828) (12,058) (90,086) (25,470) (125,919) (2,964) (488,266)
Proceeds from sales and maturities of investments 119,074 22,887 43,952 39,846 11,035 86,455 25,058 117,049 4,713 470,069
Interest received 470 170 369 450 85 499 209 812 43 3,107
Net cash provided by (used in) investing activities (2,445) (1,139) 565 (1,532) (938) (3,132) (203) (8,058) 1,792 (15,090)
Cash flows from capital and related financing activities:
Construction expenditures and purchases of nuclear fuel (730) (3,302) (6,304) (3,712) (937) (5,141) (762) (1,572) - (22,460)
Gain on sale of assets - - - - - - - - - -
Proceeds from issuance of long-term debt - - - - - - - - - -
Principal payments on long-term debt (3,504) - - - - - - - - (3,504)
Decommissioning trust payments - (215) (408) (265) (67) (367) - - - (1,322)
Interest payments on long-term debt (1,339) - - - - - - - (1,339)
Net cash provided by (used in) capital and related financing activities (5,573) (3,517) (6,712) (3,977) (1,004) (5,508) (762) (1,572) - (28,625)
Cash flows from noncapital financing activities:
Proceeds from issuance of short-term debt 3,684 - - - - - - - - 3,684
Principal payments on short-term debt (4,302) - - - - - - - - (4,302)
Interest payments on short-term debt (297) - - - - - (10) (20) - (327)
Net cash provided by (used in) noncapital financing activities (915) - - - - - (10) (20) - (945)
Net change in cash and cash equivalents 1,672 (1,891) (693) (2,320) (1,179) (5,207) (664) (8,476) 1,786 (16,972)
Cash and cash equivalents, beginning of year 20,372 2,438 1,761 4,760 1,899 8,916 1,758 11,427 344 53,675
Cash and cash equivalents, end of year 22,044$ 547$ 1,068$ 2,440$ 720$ 3,709$ 1,094$ 2,951$ 2,130$ 36,703$
Reconciliation of operating income (loss) to net cash
provided by (used in) operating activities:
Operating income (loss) 618$ (137)$ (466) (2,403)$ (662)$ (5,016)$ 491$ (2,846)$ (35)$ (10,456)$
Noncash items included in operating income:
Depreciation 1,793 1,211 2,368 5,065 1,344 8,672 154 1,101 - 21,708
Amortization of nuclear fuel and accretion of ARO - 1,831 3,440 2,795 706 3,872 - - - 12,644
Changes in assets, liabilities and deferred outflows and inflows:
(Increase) decrease in:
Accounts receivable (1,221) (39) (9) 379 90 289 35 (45) (7) (528)
Unbilled revenues 2,202 - - - - - - - - 2,202
Inventories - 1 - 45 11 63 27 2,612 - 2,759
Prepaid expenses 1,489 (10) (8) (172) (44) (239) (37) (129) - 850
Net pension asset (3,741) - - - - - - (1,634) - (5,375)
Long term accounts receivable 3,154 - - - - - - - - 3,154
Other deferred charges - (163) (167) (2,104) (532) (2,913) (2) (419) - (6,300)
Increase (decrease) in:
Accounts payable (76) 694 1,274 1,458 367 2,013 11 129 - 5,870
Member and participant advances 3,115 (555) (893) (1,179) (341) (2,347) (324) 846 36 (1,642)
Accrued expenses (469) 7 - 160 41 223 (44) 27 - (55)
Other noncurrent liabilities - - - - - - - (101) - (101)
Pension regulatory liability 1,176 - - - - - - 700 - 1,876
Changes in deferred outflows of resources 2,155 (75) (85) (855) (217) (1,184) - 770 - 509
Changes in deferred inflows or resources 410 - - - - - - 163 - 573
Net cash provided by (used in) operating activities 10,605$ 2,765$ 5,454$ 3,189$ 763$ 3,433$ 311$ 1,174$ (6)$ 27,688$ - - - - - - - - -

Page 62
Massachusetts Municipal Wholesale Electric CompanyCombining Fiduciary Financial Statements
December 31, 2020 and 2019
(In Thousands)
STATEMENTS OF FIDUCIARY NET POSITION
2020 2019 2020 2019 2020 2019ASSETSInvestments at fair value:
Mutual funds 25,998$ 24,484$ 4,594$ 4,542$ 30,592$ 29,026$ Guaranteed income funds 1,153 308 173 680 1,326 988
Total investments 27,151 24,792 4,767 5,222 31,918 30,014
Net position available for pension benefits 27,151$ 24,792$ 4,767$ 5,222$ 31,918$ 30,014$
STATEMENTS OF CHANGES IN FIDUCIARY NET POSITION
2020 2019 2020 2019 2020 2019ADDITIONSEmployer contributions 245$ 500$ 250$ 250$ 495$ 750$
Investment activity:Interest and dividends 9 8 19 21 28 29 Net depreciation in fair value of investments 4,942 5,582 846 988 5,788 6,570
Total investment activity 4,951 5,590 865 1,009 5,816 6,599
Total additions 5,196 6,090 1,115 1,259 6,311 7,349
DEDUCTIONSBenefits paid directly to participants 2,827 1,558 1,560 624 4,387 2,182 Administrative expenses 10 10 10 10 20 20
Total deductions 2,837 1,568 1,570 634 4,407 2,202
Net increase (decrease) in net position 2,359 4,522 (455) 625 1,904 5,147
Net position available for pension benefits, beginning of year 24,792 20,270 5,222 4,597 30,014 24,867
Net position available for pension benefits, end of year 27,151$ 24,792$ 4,767$ 5,222$ 31,918$ 30,014$
Administrative Plan Union Plan Total Fiduciary Funds
Administrative Plan Union Plan Total Fiduciary Funds

OTHER INFORMATION

Page 63
Massachusetts Municipal Wholesale Electric Company Debt Service Coverage Calculation Years Ended December 31, 2020 and 2019 (In Thousands)
NET REVENUE AVAILABLE FOR DEBT SERVICE In accordance with the provisions of MMWEC's GBR, MMWEC covenants that it shall fix, revise and collect rates, tolls, rents and other fees and charges sufficient to produce revenues to pay all Project operating and maintenance expenses, and principal, premium, if any, and interest on the Bonds. Revenues for each Project, which include applicable interest earnings from investments, are required to equal 1.10 times the annual debt service for each contract year ending June 30, after deduction of certain operating and maintenance expenses and exclusive of depreciation. As such, amounts included in the table below do not reflect December 31 balances. All Project revenue bonds were fully retired July 1, 2019. For the contract year ended June 30, 2019, MMWEC met the GBR debt service coverage requirements for all of MMWEC’s Projects.
2019
Revenues 23,137$
Other billings -
Reserve and contingency fund billings 679
Total 23,816
Less – operating and maintenance expenses 16,489
Available revenues net of expenses 7,327$
Debt service requirement 6,647$
Coverage (110% required) 110%