massachusetts population projections by regional planning area · massachusetts population...
TRANSCRIPT
Massachusetts Population Projections by Regional Planning Area
Projections Methodology
September 12, 2018

Massachusetts Population Projections by Regional Planning Area
Projections Methodology
Prepared by the UMass Donahue Institute’s Economic & Public Policy Research Group Population Estimates Program
Project Leader Susan Strate
Project Staff Meghan Flanagan Matthew Schlaikjer
Research Assistant Jonathan Astor
The University of Massachusetts Donahue Institute is an outreach and economic development arm of the University of Massachusetts President’s Office. Established in 1971, the Institute strives to connect its
clients with the resources of the University, bridging theory and innovation with real world public and private sector applications. For more information: www.donahue.umassp.edu.
The Institute’s Economic and Public Policy Research (EPPR) group is a leading provider of applied research, helping clients make more informed decisions about strategic economic and public policy issues.
EPPR produces in-depth economic impact and industry studies that help clients build credibility, gain
visibility, educate constituents, and plan economic development initiatives. EPPR is known for providing unbiased economic analysis on state-level economic policy issues in Massachusetts and beyond, and has completed a number of industry studies on IT, defense industries, telecommunications, health care, and
transportation. Their trademark publication is called MassBenchmarks, an economic journal that presents timely information concerning the performance of and prospects for the Massachusetts economy, including economic analyses of key industries that make up the economic base of the state.
Acknowledgements
We wish to acknowledge the work of Dr. Henry Renski, Associate Professor of Regional Planning at the University of Massachusetts in Amherst for his work in developing the methodology and methods report for the Long-term Population Projections for Massachusetts Regions and Municipalities published by the UMass Donahue Institute in 2013 and 2015. Much of the writing in the present report was taken or adapted from the previously published methodology statements for these two series.
Massachusetts Population Projections by Regional Planning Area
i
Contents
List of Tables and Figures ..................................................................................................... ii
Introduction ........................................................................................................................ 1
Method Overview ............................................................................................................... 2
Technical Discussion of Methods and Assumptions ........................................................... 3
Regional-Level Methods and Assumptions ......................................................................... 3
Summary ............................................................................................................................. 3
Regional definitions ............................................................................................................ 4
Estimating the components of change ............................................................................... 5
Municipal-Level Methods and Assumptions ..................................................................... 20
MCD-Level Model Overview ............................................................................................. 20
Data Sources ..................................................................................................................... 21
MCD Projections Launch Population ................................................................................ 22
MCD Projections: Mortality .............................................................................................. 22
MCD Projections: Migration ............................................................................................. 23
Fertility .............................................................................................................................. 24
Controlling to the Regional-level Projections ................................................................... 25
Alternative Model for Cape & Island Regions ................................................................... 26
Sources .............................................................................................................................. 28
Appendix A: A Crosswalk of Municipalities by MPO Region, County, and UMDI Migration Region ............................................................................................................................... 29
Appendix B: Data Source Notes on Fertility and Mortality .............................................. 39
Massachusetts Population Projections by Regional Planning Area
ii
List of Tables and Figures
Figure 1. Cohort Component Method ............................................................................................ 4
Figure 2. UMDI projections Regions……………………………………………………………………..………………….. 5
Figure 3. Municipal-Level 2015 Launch Populations ...................................................................... 6
Figure 4. Massachusetts Female Mortality Rates by Age, 2003-2015............................................ 8
Figure 5. Massachusetts Male Mortality Rates by Age, 2003-2015 ............................................... 9
Figure 6. Massachusetts Mortality Rates by Age Comparison: 2005-2010, 2010-2015, and 2005-
2015 ................................................................................................................................................ 9
Figure 7. Massachusetts Mortality Rates by Age <50, Comparison: 2005-2010, 2010-2015, and
2005-2015 ..................................................................................................................................... 10
Figure 8. Massachusetts Mortality Rates by Age 50+, Comparison: 2005-2010, 2010-2015, and
2005-2015 ..................................................................................................................................... 10
Figure 9. Massachusetts Estimated Migration, 2000-2016 .......................................................... 12
Table 1. Comparison of Massachusetts Net Migration Average by Period .................................. 12
Table 2. ACS 2007-2011 Population Enrolled in College or Graduate School by Region ............. 15
Figure 10. College Fix Method Example………………………………………………….……………………………… 15
Figure 11. Massachusetts and US Fertility Rates by Age-of-Mother, 2003-2015 ........................ 19
Table 3. Projection Method by Component……………………………………………………………………………. 21

Massachusetts Population Projections by Regional Planning Area
1
Introduction
In 2015, with support from the Massachusetts Secretary of the Commonwealth, the UMass Donahue Institute (UMDI) published a public-use series of population projections to 2035 by age, sex, municipality, and Massachusetts regions1. More recently, in 2017 and 2018, UMDI worked in agreement with the Massachusetts Department of Transportation (MassDOT) to update these projections for each Municipal Planning Organization (MPO) for use in their Statewide Transportation Planning Model. For the revised population projections, UMDI worked in collaboration with a Projections Advisory Committee that included representatives from each of the Massachusetts Regional Planning Agencies, including the Metropolitan Area Planning Commission, the Central Transportation Planning Staff of the Boston Region Metropolitan Planning Organization (CTPS), and Massachusetts DOT as well as other interested stakeholders. The Advisory Group provided input on model updates including the integration of an updated launch population; decisions around which period rates to use for fertility and mortality; and model modifications for improved performance in their regions. This methodology report details both the 2015 series projections (V2015) methods and data sources as well as the updates and changes applied to these for the 2018 vintage projections (V2018). It is important to note that modeled projections cannot and do not purport to predict the future, but rather may serve as points of reference for planners and researchers. Like all forecasts, the UMDI projections rely upon assumptions about future trends based on past and present trends which may or may not actually persist into the future. The V2018 series employs a status-quo model approach to predict future population change. It assumes that recently observed trends in the components of population change, including birth, death, and migration rates, will persist in future years. It is also a demographically-based model, assuming that population change is driven by births, deaths, and the persistence of historic migration rates into the future.
1 Long-Term Population Projections for Massachusetts Regions and Municipalities. UMass Donahue Institute. March 2015. http://www.donahue.umassp.edu/business-groups/economic-public-policy-research/massachusetts-population-estimates-program/population-projections
Massachusetts Population Projections by Regional Planning Area
2
Method Overview
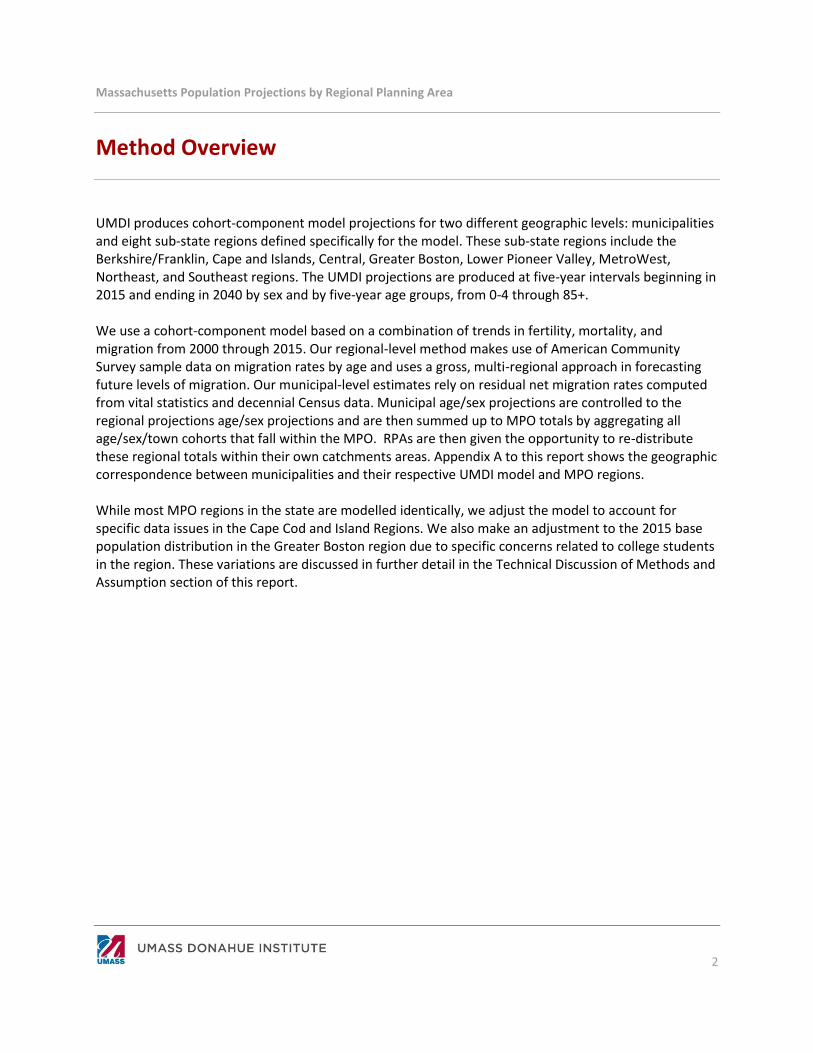
UMDI produces cohort-component model projections for two different geographic levels: municipalities and eight sub-state regions defined specifically for the model. These sub-state regions include the Berkshire/Franklin, Cape and Islands, Central, Greater Boston, Lower Pioneer Valley, MetroWest, Northeast, and Southeast regions. The UMDI projections are produced at five-year intervals beginning in 2015 and ending in 2040 by sex and by five-year age groups, from 0-4 through 85+. We use a cohort-component model based on a combination of trends in fertility, mortality, and migration from 2000 through 2015. Our regional-level method makes use of American Community Survey sample data on migration rates by age and uses a gross, multi-regional approach in forecasting future levels of migration. Our municipal-level estimates rely on residual net migration rates computed from vital statistics and decennial Census data. Municipal age/sex projections are controlled to the regional projections age/sex projections and are then summed up to MPO totals by aggregating all age/sex/town cohorts that fall within the MPO. RPAs are then given the opportunity to re-distribute these regional totals within their own catchments areas. Appendix A to this report shows the geographic correspondence between municipalities and their respective UMDI model and MPO regions. While most MPO regions in the state are modelled identically, we adjust the model to account for specific data issues in the Cape Cod and Island Regions. We also make an adjustment to the 2015 base population distribution in the Greater Boston region due to specific concerns related to college students in the region. These variations are discussed in further detail in the Technical Discussion of Methods and Assumption section of this report.

Massachusetts Population Projections by Regional Planning Area
3
Technical Discussion of Methods and Assumptions
This section provides a technical description of the process used to develop 1) sub-state regional and 2) municipal-level population projections. While both levels of projections are prepared using a cohort-component method, the major methodological difference is in the way migration is modeled: the municipal-level estimates (also referred to as Minor Civil Divisions, or MCDs) rely on residual net migration rates computed from vital statistics, while the sub-state regional projections use gross domestic migration rates based on the American Community Survey Public Use Microdata (ACS PUMS). MCD projections are controlled to projections developed for eight sub-state regions in order to smooth out variations due to data quality issues at the MCD level and ensure more consistent and accurate projections at higher-level geographies. These controlled MCD projections are then be re-aggregated to MPO regions and provided to RPAs for customized distribution. In the final population projections published by MassDOT, some Regional Planning Agencies maintained the original town-level age/sex projections prepared by UMDI to create the MPO projections, while others redistributed these according to specific emergent economic developments or planning initiatives in their regions.
Regional-Level Methods and Assumptions
Summary
This section describes the process and data used to develop the regional population projections. These projections were developed separately for eight Massachusetts regions, although each region was produced following the same framework, with some variations applied to the Cape and Island and Greater Boston regions. The methodology describing how the regional projections were used to estimate municipal population projections follows in Part B of this section.
Our regional projections are based on a demographic accounting framework for modeling population change, commonly referred to as a cohort-component model. The cohort-component method recognizes that there are only four ways that a region’s population can change from one time period to the next. It can add residents through either births or in-migration, or it can lose residents through deaths or out-migration. In our regional-level model, we further divide migration by whether domestic or international, and use separate estimation methods for each.
The cohort-component approach also accounts for population change associated with the aging of the population. The current age profile is a strong predictor of future population levels, growth and decline and can differ greatly from one region to another. For example, the Greater Boston region has a high concentration of residents in their twenties and early thirties, while the Cape and Islands have large shares of near and post-retirement age residents. Furthermore, the likelihood of birth, death, and in- and out-migration all vary by age. Because fertility rates are highest among women in their twenties and early thirties, a place that is anticipating a large number of women coming into their twenties and thirties in the next decade will likely experience more births. Similarly, mortality rates are notably higher for persons 70-years and older, such that an area with a large concentration of elderly residents will experience more deaths in decades to come.

Massachusetts Population Projections by Regional Planning Area
4
Developing a cohort-component model involves estimating rates of change for each separate component and age-sex cohort (i.e. age-specific fertility rates, survival rates, and in- and out-migration rates) - typically based on recent trends. It then applies these rates to the current age profile in order to predict the likely number of births, deaths, and migrants in the coming years. The changes are added to or subtracted from the current population, with the resulting population aged forward by a set number of years (five years, in our case). The result is a prediction of the anticipated number of people in each cohort X years in the future. This prediction becomes the new starting baseline for estimating change due to each component an additional X years in the future. The process is repeated through several iterations until the final target projection year has been reached.
Regional definitions
A preliminary step in generating our regional projections was to determine the boundaries for each of our study areas. We use the definitions for the MassBenchmarks regions as a starting point. The Benchmarks regions were designed by the UMass Donahue Institute to approximate functional regional economies (sets of communities with roughly similar characteristics in terms of overall demographic characteristics, industry structure, and commuting patterns). These Benchmarks regions constitute a widely accepted standard among policy officials and analysts statewide that meet common perceptions of distinct regional economies in Massachusetts.
Launch
Population +
Births
fertility rate by
age of mother
X
launch female
population
-
Deaths
mortality rate
by age/sex
X
launch
population
+
Migration
rate by age/sex
X
launch
population
Figure 1. Cohort Component Method
For each age/sex/geography cohort:
Massachusetts Population Projections by Regional Planning Area
5
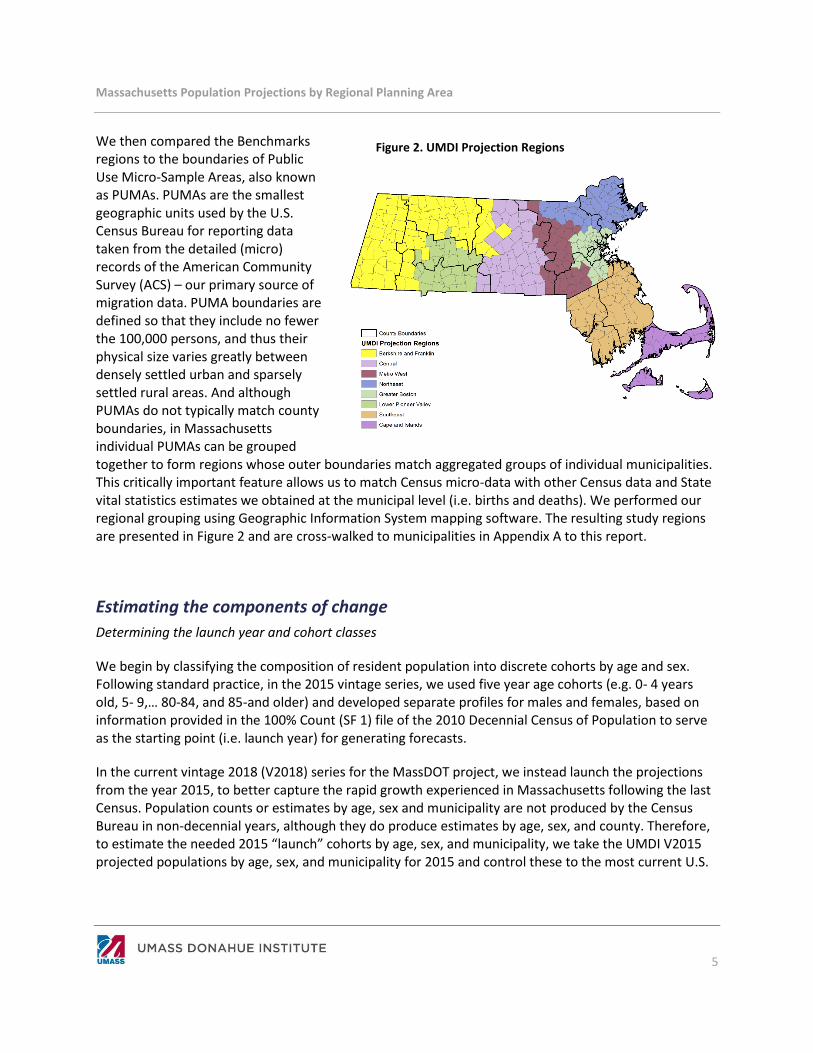
We then compared the Benchmarks regions to the boundaries of Public Use Micro-Sample Areas, also known as PUMAs. PUMAs are the smallest geographic units used by the U.S. Census Bureau for reporting data taken from the detailed (micro) records of the American Community Survey (ACS) – our primary source of migration data. PUMA boundaries are defined so that they include no fewer the 100,000 persons, and thus their physical size varies greatly between densely settled urban and sparsely settled rural areas. And although PUMAs do not typically match county boundaries, in Massachusetts individual PUMAs can be grouped together to form regions whose outer boundaries match aggregated groups of individual municipalities. This critically important feature allows us to match Census micro-data with other Census data and State vital statistics estimates we obtained at the municipal level (i.e. births and deaths). We performed our regional grouping using Geographic Information System mapping software. The resulting study regions are presented in Figure 2 and are cross-walked to municipalities in Appendix A to this report.
Estimating the components of change
Determining the launch year and cohort classes
We begin by classifying the composition of resident population into discrete cohorts by age and sex. Following standard practice, in the 2015 vintage series, we used five year age cohorts (e.g. 0- 4 years old, 5- 9,… 80-84, and 85-and older) and developed separate profiles for males and females, based on information provided in the 100% Count (SF 1) file of the 2010 Decennial Census of Population to serve as the starting point (i.e. launch year) for generating forecasts.
In the current vintage 2018 (V2018) series for the MassDOT project, we instead launch the projections from the year 2015, to better capture the rapid growth experienced in Massachusetts following the last Census. Population counts or estimates by age, sex and municipality are not produced by the Census Bureau in non-decennial years, although they do produce estimates by age, sex, and county. Therefore, to estimate the needed 2015 “launch” cohorts by age, sex, and municipality, we take the UMDI V2015 projected populations by age, sex, and municipality for 2015 and control these to the most current U.S.
Figure 2. UMDI Projection Regions
Massachusetts Population Projections by Regional Planning Area
6
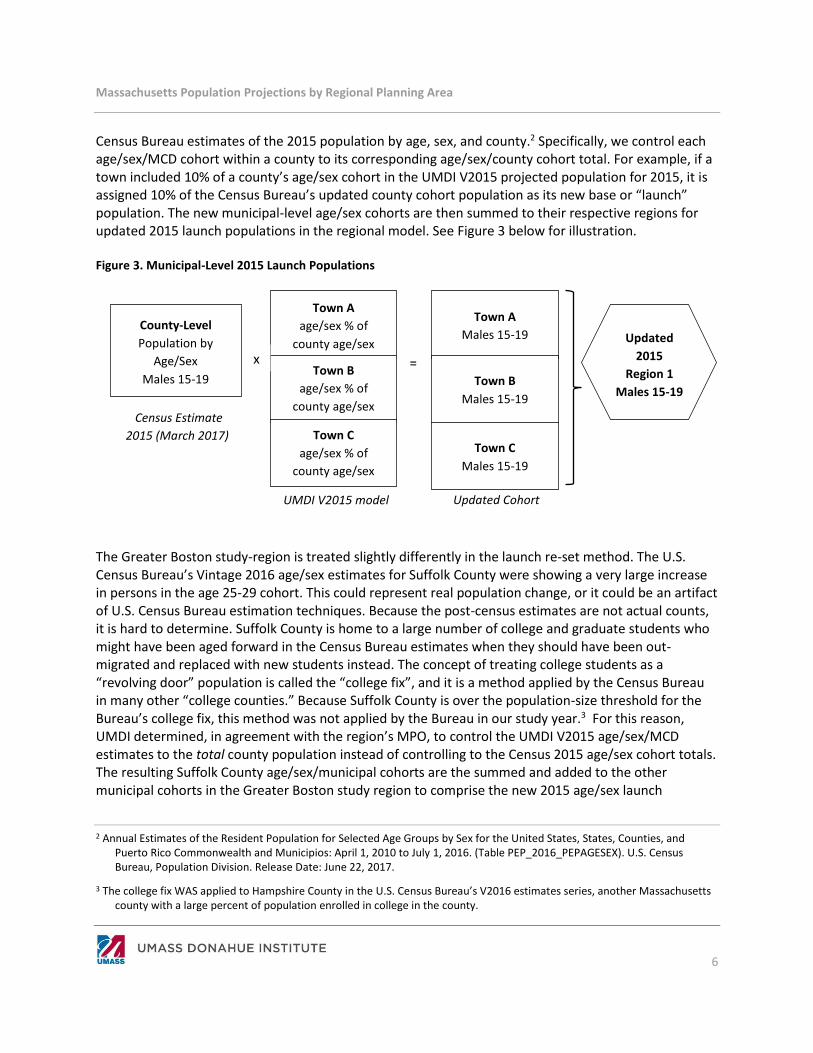
Census Bureau estimates of the 2015 population by age, sex, and county.2 Specifically, we control each age/sex/MCD cohort within a county to its corresponding age/sex/county cohort total. For example, if a town included 10% of a county’s age/sex cohort in the UMDI V2015 projected population for 2015, it is assigned 10% of the Census Bureau’s updated county cohort population as its new base or “launch” population. The new municipal-level age/sex cohorts are then summed to their respective regions for updated 2015 launch populations in the regional model. See Figure 3 below for illustration.
Figure 3. Municipal-Level 2015 Launch Populations
County-Level
Population by
Age/Sex
Males 15-19
Updated
2015
Region 1
Males 15-19
Census Estimate
2015 (March 2017)
UMDI V2015 model Updated Cohort
Town A
age/sex % of
county age/sex
Town B
age/sex % of
county age/sex
Town C
age/sex % of
county age/sex
Town A
Males 15-19
Town B
Males 15-19
Town C
Males 15-19
x =
The Greater Boston study-region is treated slightly differently in the launch re-set method. The U.S. Census Bureau’s Vintage 2016 age/sex estimates for Suffolk County were showing a very large increase in persons in the age 25-29 cohort. This could represent real population change, or it could be an artifact of U.S. Census Bureau estimation techniques. Because the post-census estimates are not actual counts, it is hard to determine. Suffolk County is home to a large number of college and graduate students who might have been aged forward in the Census Bureau estimates when they should have been out-migrated and replaced with new students instead. The concept of treating college students as a “revolving door” population is called the “college fix”, and it is a method applied by the Census Bureau in many other “college counties.” Because Suffolk County is over the population-size threshold for the Bureau’s college fix, this method was not applied by the Bureau in our study year.3 For this reason, UMDI determined, in agreement with the region’s MPO, to control the UMDI V2015 age/sex/MCD estimates to the total county population instead of controlling to the Census 2015 age/sex cohort totals. The resulting Suffolk County age/sex/municipal cohorts are the summed and added to the other municipal cohorts in the Greater Boston study region to comprise the new 2015 age/sex launch
2 Annual Estimates of the Resident Population for Selected Age Groups by Sex for the United States, States, Counties, and Puerto Rico Commonwealth and Municipios: April 1, 2010 to July 1, 2016. (Table PEP_2016_PEPAGESEX). U.S. Census Bureau, Population Division. Release Date: June 22, 2017.
3 The college fix WAS applied to Hampshire County in the U.S. Census Bureau’s V2016 estimates series, another Massachusetts county with a large percent of population enrolled in college in the county.
Massachusetts Population Projections by Regional Planning Area
7
populations for the regional model. In this way, the resulting population sum is the same as the Census Bureau’s estimated 2015 population, but the distribution of population follows the UMDI V2015 age/sex distribution.
Deaths and Survival
The first component of change in our model is survival. Our projections require an estimate of the number of people in the current population who are expected to live an additional five years into the future. Estimating the survival rate of each cohort is fairly straightforward. For the UMDI V2015 series, the Massachusetts Department of Public Health provided us with a detailed dataset that included all known deaths in the Commonwealth that occurred between 2000 to the end of calendar year 2009. This database includes information on the sex, age, and place of residence of the deceased, which we aggregated into our study regions by age/sex cohort. In the regional model, we estimate the five-year survival rate for each cohort (j) in study region (i) as one minus the average number of deaths over the past five years (2005 to 2009) divided by the base population in 2005 and then raised to the fifth power, or:
5𝐷𝑒𝑎𝑡ℎ𝑠
𝑆𝑢𝑟𝑣𝑖𝑣𝑎𝑙 𝑅𝑎𝑡𝑒 = [1 − ( 𝑖,𝑗𝑖,𝑗 )] . (1)
𝑃𝑜𝑝𝑢𝑙𝑎𝑡𝑖𝑜𝑛𝑖,𝑗
Following the recommendations of Isserman (1993), we calculate an operational survival rate as the average of the five-year survival rates across successive age cohorts. The operational rate recognizes that, over the next five years, the average person will spend half their time in their current age cohort and half their time in the next cohort. We estimate the number of eventual survivors in each cohort by 2015 by multiplying the operational survival rate against the cohort population count as reported by the 2010 Census.
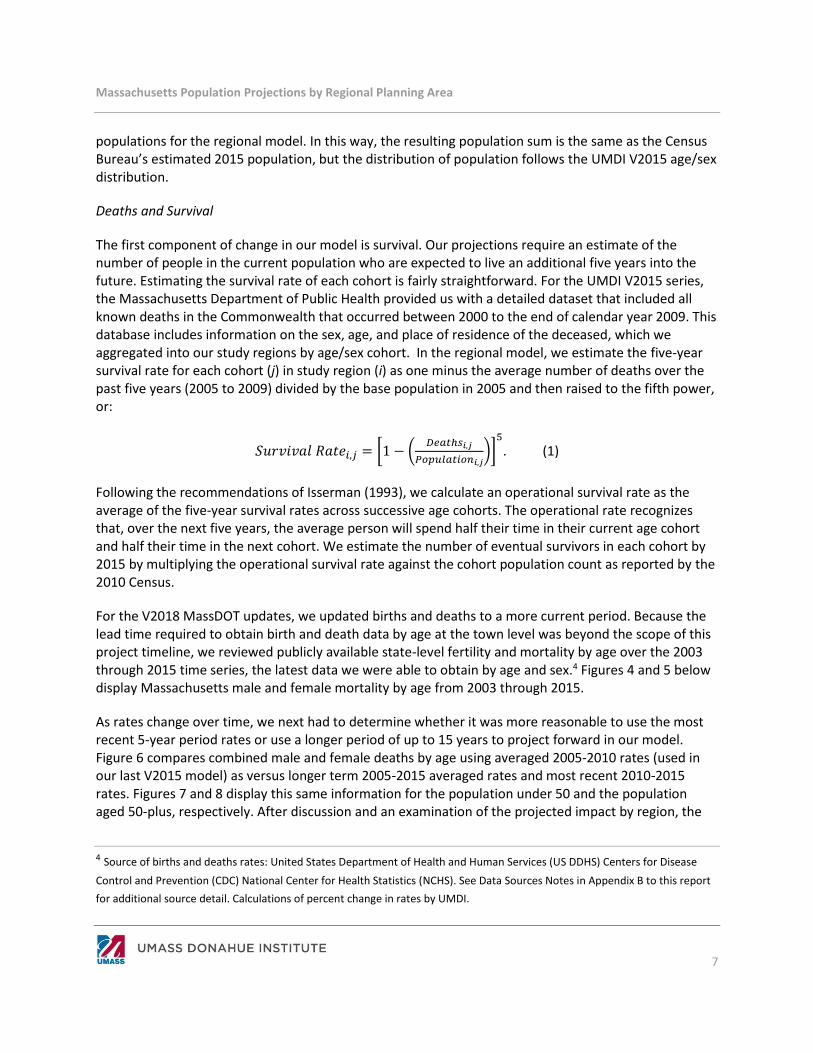
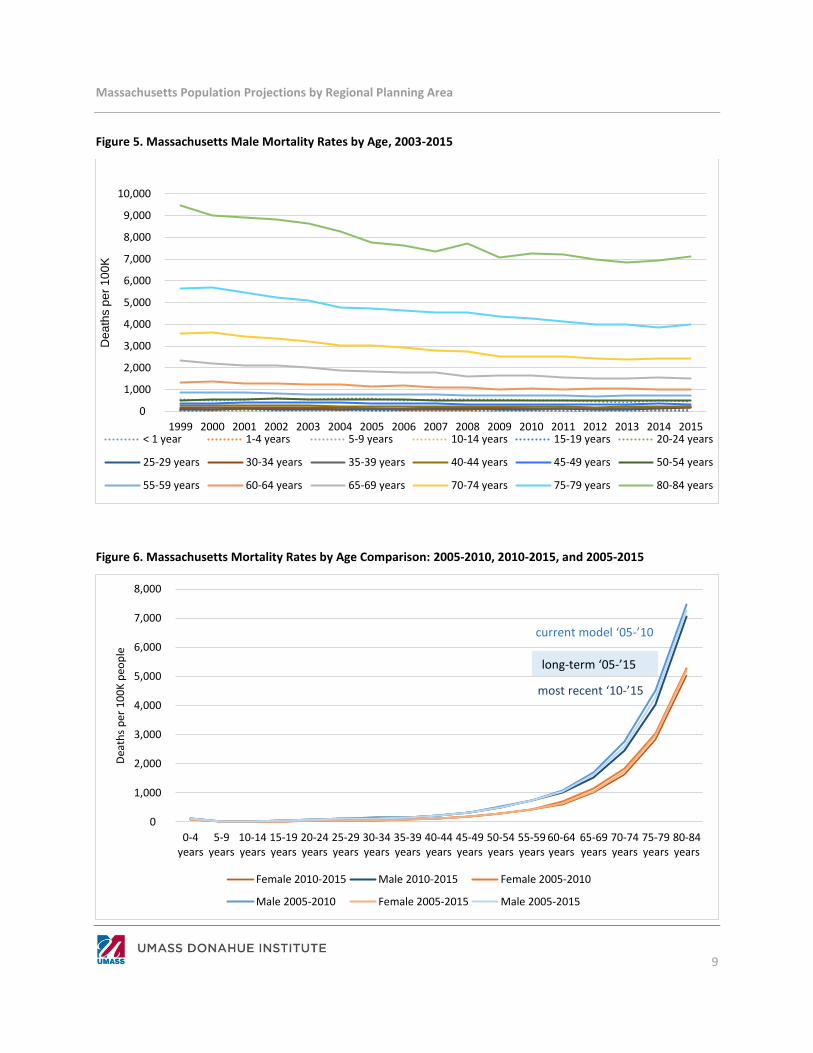
For the V2018 MassDOT updates, we updated births and deaths to a more current period. Because the lead time required to obtain birth and death data by age at the town level was beyond the scope of this project timeline, we reviewed publicly available state-level fertility and mortality by age over the 2003 through 2015 time series, the latest data we were able to obtain by age and sex.4 Figures 4 and 5 below display Massachusetts male and female mortality by age from 2003 through 2015.
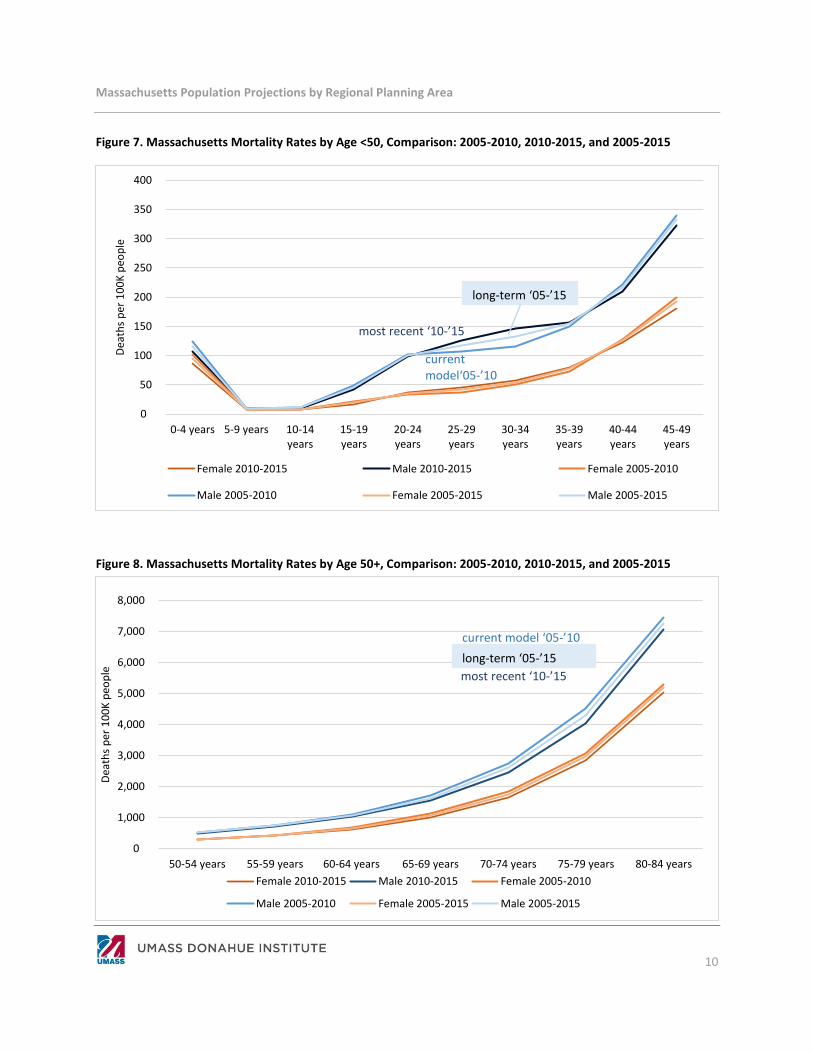
As rates change over time, we next had to determine whether it was more reasonable to use the most recent 5-year period rates or use a longer period of up to 15 years to project forward in our model. Figure 6 compares combined male and female deaths by age using averaged 2005-2010 rates (used in our last V2015 model) as versus longer term 2005-2015 averaged rates and most recent 2010-2015 rates. Figures 7 and 8 display this same information for the population under 50 and the population aged 50-plus, respectively. After discussion and an examination of the projected impact by region, the
4 Source of births and deaths rates: United States Department of Health and Human Services (US DDHS) Centers for Disease
Control and Prevention (CDC) National Center for Health Statistics (NCHS). See Data Sources Notes in Appendix B to this report
for additional source detail. Calculations of percent change in rates by UMDI.
Massachusetts Population Projections by Regional Planning Area
8
Projections Advisory Committee and the UMDI projections team agreed to use the most recent 5-year period of 2011-2015 as a basis for projecting forward.
To update our model, we calculate the percentage change in deaths per thousand by age and sex between the averaged 2005-2009 rates already in our model and the updated averaged 2011-2015 rates. We then apply this percent change to deaths by age in our existing regional model, shifting deaths by age to align with more current trends. The updated deaths by age are then used to calculate survival rates as described earlier in this section.
Figure 4. Massachusetts Female Mortality Rates by Age, 2003-2015
0
1,000
2,000
3,000
4,000
5,000
6,000
7,000
8,000
9,000
10,000
1999 2000 2001 2002 2003 2004 2005 2006 2007 2008 2009 2010 2011 2012 2013 2014 2015
Dea
ths
per
10
0K
< 1 year 1-4 years 5-9 years 10-14 years 15-19 years 20-24 years
25-29 years 30-34 years 35-39 years 40-44 years 45-49 years 50-54 years
55-59 years 60-64 years 65-69 years 70-74 years 75-79 years 80-84 years
Massachusetts Population Projections by Regional Planning Area
9
Figure 5. Massachusetts Male Mortality Rates by Age, 2003-2015
10,000
9,000
8,000
pe
r 1
00
K 7,000
6,000
5,000
De
ath
s
4,000
3,000
2,000
1,000
0
1999 2000 2001 2002 2003 2004 2005 2006 2007 2008 2009 2010 2011 2012 2013 2014 2015< 1 year 1-4 years 5-9 years 10-14 years 15-19 years 20-24 years
25-29 years 30-34 years 35-39 years 40-44 years 45-49 years 50-54 years
55-59 years 60-64 years 65-69 years 70-74 years 75-79 years 80-84 years
Figure 6. Massachusetts Mortality Rates by Age Comparison: 2005-2010, 2010-2015, and 2005-2015
8,000
7,000current model ‘05-’10
ple 6,000
oe
long-term ‘05-’15
p 5,000
10
0K most recent ‘10-’15
4,000
Dea
ths
per
3,000
2,000
1,000
0
0-4 5-9 10-14 15-19 20-24 25-29 30-34 35-39 40-44 45-49 50-54 55-59 60-64 65-69 70-74 75-79 80-84years years years years years years years years years years years years years years years years years
Female 2010-2015 Male 2010-2015 Female 2005-2010
Male 2005-2010 Female 2005-2015 Male 2005-2015
Massachusetts Population Projections by Regional Planning Area
10
Figure 7. Massachusetts Mortality Rates by Age <50, Comparison: 2005-2010, 2010-2015, and 2005-2015
0
50
100
150
200
250
300
350
400
0-4 years 5-9 years 10-14years
15-19years
20-24years
25-29years
30-34years
35-39years
40-44years
45-49years
Dea
ths
per
10
0K
peo
ple
Female 2010-2015 Male 2010-2015 Female 2005-2010
Male 2005-2010 Female 2005-2015 Male 2005-2015
most recent ‘10-’15
current model‘05-’10
long-term ‘05-’15
Figure 8. Massachusetts Mortality Rates by Age 50+, Comparison: 2005-2010, 2010-2015, and 2005-2015
0
1,000
2,000
3,000
4,000
5,000
6,000
7,000
8,000
50-54 years 55-59 years 60-64 years 65-69 years 70-74 years 75-79 years 80-84 years
Dea
ths
per
10
0K
peo
ple
Female 2010-2015 Male 2010-2015 Female 2005-2010
Male 2005-2010 Female 2005-2015 Male 2005-2015
most recent ‘10-’15
current model ‘05-’10
long-term ‘05-’15
Massachusetts Population Projections by Regional Planning Area
11
Domestic Migration
Migration is the most dynamic component of change, the most difficult to estimate, and the most likely source of uncertainty and error in population projections. Whereas fertility and mortality follow fairly regular age-related patterns, the migration behavior of similar age groups is influenced by regional and national differences in socio-economic conditions. Furthermore, the data needed to estimate migration is often restricted or limited; especially for many small areas. Even when it is available, it is based on statistical samples and not actual population counts, and thus is prone to sampling error – which will be larger for smaller regions.
Due to data limitations and the other methodological challenges, applied demographers have developed a variety of alternate models and methods to estimate migration rates. No single method works best in all circumstances, and we evaluated numerous approaches in the development of our projections. Those presented in this report are based on a particularly novel approach known as a multi-region gross migration model as discussed by Isserman (1993); Smith, Tayman and Swanson (2001); and Renski and Strate (2013). Most analysts use a net migration approach, where a single net migration rate is calculated as the number of net new migrants per cohort (in-migrants minus out-migrants) divided by the baseline cohort population of the study region. Although common, the net migration approach suffers from several conceptual and empirical flaws. A major problem is that denominator of the net migration rate is based purely on the number of residents in the study region. However, none of the existing residents are at risk of migrating into the region – they already live there. While this may seem trivial, it has been shown to lead to erroneous and biased projections especially for fast growing and declining regions.
A gross-migration approach calculates separate rates for in- and out-migrants. Beyond generating more accurate forecasts in most cases, it has an added benefit in that it connects regional population change to broader regional and national forces – rather than simply treating any one region as an isolated area. This type of model is made possible by utilizing the rich detail of information available through the newly released Public Use Micro-Samples (PUMS) of the American Community Survey (ACS). The ACS is a relatively new data product of the U.S. Census Bureau that replaced the detailed information collected on the long-form of the decennial census (STF 3). It asks residents questions about where they lived one year prior, which can be used to estimate the number of domestic in- and out-migrants. Unfortunately, the ACS does not report enough detail to estimate migration rates by detailed age-sex cohorts in its standard products. This information can be tabulated from the ACS PUMS – which is 5% random sample of individual records taken drawn the ACS surveys5. Each record in the PUMS is given a survey weight, which we use to estimate the total number of migrants by detailed age and sex cohorts. In our model, we develop migration rates using data from the 2005 to 2009 ACS PUMS as well as the 2007 to 2011 ACS
5 To account for small or missing samples in some cohorts in some regions, we make some limited adjustments to the ACS PUMS data before calculating migration rates based on the data. In the Berkshire/Franklin region, male and female migrants under the age of 15 are assigned the male/female average number of migrants before a rate is calculated in order to smooth out male/female ratios resulting from small sample sizes. In other regions, cohorts under age 75 with a sample size of zero in the ACS data are assigned values from the opposite gender when it is available to reduce instances of rates calculated from a null value.
Massachusetts Population Projections by Regional Planning Area
12
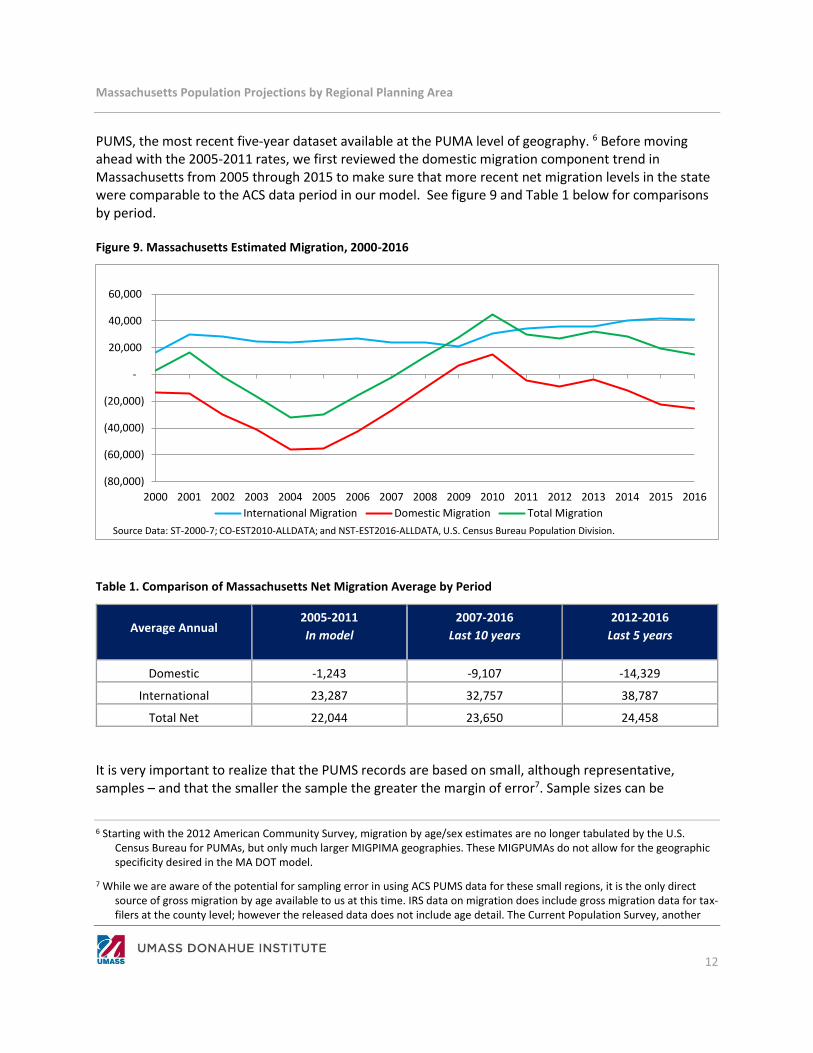
PUMS, the most recent five-year dataset available at the PUMA level of geography. 6 Before moving ahead with the 2005-2011 rates, we first reviewed the domestic migration component trend in Massachusetts from 2005 through 2015 to make sure that more recent net migration levels in the state were comparable to the ACS data period in our model. See figure 9 and Table 1 below for comparisons by period.
Figure 9. Massachusetts Estimated Migration, 2000-2016
(80,000)
(60,000)
(40,000)
(20,000)
-
20,000
40,000
60,000
2000 2001 2002 2003 2004 2005 2006 2007 2008 2009 2010 2011 2012 2013 2014 2015 2016
International Migration Domestic Migration Total Migration
Source Data: ST-2000-7; CO-EST2010-ALLDATA; and NST-EST2016-ALLDATA, U.S. Census Bureau Population Division.
Table 1. Comparison of Massachusetts Net Migration Average by Period
Average Annual 2005-2011
In model
2007-2016
Last 10 years
2012-2016
Last 5 years
Domestic -1,243 -9,107 -14,329
International 23,287 32,757 38,787
Total Net 22,044 23,650 24,458
It is very important to realize that the PUMS records are based on small, although representative, samples – and that the smaller the sample the greater the margin of error7. Sample sizes can be
6 Starting with the 2012 American Community Survey, migration by age/sex estimates are no longer tabulated by the U.S. Census Bureau for PUMAs, but only much larger MIGPIMA geographies. These MIGPUMAs do not allow for the geographic specificity desired in the MA DOT model.
7 While we are aware of the potential for sampling error in using ACS PUMS data for these small regions, it is the only direct source of gross migration by age available to us at this time. IRS data on migration does include gross migration data for tax-filers at the county level; however the released data does not include age detail. The Current Population Survey, another

Massachusetts Population Projections by Regional Planning Area
13
particularly small when distributed by age and sex cohorts for different types of migrants, especially in small regions. For this reason, the Berkshire/Franklin and Cape & Islands are two regions that can be treated with more skepticism in our projections results and which lend themselves to greater cross-examination by alternative methods8. These two regions were counted at fewer than 250,000 persons each in the 2010 Census and are subject to larger sampling error than the other six sub-state regions which all number more than 600,000 persons, and sometimes over 1 million. The Cape & Island Region also further breaks out into three distinct MPO regions in the MA DOT projections series. For these reasons, we use an alternative migration model in our projections for the Cape & Islands, described later in this report.
Estimating domestic out-migration is largely similar to estimating net-migration. Because current residents of the study region (i) are those who are ‘at risk’ of moving out, so the appropriate cohort (j) migration rate is:
𝑂𝑢𝑡𝑀𝑖𝑔𝑟𝑎𝑛𝑡𝑠 𝑂𝑢𝑡 𝑀𝑖𝑔𝑟𝑎𝑡𝑖𝑜𝑛 𝑅𝑎𝑡𝑒𝑖,𝑗 = ( 𝑖,𝑗).
𝑃𝑜𝑝𝑢𝑙𝑎𝑡𝑖𝑜𝑛𝑖,𝑗(2)
Because migration in the ACS is based on place of residence one-year prior, the out-migration rate reported in equation (2) is the equivalent of a single year rate. We multiply this by five to estimate the five-year equivalent rate, and, as we did with survival rates, average the five year rates across succeeding cohorts to craft an operational five year rate.9 The operational rate for each cohort is then multiplied against the number of eventual survivors in 2015 to estimate the number of likely out-migrants from the surviving population.
In-migration is more challenging. The candidate pool of potential domestic in-migrants is not those currently living in the region, but people living elsewhere in the U.S. Modeling in-migration thus requires collecting data on the age-sex profile of not only the study region, but for other regions as well. We model two separate regions as possible sources of incoming migrants in the multi-regional framework - those originating in neighboring regions and states (New York, Connecticut, Rhode Island, New Hampshire, and other Massachusetts regions) and those coming from elsewhere in the U.S. By doing so, we recognize that most inter-regional migration is fairly local and that the migration behavior of the Northeast is likely to differ considerably from that of the rest of the nation – in part due to our older and less racially diverse demographic profile.
sample survey product from the U.S. Census Bureau, provides migration data by age, but only down to the U.S. regional level of geography. Other methods commonly used to estimate migration do so using an indirect method of calculating net migration by age as a residual of a cohort-survival method
8 For information on alternative projections methods and results for the Berkshire/Franklin and Cape & Islands regions, researchers may contact the Population Estimates Program of the UMass Donahue Institute.
9 This differs from calculating the five-year survival rate, where the one-year rate was taken to the fifth power. Survival is modeled as a non-recurring probability, since you can only die one. However, we assume that any individual migrant could move more than once during the study period, and multiply the single year rate by five to estimate a five-year equivalent.
Massachusetts Population Projections by Regional Planning Area
14
Thus the in-migration rates characterizing migration behavior from neighboring regions (NE) to study region (i) and from the rest of the United States (U.S.) are calculated as:
𝐼𝑛 𝑀𝑖𝑔𝑟𝑎𝑡𝑖𝑜𝑛 𝑅𝑎𝑡𝑒𝑁𝐸 𝑡𝑜 𝑖,𝑗 = (𝐼𝑛𝑀𝑖𝑔𝑟𝑎𝑛𝑡𝑠𝑁𝐸 𝑡𝑜 𝑖,𝑗
𝑃𝑜𝑝𝑢𝑙𝑎𝑡𝑖𝑜𝑛𝑁𝐸,𝑗 −𝑃𝑜𝑝𝑢𝑙𝑎𝑡𝑖𝑜𝑛𝑖,𝑗) (3)
𝐼𝑛 𝑀𝑖𝑔𝑟𝑎𝑡𝑖𝑜𝑛 𝑅𝑎𝑡𝑒𝑈𝑆 𝑡𝑜 𝑖,𝑗 = (𝐼𝑛𝑀𝑖𝑔𝑟𝑎𝑛𝑡𝑠𝑈𝑆 𝑡𝑜 𝑖,𝑗−𝐼𝑛𝑀𝑖𝑔𝑟𝑎𝑛𝑡𝑠𝑁𝐸 𝑡𝑜 𝑖,𝑗
𝑃𝑜𝑝𝑢𝑙𝑎𝑡𝑖𝑜𝑛𝑈𝑆,𝑗 −𝑃𝑜𝑝𝑢𝑙𝑎𝑡𝑖𝑜𝑛𝑁𝐸,𝑗). (4)
As with the out-migration, each single-year in-migration rate is converted into a five-year operational migration rate. Unlike out-migration, these in-migration rates are not multiplied against the surviving regional population for the study region but instead the cohort population for the region of origin (neighboring regions for equation 3 or the rest of the U.S. for equation 4) to reflect the true population at risk of in-migration. The data for estimating the launch year cohort size for other regions is aggregated from the 2010 Census of Population (SF 1), with the study region cohort population subtracted from the base of neighbor regions and neighbor populations subtracted from the United States cohort population.
College Migration
Tracking the migration of college students is often problematic for researchers, as neither the ACS nor conventional tax-return migration data seems to capture their movement comprehensively or accurately. For this reason, the U.S. Census Bureau applies a “college fix” in their annual county-level population estimates to areas that meet their criteria for percent of population enrolled in college and other population thresholds10. In the basic application of the “college fix”, the college-enrolled population in a region is held back from aging and migration experienced by the non-college population over the specified time period, and is then restored to the region at the end of the period. In this way, the college-enrolled population remains more or less fixed for a region while other cohorts migrate and age over time.
In both the UMDI Vintage 2015 and the updated 2018 projections models, we apply a “college fix” method to the 15-19, 20-24, and 25-29 age cohorts in three regions: Greater Boston, Lower Pioneer Valley, and the Central Region. According to ACS 2007-2011 data, these regions all show significant percentages of college enrollment as follows:
10 The “College Fix”: Overcoming Issues in the Age Distribution of Population in College Counties. Ortman, Sink, King. Population Division, U.S. Census Bureau. October 2014.
Massachusetts Population Projections by Regional Planning Area
15
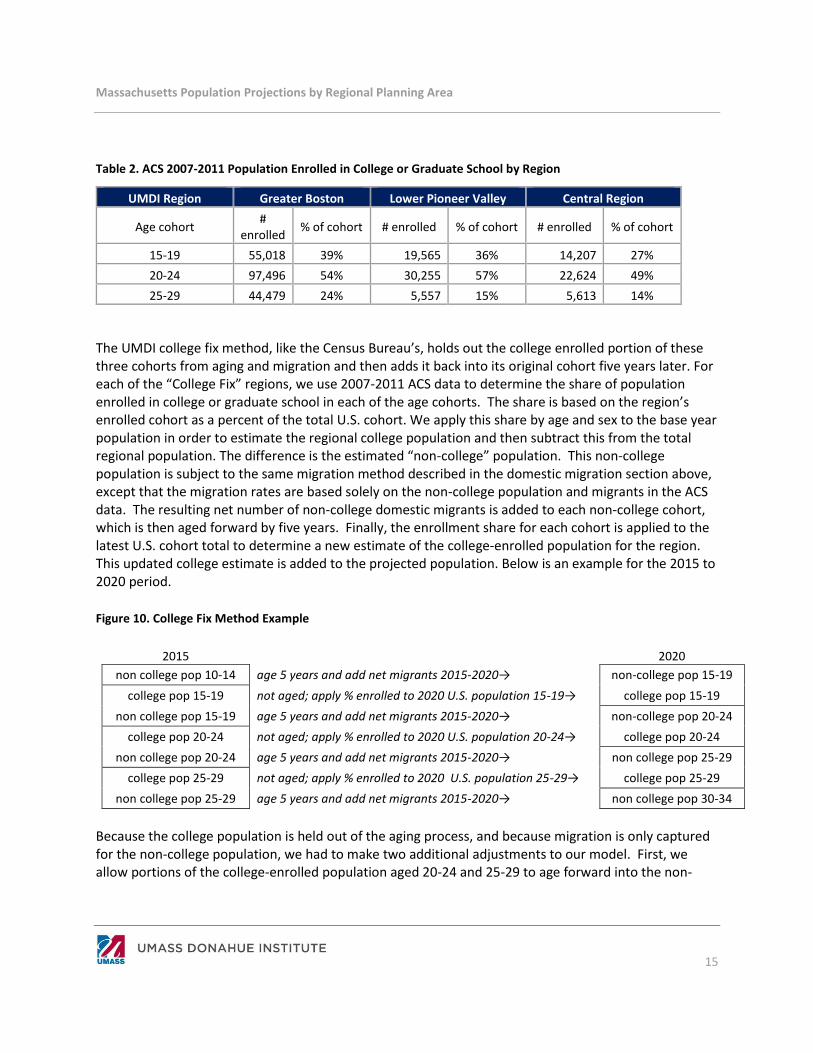
Table 2. ACS 2007-2011 Population Enrolled in College or Graduate School by Region
UMDI Region Greater Boston Lower Pioneer Valley Central Region
Age cohort #
enrolled % of cohort # enrolled % of cohort # enrolled % of cohort
15-19 55,018 39% 19,565 36% 14,207 27%
20-24 97,496 54% 30,255 57% 22,624 49%
25-29 44,479 24% 5,557 15% 5,613 14%
The UMDI college fix method, like the Census Bureau’s, holds out the college enrolled portion of these three cohorts from aging and migration and then adds it back into its original cohort five years later. For each of the “College Fix” regions, we use 2007-2011 ACS data to determine the share of population enrolled in college or graduate school in each of the age cohorts. The share is based on the region’s enrolled cohort as a percent of the total U.S. cohort. We apply this share by age and sex to the base year population in order to estimate the regional college population and then subtract this from the total regional population. The difference is the estimated “non-college” population. This non-college population is subject to the same migration method described in the domestic migration section above, except that the migration rates are based solely on the non-college population and migrants in the ACS data. The resulting net number of non-college domestic migrants is added to each non-college cohort, which is then aged forward by five years. Finally, the enrollment share for each cohort is applied to the latest U.S. cohort total to determine a new estimate of the college-enrolled population for the region. This updated college estimate is added to the projected population. Below is an example for the 2015 to 2020 period.
Figure 10. College Fix Method Example
2015 2020
non college pop 10-14 age 5 years and add net migrants 2015-2020→ non-college pop 15-19
college pop 15-19 not aged; apply % enrolled to 2020 U.S. population 15-19→ college pop 15-19
non college pop 15-19 age 5 years and add net migrants 2015-2020→ non-college pop 20-24
college pop 20-24 not aged; apply % enrolled to 2020 U.S. population 20-24→ college pop 20-24
non college pop 20-24 age 5 years and add net migrants 2015-2020→ non college pop 25-29
college pop 25-29 not aged; apply % enrolled to 2020 U.S. population 25-29→ college pop 25-29
non college pop 25-29 age 5 years and add net migrants 2015-2020→ non college pop 30-34
Because the college population is held out of the aging process, and because migration is only captured for the non-college population, we had to make two additional adjustments to our model. First, we allow portions of the college-enrolled population aged 20-24 and 25-29 to age forward into the non-
Massachusetts Population Projections by Regional Planning Area
16
college population11. This accounts for the college-enrolled population that ages in place into the non-college population (i.e. those that come for college or graduate and stay). Additionally, we account for the region’s non-college population that joins the college population upon migrating out of the region (i.e. those who leave their homes in Massachusetts to attend college elsewhere in the U.S.) by capturing them as out-migrants12.
International Migration (immigration and emigration)
International immigration in our model is estimated according to the number of international migrants, by age and sex, indicated for each region by the ACS 2007-2011 PUMS dataset. Unlike domestic migration in our model, however, the estimates of international immigrants from the ACS are not then converted to rates. With domestic migration, we can more comfortably make the assumption that there is a relationship between the number of migrants (our numerator) and another region (our denominator) that might be expected to remain relatively constant over time - for example the number of out-migrants relative to the region’s population or the number of in-migrants relative to the U.S. population. In the case of international migration, it is harder to make an assumption that, for example, as the world population by age increases, the region’s immigrants will increase at the same rate. In reality, a great number of factors not related to any particular region’s current population will influence future immigration levels, including federal immigration policy change, college recruitment policies, and labor needs, to name just a few. Instead of trying to guess at which way these changes will affect immigration to each region, we assume that the levels experienced in recent history, in this case the 2007 to 2011 period, will be sustained, and in our Vintage 2015 model the number of immigrants by cohort remain constant over the time period.
There is no consensus on how best to deal with emigration in a gross-migration context. One quirk of the ACS is that while it does contain information on the residence of recent international immigrants, it contains no information that might be used to estimate emigration. This is because the ACS only surveys people currently living in the U.S. This includes recent immigrants, but not people that moved out of the nation during the last year.
But, while we cannot directly estimate the number of emigrants in a five-year period using regional level ACS data, there are alternative methods that can be borrowed to at least approximate the number for each region. The U.S. Census Bureau developed emigration rates for the foreign born population -- the population most prone to emigration -- for a demographic analysis of net international migration. The rates were developed using a residual method and data from Census 2000, the American Community
11 To determine this proportion we applied a residual survival method using estimates of the college-enrolled and total populations by age in 2005 and 2010, based on enrollment levels by age indicated in the ACS 2005-2009 PUMS data. In an adjusted to the Greater Boston regional model, we also allow some portion of the 15-19 year old college enrollees to age in place into the non-college population. This age group did not appear to be aging into non-college in the two other college regions based on our residual calculations.
12 Out-migrants that are enrolled in college in regions outside of the study area, as captured in the ACS PUMS datasets.

Massachusetts Population Projections by Regional Planning Area
17
Survey, and life tables from the National Center for Health Statistics13. They estimated emigration rates ranging from of 12.8 to 15.5 per 1,000 among the population of recently arrived foreign born (those entering the U.S. within 10 years prior to the survey) and rates of just 1.7 to 3.5 per 1,000 for the foreign born population with longer residency – (those arriving more than ten years prior to the survey).
To estimate emigration in our model, we first use ACS 2007-2011 information on the foreign born population by age and by decade of entry to create two estimates of the foreign born population for each state region: one recent-arrival group and one longer-residency group. Using a simplified survival method, we age these two populations forward every five years, decreasing them by letting the 85-and older population fall out (a rough proxy for mortality) and increasing them by the addition of new immigrants (using ACS 2007-2011 levels). After 10 years, new immigrants are moved into the longer-residency group. We apply the Census Bureau’s middle-range rates for recently-arrived and longer-residency distinctly to each group in order to estimate the total number of emigrants by cohort in each time period.
It should be noted that in the Greater Boston, Central, and Lower Pioneer Valley regions, emigrating international students are already accounted for by the “revolving-door” approach of the college-fix method. In these three regions, we calculate international immigration and emigration only for the non-college population. College students in our model are withheld from the population at-risk for migration and aging. As such, they are not being counted as “immigrants” in the conventional sense, but instead are lumped in with all other college students, as a constant relative to the entire national population. In the Greater Boston region, college-enrolled immigrants ages 15-29 account for 30% of all international immigrants in the 2007-2011 ACS period, while in the Lower Pioneer Valley, they account for about 36%. These proportions can be thought of in our model as now removed from the foreign born population that would typically drive both immigration and emigration numbers, and so reduces the effect of any error in estimating emigration based on foreign born population estimates.
Finally, international immigrants who become part of the resident population are then subject to the same out-migration rates as the general population. If they move on to other parts of the U.S., they are captured as out-migrants in the next five-year period.
The final step of the migration model adds the estimated net number of domestic migrations (in-migrants minus out-migrants) and the estimated international migrants to the expected surviving population in order to estimate the expected number of “surviving stayers.” This is an estimate of the number of current residents who neither die nor move out of the region in the coming five years, plus any new migrants to the region. These surviving stayers are then used as the basis for estimating anticipated births.
13 Source: Population Division Working Paper No. 97: Estimating Net International Migration for 2010 Demographic Analysis: An Overview of Methods and Results, U.S. Census Bureau, February 2013.

Massachusetts Population Projections by Regional Planning Area
18
Births and Fertility
The last component in our regional cohort-component model requires estimating fertility rates using past data on the number of live births by the age of the mother. Like survival, information on births in comes from the Massachusetts Department of Public Health and is aggregated, by region, into our five-year age cohorts according to the mother’s age, and averaged over five years (2005 to2009). The number of births is then divided by the corresponding number of women in 2005 for each cohort to generate an approximate age-specific fertility rate. The births of males and females are modeled separately in our approach, however, in both cases it is only the number of women in each cohort that represents the population ‘at risk’ and appears in the denominator of the fertility rate. This single year fertility rate is multiplied by five to estimate a five-year equivalent, or:
𝐹𝑒𝑟𝑡𝑖𝑙𝑖𝑡𝑦 𝑅𝑎𝑡𝑒𝑖,𝑗 = 5 [(𝐵𝑖𝑟𝑡ℎ𝑠𝑖,𝑗
𝑁𝑢𝑚𝑏𝑒𝑟 𝑜𝑓 𝑊𝑜𝑚𝑒𝑛𝑖,𝑗)]. (7)
Next, the estimated fertility rates are multiplied against the number of females in the child-bearing age cohorts among the number of ‘surviving stayers’ as estimated in the previous step. This provides an estimate of the number of babies that are anticipated within the next five years, and this number is summed across all maternal age cohorts.
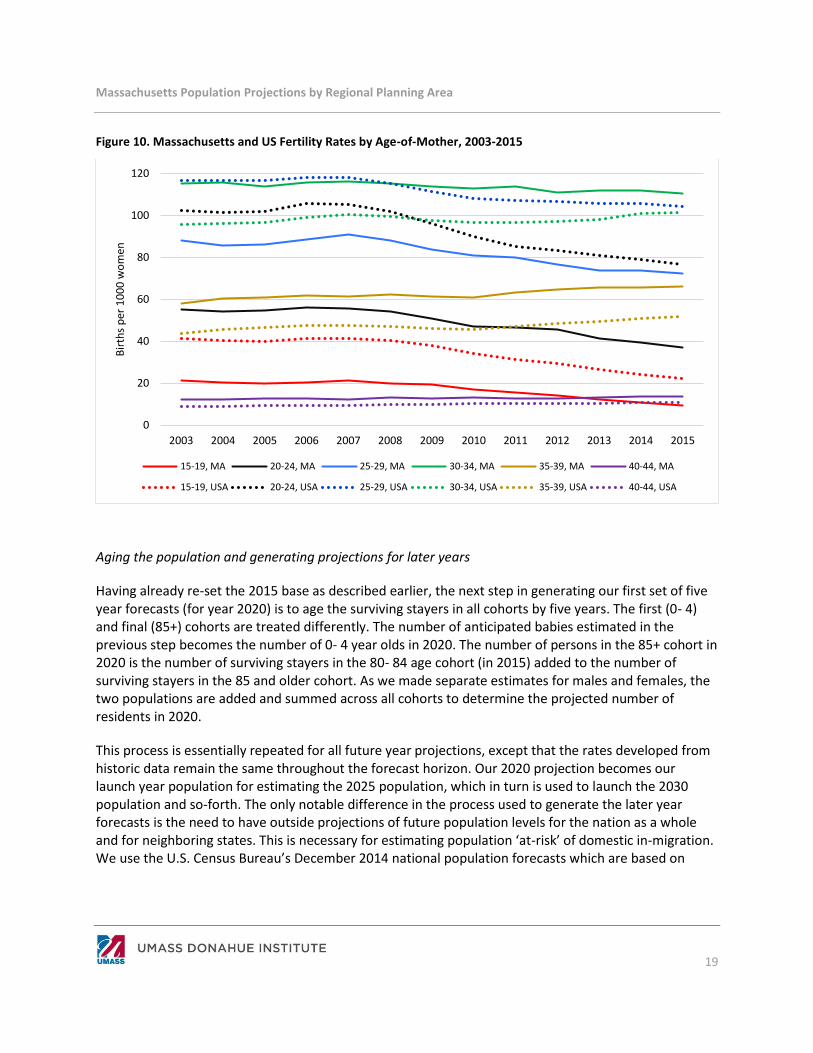
As with mortality, for the V2018 MassDOT projection series we also update births to reflect more recent fertility trends. We reviewed publicly available state-level births by age of mother over the 2003 through 2015 time series, the latest data we were able to obtain by age and sex.14 Figure 10 below displays changes in fertility by age for both Massachusetts and the U.S. from 2003 through 2015. Notably, fertility is declining significantly in the age cohorts that contribute the greatest number of births per thousand women – ages 20-24, 25-29, and 30-34. Teen births are also declining while most other age-cohorts remain relatively level in their rates. The only cohort showing a significant increase is the 35-39 cohort, indicating that women are postponing fertility now compared to previous years.
Here again, as with mortality, we next had to determine which period rates to average and project forward in our model. After discussion and an examination of the projected impact by region, the Projections Advisory Committee and the UMDI projections team agreed to use the most recent 5-year period of 2011-2015 as a basis for projecting forward, the same period we chose for mortality.
To apply these updates to our model, we calculate the percentage change in births per thousand by age between the averaged 2005-2009 rates already in our model and the updated averaged 2011-2015 rates. We then apply this percent change to births by age by region in our existing regional model. The updated births by age are then summed for all maternal cohorts in the region and added to the next period as aged 0-4 population, as described earlier in this section.
14 ibid
Massachusetts Population Projections by Regional Planning Area
19
Figure 10. Massachusetts and US Fertility Rates by Age-of-Mother, 2003-2015
0
20
40
60
80
100
120
2003 2004 2005 2006 2007 2008 2009 2010 2011 2012 2013 2014 2015
Bir
ths
per
10
00
wo
men
15-19, MA 20-24, MA 25-29, MA 30-34, MA 35-39, MA 40-44, MA
15-19, USA 20-24, USA 25-29, USA 30-34, USA 35-39, USA 40-44, USA
Aging the population and generating projections for later years
Having already re-set the 2015 base as described earlier, the next step in generating our first set of five year forecasts (for year 2020) is to age the surviving stayers in all cohorts by five years. The first (0- 4) and final (85+) cohorts are treated differently. The number of anticipated babies estimated in the previous step becomes the number of 0- 4 year olds in 2020. The number of persons in the 85+ cohort in 2020 is the number of surviving stayers in the 80- 84 age cohort (in 2015) added to the number of surviving stayers in the 85 and older cohort. As we made separate estimates for males and females, the two populations are added and summed across all cohorts to determine the projected number of residents in 2020.
This process is essentially repeated for all future year projections, except that the rates developed from historic data remain the same throughout the forecast horizon. Our 2020 projection becomes our launch year population for estimating the 2025 population, which in turn is used to launch the 2030 population and so-forth. The only notable difference in the process used to generate the later year forecasts is the need to have outside projections of future population levels for the nation as a whole and for neighboring states. This is necessary for estimating population ‘at-risk’ of domestic in-migration. We use the U.S. Census Bureau’s December 2014 national population forecasts which are based on

Massachusetts Population Projections by Regional Planning Area
20
information from the 2010 Decennial Census. 15 Unfortunately, the Census Bureau no longer generates detailed state-level long-term projections; their last state-level projections were developed in 2005. So for estimating future in-migrants from neighboring Northeast states, we use the state-level age/sex projections developed by the University of Virginia’s Weldon Cooper Center for Public Service16 (release 2013).
Municipal-Level Methods and Assumptions
MCD-Level Model Overview
Municipal, or “MCD-level” population projections served as stand-alone output products in the UMDI V2015 Long-Term Population Projections for Massachusetts Municipalities series (V2015). For the UMDI Vintage 2018 updated series for MA DOT (V2018), they serve multiple purposes. Primarily, the V2018 municipal age/sex projections are aggregated to form the regional age/sex projections for each MPO, each of which conforms to municipal boundaries. Also, while some MPOs created their own sub-regional population distributions based on local knowledge of new or anticipated development at the town-level, other MPOs were able to use the V2018 projections as they were. Finally, municipal age/sex projections were used as a basis for employment and household projections for some areas as part of the larger transportation planning process.
As described in the regional-level methods section of this report, separate projections are produced for the 351 MCDs and for the eight state sub-regions made up of aggregate PUMAs. The MCD results are then controlled to the corresponding projected regional cohorts to help smooth any inconsistences in the MCD-level results and to reflect migration trends that may be more accurately reflected by the regional projection methodology.17 While both of the regional and MCD-level projections are prepared using a cohort-component method, the MCD estimates rely on residual net migration rates computed from vital statistics, while the sub-region projections use gross domestic migration rates based on the American Community Survey Public Use Microdata (ACS PUMS).
The population aged five and over is projected by the mortality and migration methods, while the population age 0-4 is projected by the fertility method. The initial launch year is 2010, with projections made in five-year intervals from 2015 to 2035 using the previous projection as the new launch population. Projections for eighteen five-year age groups (0-4, 5-9 …80-84, and 85–and older) are reported for males and females. (Throughout this document, the term “age” refers to a five-year age cohort). The cohort-component method is used to account for the effects of mortality, migration, and
15 Source: http://www.census.gov/population/projections/ 16 Source: Population Projections by Age for the U.S. and States. Updated August 9, 2013. Weldon Cooper Center for Public
Service, University of Virginia. http://www.coopercenter.org/demographics/national-population-projections
17 The regional projection methodology, discussed at length in Section 3.A. of this report, projects domestic migration using migration data from the American Community Survey, therefore explicitly accounting for recent domestic migration trends. As explained in this section, the MCD methodology uses a “residual” method based on vital statistics to project migration.
Massachusetts Population Projections by Regional Planning Area
21
fertility on population change. For the V2018 series, the 2015 launch population by age, sex, and MCD is is first controlled to the U.S. Census Bureau’s Vintage 2016 population estimates by age, sex, and county for 2015 before launching to the 2020 projection.18
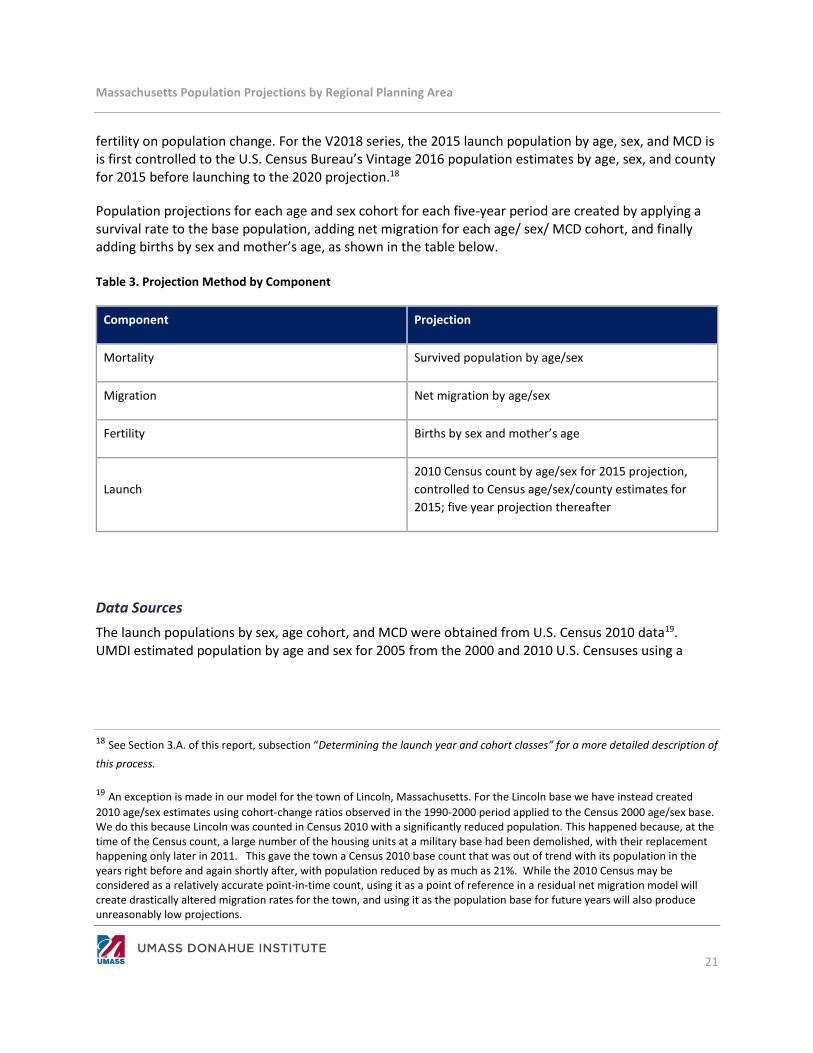
Population projections for each age and sex cohort for each five-year period are created by applying a survival rate to the base population, adding net migration for each age/ sex/ MCD cohort, and finally adding births by sex and mother’s age, as shown in the table below.
Table 3. Projection Method by Component
Component Projection
Mortality Survived population by age/sex
Migration Net migration by age/sex
Fertility Births by sex and mother’s age
Launch
2010 Census count by age/sex for 2015 projection,
controlled to Census age/sex/county estimates for
2015; five year projection thereafter
Data Sources
The launch populations by sex, age cohort, and MCD were obtained from U.S. Census 2010 data19. UMDI estimated population by age and sex for 2005 from the 2000 and 2010 U.S. Censuses using a
18 See Section 3.A. of this report, subsection “Determining the launch year and cohort classes” for a more detailed description of
this process.
19 An exception is made in our model for the town of Lincoln, Massachusetts. For the Lincoln base we have instead created
2010 age/sex estimates using cohort-change ratios observed in the 1990-2000 period applied to the Census 2000 age/sex base. We do this because Lincoln was counted in Census 2010 with a significantly reduced population. This happened because, at the time of the Census count, a large number of the housing units at a military base had been demolished, with their replacement happening only later in 2011. This gave the town a Census 2010 base count that was out of trend with its population in the years right before and again shortly after, with population reduced by as much as 21%. While the 2010 Census may be considered as a relatively accurate point-in-time count, using it as a point of reference in a residual net migration model will create drastically altered migration rates for the town, and using it as the population base for future years will also produce unreasonably low projections.
Massachusetts Population Projections by Regional Planning Area
22
simple linear interpolation by age and sex. The 2015 age/sex/MCD distributions were then controlled to the U.S. Census Bureau’s Vintage 2016 estimates of population by age, sex, and county. 20
UMDI requested and received confidential vital statistics data for births and deaths from January 1, 2000 through December 31, 2009 from the Massachusetts Department of Public Health. From these, UMDI estimated survival, birth and residual net migration rates.
MCD Projections Launch Population
Initial Launch Population
The initial launch population for the 2015 projection is the 2010 Census population by age/sex for each MCD21. Corrected census counts from the Count Question Resolution (CQR) program are incorporated where applicable. Each projection thereafter uses the previous projection as the launch population (i.e. the 2020 projection uses the 2015 projection as the launch population). As mentioned above, in the V2018 series, the projected 2015 launch population by age, sex, and MCD is controlled to the U.S. Census Bureau’s most recent county-level population estimates by age and sex for 2015 to create an updated launch population.22
MCD Projections: Mortality
Forward Cohort Survival Method
The forward cohort survival method is used to account for the mortality component of population change. This procedure applies five-year survival rates by age/sex to the launch population by age/sex for MCDs in order to survive their populations out five years, resulting in the expected population age five and over before accounting for migration.
Five-Year Survival Rates by Age/Sex
UMDI calculated five-year survival rates by age and sex using deaths by age, sex and MCD from 2000 to 2009 (January 1, 2000 through December 31, 2009). Survival rates by age, sex and MCD were assumed to be constant for the duration of the projections at the MCD level, but note that in the V2018 series
20 Annual Estimates of the Resident Population for Selected Age Groups by Sex for the United States, States, Counties, and Puerto Rico Commonwealth and Municipios: April 1, 2010 to July 1, 2016. (Table PEP_2016_PEPAGESEX). U.S. Census Bureau, Population Division. Release Date: June 22, 2017.
21 See footnote (above) on exception in the town of Lincoln.
22 Annual Estimates of the Resident Population for Selected Age Groups by Sex for the United States, States, Counties, and Puerto Rico Commonwealth and Municipios: April 1, 2010 to July 1, 2016. (Table PEP_2016_PEPAGESEX). U.S. Census Bureau, Population Division. Release Date: June 22, 2017.
Massachusetts Population Projections by Regional Planning Area
23
these rates are later adjusted at the regional level after MCDs are summed to their respective regions.23 Survival rates for each age cohort up to 80-84 were averaged with the next-older cohort to account for the fact that roughly half of each cohort would age into the next cohort over the course of each five-year period. The 85-and older cohort’s survival rate was used as-is, since there was no older cohort to average.
MCDs with smaller populations demonstrated a degree of variability in survival rates that we considered too broad for optimal results. Therefore, for MCDs with populations lower than 10,000 as of the 2000 Census, we used regional survival rates by age and sex instead of MCD-specific rates to smooth the results.
Survived Population for MCDs
The base population by age/sex for MCDs is survived to the next five-year projection by applying the corresponding averaged five-year survival rates by age/sex.
Key Assumptions
The methodology assumes that survival rates vary most significantly by age and sex. To some extent, the use of MCD-specific rates will also indirectly account for varying socioeconomic factors, including race and ethnicity, which vary by MCD and may affect survival rates. The methodology assumes that survival rates by age, sex and MCD will stay constant over the next 25 years.
MCD Projections: Migration
Residual Net Migration from Vital Statistics
The residual net migration method is used to account for the migration component of population change. “Residual” refers to the fact that migration is assumed to be responsible for past population change after accounting for births and deaths. This residual net migration is then used to estimate past migration rates. The procedure applies the resulting net migration rates by age/sex estimated for each MCD to the MCD’s survived population by age/sex in order to project net migration by age/sex for the population ages five and older. For the population ages 0-4, it is assumed that residence of infants will be determined by the migration of their birth mothers. For MCDs with 2000 Census population below 10,000, a linear migration assumption (described below) is used to smooth migration.
Determination of Net Migration Rates
Vital statistics are used to infer net migration totals for 2000 to 2009. In order to calculate five-year net migration by age, sex and MCD, natural increase (births minus deaths) by age/ sex for 2000 to 2005 is added to the 2000 population by age/ sex for each MCD. The results are then subtracted from the
23 See the regional methodology section of this report for additional detail.
Massachusetts Population Projections by Regional Planning Area
24
interpolated 2005 population by age/ sex for each MCD to estimate net migration by age/ sex and MCD for 2000 to 2005. A similar process calculates migration between 2005 and 2010.
For MCDs with 2000 population equal to or greater 10,000, the two five-year net migration estimates are averaged and rates are then calculated for each age, sex and MCD. The resulting rates are applied to the base population to project five-year net migration. The resulting average five-year net migration rates by age/sex are held constant throughout the projection period.
For MCDs with 2000 population under 10,000, five-year net migration by age, sex and MCD is held constant, and population cohorts are never allowed to go below zero. This avoids applying unrealistically high migration rates to small populations. For instance, if an MCD starts with four males aged 70-74 and net migration shows four more move in over five years, the result is a migration rate of 2. This results in highly variable and unrealistic results in some cases. In this example, holding migration linear means that in each five-year projection period, four males aged 70-74 will move into the MCD. UMDI conducted sensitivity testing for this method and found that the model with constant migration for small places in most cases resulted in more realistic, gradual population growth or decline, as well as more realistic sex and age profiles for these MCDs.
Key Assumptions
The use of a net migration rate relies on a base for migration that includes only current residents – in other words, only those at risk of out-migration. Nonresidents who are at risk of in-migration are not explicitly accounted for in the MCD method, and this results in some inaccuracy which is minimized by the process of controlling to regional total projections that are based on a gross migration model.
We assume that age, sex and MCD are the key factors by which migration rates vary. Other factors, including non-demographic factors such as macroeconomic factors or local policy changes, are not explicitly included in this model. Future projection models may incorporate these or other factors.
MCD Projections: Fertility
Vital Statistics Method
We apply age-specific fertility rates to the migrated female population by age to project births by age of mother, followed by survival rates for the population aged 0-4. Total survived births are then derived by summing across all maternal age groups, and the results represent the projected population age 0-4. For each MCD, the number of males and females is assumed to be the same as the proportion of male or female births statewide.
Fertility by Age of Mother
Average births by age of mother for each MCD are calculated for two five-year periods (2000 to 2005 and 2005 to 2010) using nine maternal age groups, from 10-14…50-54. As with mortality, in the V2018
Massachusetts Population Projections by Regional Planning Area
25
series fertility rates are adjusted at the regional level after MCDs are summed to their respective regions.24
Fertility Rates
Age-specific fertility rates are computed for each time period by dividing the average number of births by age of mother by the corresponding number of females of that age group. The average age-specific fertility rates are held constant throughout the projection period. The base population for launching a new five-year projection is the survived, post-migration projected female population by age.
MCDs with smaller populations demonstrated a degree of variability in fertility rates that we considered too broad for optimal results. Therefore, for MCDs with populations lower than 10,000 as of the 2000 Census, we used regional fertility rates by age and sex instead of MCD-specific rates to smooth the results25.
Key Assumptions
We assume age, sex and MCD to be adequate indicators of fertility rates for MCD for the first vintage projections. We assume that the proportion of male to female births does not vary significantly by geography or maternal age. We assume that fertility rates by maternal age and MCD will not change significantly over time. Future iterations of the projections may amend these assumptions based on available data.
Controlling to the Regional-level Projections
The resulting MCD-level projected cohorts are finally controlled to the regional-level projected cohorts. To do this, we assume that each MCD’s share of the region’s population, for each age and sex cohort, is given by the MCD population projections. Those shares are then applied to the regional projections to arrive at adjusted age/ sex cohorts for each MCD.
24 See the regional methodology section of this report for additional detail.
25 While MCDs with populations less than 10,000 are given the regional rate in this model, we make exception for “college
bedroom” towns. Because fertility rates are generally lower among females enrolled in college compared to the general
population of the same age group, applying regional fertility rates to small towns with high percentages of college-enrolled
population resulted in inflated births. We developed criteria for identifying “college bedroom” towns and applied town-specific
fertility rates to these instead of the regional rates. Criteria is: population under 10,000 in 2010; >20% of 18 and over female
population is enrolled in college or graduate school according to 2008-2012 ACS; and use of regional fertility rate resulted in a
≥25% Increase in the 0-4 age group from 2010 to 2015. The three MCDs subject to the “college bedroom” exception include
Wenham, Sunderland, and Williamstown.
Massachusetts Population Projections by Regional Planning Area
26
Alternative Model for Cape & Island Regions In the regional methodology section of this report, we discuss the limitations of using ACS data to calculate migration rates in small regions, specifically due to the small sample size available in the Census Public-Use Microdata Sample (PUMS) data, the only direct source of migration by age and sex available at the sub-state, regional level. Because the Cape and Island Region is one of the smallest study regions in the model, there are concerns about the margins of error associated with ACS rates by age/sex specifically for this region. In addition, this very small model region breaks out even further into three distinct MPO regions in the statewide travel model. Furthermore, in component data available through U.S. Census annual estimates, these three sub-regional MPOs display differing and sometimes opposite trends in fertility and migration.26 All of these reasons make this a challenging region to work with in our existing regional model, and caused concern over applying the UMDI V2018 statewide method to this unique region.
On a positive note, because these three Cape & Island MPO regions align with county boundaries - unlike other MPO regions around the state – we are able to access specific county-level data resources that are not available in other state regions not conforming to county boundaries. These county-level resources include both migration-by-age estimates from the University of Wisconsin and county-level fertility rates by age from vital statistics. Given both the challenges and data opportunities available in this region, the Projections Advisory Committee and UMDI decided to use an alternative method to model Cape & Island projections, completing distinct county-level estimates for each using the same basic framework.
For each Cape & Island County, including Barnstable, Dukes, and Nantucket, UMDI used a cohort-component model. This is the same model concept used statewide; we start with a base population to which we apply migration, fertility, and mortality rates by age and sex to estimate the next launch population, and then apply rates again. This process is repeated until we reach the end of the projection term.
Migration
The differences in the custom Cape models and the statewide V2018 method include the source and type of migration and source of fertility data. While in the statewide model we use a gross migration rates, estimating in, out, and net international migrants separately, for the Cape & Islands regions we instead use net migration rates, which combine in, out, and international migrants into one combined rate by age and sex. We obtain these rates from the University of Wisconsin, which uses decennial Census counts by age, sex, and county together with birth and death counts by age, sex, and county over
26 Population, population change and estimated components of population change: April 1, 2010 to July 1, 2016 (CO-EST2016-
alldata). U.S. Census Bureau, Population Division. Release Date: March 2017.

Massachusetts Population Projections by Regional Planning Area
27
the intercensal years to calculate residual net migrants by age, sex, and county.27 This removes concerns about error margins associated with ACS data for small areas, as rates instead are based on full count and complete vital statistics data instead of survey sample data. These 10-year migration rates by age and sex are first converted to 5-year rates in our application so that populations can be projected in 5-year intervals as in our statewide method. As with our statewide method, the first launch period is 2015. For the Cape & Island counties we use the Census Bureau’s latest annual estimates of population by age, sex, and county for 2015 without first needing to reallocate to regions as we do in the main model.28
Fertility and Survival
For fertility rates in the Cape & Island counties, we use the most specific fertility data we can obtain for each county.29 For Barnstable County, the largest of the Cape & Island counties, we are able to use county-specific fertility rates by age for 2011-2015.30 For Nantucket and Dukes counties, fertility rates by age are modeled using 5-year fertility rates by age from 2000-2009 specific to each county – which we calculated from town-level births by age for our V2015 series - that are then controlled to 5-year birth totals from 2011-2015 for each county. Note that current rates by age for Dukes and Nantucket are not available in the CDC Wonder datasets due to small cohort sizes.
Survival rates are used from UMDI V2015 Cape & Islands Region updated by percent changes in statewide rates, as with the statewide V2018 method. We need to revert to the regional rates in this instance because the specific county-level rates included too many "unreliable" rates by age in the 2011-2015 CDC Wonder datasets.
Customizations to the Cape & Island data sources resulted in projections that were slightly higher than the statewide method in the short term, and also showed a smoother age-cohort progression over time.
27 Age-Specific Net Migration Estimates for US Counties, 1950-2010. Applied Population Laboratory, University of Wisconsin- Madison, 2013. Web. [Downloaded 12/1/2017.] < http://www.netmigration.wisc.edu/>.
28 Annual Estimates of the Resident Population for Selected Age Groups by Sex for the United States, States, Counties, and Puerto Rico Commonwealth and Municipios: April 1, 2010 to July 1, 2016. (Table PEP_2016_PEPAGESEX). U.S. Census Bureau, Population Division. Release Date: June 22, 2017.
29 Source of births and deaths rates: United States Department of Health and Human Services (US DDHS) Centers for Disease Control and Prevention (CDC) National Center for Health Statistics (NCHS). See Data Sources Notes in Appendix B to this report for additional source detail.
30 except for maternal cohort aged 45-49, which we take UMDI V2015 Cape & Islands Region updated by % changes in statewide rates. Current Massachusetts and Barnstable rates are not available for this age group.
Massachusetts Population Projections by Regional Planning Area
28
Sources
Isserman, A. M. (1993). "The Right People, The Right Rates - Making Population Estimates with an Interregional Cohort-Component Model." Journal of the American Planning Association 59(1): 45-64.
Renski, H.C. and S. Strate. 2013. “Evaluating the migration component of county-level population estimates.” Journal of Planning Education and Research. 33(3), 325-335.
Smith, S., J. Tayman and D. Swanson. (2001) State and Local Population Projections: Methodology and Analysis. New York: Kluwer Academic. Ch. 3- 7.
.
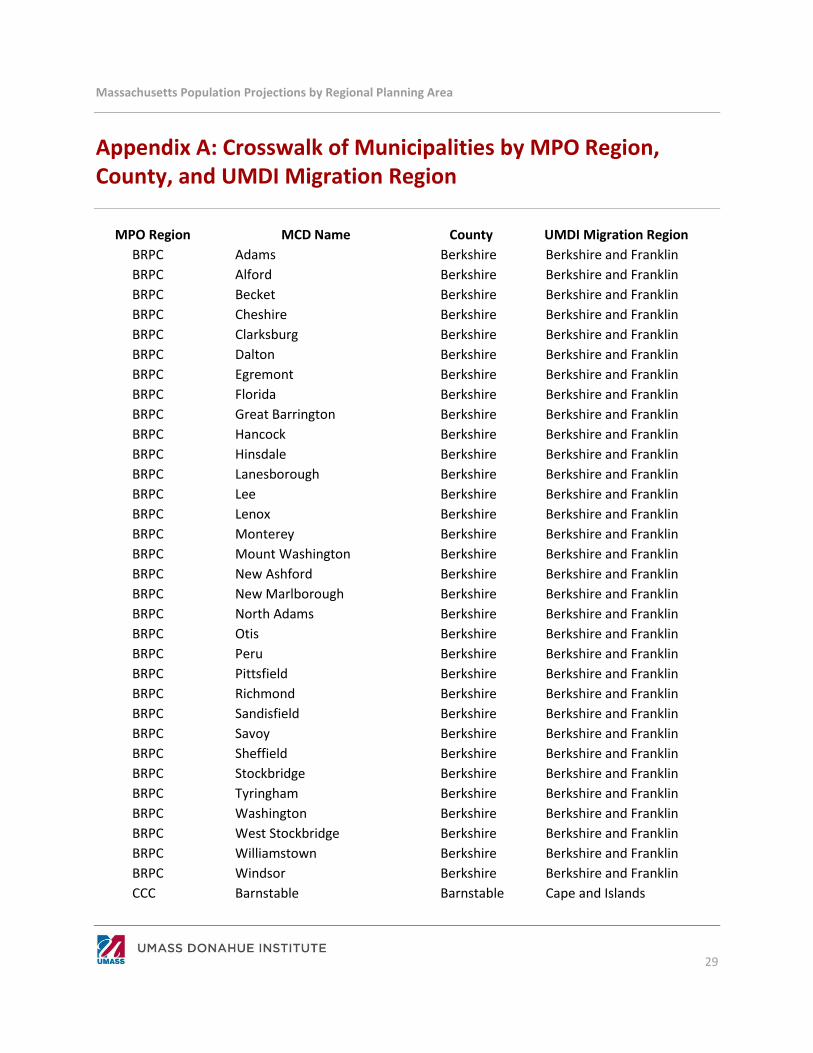
Massachusetts Population Projections by Regional Planning Area
29
Appendix A: Crosswalk of Municipalities by MPO Region, County, and UMDI Migration Region
MPO Region MCD Name County UMDI Migration Region
BRPC Adams Berkshire Berkshire and Franklin
BRPC Alford Berkshire Berkshire and Franklin
BRPC Becket Berkshire Berkshire and Franklin
BRPC Cheshire Berkshire Berkshire and Franklin
BRPC Clarksburg Berkshire Berkshire and Franklin
BRPC Dalton Berkshire Berkshire and Franklin
BRPC Egremont Berkshire Berkshire and Franklin
BRPC Florida Berkshire Berkshire and Franklin
BRPC Great Barrington Berkshire Berkshire and Franklin
BRPC Hancock Berkshire Berkshire and Franklin
BRPC Hinsdale Berkshire Berkshire and Franklin
BRPC Lanesborough Berkshire Berkshire and Franklin
BRPC Lee Berkshire Berkshire and Franklin
BRPC Lenox Berkshire Berkshire and Franklin
BRPC Monterey Berkshire Berkshire and Franklin
BRPC Mount Washington Berkshire Berkshire and Franklin
BRPC New Ashford Berkshire Berkshire and Franklin
BRPC New Marlborough Berkshire Berkshire and Franklin
BRPC North Adams Berkshire Berkshire and Franklin
BRPC Otis Berkshire Berkshire and Franklin
BRPC Peru Berkshire Berkshire and Franklin
BRPC Pittsfield Berkshire Berkshire and Franklin
BRPC Richmond Berkshire Berkshire and Franklin
BRPC Sandisfield Berkshire Berkshire and Franklin
BRPC Savoy Berkshire Berkshire and Franklin
BRPC Sheffield Berkshire Berkshire and Franklin
BRPC Stockbridge Berkshire Berkshire and Franklin
BRPC Tyringham Berkshire Berkshire and Franklin
BRPC Washington Berkshire Berkshire and Franklin
BRPC West Stockbridge Berkshire Berkshire and Franklin
BRPC Williamstown Berkshire Berkshire and Franklin
BRPC Windsor Berkshire Berkshire and Franklin
CCC Barnstable Barnstable Cape and Islands

Massachusetts Population Projections by Regional Planning Area
30
CCC Bourne Barnstable Cape and Islands
CCC Brewster Barnstable Cape and Islands
CCC Chatham Barnstable Cape and Islands
CCC Dennis Barnstable Cape and Islands
CCC Eastham Barnstable Cape and Islands
CCC Falmouth Barnstable Cape and Islands
CCC Harwich Barnstable Cape and Islands
CCC Mashpee Barnstable Cape and Islands
CCC Orleans Barnstable Cape and Islands
CCC Provincetown Barnstable Cape and Islands
CCC Sandwich Barnstable Cape and Islands
CCC Truro Barnstable Cape and Islands
CCC Wellfleet Barnstable Cape and Islands
CCC Yarmouth Barnstable Cape and Islands
CMRPC Auburn Worcester Central
CMRPC Barre Worcester Central
CMRPC Berlin Worcester MetroWest
CMRPC Blackstone Worcester MetroWest
CMRPC Boylston Worcester Central
CMRPC Brookfield Worcester Central
CMRPC Charlton Worcester Central
CMRPC Douglas Worcester Central
CMRPC Dudley Worcester Central
CMRPC East Brookfield Worcester Central
CMRPC Grafton Worcester Central
CMRPC Hardwick Worcester Berkshire and Franklin
CMRPC Holden Worcester Central
CMRPC Hopedale Worcester MetroWest
CMRPC Leicester Worcester Central
CMRPC Mendon Worcester MetroWest
CMRPC Millbury Worcester Central
CMRPC Millville Worcester MetroWest
CMRPC New Braintree Worcester Berkshire and Franklin
CMRPC North Brookfield Worcester Central
CMRPC Northborough Worcester Central
CMRPC Northbridge Worcester Central
CMRPC Oakham Worcester Central
CMRPC Oxford Worcester Central
CMRPC Paxton Worcester Central

Massachusetts Population Projections by Regional Planning Area
31
CMRPC Princeton Worcester Central
CMRPC Rutland Worcester Central
CMRPC Shrewsbury Worcester Central
CMRPC Southbridge Worcester Central
CMRPC Spencer Worcester Central
CMRPC Sturbridge Worcester Central
CMRPC Sutton Worcester Central
CMRPC Upton Worcester MetroWest
CMRPC Uxbridge Worcester Central
CMRPC Warren Worcester Central
CMRPC Webster Worcester Central
CMRPC West Boylston Worcester Central
CMRPC West Brookfield Worcester Central
CMRPC Westborough Worcester Central
CMRPC Worcester Worcester Central
FRCOG Ashfield Franklin Berkshire and Franklin
FRCOG Bernardston Franklin Berkshire and Franklin
FRCOG Buckland Franklin Berkshire and Franklin
FRCOG Charlemont Franklin Berkshire and Franklin
FRCOG Colrain Franklin Berkshire and Franklin
FRCOG Conway Franklin Berkshire and Franklin
FRCOG Deerfield Franklin Berkshire and Franklin
FRCOG Erving Franklin Berkshire and Franklin
FRCOG Gill Franklin Berkshire and Franklin
FRCOG Greenfield Franklin Berkshire and Franklin
FRCOG Hawley Franklin Berkshire and Franklin
FRCOG Heath Franklin Berkshire and Franklin
FRCOG Leverett Franklin Berkshire and Franklin
FRCOG Leyden Franklin Berkshire and Franklin
FRCOG Monroe Franklin Berkshire and Franklin
FRCOG Montague Franklin Berkshire and Franklin
FRCOG New Salem Franklin Berkshire and Franklin
FRCOG Northfield Franklin Berkshire and Franklin
FRCOG Orange Franklin Berkshire and Franklin
FRCOG Rowe Franklin Berkshire and Franklin
FRCOG Shelburne Franklin Berkshire and Franklin
FRCOG Shutesbury Franklin Berkshire and Franklin
FRCOG Sunderland Franklin Lower Pioneer Valley
FRCOG Warwick Franklin Berkshire and Franklin
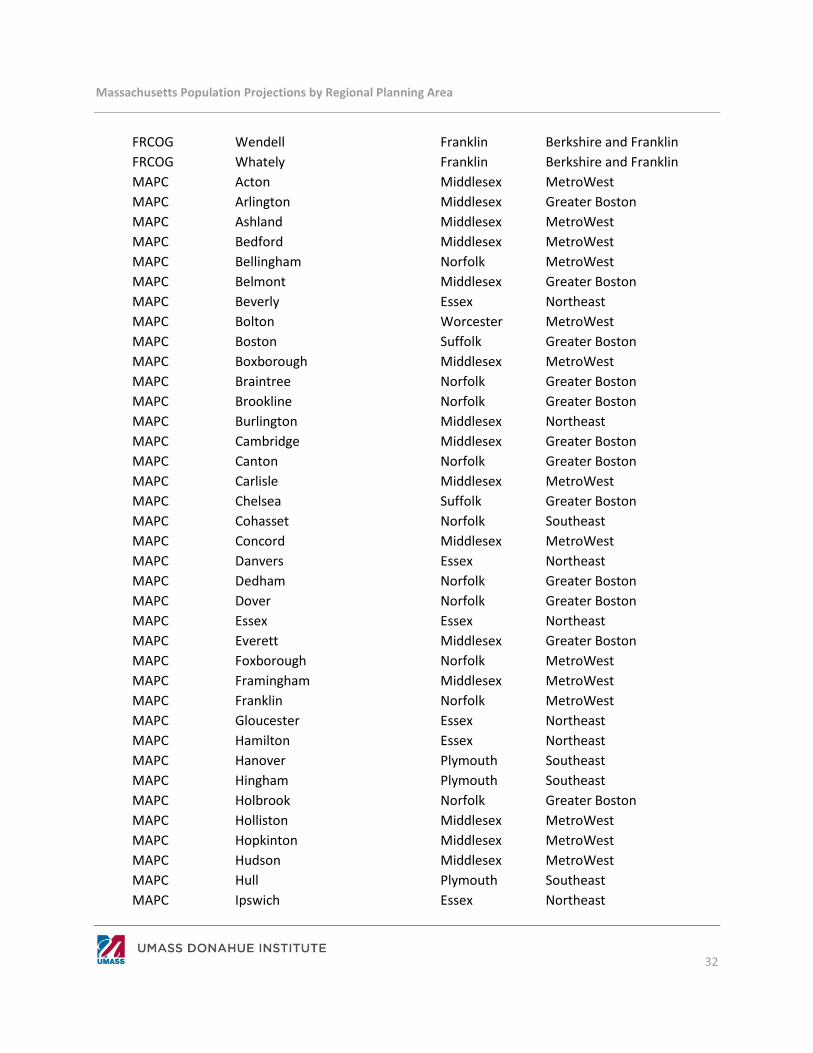
Massachusetts Population Projections by Regional Planning Area
32
FRCOG Wendell Franklin Berkshire and Franklin
FRCOG Whately Franklin Berkshire and Franklin
MAPC Acton Middlesex MetroWest
MAPC Arlington Middlesex Greater Boston
MAPC Ashland Middlesex MetroWest
MAPC Bedford Middlesex MetroWest
MAPC Bellingham Norfolk MetroWest
MAPC Belmont Middlesex Greater Boston
MAPC Beverly Essex Northeast
MAPC Bolton Worcester MetroWest
MAPC Boston Suffolk Greater Boston
MAPC Boxborough Middlesex MetroWest
MAPC Braintree Norfolk Greater Boston
MAPC Brookline Norfolk Greater Boston
MAPC Burlington Middlesex Northeast
MAPC Cambridge Middlesex Greater Boston
MAPC Canton Norfolk Greater Boston
MAPC Carlisle Middlesex MetroWest
MAPC Chelsea Suffolk Greater Boston
MAPC Cohasset Norfolk Southeast
MAPC Concord Middlesex MetroWest
MAPC Danvers Essex Northeast
MAPC Dedham Norfolk Greater Boston
MAPC Dover Norfolk Greater Boston
MAPC Essex Essex Northeast
MAPC Everett Middlesex Greater Boston
MAPC Foxborough Norfolk MetroWest
MAPC Framingham Middlesex MetroWest
MAPC Franklin Norfolk MetroWest
MAPC Gloucester Essex Northeast
MAPC Hamilton Essex Northeast
MAPC Hanover Plymouth Southeast
MAPC Hingham Plymouth Southeast
MAPC Holbrook Norfolk Greater Boston
MAPC Holliston Middlesex MetroWest
MAPC Hopkinton Middlesex MetroWest
MAPC Hudson Middlesex MetroWest
MAPC Hull Plymouth Southeast
MAPC Ipswich Essex Northeast
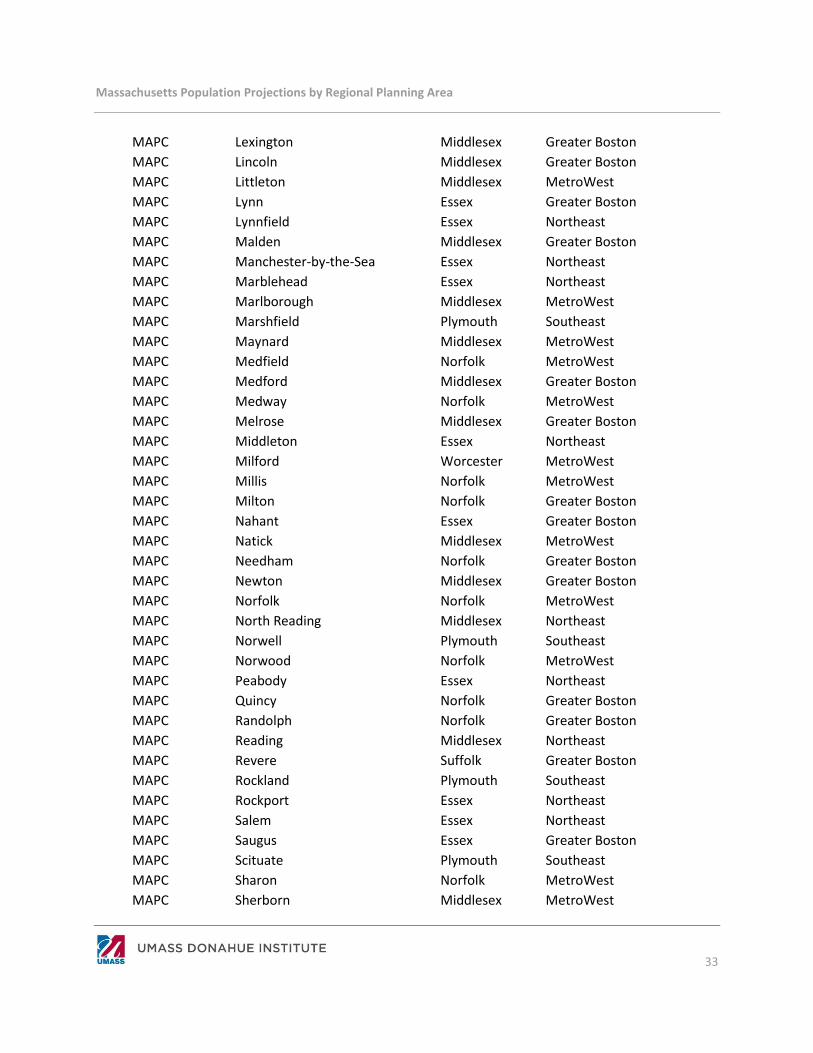
Massachusetts Population Projections by Regional Planning Area
33
MAPC Lexington Middlesex Greater Boston
MAPC Lincoln Middlesex Greater Boston
MAPC Littleton Middlesex MetroWest
MAPC Lynn Essex Greater Boston
MAPC Lynnfield Essex Northeast
MAPC Malden Middlesex Greater Boston
MAPC Manchester-by-the-Sea Essex Northeast
MAPC Marblehead Essex Northeast
MAPC Marlborough Middlesex MetroWest
MAPC Marshfield Plymouth Southeast
MAPC Maynard Middlesex MetroWest
MAPC Medfield Norfolk MetroWest
MAPC Medford Middlesex Greater Boston
MAPC Medway Norfolk MetroWest
MAPC Melrose Middlesex Greater Boston
MAPC Middleton Essex Northeast
MAPC Milford Worcester MetroWest
MAPC Millis Norfolk MetroWest
MAPC Milton Norfolk Greater Boston
MAPC Nahant Essex Greater Boston
MAPC Natick Middlesex MetroWest
MAPC Needham Norfolk Greater Boston
MAPC Newton Middlesex Greater Boston
MAPC Norfolk Norfolk MetroWest
MAPC North Reading Middlesex Northeast
MAPC Norwell Plymouth Southeast
MAPC Norwood Norfolk MetroWest
MAPC Peabody Essex Northeast
MAPC Quincy Norfolk Greater Boston
MAPC Randolph Norfolk Greater Boston
MAPC Reading Middlesex Northeast
MAPC Revere Suffolk Greater Boston
MAPC Rockland Plymouth Southeast
MAPC Rockport Essex Northeast
MAPC Salem Essex Northeast
MAPC Saugus Essex Greater Boston
MAPC Scituate Plymouth Southeast
MAPC Sharon Norfolk MetroWest
MAPC Sherborn Middlesex MetroWest
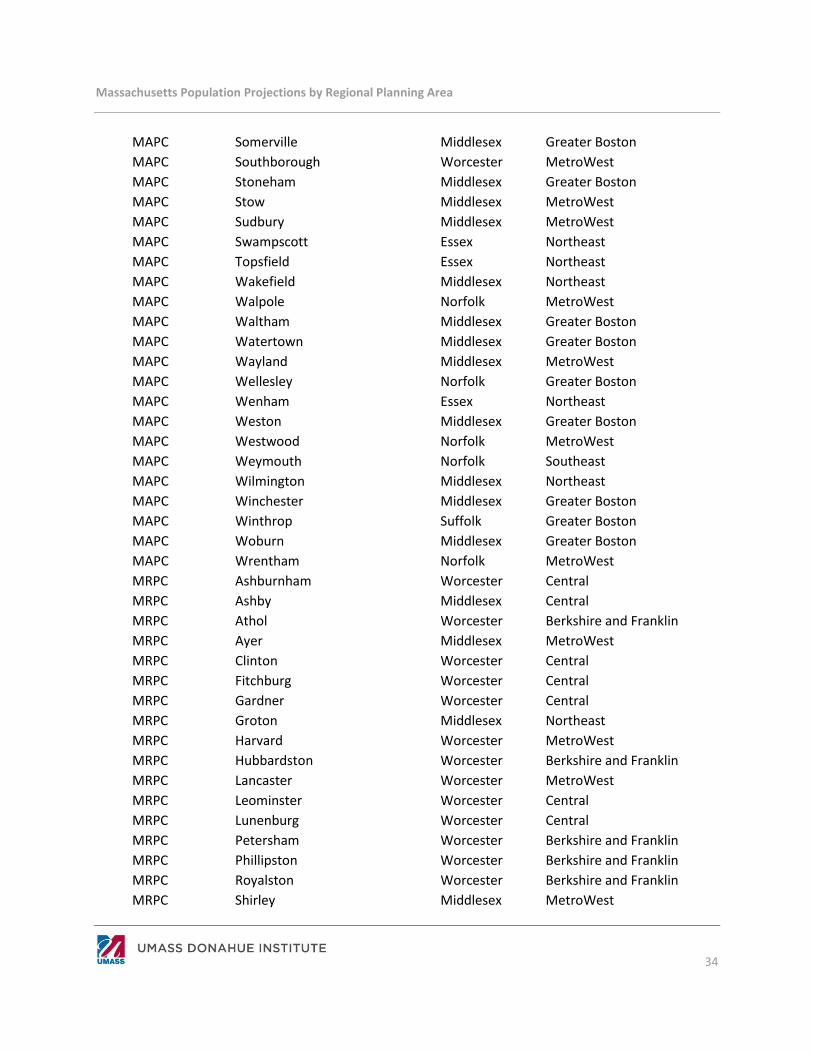
Massachusetts Population Projections by Regional Planning Area
34
MAPC Somerville Middlesex Greater Boston
MAPC Southborough Worcester MetroWest
MAPC Stoneham Middlesex Greater Boston
MAPC Stow Middlesex MetroWest
MAPC Sudbury Middlesex MetroWest
MAPC Swampscott Essex Northeast
MAPC Topsfield Essex Northeast
MAPC Wakefield Middlesex Northeast
MAPC Walpole Norfolk MetroWest
MAPC Waltham Middlesex Greater Boston
MAPC Watertown Middlesex Greater Boston
MAPC Wayland Middlesex MetroWest
MAPC Wellesley Norfolk Greater Boston
MAPC Wenham Essex Northeast
MAPC Weston Middlesex Greater Boston
MAPC Westwood Norfolk MetroWest
MAPC Weymouth Norfolk Southeast
MAPC Wilmington Middlesex Northeast
MAPC Winchester Middlesex Greater Boston
MAPC Winthrop Suffolk Greater Boston
MAPC Woburn Middlesex Greater Boston
MAPC Wrentham Norfolk MetroWest
MRPC Ashburnham Worcester Central
MRPC Ashby Middlesex Central
MRPC Athol Worcester Berkshire and Franklin
MRPC Ayer Middlesex MetroWest
MRPC Clinton Worcester Central
MRPC Fitchburg Worcester Central
MRPC Gardner Worcester Central
MRPC Groton Middlesex Northeast
MRPC Harvard Worcester MetroWest
MRPC Hubbardston Worcester Berkshire and Franklin
MRPC Lancaster Worcester MetroWest
MRPC Leominster Worcester Central
MRPC Lunenburg Worcester Central
MRPC Petersham Worcester Berkshire and Franklin
MRPC Phillipston Worcester Berkshire and Franklin
MRPC Royalston Worcester Berkshire and Franklin
MRPC Shirley Middlesex MetroWest

Massachusetts Population Projections by Regional Planning Area
35
MRPC Sterling Worcester Central
MRPC Templeton Worcester Central
MRPC Townsend Middlesex MetroWest
MRPC Westminster Worcester Central
MRPC Winchendon Worcester Central
MVC Aquinnah Dukes Cape and Islands
MVC Chilmark Dukes Cape and Islands
MVC Edgartown Dukes Cape and Islands
MVC Gosnold Dukes Cape and Islands
MVC Oak Bluffs Dukes Cape and Islands
MVC Tisbury Dukes Cape and Islands
MVC West Tisbury Dukes Cape and Islands
MVPC Amesbury Essex Northeast
MVPC Andover Essex Northeast
MVPC Boxford Essex Northeast
MVPC Georgetown Essex Northeast
MVPC Groveland Essex Northeast
MVPC Haverhill Essex Northeast
MVPC Lawrence Essex Northeast
MVPC Merrimac Essex Northeast
MVPC Methuen Essex Northeast
MVPC Newbury Essex Northeast
MVPC Newburyport Essex Northeast
MVPC North Andover Essex Northeast
MVPC Rowley Essex Northeast
MVPC Salisbury Essex Northeast
MVPC West Newbury Essex Northeast
NMCOG Billerica Middlesex Northeast
NMCOG Chelmsford Middlesex Northeast
NMCOG Dracut Middlesex Northeast
NMCOG Dunstable Middlesex Northeast
NMCOG Lowell Middlesex Northeast
NMCOG Pepperell Middlesex Northeast
NMCOG Tewksbury Middlesex Northeast
NMCOG Tyngsborough Middlesex Northeast
NMCOG Westford Middlesex Northeast
NPEDC Nantucket Nantucket Cape and Islands
OCPC Abington Plymouth Southeast
OCPC Avon Norfolk Southeast
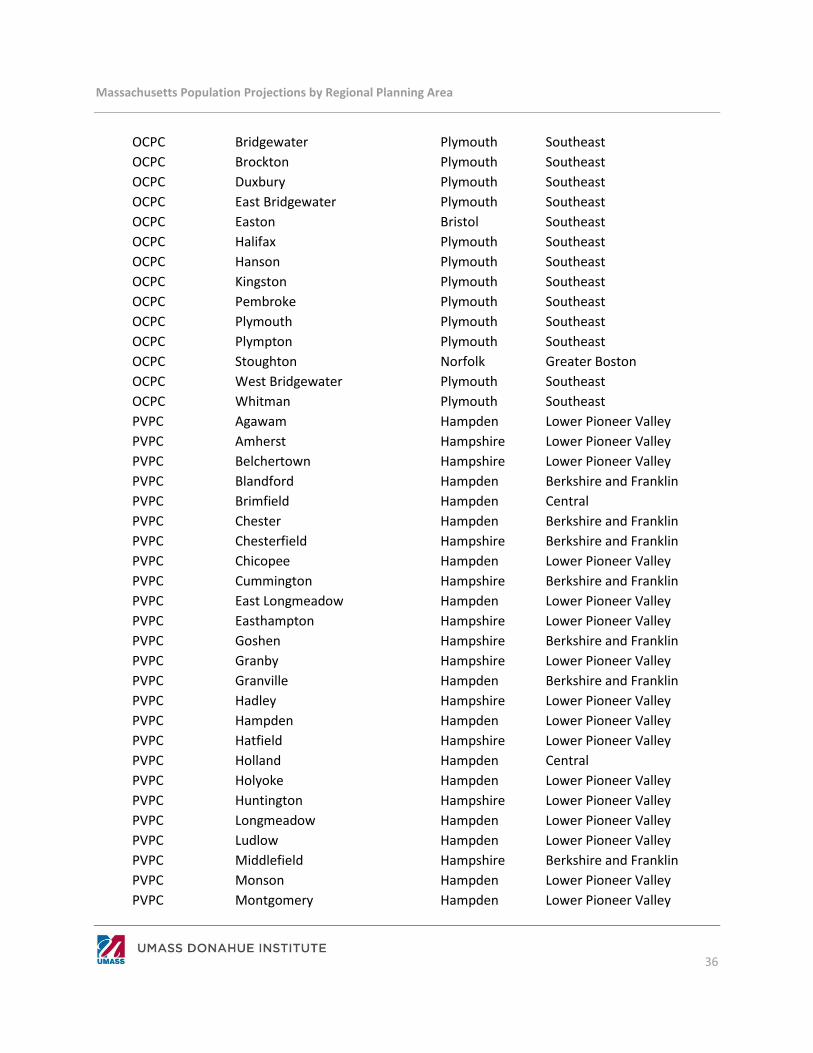
Massachusetts Population Projections by Regional Planning Area
36
OCPC Bridgewater Plymouth Southeast
OCPC Brockton Plymouth Southeast
OCPC Duxbury Plymouth Southeast
OCPC East Bridgewater Plymouth Southeast
OCPC Easton Bristol Southeast
OCPC Halifax Plymouth Southeast
OCPC Hanson Plymouth Southeast
OCPC Kingston Plymouth Southeast
OCPC Pembroke Plymouth Southeast
OCPC Plymouth Plymouth Southeast
OCPC Plympton Plymouth Southeast
OCPC Stoughton Norfolk Greater Boston
OCPC West Bridgewater Plymouth Southeast
OCPC Whitman Plymouth Southeast
PVPC Agawam Hampden Lower Pioneer Valley
PVPC Amherst Hampshire Lower Pioneer Valley
PVPC Belchertown Hampshire Lower Pioneer Valley
PVPC Blandford Hampden Berkshire and Franklin
PVPC Brimfield Hampden Central
PVPC Chester Hampden Berkshire and Franklin
PVPC Chesterfield Hampshire Berkshire and Franklin
PVPC Chicopee Hampden Lower Pioneer Valley
PVPC Cummington Hampshire Berkshire and Franklin
PVPC East Longmeadow Hampden Lower Pioneer Valley
PVPC Easthampton Hampshire Lower Pioneer Valley
PVPC Goshen Hampshire Berkshire and Franklin
PVPC Granby Hampshire Lower Pioneer Valley
PVPC Granville Hampden Berkshire and Franklin
PVPC Hadley Hampshire Lower Pioneer Valley
PVPC Hampden Hampden Lower Pioneer Valley
PVPC Hatfield Hampshire Lower Pioneer Valley
PVPC Holland Hampden Central
PVPC Holyoke Hampden Lower Pioneer Valley
PVPC Huntington Hampshire Lower Pioneer Valley
PVPC Longmeadow Hampden Lower Pioneer Valley
PVPC Ludlow Hampden Lower Pioneer Valley
PVPC Middlefield Hampshire Berkshire and Franklin
PVPC Monson Hampden Lower Pioneer Valley
PVPC Montgomery Hampden Lower Pioneer Valley

Massachusetts Population Projections by Regional Planning Area
37
PVPC Northampton Hampshire Lower Pioneer Valley
PVPC Palmer Hampden Lower Pioneer Valley
PVPC Pelham Hampshire Berkshire and Franklin
PVPC Plainfield Hampshire Berkshire and Franklin
PVPC Russell Hampden Lower Pioneer Valley
PVPC South Hadley Hampshire Lower Pioneer Valley
PVPC Southampton Hampshire Lower Pioneer Valley
PVPC Southwick Hampden Lower Pioneer Valley
PVPC Springfield Hampden Lower Pioneer Valley
PVPC Tolland Hampden Berkshire and Franklin
PVPC Wales Hampden Central
PVPC Ware Hampshire Lower Pioneer Valley
PVPC West Springfield Hampden Lower Pioneer Valley
PVPC Westfield Hampden Lower Pioneer Valley
PVPC Westhampton Hampshire Berkshire and Franklin
PVPC Wilbraham Hampden Lower Pioneer Valley
PVPC Williamsburg Hampshire Lower Pioneer Valley
PVPC Worthington Hampshire Berkshire and Franklin
SRPEDD Acushnet Bristol Southeast
SRPEDD Attleboro Bristol Southeast
SRPEDD Berkley Bristol Southeast
SRPEDD Carver Plymouth Southeast
SRPEDD Dartmouth Bristol Southeast
SRPEDD Dighton Bristol Southeast
SRPEDD Fairhaven Bristol Southeast
SRPEDD Fall River Bristol Southeast
SRPEDD Freetown Bristol Southeast
SRPEDD Lakeville Plymouth Southeast
SRPEDD Mansfield Bristol Southeast
SRPEDD Marion Plymouth Southeast
SRPEDD Mattapoisett Plymouth Southeast
SRPEDD Middleborough Plymouth Southeast
SRPEDD New Bedford Bristol Southeast
SRPEDD North Attleborough Bristol Southeast
SRPEDD Norton Bristol Southeast
SRPEDD Plainville Norfolk MetroWest
SRPEDD Raynham Bristol Southeast
SRPEDD Rehoboth Bristol Southeast
SRPEDD Rochester Plymouth Southeast

Massachusetts Population Projections by Regional Planning Area
38
SRPEDD Seekonk Bristol Southeast
SRPEDD Somerset Bristol Southeast
SRPEDD Swansea Bristol Southeast
SRPEDD Taunton Bristol Southeast
SRPEDD Wareham Plymouth Southeast
SRPEDD Westport Bristol Southeast
Massachusetts Population Projections by Regional Planning Area
39
Appendix B: Data Source Notes on Fertility and Mortality
Fertility
Statewide yearly fertility rates for cohorts 15-19 years, 20-24 years, 25-29 years, 30-34 years, 35-39 years, and 40-44 years in Massachusetts are sourced from WONDER data (SEE CITATION) and averaged to create 5-year fertility rates for 2005-2009 and 2011-2015 for each cohort. USA data is used for cohorts 10-14 and 45-49 years, due to lack of available statewide data. The ratio of the 2011-2015 rate over the 2005-2009 rate for each cohort was used as a multiplier to adjust births from 2009 levels within the model. No fertility data were available for the 50-59-year cohort, so fertility rates were not altered from the 2005-2009 model.
2005-2006 Massachusetts data from United States Department of Health and Human Services (US DDHS) Centers for Disease Control and Prevention (CDC) National Center for Health Statistics (NCHS) “Natality Public-use data 2003-2006” on CDC WONDER Online Database, March 2009. Accessed at http://wonder.cdc.gov/natality-v2006.html.
2007-2015 Massachusetts data from US DDHS CDC NCHS “Natality Public-use data 2007-2015” on CDC WONDER Online Database, February 2017. Accessed at http://wonder.cdc.gov/natality-current.html.
USA data from US DDHS CDC NCHS “The Public Use Natality File—2015 Update” Accessed at ftp://ftp.cdc.gov/pub/Health_Statistics/NCHS/Dataset_Documentation/DVS/natality/UserGuide2015.pdf
Mortality
Because of how data is organized by age in the data available to us, two CDC datasets were used for informing the model. These datasets come from the same source of raw data, but have differently amalgamated cohorts, as well as other health and demographic details, for use in various health related analyses. These are the Compressed Mortality file and Multiple Cause of Death Files.
For cohorts 0-4, 5-9, 10-14, 15-19, 20-24, and 85+ Compressed Mortality data are used. Within this dataset, death rates are flagged as “unreliable” when the rate is calculated from fewer than 20 deaths. This occurred in several years for cohorts 14 years and younger for both sexes. However, because we calculated 5-year average mortality rates for 2005-2009 and 2011-2015, and the fact that there were so few deaths overall for these cohorts, we used the information gleaned from these rates in the model. For all other cohorts, the Multiple Cause of Death 1999-2015 dataset is used. For all mortality rates, except cohort 0-4, a 5-year average of annual mortality rates provided by the appropriate data set over the 2005-2009 and 2011-2015 time periods were calculated for each sex. Mortality rates if cohort 0-4 was calculated by UMDI from the total deaths of the 0-4 population divided by the sum of the 0-4 population for the 2005-2009 and 2011-2015 time periods. The ratio of 2011-2015 over 2005-2009 for each sex and age cohort was calculated and used as a multiplier to adjust deaths from 2009 levels within the model.

Massachusetts Population Projections by Regional Planning Area
40
Compressed: Centers for Disease Control and Prevention, National Center for Health Statistics. Compressed Mortality File. 1999-2015 on CDC WONDER Online Database, released December 2016. Data are from the Compressed Mortality File 1999-2015 Series 20 No. 2U, 2016, as compiled from data provided by the 57 vital statistics jurisdictions through the Vital Statistics Cooperative Program. Accessed at http://wonder.cdc.gov/cmf-icd10.html on Sep 18, 2017.
Multiple: Centers for Disease Control and Prevention, National Center for Health Statistics. Multiple Cause of Death 1999-2015 on CDC WONDER Online Database, released December, 2016. Data are from the Multiple Cause of Death Files, 1999-2015, as compiled from data provided by the 57 vital statistics jurisdictions through the Vital Statistics Cooperative Program. Accessed at http://wonder.cdc.gov/mcd-icd10.html on Jul 5, 2017.