masshunter workstation software quantitative analysis (for ... · the familiarization guide...
TRANSCRIPT

Agilent MassHunter Workstation SoftwareQuantitative Analysis (for K6460 and K6420)
Familiarization GuideFor In Vitro Diagnostic Use
The K6460 and K6420 mass spectrometers are intended to be used to identify inorganic or organic compounds in human specimens by ionizing the compounds and separating the resulting ions by means of electrical field according to their mass.

NoticesManual Part NumberK3335-90008 Revision AMay 2018
Copyright© Agilent Technologies, Inc. 2018
No part of this manual may be reproduced in any form or by any means (including electronic storage and retrieval or translation into a foreign language) without prior agreement and written consent from Agilent Technologies, Inc. as governed by United States and international copyright laws.
Agilent Technologies, Inc.5301 Stevens Creek Blvd. Santa Clara, CA USA 95051
WarrantyThe material contained in this document is provided “as is,” and is subject to being changed, without notice, in future editions. Further, to the maximum extent permitted by applicable law, Agilent disclaims all warranties, either express or implied, with regard to this manual and any information contained herein, including but not limited to the implied warranties of merchantability and fitness for a particular purpose. Agilent shall not be liable for errors or for incidental or consequential damages in connection with the furnishing, use, or performance of this document or of any information contained herein. Should Agilent and the user have a separate written agreement with warranty terms covering the material in this document that conflict with these terms, the warranty terms in the separate agreement shall control.
Technology Licenses The hardware and/or software described in this document are furnished under a license and may be used or copied only in accordance with the terms of such license.
Restricted Rights LegendU.S. Government Restricted Rights. Software and technical data rights granted to the federal government include only those rights customarily provided to end user customers. Agilent provides this customary commercial license in Software and technical data pursuant to FAR 12.211 (Technical Data) and 12.212 (Computer Software) and, for the Department of Defense, DFARS 252.227-7015 (Technical Data - Commercial Items) and DFARS 227.7202-3 (Rights in Commercial Computer Software or Computer Software Documentation).
Safety Notices
CAUTION
A CAUTION notice denotes a hazard. It calls attention to an operating procedure, practice, or the like that, if not correctly performed or adhered to, could result in damage to the product or loss of important data. Do not proceed beyond a CAUTION notice until the indicated conditions are fully understood and met.
WARNING
A WARNING notice denotes a hazard. It calls attention to an operating procedure, practice, or the like that, if not correctly performed or adhered to, could result in personal injury or death. Do not proceed beyond a WARNING notice until the indicated conditions are fully understood and met.
Software RevisionThis guide is valid for the B.08.01 revision of the Agilent MassHunter Workstation Software Quantitative Analysis program.
Manufactured for:
Agilent Technologies Inc.5301 Stevens Creek Blvd.Santa Clara CA, 95051 USA

MassHunter Qualitative Analysis (K6460 and K6420) Familiarization Guide 3
In this Guide...The Familiarization Guide presents step-by-step exercises to help you learn to use the Quantitative Analysis program for a K6460 or K6420 instrument. You can do these exercises with the demo batches QuantExamples or with data you acquire.
1 Set Up and Quantitate a Batch of Acquired MRM Data Files
In this exercise, you set up a batch table, a quantitation method, and target compounds using acquired data files, then analyze the batch and save the results.
2 Review Quantitation Results
In this exercise, you inspect the sample and compound data in a batch file, customize layouts, and export your batch results to a Microsoft Excel file.
3 Use Tools to Evaluate Results
The tools in this exercise make it easier for you to evaluate and obtain more accurate quantitation results.
4 Work With Quantitation Reports
In this exercise, you generate reports using specified templates, and then review these reports in Microsoft Excel.
5 Reference
This section provides an overview of the special features of Quantitative Analysis.
This page intentionally left blank.
4 MassHunter Qualitative Analysis (K6460 and K6420) Familiarization Guide

MassHunter Qualitative Analysis (K6460 and K6420) Familiarization Guide 5
Content
1 Exercise 1– Set Up and Quantitate a Batch of Acquired MRM Data Files 7
Task 1. Set Up a New Batch 9Task 2. Set Up a New Method for the Batch 12Task 3. Set Up Target Compounds 15Task 4. Set Up Quantitation 18Task 5. Set the Integrator 24Task 6. Analyze and Save the Batch 26
2 Exercise 2 – Review Quantitation Results 27
Task 1. Explore the Batch Table Results 28Task 2. Change Result Window Layouts 32Task 3. Export and Print Results 39
3 Exercise 3 – Use Three Tools to Evaluate Results 43
Task 1. Adjust the Calibration Curve Fit 44Task 2. Integrate Without Parameters 46Task 3. Detect Outliers 61
4 Exercise 4 – Generate Quantitation Reports 65
Task 1. Create report methods 66Task 2. Generate the report 69
5 Reference 71
Ten Main Capabilities 72Quantitative Methods 76Parameter-Free Integrator 77Batch-at-a-Glance: Results 79Compounds-at-a-Glance 80Compound Confirmation 82Compound Calibration 83

6 MassHunter Qualitative Analysis (K6460 and K6420) Familiarization Guide
This page intentionally left blank.

1 Exercise 1– Set Up and Quantitate a Batch of Acquired MRM Data FilesTask 1. Set Up a New Batch 9Task 2. Set Up a New Method for the Batch 12Task 3. Set Up Target Compounds 15Task 4. Set Up Quantitation 18Task 5. Set the Integrator 24Task 6. Analyze and Save the Batch 26
In this exercise, set up a quantitation method for a batch of acquired data files. Carry out the exercise with the QuantExamples data files from the Resources media, and learn how to perform the following tasks:• Set up a Batch Table containing unknown sample and calibration data files.• Set up a new quantitation method based on the calibration standard of the
highest concentration.• Set up target compounds.
• View the MRM transitions and chromatographic parameters for the compounds in the data file.
• Set up an internal standard for each of the compounds.• Set up quantitation for the method.
• Create levels from calibration samples.• Set up qualifier ions and the calibration curve.
• Quantitate the batch, and save the results.
MassHunter Qualitative Analysis (K6460 and K6420) Familiarization Guide 7
1 Exercise 1– Set Up and Quantitate a Batch of Acquired MRM Data Files
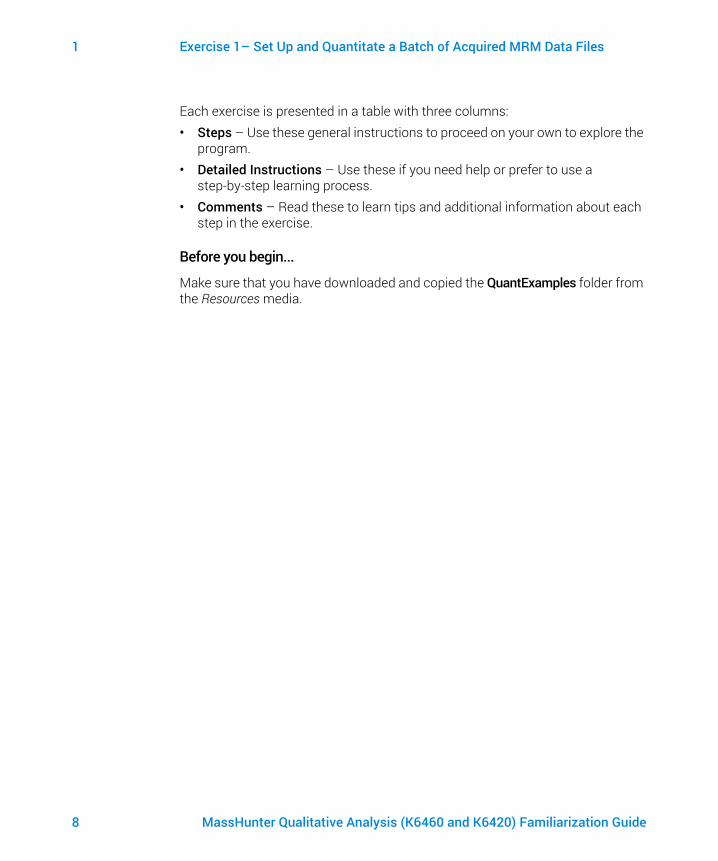
Each exercise is presented in a table with three columns:• Steps – Use these general instructions to proceed on your own to explore the
program.• Detailed Instructions – Use these if you need help or prefer to use a
step-by-step learning process.• Comments – Read these to learn tips and additional information about each
step in the exercise.
Before you begin...
Make sure that you have downloaded and copied the QuantExamples folder from the Resources media.
8 MassHunter Qualitative Analysis (K6460 and K6420) Familiarization Guide

1 Exercise 1– Set Up and Quantitate a Batch of Acquired MRM Data FilesTask 1. Set Up a New Batch
Task 1. Set Up a New Batch
In this task, set up a Batch Table containing data files for four unknown samples and several calibration samples: Compound-A, Compound-B, Compound-C, and Compound-D.
Step Detailed instructions Comments
1 Create a new batch to hold samples.• Select all of the data files from the
QuantExamples folder.• Name the batch file, iii_test_01,
where the letters“iii” are your initials.
a To start the Quantitative Analysis program, click Quantitative Analysis (QQQ) on your Desktop. When you first use the program, the default layout appears, as shown in Figure 1.
• You can also click Start > Agilent MassHunter Quantitative > Quantitative Analysis (Windows 10) or Start > Programs > Agilent > MassHunter Workstation > Quantitative Analysis (QQQ) (Windows 7).
• Different features are available when you are working with QQQ data.
Figure 1. Default layout
MassHunter Qualitative Analysis (K6460 and K6420) Familiarization Guide 9

1 Exercise 1– Set Up and Quantitate a Batch of Acquired MRM Data FilesTask 1. Set Up a New Batch
b Click File > New Batch. The system opens the New Batch dialog box.
c Navigate to the folder \Your Directory\QuantExamples\.
d Type the batch file name iii_Test_01, and click Open.
• If the default layout is not present, click Restore Default Layout on the toolbar before creating a new batch.
2 Add all the samples in the QuantExamples folder to the batch.
• All Samples should be selected. Click OK to add them to the batch.
The Batch Table is no longer empty. It now contains the calibration, QC, and unknown samples. See Figure 2.
• Note that only three of the files are unknown samples, one is a blank, five are calibration files at different calibration levels, and two are QC samples.
Step Detailed instructions Comments
10 MassHunter Qualitative Analysis (K6460 and K6420) Familiarization Guide

1 Exercise 1– Set Up and Quantitate a Batch of Acquired MRM Data FilesTask 1. Set Up a New Batch
Figure 2. Batch Table containing samples before quantitation
Step Detailed instructions Comments
MassHunter Qualitative Analysis (K6460 and K6420) Familiarization Guide 11
1 Exercise 1– Set Up and Quantitate a Batch of Acquired MRM Data FilesTask 2. Set Up a New Method for the Batch
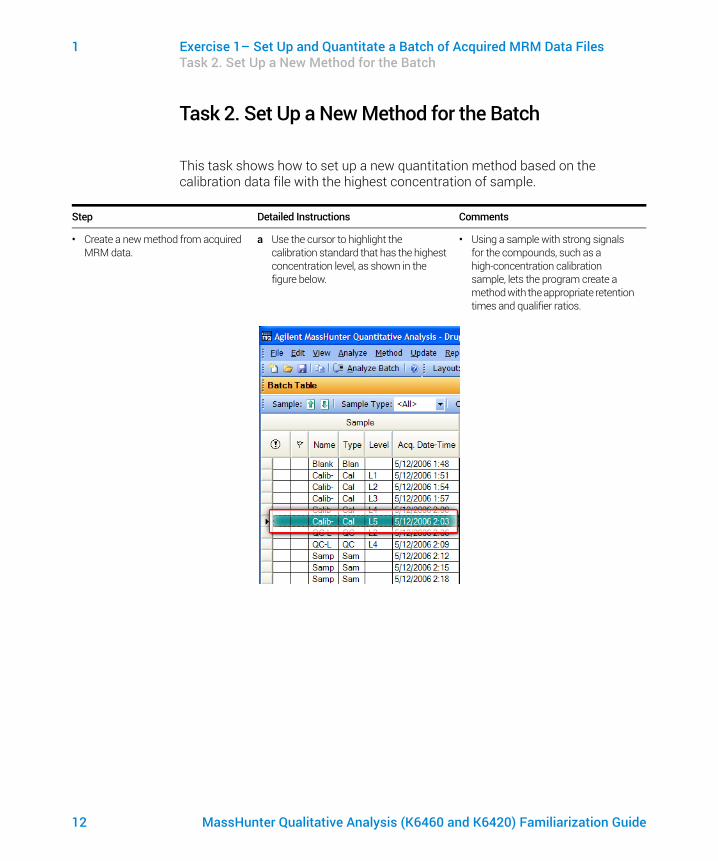
Task 2. Set Up a New Method for the Batch
This task shows how to set up a new quantitation method based on the calibration data file with the highest concentration of sample.
Step Detailed Instructions Comments
• Create a new method from acquired MRM data.
a Use the cursor to highlight the calibration standard that has the highest concentration level, as shown in the figure below.
• Using a sample with strong signals for the compounds, such as a high-concentration calibration sample, lets the program create a method with the appropriate retention times and qualifier ratios.
12 MassHunter Qualitative Analysis (K6460 and K6420) Familiarization Guide

1 Exercise 1– Set Up and Quantitate a Batch of Acquired MRM Data FilesTask 2. Set Up a New Method for the Batch
b Click Method > Edit to switch to method editing mode.
The Method Tasks appear in the column to the left of the View, as shown in Figure 3.
• Note that Figure 3 shows the default layout for method editing.
• If the default layout is not present, click Restore Default Layout on the toolbar before creating a new method in the next step.
Figure 3. Method Edit mode
Step Detailed Instructions Comments
MassHunter Qualitative Analysis (K6460 and K6420) Familiarization Guide 13
1 Exercise 1– Set Up and Quantitate a Batch of Acquired MRM Data FilesTask 2. Set Up a New Method for the Batch
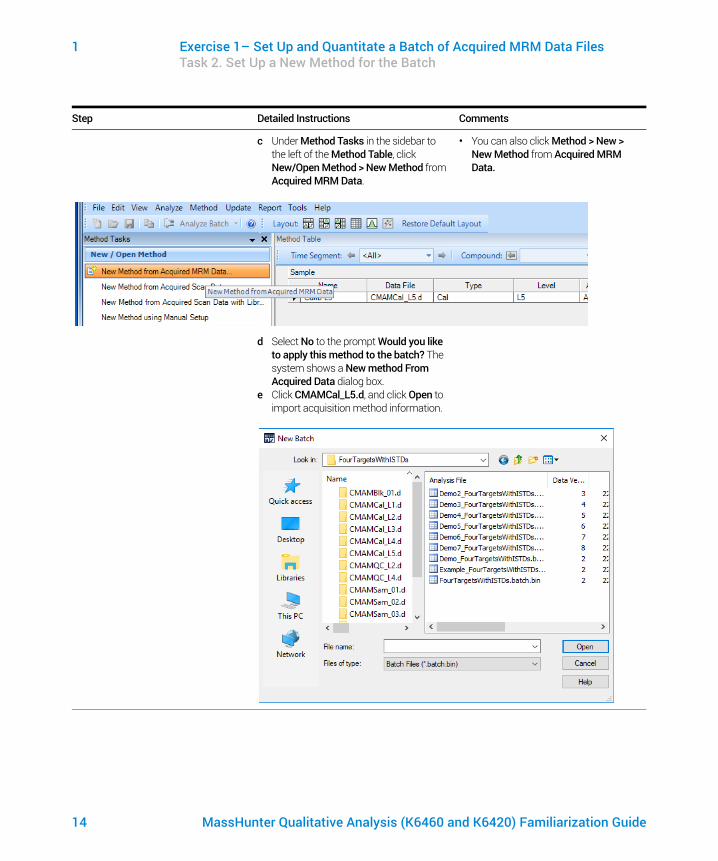
c Under Method Tasks in the sidebar to the left of the Method Table, click New/Open Method > New Method from Acquired MRM Data.
• You can also click Method > New > New Method from Acquired MRM Data.
d Select No to the prompt Would you like to apply this method to the batch? The system shows a New method From Acquired Data dialog box.
e Click CMAMCal_L5.d, and click Open to import acquisition method information.
Step Detailed Instructions Comments
14 MassHunter Qualitative Analysis (K6460 and K6420) Familiarization Guide
1 Exercise 1– Set Up and Quantitate a Batch of Acquired MRM Data FilesTask 3. Set Up Target Compounds
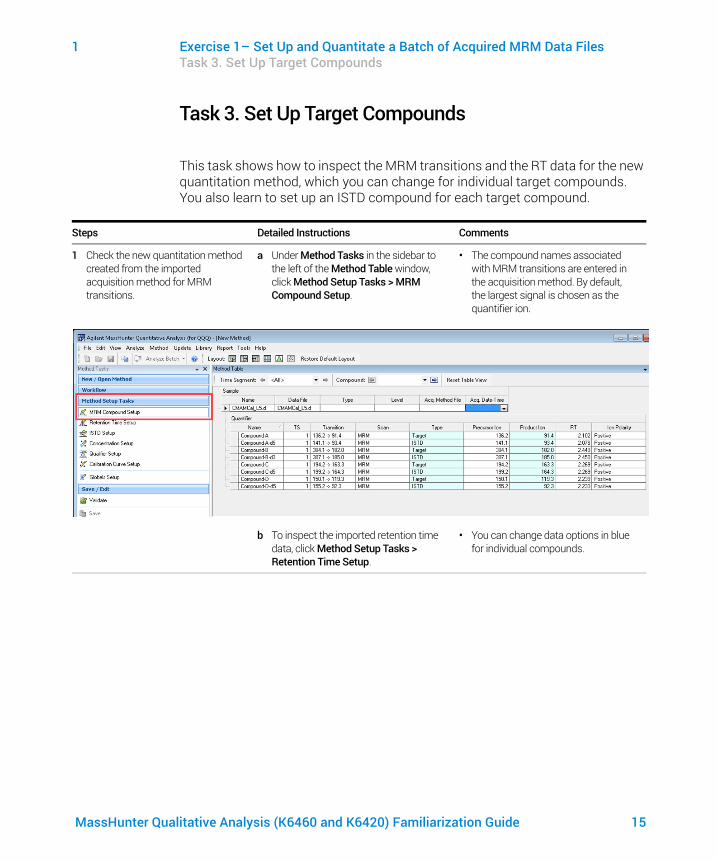
Task 3. Set Up Target Compounds
This task shows how to inspect the MRM transitions and the RT data for the new quantitation method, which you can change for individual target compounds. You also learn to set up an ISTD compound for each target compound.
Steps Detailed Instructions Comments
1 Check the new quantitation method created from the imported acquisition method for MRM transitions.
a Under Method Tasks in the sidebar to the left of the Method Table window, click Method Setup Tasks > MRM Compound Setup.
• The compound names associated with MRM transitions are entered in the acquisition method. By default, the largest signal is chosen as the quantifier ion.
b To inspect the imported retention time data, click Method Setup Tasks > Retention Time Setup.
• You can change data options in blue for individual compounds.
MassHunter Qualitative Analysis (K6460 and K6420) Familiarization Guide 15
1 Exercise 1– Set Up and Quantitate a Batch of Acquired MRM Data FilesTask 3. Set Up Target Compounds
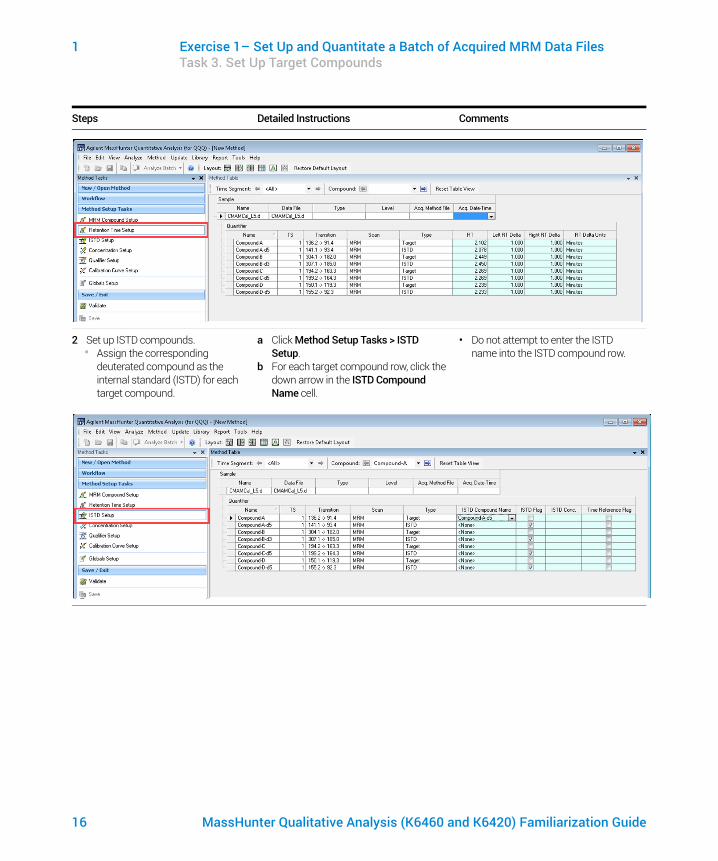
2 Set up ISTD compounds.• Assign the corresponding
deuterated compound as the internal standard (ISTD) for each target compound.
a Click Method Setup Tasks > ISTD Setup.
b For each target compound row, click the down arrow in the ISTD Compound Name cell.
• Do not attempt to enter the ISTD name into the ISTD compound row.
Steps Detailed Instructions Comments
16 MassHunter Qualitative Analysis (K6460 and K6420) Familiarization Guide

1 Exercise 1– Set Up and Quantitate a Batch of Acquired MRM Data FilesTask 3. Set Up Target Compounds
c Click the ISTD name associated with the target compound.
d Type the ISTD concentration (ISTD Conc.) for each ISTD compound (50.0000 in this example).
Steps Detailed Instructions Comments
MassHunter Qualitative Analysis (K6460 and K6420) Familiarization Guide 17

1 Exercise 1– Set Up and Quantitate a Batch of Acquired MRM Data FilesTask 4. Set Up Quantitation
Task 4. Set Up Quantitation
This task presents instructions for setting up the quantitation parameters for the method’s: • Calibration levels• Qualifier ions• Calibration curve fit
Steps Detailed instructions Comments
1 Create five calibration levels for the first compound.
a From the main menu select Method > Create Levels from Calibration Samples. The Calibration table opens under each Quantifier in the Method Table.
b For one of the Quantifiers, change the default concentrations to the actual concentration for each level.• L1–2.5000• L2–5.0000• L3–12.5000• L4–25.0000• L5–125.0000
18 MassHunter Qualitative Analysis (K6460 and K6420) Familiarization Guide

1 Exercise 1– Set Up and Quantitate a Batch of Acquired MRM Data FilesTask 4. Set Up Quantitation
2 Copy the calibration levels and concentrations to the other compounds.
a Click Method > Copy Calibration Levels To...The system shows the Copy Calibration Levels To dialog box.
b Click Select All, and then click OK.
c Close the Compound Information window and the Sample Information window in the lower half of the Quantitative Data Analysis main view.
Steps Detailed instructions Comments
MassHunter Qualitative Analysis (K6460 and K6420) Familiarization Guide 19

1 Exercise 1– Set Up and Quantitate a Batch of Acquired MRM Data FilesTask 4. Set Up Quantitation
d Browse the Method Table to compare the calibration concentration setup among the four target compounds, Compound-A, Compound-B, Compound-C, and Compound-D.
.
Steps Detailed instructions Comments
20 MassHunter Qualitative Analysis (K6460 and K6420) Familiarization Guide
1 Exercise 1– Set Up and Quantitate a Batch of Acquired MRM Data FilesTask 4. Set Up Quantitation
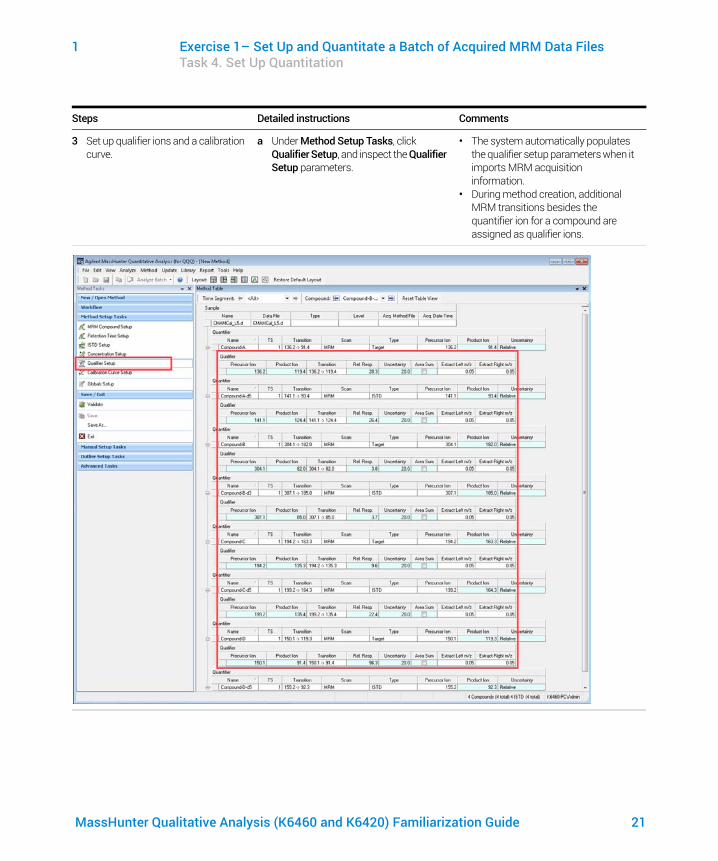
3 Set up qualifier ions and a calibration curve.
a Under Method Setup Tasks, click Qualifier Setup, and inspect the Qualifier Setup parameters.
• The system automatically populates the qualifier setup parameters when it imports MRM acquisition information.
• During method creation, additional MRM transitions besides the quantifier ion for a compound are assigned as qualifier ions.
Steps Detailed instructions Comments
MassHunter Qualitative Analysis (K6460 and K6420) Familiarization Guide 21
1 Exercise 1– Set Up and Quantitate a Batch of Acquired MRM Data FilesTask 4. Set Up Quantitation
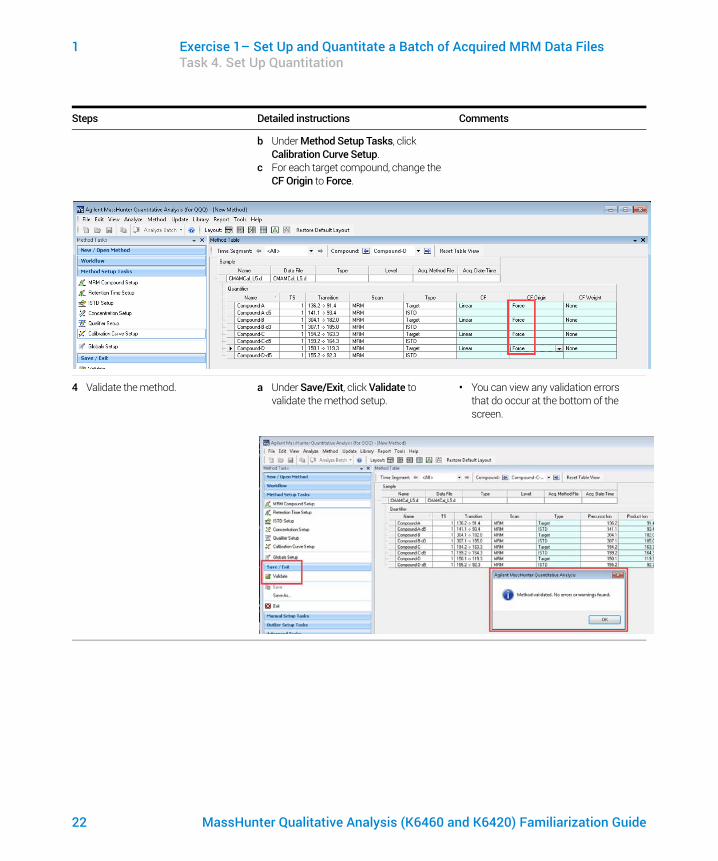
b Under Method Setup Tasks, click Calibration Curve Setup.
c For each target compound, change the CF Origin to Force.
4 Validate the method. a Under Save/Exit, click Validate to validate the method setup.
• You can view any validation errors that do occur at the bottom of the screen.
Steps Detailed instructions Comments
22 MassHunter Qualitative Analysis (K6460 and K6420) Familiarization Guide

1 Exercise 1– Set Up and Quantitate a Batch of Acquired MRM Data FilesTask 4. Set Up Quantitation
b After the validation message appears, click OK.
c Click Save/Exit > Exit.d Select None under Additional batch
processing after applying the method, and click Yes to the Would you like to apply this method to the batch? prompt.
Steps Detailed instructions Comments
MassHunter Qualitative Analysis (K6460 and K6420) Familiarization Guide 23

1 Exercise 1– Set Up and Quantitate a Batch of Acquired MRM Data FilesTask 5. Set the Integrator
Task 5. Set the Integrator
Steps Detailed instructions Comments
1 Change the default integrator to MS-MS.
a Click Method >Edit or press F10.b Click Method > Advanced Tasks >
Integration Parameters Setup.c In the Method Table, click the box
located on the right side of the Int. value.
The default and Agilent recommended integrator for MassHunter Quant is the Agile2 parameterless integrator. To demonstrate the procedure for changing the integrator for all compounds in a Quant method, this task changes the default Agile2 integrator to the MS-MS integrator.
.
d Select MS-MS from the drop-down menu.
24 MassHunter Qualitative Analysis (K6460 and K6420) Familiarization Guide

1 Exercise 1– Set Up and Quantitate a Batch of Acquired MRM Data FilesTask 5. Set the Integrator
e Click Apply to All.f Click OK.
2 Save the method. a Under Save/Exit, click Exit. b Select None under Additional batch
processing after applying the method, and click Yes to the Would you like to apply this method to the batch? prompt.
Steps Detailed instructions Comments
MassHunter Qualitative Analysis (K6460 and K6420) Familiarization Guide 25

1 Exercise 1– Set Up and Quantitate a Batch of Acquired MRM Data FilesTask 6. Analyze and Save the Batch
Task 6. Analyze and Save the Batch
This task shows how to quantitate the batch and then save the results.
Steps Detailed instructions Comments
1 Analyze the batch, and inspect the results for each compound.
a Click Analyze Batch in the toolbar to start batch analysis.
b Pass the cursor over the quantitation message for Sample-1.
c Pass the cursor over the flags for the first two calibration standards.
• Note that two calibration standards contain outlier data.
• Note that the program found no data for Compound-A in Sample-1.
2 Save the batch. a Click File > Save Batch.b Click File > Close Batch to close the
batch.
Quantitation message
Outlier flag messages
26 MassHunter Qualitative Analysis (K6460 and K6420) Familiarization Guide
2 Exercise 2 – Review Quantitation ResultsTask 1. Explore the Batch Table Results 28Task 2. Change Result Window Layouts 32Task 3. Export and Print Results 39
The tasks in this exercise show you how to inspect the sample and compound data in a batch file, customize result layouts, export your data to Microsoft Excel, and preview and print the data.
Use the QuantExamples batch in this exercise. Similar tasks can be performed with Triple Quad data files.
Each exercise is presented in a table with three columns:• Steps – Use these general instructions to proceed on your own to explore the
program.• Detailed Instructions – Use these if you need help or prefer to use a
step-by-step learning process.• Comments – Read these to learn tips and additional information about each
step in the exercise.
MassHunter Qualitative Analysis (K6460 and K6420) Familiarization Guide 27

2 Exercise 2 – Review Quantitation ResultsTask 1. Explore the Batch Table Results
Task 1. Explore the Batch Table Results
This task shows how to scroll through your samples and compounds, while observing changes in the Batch Table and compound information data. It also shows you how to display various sample types.
Steps Detailed instructions Comments
1 Open the batch file iii_Test_01.batch.bin, created in Exercise 1.
a To start the Quantitative Analysis program, click Quantitative Analysis on your Desktop .
b Click Open Batch on the toolbar to show the Open Batch dialog box.
c Open \Your Directory\QuantExamples, and click iii_Test_01.batch.bin
• The main view that appears should look like the one below. This is the default layout and contains the default column settings.
28 MassHunter Qualitative Analysis (K6460 and K6420) Familiarization Guide

2 Exercise 2 – Review Quantitation ResultsTask 1. Explore the Batch Table Results
2 (Optional) If you see a different layout than the one in the figure on the previous page,• If fewer than three windows are
present in the main view, or they are in a different arrangement, restore the default layout.
• If the column settings are different, restore the default column settings.
• If panes other than the Chromatogram pane are present in the Compound Information window, hide the other panes.
• To restore the default layout, click Restore Default Layout on the toolbar before scrolling from sample to sample.
• To restore the default column settings, right-click anywhere in the Batch Table window, and click Restore Default Columns.
• To hide extra panes, click the highlighted buttons other than Show/Hide Chromatogram in the Compound Information toolbar.
• The default layout is set at the factory and cannot be changed. If you want to create your own layout, see “Task 2. Change Result Window Layouts” on page 32.
3 Scroll from sample to sample until you reach the end of the Batch Table, then return to Cal-L5.
a Click Next Sample in the Batch Table Standard toolbar until the system shows the desired sample.Inspect the changes in the Compound Information window.
b To return to Cal-L5, click Previous Sample in the Batch Table Standard toolbar.
c To view the changed, select any cell in the row for sample Calib_L4 in the Batch Table window.
• Note the linkage between the highlighted data file in the Batch Table and the chromatogram in the Compound Information window.
• Note the changes in the Batch Table and Compound Information of Compound-A for each sample.
4 Scroll from compound to compound through all four compounds.
a In the toolbar, click Next Compound or Previous Compound until the system shows the desired compound.
b Inspect the changes in the Batch Table, Compound Information, and Calibration Curve windows.
c Click the down arrow next to the Compound list.
d Click Compound-B.
Steps Detailed instructions Comments
MassHunter Qualitative Analysis (K6460 and K6420) Familiarization Guide 29

2 Exercise 2 – Review Quantitation ResultsTask 1. Explore the Batch Table Results
5 Examine the results for multiple compounds.• View the RT for each compound
for the Cal-L4 sample.• After reviewing the results for all
the compounds, return to viewing the Compound-B results.
a Click Display Multiple Compounds/Samples in Batch Table View in the toolbar to show the quantitation results for all target compounds. You can also click View > Batch Table Layout > Multiple Compounds/Samples View.
b Click the Cal-L4 cell, and note the different RT in the Compound Information window for each compound.
A different set of columns is shown in Multiple Compounds/Samples View mode versus Single Compound View mode. If you add a column to the table when you are in Multiple Compounds/Samples View mode, that change is not automatically made in the Single Compound/Sample View mode.
c To return to the display of detailed quantitation results for the selected target compound, click Display Single Compound/Sample in Batch Table in the toolbar.
d If necessary, click the down arrow next to the Compound list, and click Compound-B.
Steps Detailed instructions Comments
30 MassHunter Qualitative Analysis (K6460 and K6420) Familiarization Guide

2 Exercise 2 – Review Quantitation ResultsTask 1. Explore the Batch Table Results
6 View selected sample types. • Show only the calibration
standards.• Then show all sample types.
a Click the down arrow next to Sample Type to open the Sample Type dialog box.
b Clear the <All> check box and mark the Cal check box.
c Click OK.The Batch Table contains only the Cal standards for Compound-B.
d Click the down arrow next to Sample Type.
e Select <All>, and then click OK. The system marks all the check boxes and shows all sample types.
Steps Detailed instructions Comments
MassHunter Qualitative Analysis (K6460 and K6420) Familiarization Guide 31

2 Exercise 2 – Review Quantitation ResultsTask 2. Change Result Window Layouts
Task 2. Change Result Window Layouts
This task shows how to customize your layout using the toolbar buttons and how to recreate the default layout.
.
Steps Detailed instructions Comments
1 Use layout buttons on the toolbar to position the Batch Table, Compound Information, and Calibration Curve windows.
a Click Layout – Table Left.
b Click Layout – Table Right .
c Click Layout – Table Top .
2 Use layout buttons on the toolbar to maximize each individual window.
a Click Maximize Table .
b Click Maximize Compound Information .
c Click Maximize Calibration Curve..d To return to the default layout,
click Restore Default Layout .
32 MassHunter Qualitative Analysis (K6460 and K6420) Familiarization Guide
2 Exercise 2 – Review Quantitation ResultsTask 2. Change Result Window Layouts
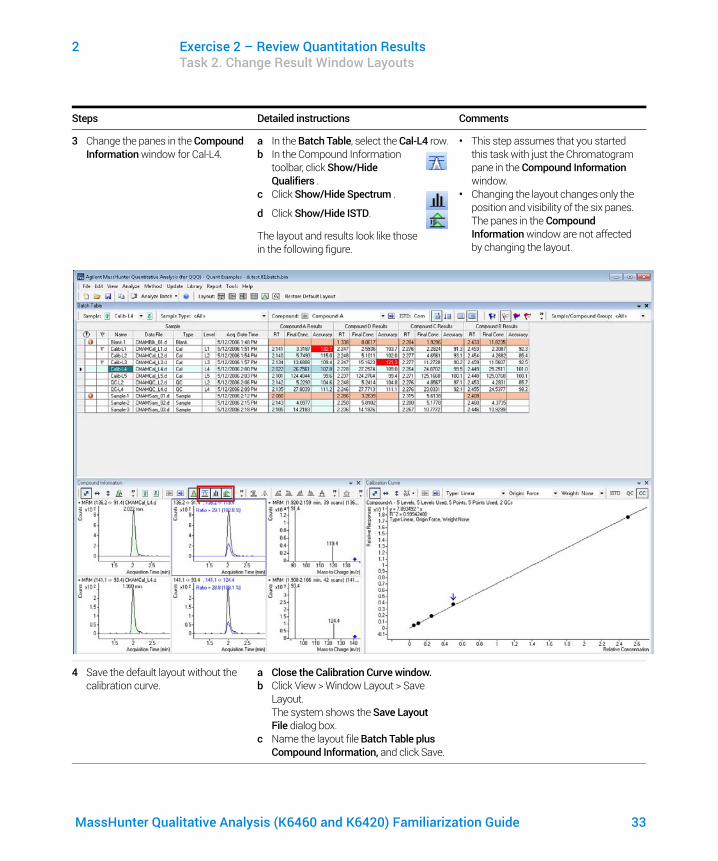
3 Change the panes in the Compound Information window for Cal-L4.
a In the Batch Table, select the Cal-L4 row.b In the Compound Information
toolbar, click Show/Hide Qualifiers .
c Click Show/Hide Spectrum .
d Click Show/Hide ISTD.
The layout and results look like those in the following figure.
• This step assumes that you started this task with just the Chromatogram pane in the Compound Information window.
• Changing the layout changes only the position and visibility of the six panes. The panes in the Compound Information window are not affected by changing the layout.
4 Save the default layout without the calibration curve.
a Close the Calibration Curve window.b Click View > Window Layout > Save
Layout.The system shows the Save Layout File dialog box.
c Name the layout file Batch Table plus Compound Information, and click Save.
Steps Detailed instructions Comments
MassHunter Qualitative Analysis (K6460 and K6420) Familiarization Guide 33

2 Exercise 2 – Review Quantitation ResultsTask 2. Change Result Window Layouts
5 Load the newly created layout. a Click Restore Default Layout on the toolbar.
b Click View > Window Layout > Load Layout. The system shows the Load Layout dialog box.
c Click Batch Table plus Compound Information and click Open.
The results window should now look like Figure 4 on page 35.
Steps Detailed instructions Comments
34 MassHunter Qualitative Analysis (K6460 and K6420) Familiarization Guide
2 Exercise 2 – Review Quantitation ResultsTask 2. Change Result Window Layouts
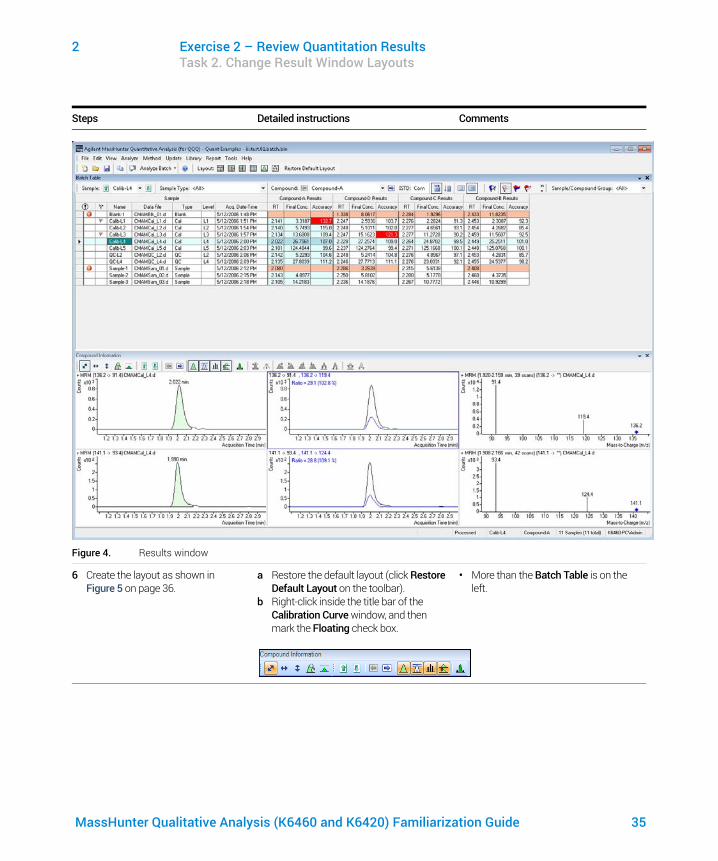
Figure 4. Results window
6 Create the layout as shown in Figure 5 on page 36.
a Restore the default layout (click Restore Default Layout on the toolbar).
b Right-click inside the title bar of the Calibration Curve window, and then mark the Floating check box.
• More than the Batch Table is on the left.
Steps Detailed instructions Comments
MassHunter Qualitative Analysis (K6460 and K6420) Familiarization Guide 35
2 Exercise 2 – Review Quantitation ResultsTask 2. Change Result Window Layouts
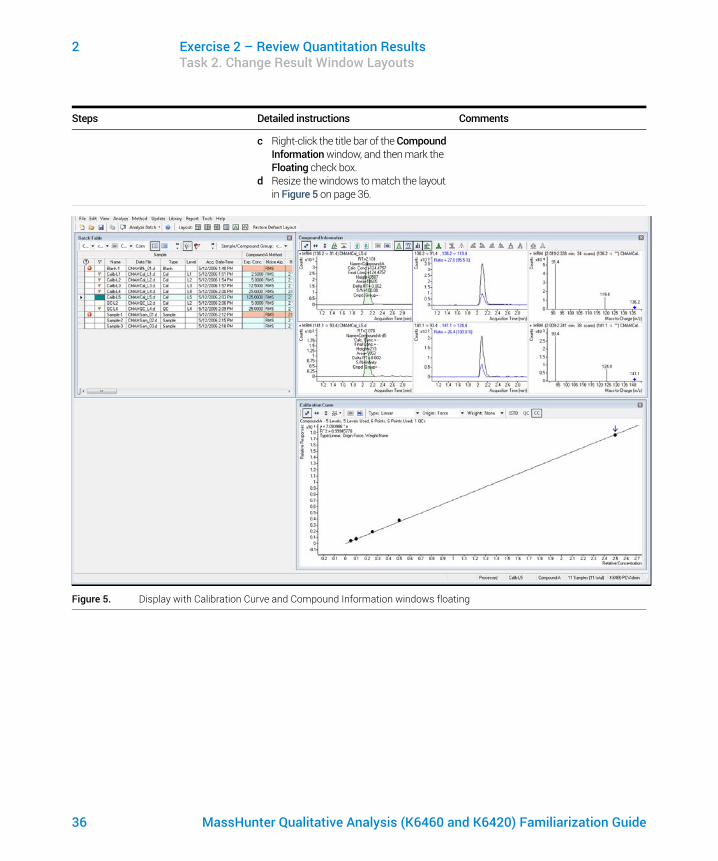
c Right-click the title bar of the Compound Information window, and then mark the Floating check box.
d Resize the windows to match the layout in Figure 5 on page 36.
Figure 5. Display with Calibration Curve and Compound Information windows floating
Steps Detailed instructions Comments
36 MassHunter Qualitative Analysis (K6460 and K6420) Familiarization Guide

2 Exercise 2 – Review Quantitation ResultsTask 2. Change Result Window Layouts
e Right-click inside the title bar of the Compound Information window, and then clear the Floating check box.
f Resize the windows to match the layout in Figure 6 on page 37.
Figure 6. Resized window
g Right-click inside the title bar of the Calibration Curve window, and clear the Floating check box.
h Move the Compound Information window so that the layout corresponds to the one pictured at the start of the task.
Steps Detailed instructions Comments
MassHunter Qualitative Analysis (K6460 and K6420) Familiarization Guide 37

2 Exercise 2 – Review Quantitation ResultsTask 2. Change Result Window Layouts
7 Recreate (do not restore) the default layout.
• Maximize the program main view.• Anchor the Calibration Curve window
first, and then the Compound Information window, to recreate the default layout.
• If after anchoring the two windows, the calibration curve is on the left side, right-click the title bar of the Calibration Curve window, and drag it to the right. A gray rectangle shows where this window will be placed within the main view.
• Drag the calibration curve to the bottom right corner of the main view.
Steps Detailed instructions Comments
38 MassHunter Qualitative Analysis (K6460 and K6420) Familiarization Guide

2 Exercise 2 – Review Quantitation ResultsTask 3. Export and Print Results
Task 3. Export and Print Results
This exercise shows how to export your data to a Microsoft Excel file and how to preview and print your Batch Table and compound information data.
CAUTIONDo not use File menu commands to create final quantitation results. Always use Report menu commands instead to create final PDF or Excel reports for data analysis traceability. (See “Exercise 4 – Generate Quantitation Reports” on page 65.) Use File menu commands (Export table, Print) for preliminary data review only.
The Quant batch table does not always display completely processed results, and File commands can lead to incorrect reports. For example, a manual integration applied to a single calibrator sample is not applied to the entire batch until the batch is analyzed (Analyze -> Analyze batch). Report menu commands ensure that all changes are processed and the batch is saved before the report is created.
Steps Detailed instructions Comments
1 Export the batch file iii_Test_01. a To make the Batch Table window active, click the title bar of the Batch Table window.
b Click File > Export > Export Table.c Select My Documents as the destination
directory.d Type iii_Test_01.xlsx as the
export file name.e Click Save. The Excel file My
Documents\iii_Test_01.xlsx opens automatically.
• iii = User initials
MassHunter Qualitative Analysis (K6460 and K6420) Familiarization Guide 39

2 Exercise 2 – Review Quantitation ResultsTask 3. Export and Print Results
Figure 7. Export results
2 View the batch results as they appear in Excel; then exit Excel.
a Note what is exported and what is not.b Close Excel when you are finished.
Figure 8. Batch table in Excel
Steps Detailed instructions Comments
40 MassHunter Qualitative Analysis (K6460 and K6420) Familiarization Guide

2 Exercise 2 – Review Quantitation ResultsTask 3. Export and Print Results
3 Preview printouts for Batch Table and Compound Information data.
a In Excel, click File > Print.b Inspect the Print Preview window to
ensure it looks the way you want it. c Click File > Print.d Repeat steps a-c for the compound
information.e If you are not moving on to Exercise 4,
click File > Save Batch. f Click File > Exit.
You can also print the Batch Table from the Print Preview program by clicking the File > Print menu item in the Print Preview program.
Steps Detailed instructions Comments
MassHunter Qualitative Analysis (K6460 and K6420) Familiarization Guide 41

42 MassHunter Qualitative Analysis (K6460 and K6420) Familiarization Guide
This page intentionally left blank.

3 Exercise 3 – Use Three Tools to Evaluate ResultsTask 1. Adjust the Calibration Curve Fit 44Task 2. Integrate Without Parameters 46Task 3. Detect Outliers 61
This exercise presents three tools to help you evaluate and obtain more accurate quantitation results:• Curvefit Assistant - This calculates all combinations of curves and presents
results with an equation and confidence band• Parameterless integrator - So you don’t have to figure out the parameters to
change to improve the integration• Outlier messages - These help you easily detect result values that are out of
the specified range
The QuantExamples batch is used in this exercise. The same tasks can be performed with Triple Quad data files.
Each exercise is presented in a table with three columns:• Steps – Use these general instructions to proceed on your own to explore the
program.• Detailed Instructions – Use these if you need help or prefer to use a
step-by-step learning process.• Comments – Read these to learn tips and additional information about each
step in the exercise.
MassHunter Qualitative Analysis (K6460 and K6420) Familiarization Guide 43

3 Exercise 3 – Use Three Tools to Evaluate ResultsTask 1. Adjust the Calibration Curve Fit
Task 1. Adjust the Calibration Curve Fit
This task shows how to find the accuracy outlier for a compound, adjust its curve fit, and reanalyze the batch.
Steps Detailed instructions Comments
1 If necessary, open the batch file iii_Test_01.batch.bin.
a To start the Quantitative Analysis program, click Quantitative Analysis (QQQ) on your desktop.
b Click Open Batch on the toolbar to show the Open Batch dialog box.
c Open \Your Directory\QuantExamples and click iii_Test_01.batch.bin.
• You can also click Programs > Agilent > MassHunter Workstation > Quantitative Analysis (QQQ) from the Start menu.
• If the default layout is not present, click Restore Default Layout on the toolbar before opening the batch.
2 Find the accuracy outlier for Compound-A, and change the curve fit.
a Ensure the Batch Table is set to single compound display mode, and the shown target compound is Compound-A. See boxed portions of the illustration below.
b Point to the cell in the Calib-L1 row and the Accuracy column to show the Outlier message as shown below.
• Cells containing outliers can be in red (high) or blue (low).
44 MassHunter Qualitative Analysis (K6460 and K6420) Familiarization Guide

3 Exercise 3 – Use Three Tools to Evaluate ResultsTask 1. Adjust the Calibration Curve Fit
c In the Calibration Curve window, set Origin to Ignore, and Weight to 1/y.The program shows a new curve fit formula and R2 value.
Curve Fit Origin • Force – Forces the curve fit line to go
through the origin point (X=0, Y=0). • Ignore – Does not force the curve fit
line to use the origin point (X=0, Y=0).Curve Fit Weight • None – Gives equal weight to all data
points.• 1/Y – Applies the formula 1/Y to the
data points. This formula reduces the influence of high Y values while boosting the influence of low Y values.
3 Analyze the batch and inspect the results in the Batch Table.
a Click Analyze Batch in the toolbar to analyze the batch.
b Inspect the results in the Batch Table after batch analysis.
4 Find accuracy outliers, if any, for other compounds.
a In the Batch Table toolbar, click Next Compound to view individual compounds, such as Compound-B, Compound-C, and Compound-D.
b Examine the quantitation results, especially the values in the Accuracy column.
• Note that the Accuracy value for the Calib-L3 standard for Compound-C is out of the specified range.
5 Change the curve fit for Compound-C, and analyze the batch.
a In the Calibration Curve Fit window, set Origin to Ignore, and Weight to 1/y. The Quantitative Analysis program shows a revised curve fit formula and R2 value.
b Click Analyze Batch in the main toolbar to analyze the batch. The Batch Table shows the new results after batch analysis.
Steps Detailed instructions Comments
MassHunter Qualitative Analysis (K6460 and K6420) Familiarization Guide 45

3 Exercise 3 – Use Three Tools to Evaluate ResultsTask 2. Integrate Without Parameters
Task 2. Integrate Without Parameters
This task shows how to inspect data for proper integration. You learn how to perform the following tasks:• Add integration columns to the Batch Table• View default integration values• Closely examine the chromatogram, looking for details such as:
• Outlier messages • Baseline parameters• Peak labels
46 MassHunter Qualitative Analysis (K6460 and K6420) Familiarization Guide

3 Exercise 3 – Use Three Tools to Evaluate ResultsTask 2. Integrate Without Parameters
Steps Detailed instructions Comments
1 Add integration columns to the Batch Table.
a Right-click anywhere in the Batch Table, and click Add/Remove Columns.The system shows the Columns dialog box.
b For Select Columns From, select Compound Method.
c Under Available Columns, select Int. (Integrator Type) and Int. Parms. (Integrator Parameters), and click Add.The Quantitative Analysis program moves the selected columns to the Show these columns in the order list.
• This task assumes that the batch, iii_Test_01, is already open. If it is not, see step 1 in “Task 1. Adjust the Calibration Curve Fit” on page 44.
MassHunter Qualitative Analysis (K6460 and K6420) Familiarization Guide 47

3 Exercise 3 – Use Three Tools to Evaluate ResultsTask 2. Integrate Without Parameters
d For Select Columns From, select Compound Results.
e Under Available Columns, select Int. Metric (Integrator Metric), and click Add.The system moves the selected column to the Show these columns in the order list.
f Click OK.
Steps Detailed instructions Comments
48 MassHunter Qualitative Analysis (K6460 and K6420) Familiarization Guide

3 Exercise 3 – Use Three Tools to Evaluate ResultsTask 2. Integrate Without Parameters
2 View the default integration values for Compound-A.
a In the Batch Table toolbar, click Previous Compound to view Compound-A.
b Examine the default values in the Int. and Int. Parms columns in the Batch Table.
• Note that the integrator used is the MS-MS integrator, which does not need you to enter parameters. That is why the Int. Parms column is blank.
c Examine the default values in the Int. Metric column in the Batch Table.
• These values reflect the default integration quality metric used for the target compound Compound-A.
Steps Detailed instructions Comments
MassHunter Qualitative Analysis (K6460 and K6420) Familiarization Guide 49

3 Exercise 3 – Use Three Tools to Evaluate ResultsTask 2. Integrate Without Parameters
3 View integration problems for Compound-B and Compound-C.• Look for outlier messages at the
intersection of the Int. Metric column and the Blank-1 sample.
a Close the Calibration Curve window. b Enlarge the chromatogram portion of
Compound Information toolbar so that only the quantifier and qualifier chromatograms appear.
c Click Show/Hide Spectrum.
d Click Show/Hide ISTD..
e In the Batch Table toolbar, click Next Compound until the system shows the compound Compound-B.
f Select the Blank-1 row, and move the mouse over the word Inspect in the Int. Metric column for that row. The system shows any outlier message for that data, as well as the integrated chromatogram for Compound-B.
Steps Detailed instructions Comments
50 MassHunter Qualitative Analysis (K6460 and K6420) Familiarization Guide
3 Exercise 3 – Use Three Tools to Evaluate ResultsTask 2. Integrate Without Parameters
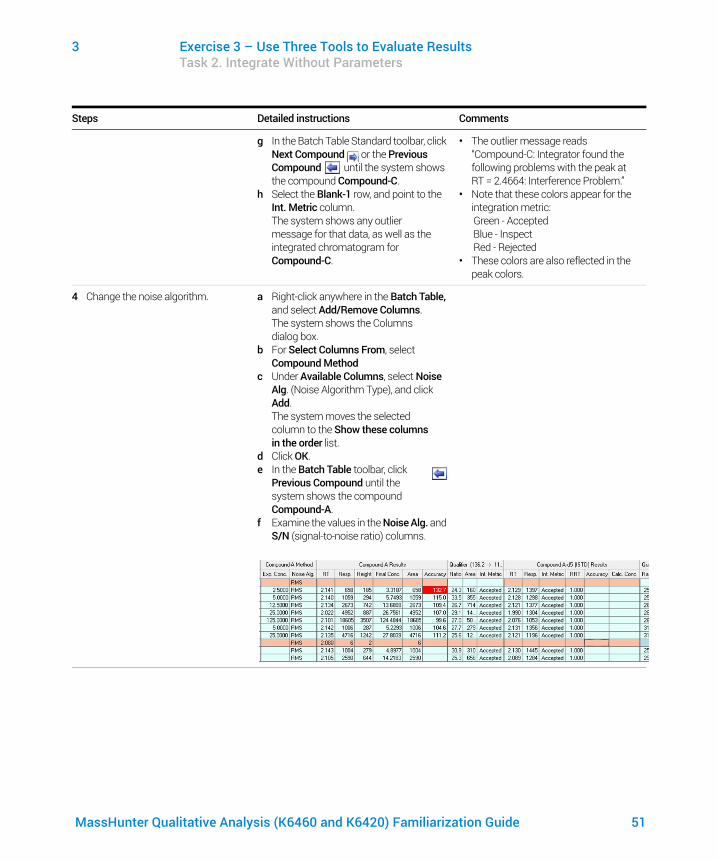
g In the Batch Table Standard toolbar, click Next Compound or the Previous Compound until the system shows the compound Compound-C.
h Select the Blank-1 row, and point to the Int. Metric column.The system shows any outlier message for that data, as well as the integrated chromatogram for Compound-C.
• The outlier message reads “Compound-C: Integrator found the following problems with the peak at RT = 2.4664: Interference Problem.”
• Note that these colors appear for the integration metric:Green - AcceptedBlue - InspectRed - Rejected
• These colors are also reflected in the peak colors.
4 Change the noise algorithm. a Right-click anywhere in the Batch Table, and select Add/Remove Columns.The system shows the Columns dialog box.
b For Select Columns From, select Compound Method
c Under Available Columns, select Noise Alg. (Noise Algorithm Type), and click Add.The system moves the selected column to the Show these columns in the order list.
d Click OK.e In the Batch Table toolbar, click
Previous Compound until the system shows the compound Compound-A.
f Examine the values in the Noise Alg. and S/N (signal-to-noise ratio) columns.
Steps Detailed instructions Comments
MassHunter Qualitative Analysis (K6460 and K6420) Familiarization Guide 51

3 Exercise 3 – Use Three Tools to Evaluate ResultsTask 2. Integrate Without Parameters
5 Practice changing the noise algorithm from RSM to ASTM for Compound-A in the method.• Close, but do not save, the
method.
a Click Method > Edit to switch to method editing mode.
b Under Method Tasks, click Advanced Tasks > Signal to Noise Setup.The system shows the integrator parameters in the Method Table.
c In the Method Table, click the drop-down arrow in the Noise Alg. column for Compound-A.A list of available noise algorithms appears.
d Click ASTM.
Steps Detailed instructions Comments
52 MassHunter Qualitative Analysis (K6460 and K6420) Familiarization Guide

3 Exercise 3 – Use Three Tools to Evaluate ResultsTask 2. Integrate Without Parameters
e Under Method Tasks/Save/Exit, click Exit.
f At the Would you like to apply this method to the batch? prompt, click No. The system shows Batch Analysis mode.
6 Turn off the baseline (highest concentration standard) and then back on for Compound-A.• Compare the two
chromatograms: one with the baseline on and the other with it off.
a Select sample Calib-L5 (if it is not already selected), and click Maximize Compound Information in the toolbar. Make sure that only the Compound Information pane is visible in the window.
• Notice that the baseline is drawn in for the quantifier chromatogram as the default setting.
Steps Detailed instructions Comments
MassHunter Qualitative Analysis (K6460 and K6420) Familiarization Guide 53
3 Exercise 3 – Use Three Tools to Evaluate ResultsTask 2. Integrate Without Parameters
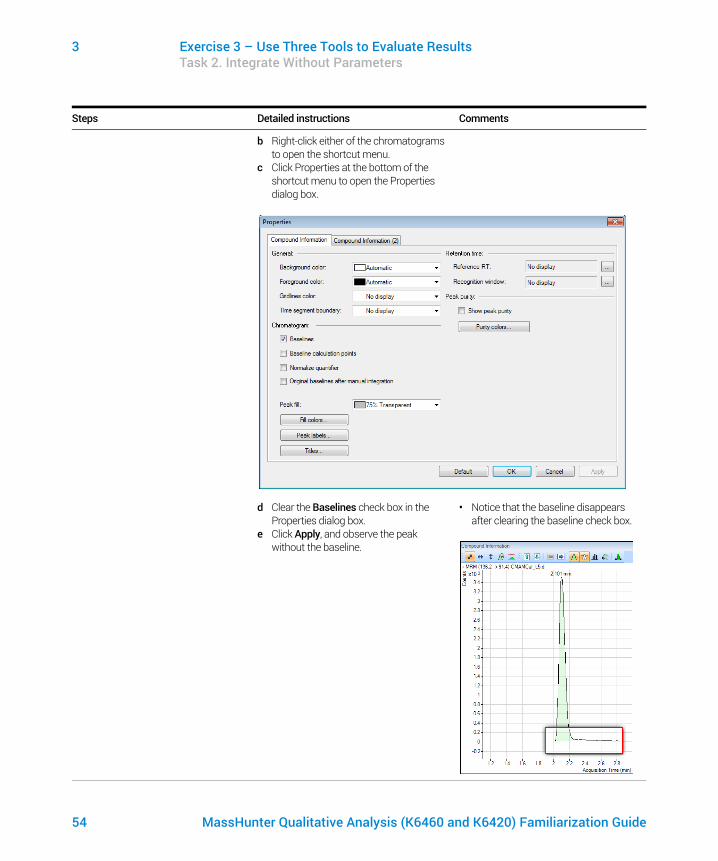
b Right-click either of the chromatograms to open the shortcut menu.
c Click Properties at the bottom of the shortcut menu to open the Properties dialog box.
d Clear the Baselines check box in the Properties dialog box.
e Click Apply, and observe the peak without the baseline.
• Notice that the baseline disappears after clearing the baseline check box.
Steps Detailed instructions Comments
54 MassHunter Qualitative Analysis (K6460 and K6420) Familiarization Guide

3 Exercise 3 – Use Three Tools to Evaluate ResultsTask 2. Integrate Without Parameters
f Mark the Baselines check box in the Properties dialog box.
g Click Apply, and observe the peak with the baseline drawn.
Steps Detailed instructions Comments
MassHunter Qualitative Analysis (K6460 and K6420) Familiarization Guide 55

3 Exercise 3 – Use Three Tools to Evaluate ResultsTask 2. Integrate Without Parameters
7 Inspect the calculation points for the baseline for Compound-A.
a Mark the Baseline Calculation Points check box in the Properties dialog box.
b Click Apply, and observe where the baseline starts and stops.
c Clear the Baseline Calculation Points check box in the Properties dialog box.
d Click Apply, and observe the chromatograms.
e Compare the chromatograms with and without Baseline Calculation Points.
Steps Detailed instructions Comments
With baseline calculation points
56 MassHunter Qualitative Analysis (K6460 and K6420) Familiarization Guide

3 Exercise 3 – Use Three Tools to Evaluate ResultsTask 2. Integrate Without Parameters
8 Show the peak labels for Compound-A.
a From the Properties dialog box, click Peak Labels.The system shows the Peak Label dialog box.
b Mark all the Peak Labels check boxes and the Display Label Names check box.
c Click OK.
Steps Detailed instructions Comments
MassHunter Qualitative Analysis (K6460 and K6420) Familiarization Guide 57

3 Exercise 3 – Use Three Tools to Evaluate ResultsTask 2. Integrate Without Parameters
d Click Apply in the Properties dialog box. The peak labels should now match those shown in the example below.
e Click Peak Labels in the Properties dialog box.The system shows the Peak Labels dialog box.
f Clear all the Peak Labels check boxes except RT (retention time). Clear the Display Label Names check box, and click OK.
g Click Apply in the Properties dialog box, and observe the change in Peak Labels.
Steps Detailed instructions Comments
58 MassHunter Qualitative Analysis (K6460 and K6420) Familiarization Guide
3 Exercise 3 – Use Three Tools to Evaluate ResultsTask 2. Integrate Without Parameters
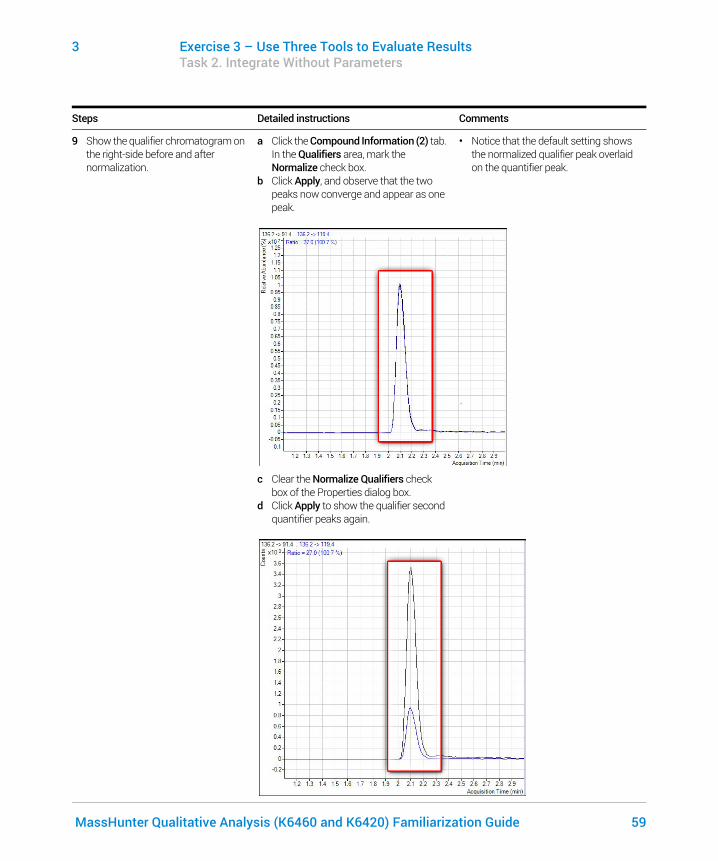
9 Show the qualifier chromatogram on the right-side before and after normalization.
a Click the Compound Information (2) tab. In the Qualifiers area, mark the Normalize check box.
b Click Apply, and observe that the two peaks now converge and appear as one peak.
c Clear the Normalize Qualifiers check box of the Properties dialog box.
d Click Apply to show the qualifier second quantifier peaks again.
• Notice that the default setting shows the normalized qualifier peak overlaid on the quantifier peak.
Steps Detailed instructions Comments
MassHunter Qualitative Analysis (K6460 and K6420) Familiarization Guide 59
3 Exercise 3 – Use Three Tools to Evaluate ResultsTask 2. Integrate Without Parameters
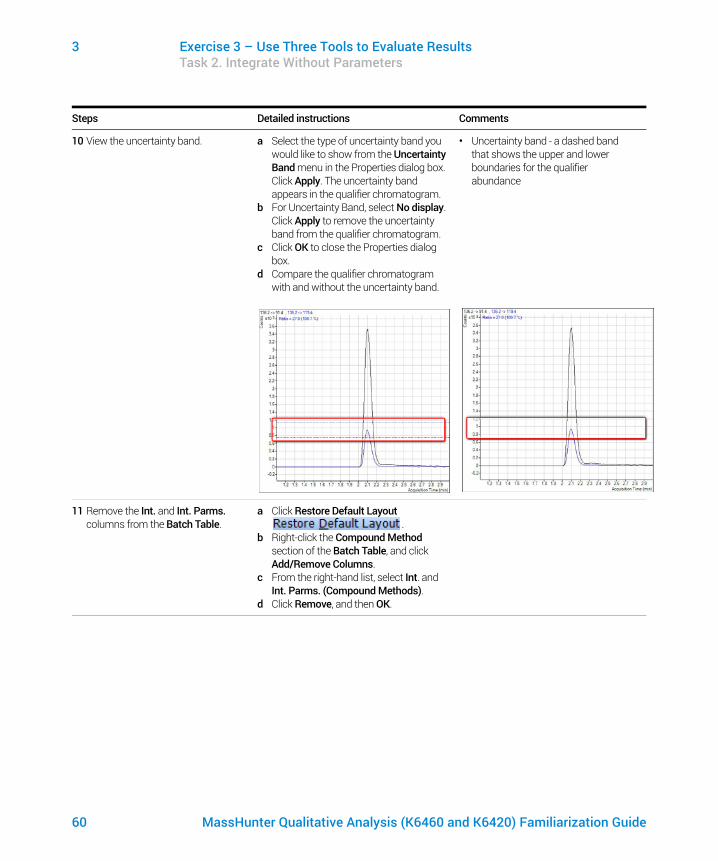
10 View the uncertainty band. a Select the type of uncertainty band you would like to show from the Uncertainty Band menu in the Properties dialog box. Click Apply. The uncertainty band appears in the qualifier chromatogram.
b For Uncertainty Band, select No display. Click Apply to remove the uncertainty band from the qualifier chromatogram.
c Click OK to close the Properties dialog box.
d Compare the qualifier chromatogram with and without the uncertainty band.
• Uncertainty band - a dashed band that shows the upper and lower boundaries for the qualifier abundance
11 Remove the Int. and Int. Parms. columns from the Batch Table.
a Click Restore Default Layout .
b Right-click the Compound Method section of the Batch Table, and click Add/Remove Columns.
c From the right-hand list, select Int. and Int. Parms. (Compound Methods).
d Click Remove, and then OK.
Steps Detailed instructions Comments
60 MassHunter Qualitative Analysis (K6460 and K6420) Familiarization Guide

3 Exercise 3 – Use Three Tools to Evaluate ResultsTask 3. Detect Outliers
Task 3. Detect Outliers
This task shows how to fine-tune the accuracy range for a compound and hide and show results with outlier flags.
Steps Detailed instructions Comments
1 View outlier information for Compound-C.
a In the Batch Table toolbar, click Next Compound until the system shows Compound-C.
b Select the Blank-1 row, and point the cursor to the RT column, as shown in the example below.
MassHunter Qualitative Analysis (K6460 and K6420) Familiarization Guide 61
3 Exercise 3 – Use Three Tools to Evaluate ResultsTask 3. Detect Outliers
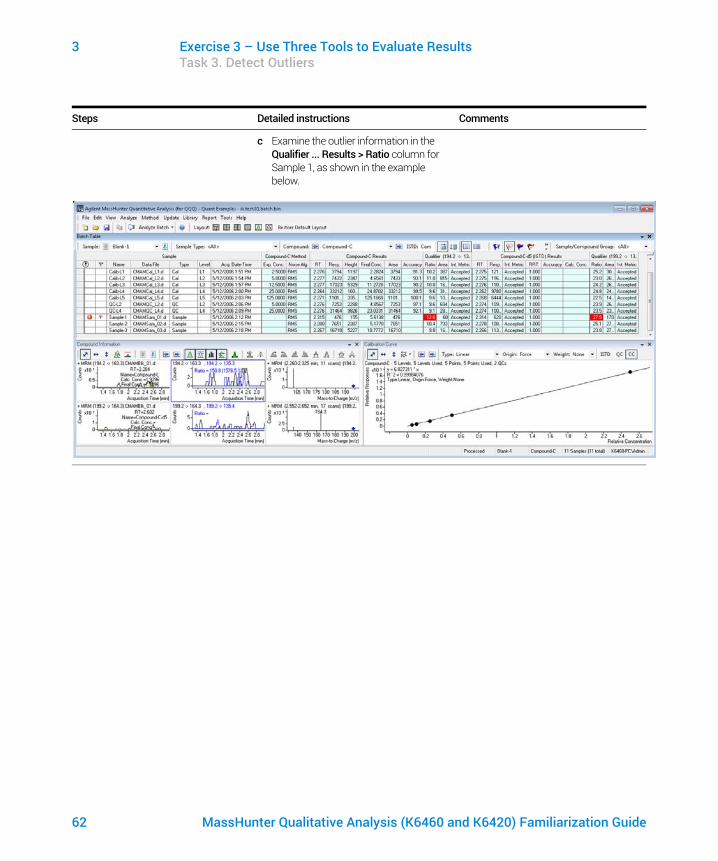
c Examine the outlier information in the Qualifier ... Results > Ratio column for Sample 1, as shown in the example below.
Steps Detailed instructions Comments
62 MassHunter Qualitative Analysis (K6460 and K6420) Familiarization Guide

3 Exercise 3 – Use Three Tools to Evaluate ResultsTask 3. Detect Outliers
2 Change the accuracy range for Compound-A in the method, and reanalyze the batch.
a Click Previous Compound in the toolbar until the system shows Compound-A.
b Select the Calib-L5 row in the table.c Click Method > Edit to switch to method
editing mode.d In the Method Tasks column, click
Outlier Setup Tasks > Accuracy.e Set the Accuracy Max % Dev value to 5%
for Compound-A.
You can split the Method Table by dragging the small rectangle to the left of the scroll bar. In the example below, the rectangle next to the bottom scroll bar was used to split the Method Table. The information in the two sections is the same. You can use these two panes to look at two sections of the table at the same time.
Steps Detailed instructions Comments
MassHunter Qualitative Analysis (K6460 and K6420) Familiarization Guide 63

3 Exercise 3 – Use Three Tools to Evaluate ResultsTask 3. Detect Outliers
f In the Method Tasks column, click Save/Exit > Exit, then select None for Additional batch processing after applying the method. Click Yes to the Would you like to apply this method to the batch? prompt.
g Press F5 to analyze the batch.Red (high) and blue (low) outlier values now appear in the Accuracy column for Compound-A.
• You can also split the Batch Table into two sections. By default, the Sample columns are locked in position and only the other columns are scrolled. If you split the table into two sections, you can determine which columns appear in each section. You need to clear the Lock Sample Columns menu item in the Batch Table shortcut menu if you split the Batch Table.
3 Using the following set of outlier flag buttons :
a Click Display rows that have High outliers on the toolbar to show only samples with high outliers.
b Click Turn off outlier filter to show all samples.
c Click Display rows that have High/Low outliers on the toolbar to show only samples with low outliers.
d Click Display rows that have High/Low outliers again to show all the samples.
e Click Select Outliers to show the Outliers dialog box.
f Clear the Accuracy and Retention Time check boxes, and click OK.
g Click Select Outliers to show the Outliers dialog box.
h Mark the Accuracy and Retention Time check boxes, and click OK.
• Note that to restore the Batch Table to view all data files, with and without outliers, simply click again on the button you selected for filtering outliers.
Steps Detailed instructions Comments
64 MassHunter Qualitative Analysis (K6460 and K6420) Familiarization Guide

4 Exercise 4 – Generate Quantitation Reports
This exercise demonstrates how to do these tasks:• Create report methods using one or more report templates• Generate a report
The QuantExamples batch is used in this exercise. The same tasks can be performed with Triple Quad data files.
Each exercise is presented in a table with three columns:• Steps – Use these general instructions to proceed on your own to explore the
program.• Detailed Instructions – Use these if you need help or prefer to use a
step-by-step learning process.• Comments – Read these to learn tips and additional information about each
step in the exercise.
The report method you develop determines the report you create in MassHunter. Report methods are made of one or more report templates combined and edited to meet your reporting requirements. When developing a report method, you can use either Excel or PDF templates. PDF templates are included with this release and can generate reports 20 times faster than Excel templates. In addition, they have more options for scalability and performance.
In this exercise, you will first develop a report method using PDF templates, and create single sample and batch reports using this same method.
NOTEAlways use Report menu commands to create final PDF or Excel reports for data analysis traceability. Do not use File menu commands to create final quantitation results. The Quant batch table does not always display completely processed results, and File commands can lead to incorrect reports. For example, a manual integration applied to a single calibrator sample is not applied to the entire batch until the batch is analyzed (Analyze -> Analyze batch). Report menu commands ensure that all changes are processed and the batch is saved before the report is created.
MassHunter Qualitative Analysis (K6460 and K6420) Familiarization Guide 65

4 Exercise 4 – Generate Quantitation ReportsTask 1. Create report methods
Task 1. Create report methods
Steps Detailed instructions Comments
1 Open the batch file iii_Test_01.batch.bin.
a To start the Quantitative Analysis program, click Quantitative Analysis (QQQ) on your desktop.
b Click Open Batch on the toolbar to show the Open Batch dialog box.
c Open \Your Directory\QuantExamples, and click iii_Test_01.batch.bin.
• If the batch is already open, skip to step 2.
• You can also access the program by clicking Programs > Agilent > MassHunter Workstation > Quantitative Analysis (QQQ) from the Start menu.
• If the default layout is not present, click Restore Default Layout on the toolbar before opening the batch.
2 Quantitate the samples for this batch, and save your results.
a With the Batch Table open, click Analyze Batch on the toolbar to generate results.
b Click File>Save to save the batch.
• Quantitative reports contain sample information generated during the batch. The reporting function will not work until sample results have been quantitated and saved.
• If the batch is already quantitated, skip to the next step.
3 Create a PDF report method. a Click Report > Generate from the toolbar.The system shows the Generate Report dialog box.
b Accept the default Report Folder directory for this report.
c Under Report Method, click New to create a new report method.
d Click Add Template in the Report Method Edit dialog box to open the browser.
e Open MassHunter/Report Templates/Quant/PDF-Reporting folder, select Gen_ResultsSummary.report.xml, and click Open.The program adds the template to the Template list in the Report Method Edit pane.
f Repeat steps d and e to add Gen_Complete.report.xml.
• You may change the destination folder for saving the report with the Report Folder option.
• The Report Method Edit feature of the software allows you to combine existing templates into a report method for developing an Excel or PDF report, or both.
• The software defaults to the last report method used for the last report generated. Rather than generate a new report method, you can use the default method if appropriate, or select a different existing method.
• To select an existing report method, click Choose under Report Method and navigate to the folder to select your method.
66 MassHunter Qualitative Analysis (K6460 and K6420) Familiarization Guide
4 Exercise 4 – Generate Quantitation ReportsTask 1. Create report methods
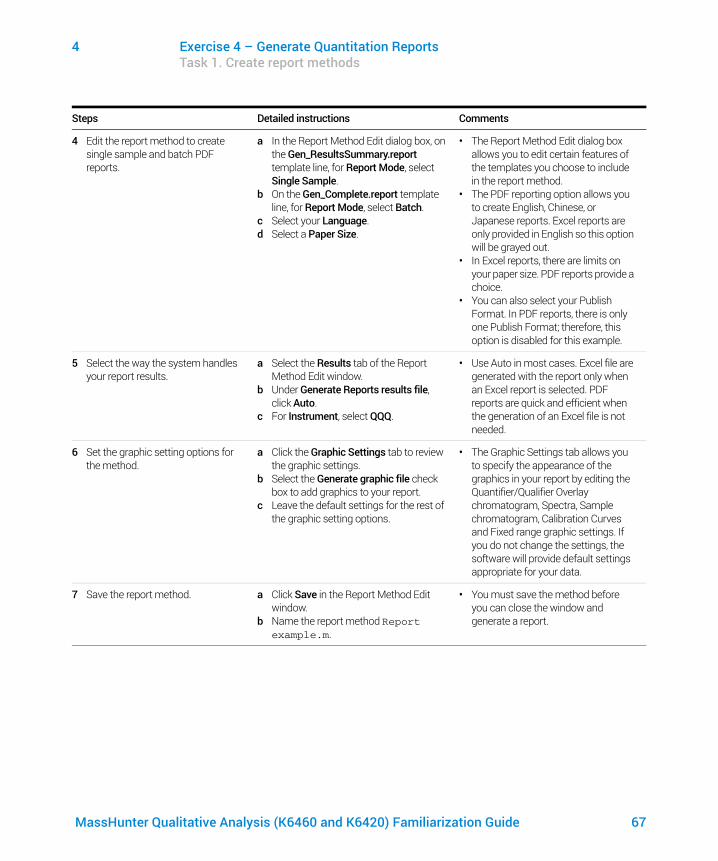
4 Edit the report method to create single sample and batch PDF reports.
a In the Report Method Edit dialog box, on the Gen_ResultsSummary.report template line, for Report Mode, select Single Sample.
b On the Gen_Complete.report template line, for Report Mode, select Batch.
c Select your Language.d Select a Paper Size.
• The Report Method Edit dialog box allows you to edit certain features of the templates you choose to include in the report method.
• The PDF reporting option allows you to create English, Chinese, or Japanese reports. Excel reports are only provided in English so this option will be grayed out.
• In Excel reports, there are limits on your paper size. PDF reports provide a choice.
• You can also select your Publish Format. In PDF reports, there is only one Publish Format; therefore, this option is disabled for this example.
5 Select the way the system handles your report results.
a Select the Results tab of the Report Method Edit window.
b Under Generate Reports results file, click Auto.
c For Instrument, select QQQ.
• Use Auto in most cases. Excel file are generated with the report only when an Excel report is selected. PDF reports are quick and efficient when the generation of an Excel file is not needed.
6 Set the graphic setting options for the method.
a Click the Graphic Settings tab to review the graphic settings.
b Select the Generate graphic file check box to add graphics to your report.
c Leave the default settings for the rest of the graphic setting options.
• The Graphic Settings tab allows you to specify the appearance of the graphics in your report by editing the Quantifier/Qualifier Overlay chromatogram, Spectra, Sample chromatogram, Calibration Curves and Fixed range graphic settings. If you do not change the settings, the software will provide default settings appropriate for your data.
7 Save the report method. a Click Save in the Report Method Edit window.
b Name the report method Report example.m.
• You must save the method before you can close the window and generate a report.
Steps Detailed instructions Comments
MassHunter Qualitative Analysis (K6460 and K6420) Familiarization Guide 67

4 Exercise 4 – Generate Quantitation ReportsTask 1. Create report methods
8 Close the Report Method Edit window.
a Click Save & Exit to close the Report Method Edit dialog box to return to the Generate Report window.
Steps Detailed instructions Comments
68 MassHunter Qualitative Analysis (K6460 and K6420) Familiarization Guide

4 Exercise 4 – Generate Quantitation ReportsTask 2. Generate the report
Task 2. Generate the report
Steps Detailed instructions Comments
1 Generate a report from the method. a Verify that the method you just created is listed for Report Method.
b For Samples/Compounds, clear the All Samples check box, to open the Batch Table.
c Select one of the samples in the Batch Table window, and click OK.
d Click All Compounds to show all the compounds in the sample you have selected.
e Select Generate reports now, and click OK to generate the report.
• You can choose to show all the samples and all the compounds in the batch, or select specific samples or compounds in the Batch Table to show in your report.
• PDF reports generate quickly, so Generate the report now is the best option to create the report right away. If you are generating an Excel file along with the report, you can select Queue report task to view the progress of the report it is generating.
• All reports generated are shown in the viewer. The most recent are shown at the top of the list.
• Reports are viewed or printed from the Excel or the PDF file you have created.
2 View the report. a Double-click on a file to open and show the report.
• You can also select the file in Windows Explorer to open the report.
MassHunter Qualitative Analysis (K6460 and K6420) Familiarization Guide 69

70 MassHunter Qualitative Analysis (K6460 and K6420) Familiarization Guide
This page intentionally left blank.

5 ReferenceTen Main Capabilities 72Quantitative Methods 76Parameter-Free Integrator 77Batch-at-a-Glance: Results 79Compounds-at-a-Glance 80Compound Confirmation 82Compound Calibration 83
MassHunter Qualitative Analysis (K6460 and K6420) Familiarization Guide 71

5 ReferenceTen Main Capabilities
Ten Main Capabilities
Quantitative Analysis includes 10 capabilities that help you integrate, quantitate, and review your data more easily and powerfully:
Batch-at-a-Glance: Batch Table Setup
• New batch — Creates a batch table in which you can operate on samples and compounds from a single view
• Analyze — Recreates the calibration curve and requantitates all samples using the method that is currently open
• Quantitate — Applies the existing calibration curve to the current batch, sample, or compound
The granularity of applying quantitation allows you to quickly manipulate a particular signal.
• Integrate — Integrates signals to the current batch, sample, or compound
Method Editor
• MRM Setup — Presents a quantitation method in simple stepwise fashion• Create method from acquired MRM data — Creates a quantitation method
automatically from the acquisition method after requiring only the assignment of ISTD relationship and concentrations
• Create a method manually — Create a method manually using the graphics in the Sample Information window
• Group by time segment — Organizes methods by compounds in ordered time segments
• Validate — Ensures that a quantitation method meets rigorous criteria• Isotopic dilution — Supports adjustments from (Rx, Ry) Colby constant
calculations
Calibration
• CurveFit assistant — Calculates all combinations of curves; picks disabled points; and presents results with an equation that is sortable by confidence band and custom filterable by R2, standard error, and max % residual
• Dilution assistant — Calculates and creates calibration levels based on a default or specified serial dilution scheme
72 MassHunter Qualitative Analysis (K6460 and K6420) Familiarization Guide

5 ReferenceTen Main Capabilities
• Copy Cal levels — Copies calibration levels from one compound to other compounds
• Disable Cal points — Disables calibration points based on level, or individual compounds in tables, or interactively through graphs
• Curve fits — Supports curves by:• Type: Linear, Quadratic, First order ln, Second order ln, Average of
Response Factors• Origin: Ignore, Include, Force, Blank Offset• Weight: None, 1/x, 1/x2, 1/y, 1/y2, Log, 1/SD2
• Replace curve — Creates calibration curves from existing calibration samples• Average replicates — Averages replicate levels in the method calibration
table.• Import levels — Imports calibration levels and concentrations from a file• Scale graphs — Provides graphs with the capability to be autoscalable by X,
Y, X-log, and Y-log; and intelligent zooming to fit specified levels
Integrator
• Agile and Agile2 integrator — Provides a parameter-free integrator at all levels of signals that reduces manual integration efforts
• Integrator metrics — Generates metrics that characterize the signal’s integration to accept, inspect, or reject the integration
• Signal-to-noise — Calculates signal-to-noise for peaks• Graphics — Shows superior interaction with the graphing of a compound and
the display of peak information
Batch-at-a-Glance: Results
• Navigation — Moves (previous, next, direct) between samples, compounds, time segments, and compound groups
• Compound views — Switches between the details of the current compound/sample or the summaries of multiple compounds/samples
• Batch Table views — Enables flat-table layouts or the capability to drill down to vertically or horizontally nested tables for details and compound table layout
• Window layout — Reorganizes the screen to its defaults, or saves or loads custom-window layouts
MassHunter Qualitative Analysis (K6460 and K6420) Familiarization Guide 73

5 ReferenceTen Main Capabilities
• AutoReview — Shows each sample automatically and interactively, allowing you to stop at any time for closer inspection
• Columns — Enables you to add, remove, reorder, save, load, restore, or reset columns
• Float pane — Floats any pane onto another monitor to enable dual-monitor presentations
• Export table — Exports Batch-at-a-Glance tables directly to Excel files• Export graphics — Exports any graphic to a customized size in multiple
formats• Copy/Paste — Copies or pastes any graphic directly into Microsoft Office
applications such as Word, PowerPoint, Excel, etc.• Print/Preview — Prints or previews screen content in WYSIWYG format
(what-you-see-is-what-you-get)• Filter — Shows any combination of sample types• Sort — Sorts any column that appears in a table
Compounds-at-a-Glance: Results
• Print/Preview — Prints or previews compound chromatograms.• Copy/Copy page — Copies selected compound chromatograms, or all
compound chromatograms on the screen into Microsoft Office applications such as Word, PowerPoint, Excel, etc.
• Edit compound chromatograms — Manually integrate the data, or select zero-peak compounds.
• Views — Shows chromatogram details such as baselines, filled peaks. • Adjust axes — Link/Unlink X or Y axis, autoscale to fit the panes, fit to peaks
or fit to calibration levels.• Layout — Organize rows by compounds or samples, select chromatogram
overlays, review sample by sample or compound by compound, set display options.
• Highlight — Compounds with outliers
74 MassHunter Qualitative Analysis (K6460 and K6420) Familiarization Guide

5 ReferenceTen Main Capabilities
Outlier Detection
• Manage — Sets up and selects specific outliers that can be detected and individually controlled
• Highlight — Highlights outlier values (high = red, low = blue) in the results table
• Filters — Lets you show the results of selected types of filters• Outliers — Supports specific types of data for outlier detection• Quantitation message — Warns you of samples that encountered serious
problems during quantitation
Report
• Generate — Generates graphics and report results for importing and formatting for Excel XML
• Custom — Lets you customize the Excel template• PDF Reporting — Lets you customize and generate PDF Reports
Update
• Update/Average RT — Updates or calculates weighted averages of the compound’s retention times
• Update Qualifier Ratios — Updates qualifier ratios based on the compound’s current sample
• Update Mass Assignments — Updates mass assignments based on compounds current sample
Qualitative
• Sample Information — lets you show the chromatogram and extracted spectra for the current sample
• Chromatogram/Spectrum — Provides significant features that can be used to explore spectra for different types of signals
MassHunter Qualitative Analysis (K6460 and K6420) Familiarization Guide 75

5 ReferenceQuantitative Methods
Quantitative Methods
The Method Editor lets you create a new quantitation method from an MRM acquisition data file (Figure 9), from SIM data, from an acquired Scan data file, or manually.
A file selected from the Batch Table is used as a reference for developing the method settings. These settings are then used to generate the calibration curve and quantitate the standards, QCs, and samples.
Figure 9. Quantitative view – Method Editor
76 MassHunter Qualitative Analysis (K6460 and K6420) Familiarization Guide

5 ReferenceParameter-Free Integrator
Parameter-Free Integrator
What is the parameter-free integrator?
Agilent has developed a new peak integrator algorithm that works especially well for MS/MS data. The parameter-free integrator presents these advantages:• Handles low-level noisy data by setting a peak’s starting and ending points
statistically• Adjusts the threshold automatically• Eliminates the need for manually reintegrating peaks for low-level MRM
signals• Identifies those peaks that appear reliable and those that should be discarded
Example of integration results
Figure 10 shows data at two extremes.
Figure 10. Parameter-free integrator – Data at two extremes
MassHunter Qualitative Analysis (K6460 and K6420) Familiarization Guide 77
5 ReferenceParameter-Free Integrator
The lower chromatographic peak could be easily integrated since it is a nice Gaussian-shaped peak, but it would be difficult to define the baseline of the upper peak. In fact, many integrator algorithms might interpret these results as multiple peaks.
However, The Agilent algorithm had no trouble defining the baseline and recognized this as a single peak. In fact, the new integrator algorithm would integrate this as a single peak even if the baseline were rising, instead of being flat, as shown.
78 MassHunter Qualitative Analysis (K6460 and K6420) Familiarization Guide

5 ReferenceBatch-at-a-Glance: Results
Batch-at-a-Glance: Results
Figure 11 shows the integration results obtained from the analysis of Compound-A. This is a flat view of the Batch Table, Compound Information, and Calibration Curve.
• The Batch Table shows the integration results from applying the quantitation method to each data file. Colored highlights correspond to results that are lower (blue) or higher (red) than expected.
• The Compound Information window at the lower left shows the integrated chromatographic peaks.
• The Calibration Curve is shown at the lower right.
Figure 11. Compound-A results
Batch Table window Compound Information window Calibration Curve window
MassHunter Qualitative Analysis (K6460 and K6420) Familiarization Guide 79
5 ReferenceCompounds-at-a-Glance
Compounds-at-a-Glance
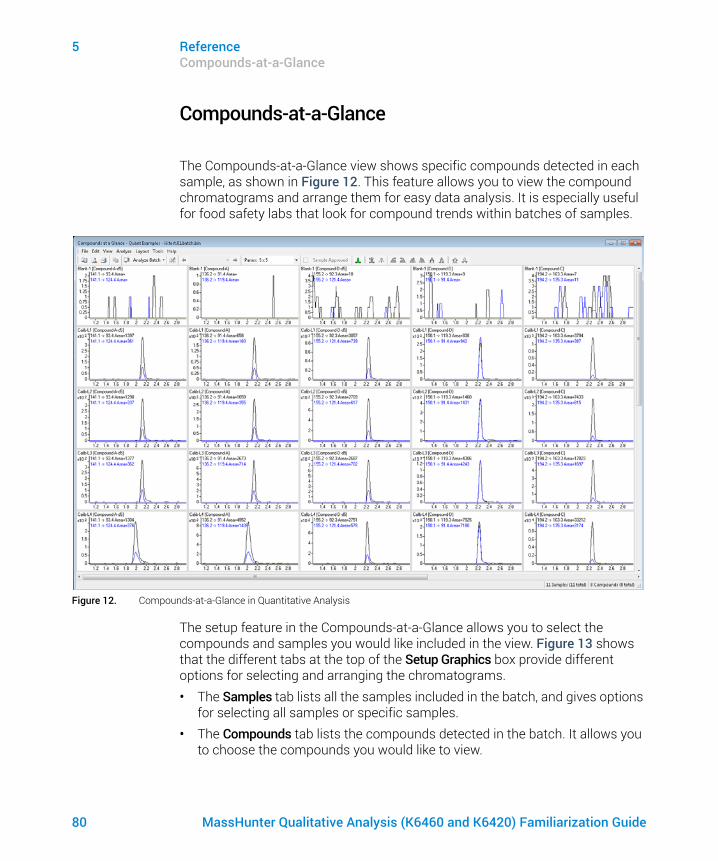
The Compounds-at-a-Glance view shows specific compounds detected in each sample, as shown in Figure 12. This feature allows you to view the compound chromatograms and arrange them for easy data analysis. It is especially useful for food safety labs that look for compound trends within batches of samples.
Figure 12. Compounds-at-a-Glance in Quantitative Analysis
The setup feature in the Compounds-at-a-Glance allows you to select the compounds and samples you would like included in the view. Figure 13 shows that the different tabs at the top of the Setup Graphics box provide different options for selecting and arranging the chromatograms.• The Samples tab lists all the samples included in the batch, and gives options
for selecting all samples or specific samples.• The Compounds tab lists the compounds detected in the batch. It allows you
to choose the compounds you would like to view.
80 MassHunter Qualitative Analysis (K6460 and K6420) Familiarization Guide

5 ReferenceCompounds-at-a-Glance
• The Organize tab allows you to specify the arrangement of the chromatograms, according to sample and compound. It provides overlay options for compounds, samples, and outliers. The tab gives choices for adjusting the chromatograms, such as showing baselines or fill peaks to best illustrate compound detection trends.
• The Outlier tab provides options for showing outliers in the data.
Figure 13. Setup options for Compounds-at-a-Glance
MassHunter Qualitative Analysis (K6460 and K6420) Familiarization Guide 81

5 ReferenceCompound Confirmation
Compound Confirmation
Figure 14 shows two alternative data presentation options.
Two product ions must be acquired for confirmation: a quantifier ion and a qualifier ion. Typically, the quantifier ion that is used for quantitation is the most abundant of the two product ions.
To be able to confirm the presence of Compound-A, the qualifier ion peak area must be at least a certain percentage of the quantifier ion, a number that is set in the quantitation method. In this example, 26.5% is used with a window of ± 20%. This means that the area of the qualifier ion must be in the range of 21.2 to 31.8% of the quantifier ion for the analyte Compound-A. The qualifier for the ISTD, or Compound-A-d5, also must be in a specific range.
From the figure on the left, whether or not the qualifier ion falls within the accepted window is not easily determined because the size of the qualifier peak is normalized by a factor of 1/0.265. In the figure on the right, the acceptance window is centered at 26.5% of the quantifier ion peak, and the qualifier ion is drawn not normalized, or on the same scale as the quantifier. If the ion is not
Figure 14. Compound-A in Quantitative Analysis
Overlay of quantifier and qualifier ions
Compond-A qualifier ion - Normalized Compound-A qualifier ion - Not normalized
82 MassHunter Qualitative Analysis (K6460 and K6420) Familiarization Guide

5 ReferenceCompound Calibration
within the required acceptance window, it is shaded blue, but is still transparent so as not to hide the quantifier ion. This makes it easier to visually confirm the presence of compounds.
Compound Calibration
The Quantitative Analysis program contains several tools to help calibrate and quantitate compounds:• CurveFit Assistant• Cursor Pointer for Data Point Information • Data Point Zooming
CurveFit Assistant
The CurveFit Assistant provides an analytical view of evaluating the possible curve fits (Figure 15 on page 84).
MassHunter Qualitative Analysis (K6460 and K6420) Familiarization Guide 83

5 ReferenceCompound Calibration
Note that the black line drawn through the data points uses Quadratic as the Fit, 1/x as the Weight, and Include as the Origin as shown at the top. Many other combinations of the curve settings are listed below the calibration curve, with the selected one highlighted in blue. The highlighted settings are also plotted in blue in the curve window.
You can find the best curve fit, for example, one that corresponds to the highest R2 value, by ordering all of the possible results from the best to the worse R2 values and then deciding how many data points to consider as being outliers.
For example, the first set of parameters in the list corresponds to a Linear Fit, Ignore Origin, and Equal Weight. The corresponding R2 value is 0.9998001477, which is very good. The corresponding curve can be plotted by simply clicking this entry in the table.
Using these settings, data can be requantitated. Eliminating outliers is common as a standard operating procedure (SOP) in some laboratories.
Figure 15. CurveFit Assistant
84 MassHunter Qualitative Analysis (K6460 and K6420) Familiarization Guide

5 ReferenceCompound Calibration
Data point information
Overlapping data points are not unusual in a calibration curve, especially with triple quad MS data, where %RSD values are quite low (Figure 16). To help distinguish the data points from each other, the cursor can be moved over the data points to obtain more information about them.
This figure shows two examples of this type of information. The first example shows that the data points overlap and advises you to zoom in to see them separately. The second example shows information on the data point itself.
Data point zooming
You can zoom in on overlapping data points to see individual data points not visible in the visual presentation.
Figure 16. Compound-A results: Calibration data point information
MassHunter Qualitative Analysis (K6460 and K6420) Familiarization Guide 85
www.agilent.comAgilent Technologies, Inc. 2018
May 2018
*K3335-90008*K3335-90008 Revision A
In This BookThe exercises in this guide help you learn to use the Agilent MassHunter Workstation Software Quantitative Analysis program. In this guide, you learn how to develop an analysis method.
For In Vitro Diagnostic Use
Manufactured for:Agilent Technologies Inc.5301 Stevens Creek Blvd.Santa Clara CA, 95051 USA