master 5.1a activate prior learning: solving linear equations
TRANSCRIPT

1 | P a g e
Name: ___________________________________ Date: __________________________
Master 5.1a Activate Prior Learning: Solving Linear Equations
To solve a linear equation, we isolate the variable on one side of the equation. To do this, we use inverse operations. Whatever we do to one side of an equation, we must also do to the other side. Always verify the solution.
• To solve the equation 3a + 17 = 26:
3a + 17 = 26 To isolate the variable, subtract 17 from each side.
3a + 17 – 17 = 26 – 17
3a = 9 Divide both sides by 3.
3
3
a =
9
3
a = 3
To verify the solution, substitute a = 3 in the equation. 3a + 17 = 26 L.S. = 3a + 17 R.S. = 26
= 3(3) + 17 = 26
Since the left side is equal to the right side, the solution is correct.
• To solve the equation 2 = 5
x – 3:
2 = 5
x – 3 To isolate the variable, add 3 to each side.
2 + 3 = 5
x – 3 + 3
5 = 5
x Multiply both sides by 5.
5(5) = 55
x
25 = x
Check Your Understanding
1. Verify the solution above for the equation 2 = 5
x – 3.
2. Solve each equation, then verify the solution. a) 6x + 4 = 22 b) 89 = 12y + 17 c) 9b – 13 = 122 d) –31 = –4c + 21 e) –5d + 11 = 96 f) –72 = –9 + 7e
3. Solve each equation, then verify the solution.
a) 15 = 7
x + 8 b)
11
a – 2 = 7 c) 21 =
5
b
+ 9

2 | P a g e
Name: ___________________________________ Date: __________________________
Master 5.1b Activate Prior Learning: Writing Inequalities
We use an inequality to model a situation that can be described by a range of numbers. The inequality signs are: < less than > greater than ≤ less than or equal to ≥ greater than or equal to To write an inequality that corresponds to a statement, replace the words that represent the inequality with the corresponding sign.
• g is greater than or equal to 5 g ≥ 5
We can graph the inequality on a number line.
A double inequality has 2 inequality signs in one statement.
• –3 < x ≤ 2 means that x represents all numbers greater than – 3 and less than or equal to 2. We can graph the inequality on a number line.
Check Your Understanding 1. Use a symbol to write an inequality that corresponds to each statement. a) s is less than 4. b) t is greater than or equal to –1. c) v is positive. d) w is less than or equal to 0. 2. Use symbols to write a double inequality that corresponds to each statement. a) e is greater than or equal to –2 and less than 2. b) f is greater than 0 and less than 12. c) g is greater than or equal to –3 and less than or equal to 7. d) h is greater than or equal to 3 and less than 8. 3. Graph each inequality on a number line. a) x is less than or equal to –5. b) y is greater than 2. c) j is greater than –1 and less than or equal to 4. d) k is greater than or equal to 2 and less than or equal to 7.
Since 5 is part of the solution, we draw a shaded circle at 5.
Since –3 is not part of the solution, we draw an open circle at –3.

3 | P a g e
Name: ___________________________________ Date: ________________________
Master 5.1c Activate Prior Learning: Graphing Linear Relations from Equations
To graph a linear relation from an equation, first create a table of values, then plot the data in the table on a grid. • To graph y = –4x + 6:
Create a table of values. Choose 3 values for x, then calculate the corresponding values of y. Substitute: x = –1 Substitute: x = 0 Substitute: x = 1 y = –4(–1) + 6 y = –4(0) + 6 y = –4(1) + 6
= 4 + 6 = 0 + 6 = –4 + 6 = 10 = 6 = 2
Write the values of x and y in a table.
x y –1 10 0 6 1 2
Plot the points on a grid. Since the data are not discrete, join the points.
Check Your Understanding 1. Create a table of values for each linear relation, then graph the relation.
Use values of x from –1 to 1. a) y = 4x b) y = x – 2 c) y = x + 2 d) y = 2x + 3 e) y = –2x + 3 f) y = 4 – x g) y = –3x – 4 h) y = 1 – 5x

4 | P a g e
Master 5.4a Answers Master 5.1a
1. L.S. = 2 R.S = 5
x – 3 =
25
5 – 3 = 5 – 3 = 2
Since the left side equals the right side, the solution is correct. 2. a) x = 3 b) y = 6 c) b = 15 d) c = 13 e) d = –17 f) e = –9 3. a) x = 49 b) a = 99 c) b = –60
Master 5.1b
1. a) s < 4 b) t ≥ –1 c) v > 0 d) w ≤ 0 2. a) –2 ≤ e < 2 b) 0 < f < 12 c) –3 ≤ g ≤ 7 d) 3 ≤ h < 8 3. a) b)
c) d)
Master 5.1c
1. a) b) c) d)
e) f) g) h)

5 | P a g e
Chapter5Makealistofallthenewwordsandthedefinitions!
6 | P a g e
Chapter 5.1 Relations pg 256-261 outcome R1
1. Animals can be associated with the classes they are in. a) Describe this relation in words.
b) Represent this relation:
i) as a set of ordered pairs ii) as an arrow diagram
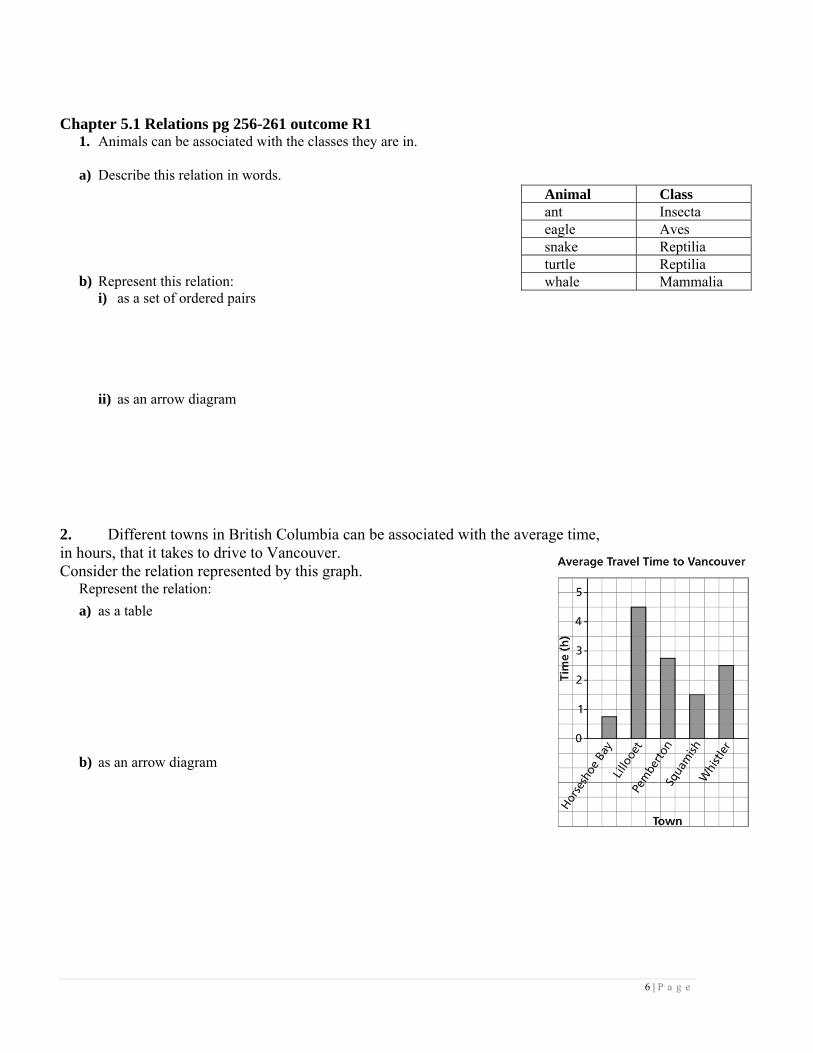
2. Different towns in British Columbia can be associated with the average time, in hours, that it takes to drive to Vancouver. Consider the relation represented by this graph. Represent the relation:
a) as a table b) as an arrow diagram
Animal Class ant Insecta eagle Aves snake Reptilia turtle Reptilia whale Mammalia

7 | P a g e
3. In the diagram below:
a) Describe the relation in words. b) List 2 ordered pairs that belong to the relation.
Homework Pg 262 #3-4 #5-7,9 #14
8 | P a g e
Chapter 5.2 Functions Page 264-270 outcome R2
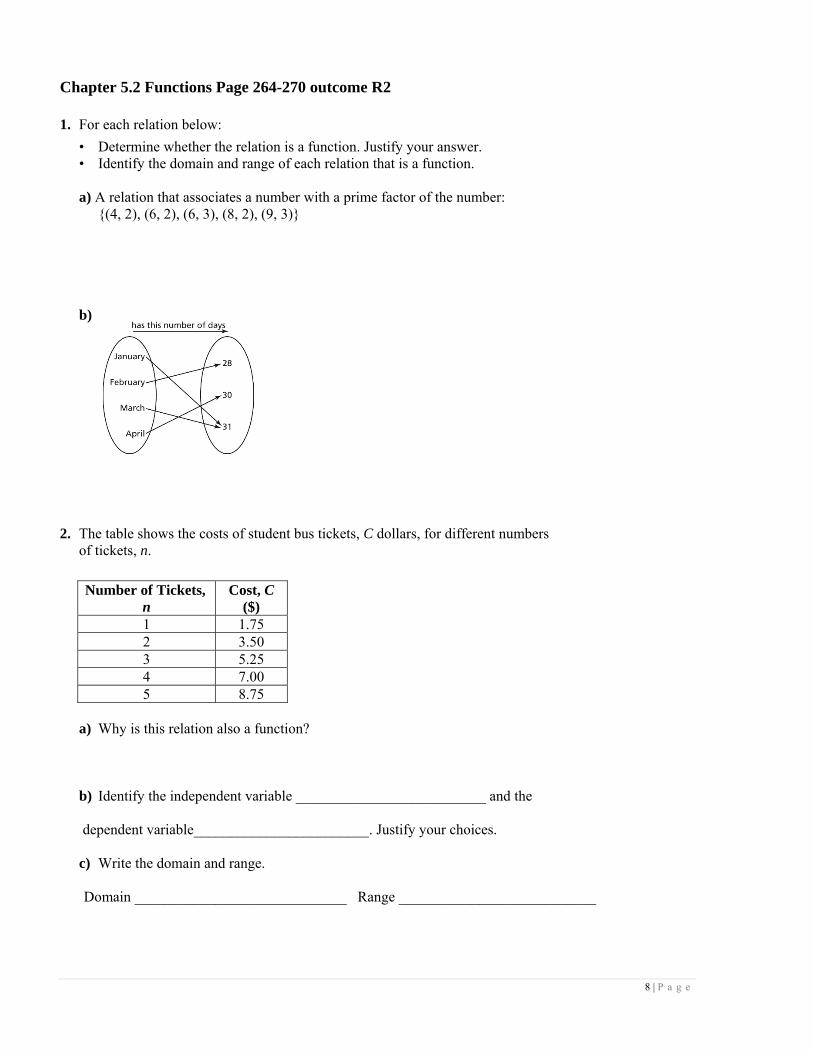
1. For each relation below:
• Determine whether the relation is a function. Justify your answer. • Identify the domain and range of each relation that is a function. a) A relation that associates a number with a prime factor of the number:
{(4, 2), (6, 2), (6, 3), (8, 2), (9, 3)} b)
2. The table shows the costs of student bus tickets, C dollars, for different numbers
of tickets, n.
Number of Tickets,
n Cost, C
($) 1 1.75 2 3.50 3 5.25 4 7.00 5 8.75
a) Why is this relation also a function? b) Identify the independent variable __________________________ and the dependent variable________________________. Justify your choices. c) Write the domain and range. Domain _____________________________ Range ___________________________

9 | P a g e
3. The equation C = 25n + 1000 represents the cost, C dollars, for a feast following an Arctic sports competition, where n is the number of people attending.
a) Describe the function. Write the equation in function notation. b) Determine the value of C(100). What does this number represent? c) Determine the value of n when C(n) = 5000. What does this number represent?
Homework pg 270 #4-5 #8-10, 13-16, 19 #21

10 | P a g e
Chapter 5.3 Interpreting & Sketching Graphs page 276-281 outcome R1
1. Each point on this graph represents a person. Explain your answer to each question below.
a) Which person is the oldest? _______What is her or his age?_________ b) Which person is the youngest? ________What is her or his age?__________ c) Which two people have the same height? _____________What is this height? __________ d) Which two people have the same age? ____________ What is this age? ____________ e) Which of person B or C is taller for her or his age? ____________
2. This graph represents a day trip from Athabasca to Kikino in Alberta, a distance of approximately 140 km. Describe the journey for each segment of the graph.
Segment Graph Journey
OA
AB
BC
CD
DE

11 | P a g e
3. At the beginning of a race, Alicia took 2 s to reach a speed of 8 m/s.
She ran at approximately 8 m/s for 12 s, then slowed down to a stop in 2 s. Sketch a graph of speed as a function of time. Label each section of your graph, and explain what it represents.
Segment Journey OA
AB
BC
Homework page 281 #3 #4-9,13,14 #16

12 | P a g e
5.5 Graphs of Relations and functions pg 287-293 outcome R2
1. Which of these graphs represents a function? Justify your answer.
a) b)
Function or Not a Function? Function or Not a Function?
Why? Why?
2. Determine the domain and range of the graph of each function.
a) b)
Domain ____________ Range ____________
Domain _____________ Range _____________

13 | P a g e
3. This graph shows the approximate height of the tide, h metres, as a function of time, t, at Port Clements, Haida Gwaii on June 17, 2009.
a) Identify the dependent variable ___________________________
and the independent variable______________________________. Justify your choices.
b) Why are the points on the graph connected? Explain. c) Determine the domain and range of the graph.
Domain ____________ Range ____________ 4. Here is a graph of the function g(x) = 4x – 3.
a) Determine the range value when the domain value is 3. Range value ________________ b) Determine the domain value when the range value is –7.
Domain value ________________
5.5 Homework pg 294 #4-7 #8,9,11,12,15,17 #22, 24

14 | P a g e
Chapter 5.6 Properties of Linear Relations pg 300-307 outcome R4 1. Which table of values represents a linear relation? Justify your answer.
a) The relation between the number of bacteria in a culture, n, and time, t minutes.
t n 0 1 20 2 40 4 60 8 80 16
100 32 b) The relation between the amount of goods and services tax charged, T dollars, and the amount of the
purchase, A dollars
A T 60 3
120 6 180 9 240 12 300 15
2. a) Graph each equation. b) Which equations in part a represent linear relations? How do you know?
i) x = –2

15 | P a g e
ii) y = x + 25 iii) y = 25 iv) y = x2 + 25

16 | P a g e
3. Which relation is linear? Justify your answer.
a) A dogsled moves at an average speed of 10 km/h along a frozen river. The distance travelled is related to time.
b) The area of a square is related to the side length of the square.
4. A hot tub contains 1600 L of water. Graph A represents the hot tub being filled at a constant rate. Graph B represents the hot tub being emptied at a constant rate.
a) Identify the dependent__________________ and independent ______________________variables. b) Determine the rate of change of each relation, then describe what it represents.
Graph A: Graph B: Homework pg 307 #3-5 #6-10, 17 #18, 19,22

17 | P a g e
Chapter 5.7 Graphs of Linear Functions pg 311-318 outcome R5
1. This graph shows how the height of a burning candle changes with time.
a) Write the coordinates of the points where the graph intersects the
axes. ________________ ________________
Determine the vertical intercept______________ and horizontal intercept_________________. Describe what the points of intersection represent. b) What are the domain ___________________and range ______________________of this function?
3. Which graph has a rate of change of –5 and a vertical intercept of 100?
Justify your answer.
a) b)
4. This graph shows the total cost for a house call by an electrician for up to 6 h work. The electrician charges $190 to complete a job. For how many hours did she work?
Homework Read all of chapter 5 Pg 319 #4-5 #6,7,9,11,14,15,17, #18,19 Do the chapter review for ch 5 and chapter test in textbook!