master in integrated systems biology › bitstream › 10993 › 39848 › 1 › bintener... ·...
TRANSCRIPT

Faculty of Science, Technology and Communication
Master in Integrated Systems Biology
Master Thesis
by
Tamara BINTENERBorn 19 June 1991 in Luxembourg (Luxembourg)
PREDICTION OF DRUG TARGETS USING
METABOLIC MODELLING

Faculty of Science, Technology and Communication
Master in Integrated Systems Biology
Master Thesis
by
Tamara BINTENERBorn 19 June 1991 in Luxembourg (Luxembourg)
PREDICTION OF DRUG TARGETS USING
METABOLIC MODELLING
This project was performed within the Systems Biology group in the Life ScienceResearch Unit (LSRU) at the University of Luxembourg.
Defense: 15 July 2016 in LuxembourgSupervisors: Maria PIRES PACHECO, Systems Biology (LSRU)
Thomas SAUTER, Ph.D, Prof., Systems Biology (LSRU)Jury members: Elisabeth Letellier, Ph.D, Molecular Disease Mechanisms (LSRU)
Francisco Azuaje, Ph.D, NORLUX Neuro-Oncology Laboratory (LIH)
II

Acknowledgements
This project was performed within the Systems Biology group in the Life ScienceResearch Unit (LSRU) at the University of Luxembourg.
First of all, I would like to thank Thomas Sauter for allowing me to carry out thismaster thesis in the Systems Biology Group of the University of Luxembourg. His adviceand knowledge helped me to focus on the important matters during the development ofthis project.
I would also like to thank my direct supervisor, Maria Pires Pacheco, for giving meconstructive feedback and further ideas in this project. Her advice and help always provedto be valuable and she always came up with new ideas for this project.
Furthermore, I would like to thank Elisabeth Letellier and Francisco Azuaje for ac-cepting to be my reviewers.
Lastly, I would like to thank my family and friends for proofreading and encouragingme during the time of my master thesis.
III

Table of Contents
1 Introduction 11.1 Networks and modelling approaches in systems biology . . . . . . . . . . 31.2 Cancer as a disease of interest for metabolic modelling . . . . . . . . . . 91.3 Metabolic modelling and its use in drug discovery . . . . . . . . . . . . 151.4 Aim . . . . . . . . . . . . . . . . . . . . . . . . . . . . . . . . . . . . . 16
2 Material and methods 172.1 Initial model and model reconstruction . . . . . . . . . . . . . . . . . . 17
2.1.1 The RNA-sequencing dataset from the TCGA . . . . . . . . . . 172.1.2 The melanoma microarray dataset, GSE46517 . . . . . . . . . . 182.1.3 Reconstruction of context-specific models from the datasets . . . 20
2.2 In silico knockouts and essential genes . . . . . . . . . . . . . . . . . . 212.3 Drug target prediction and side effects . . . . . . . . . . . . . . . . . . 22
2.3.1 Databases used for finding drugs and their targets . . . . . . . . 23Entrez Gene database by NCBI . . . . . . . . . . . . . . . . . . 23UniProt database . . . . . . . . . . . . . . . . . . . . . . . . . 23DrugBank Version 4.5 . . . . . . . . . . . . . . . . . . . . . . . 24STITCH Version 4.0: Search Tool for InTeracting CHemicals . . 24PubChem database by NCBI . . . . . . . . . . . . . . . . . . . . 24SIDER Version 4.1: Side Effect Resource . . . . . . . . . . . . . 24
2.3.2 Finding side effects . . . . . . . . . . . . . . . . . . . . . . . . . 25
3 Results 263.1 Overview and schematic of the workflow . . . . . . . . . . . . . . . . . 263.2 Creation of a consistent model, model reconstruction and comparison . . 27
3.2.1 Microarray quality control . . . . . . . . . . . . . . . . . . . . . 273.2.2 Reconstruction of context-specific models and model comparison 29
RNA-sequencing dataset from the TCGA . . . . . . . . . . . . . 30Microarray dataset. . . . . . . . . . . . . . . . . . . . . . . . . 30
3.2.3 Model comparison . . . . . . . . . . . . . . . . . . . . . . . . . 32Active pathways . . . . . . . . . . . . . . . . . . . . . . . . . . 33
3.3 Gene deletions (in silico knock-outs and disease association) . . . . . . . 353.3.1 Single gene deletion . . . . . . . . . . . . . . . . . . . . . . . . 35
TCGA dataset . . . . . . . . . . . . . . . . . . . . . . . . . . . 35Microarray dataset, GSE46517 . . . . . . . . . . . . . . . . . . . 37
3.3.2 Gene-disease associations . . . . . . . . . . . . . . . . . . . . . 373.4 Drug targets . . . . . . . . . . . . . . . . . . . . . . . . . . . . . . . . 38
IV

3.4.1 From genes to drug targets . . . . . . . . . . . . . . . . . . . . 38DrugBank database . . . . . . . . . . . . . . . . . . . . . . . . 39STITCH database . . . . . . . . . . . . . . . . . . . . . . . . . 40
3.4.2 Cancer and melanoma drug targets . . . . . . . . . . . . . . . . 40
4 Discussion 434.1 Comparison of the healthy and cancer models . . . . . . . . . . . . . . . 434.2 Results from the single gene deletion study: essential genes in cancer . . 454.3 Drug targets in cancer - drugs and their side effects . . . . . . . . . . . 474.4 Outlook . . . . . . . . . . . . . . . . . . . . . . . . . . . . . . . . . . 52
5 Supplementary data I5.1 Supplementary Figures . . . . . . . . . . . . . . . . . . . . . . . . . . . I5.2 Supplementary Tables . . . . . . . . . . . . . . . . . . . . . . . . . . . XIII
V

List of Figures
1.1 Yeast protein-protein interaction network (left) and the humansignalling network (right) . . . . . . . . . . . . . . . . . . . . . . . 2
1.2 Simplified metabolic network with reaction rates (upper) andstoichiometric matrix S (lower) . . . . . . . . . . . . . . . . . . . . 4
1.3 Graphical representation of the solution space in flux balanceanalysis . . . . . . . . . . . . . . . . . . . . . . . . . . . . . . . . . . 6
1.4 Creation of a consistent network via FASTCC . . . . . . . . . . . 81.5 "The Hallmarks of Cancer" . . . . . . . . . . . . . . . . . . . . . . 101.6 Stages of cutaneous melanoma cancer . . . . . . . . . . . . . . . 113.1 Workflow overview . . . . . . . . . . . . . . . . . . . . . . . . . . . 263.2 Heatmap of the microarray expression data . . . . . . . . . . . . 283.3 Three-dimensional principal component analysis plot . . . . . . . 293.4 Clustergram based on the Jaccard index of the microarray data
(MPA) . . . . . . . . . . . . . . . . . . . . . . . . . . . . . . . . . . 313.5 Up- and down-regulated pathways in cancer for both datasets . 343.6 Growth ratios for the MPC models reconstructed from both
datasets . . . . . . . . . . . . . . . . . . . . . . . . . . . . . . . . . . 363.7 Top ten targeted genes and drugs from the DrugBank and
STITCH . . . . . . . . . . . . . . . . . . . . . . . . . . . . . . . . . . 414.1 Venn diagram of the cancer exclusive essential genes and their
distribution . . . . . . . . . . . . . . . . . . . . . . . . . . . . . . . . 485.1 Distribution of the microarray expression data before and after
fRMA normalization . . . . . . . . . . . . . . . . . . . . . . . . . . I5.2 Principal component analysis of the GSE46517 dataset . . . . . II5.3 Clustergram based on the Jaccard index of 318 models (MPA),
reconstructed from RNA-sequencing data . . . . . . . . . . . . . . III5.4 18 clustergrams based on the Jaccard index of 318 models
(MPA), reconstructed from RNA-sequencing data, regroupedby tissue type . . . . . . . . . . . . . . . . . . . . . . . . . . . . . . IV
5.5 Clustergram of 36 models (MPC), reconstructed from RNA-sequencing data . . . . . . . . . . . . . . . . . . . . . . . . . . . . . V
5.6 Clustergram of 5 models (MPC), reconstructed from microarraydata . . . . . . . . . . . . . . . . . . . . . . . . . . . . . . . . . . . . VI
5.7 Number of active genes in each pathway (TCGA) . . . . . . . . VII5.8 Number of active genes in each pathway (GSE46517) . . . . . . VIII5.9 Fractions of active reactions for healthy vs. cancer (TCGA data) IX5.10 Fractions of active reactions for healthy vs. healthy (GSE46517) X
VI

5.11 Median pathway distribution for the TCGA dataset . . . . . . . . XI5.12 Median pathway distribution for the GSE46517 dataset . . . . . XII
List of Tables
2.1 Overview of the TCGA dataset used for model creation . . . . . 182.2 Overview of the microarray data used for model creation . . . . 193.1 Overview of the MPC models from the GSE46517 dataset . . . 323.2 Number of essential genes for each condition, case and dataset 373.3 Summary of the number of interactions and drugs found in the
DrugBank and STITCH database . . . . . . . . . . . . . . . . . . 393.4 Number of drug targets found for both datasets and cases . . . 424.1 Overview and inhibiting drugs of the eight candidate genes with
a known link to cancer . . . . . . . . . . . . . . . . . . . . . . . . . 495.1 Overview of the MPC models from the TCGA dataset . . . . . . XIII5.2 Number of genes and exclusive genes found for the TCGA datasetXIV5.3 Difference of the fractions of active reactions between healthy
and cancer in each pathway for both datasets . . . . . . . . . . . XIV5.5 Number of gene-disease associations found in different databases
and p-values for the gene-disease associations from the hyper-geometric test . . . . . . . . . . . . . . . . . . . . . . . . . . . . . . XVII
5.6 Essential genes found in cancer, inhibiting drugs and link tocancer (for case 2 and 3, for both datasets) . . . . . . . . . . . . XVIII
VII

Abstract
Cancer, as one of the leading causes of death worldwide, is a disease characterizedby the abnormal and uncontrolled proliferation of cells. Currently available anti-cancerdrugs come with a variety of different side effects reducing the quality of life of cancerpatients. Due to these severe side effects in anti-cancer therapy it is important to finda compromise between killing the cancer cells (efficiency) and not affecting the healthycells (toxicity) to improve the quality of life of those patients. There exist differentmethods of finding new drug targets in cancer such as the in vitro development of newdrugs which is very time consuming and expensive. The in silico prediction of targets,on the other hand, is fast and cost effective and allows to make a pre-selection of drugtargets based on candidate genes.
In this work, I propose a new workflow which implements metabolic modelling forfinding metabolic drug targets in cancer. Therefore, context-specific models for cancer(including primary and metastatic melanoma) and healthy controls were reconstructedfrom Recon 2 (a genome scale metabolic model) using FASTCORMICS and two dif-ferent expression datasets. In silico single gene deletion was performed in the modelsto search for potential candidate genes which are essential in cancer (reduce biomassproduction by 50%) but not in healthy (do not affect ATP production). In a second step,(approved) drugs targeting metabolic genes and their side effects, were extracted fromthe DrugBank, STITCH and SIDER through data mining and mapped to the metabolicnetwork. A total of 65 possible drug targets have been found. These targets includegenes which are known targets for chemotherapeutic agents such as the thymidylatesynthase (TYMS), the fatty acid synthase (FASN) or dihydrofolate reductase (DHFR).Furthermore, two anti-cancer agents have been predicted for FASN which have alreadybeen proposed for the treatment of cancer.
VIII

Abbreviations
Abbreviation ExplanataionATC code Anatomical Therapeutic Chemical codeBAP1 BRCA1 Associated ProteinBLCA Bladder CarcinomaBRCA Breast CancerCDK4 Cyclin-dependent kinase 4CDKN2A Cyclin dependent kinase inhibitor 2ACESC Cervical Squamous Cell CarcinomaCID PubChem compound identifierCOAD Colon adenocarcinomaCosmic Catalogue Of Somatic Mutations In CancerCTD The Comparative Toxicogenomics DatabaseCTLA-A Cytotoxic T-lymphocyte-associated antigen 4CYP CytochromeE. coli Escherichia coliENSP Ensembl protein identifierFPKM Fragments Per Kilobase of transcript per Million mapped readsfRMA Frozen Robust Multi-array AverageGBM Glioblastoma multiformeGENRE Genome Scale metabolic reconstructionGEO Gene Expression OmnibusHNSC Head and Neck squamous cell carcinomaKICH Kidney ChromophobeKIRC Kidney renal clear cell carcinomaKIRP Kidney renal papillary cell carcinomaLIHC Liver hepatocellular carcinomaLUAD Lung adenocarcinomaLUSC Lung squamous cell carcinomaMC1R Melanocortin-1 receptorMedDRA Medical Dictionary for Regulatory ActivitiesMedDRA Medical Dictionary for Regulatory ActivitiesMITF Microphthalmia-associated transcription factorMM Metastatic MelanomaMPA Model per arrayMPC Model per conditionN Nevi
IX

NCBI National Center for Biotechnology InformationNCG Network of Cancer GenesNEM Normal Epithelial MelanocytesPM Primary MelanomaPOT1 Protection of telomeresPRAD Prostate adenocarcinomaRB RetinoblastomaREAD Rectum adenocarcinomaS SkinSIDER Side Effect ResourceSKCM Skin Cutaneous MelanomaSLC Solute carrier familySTAD Stomach adenocarcinomaSTITCH Search Tool for InTeracting CHemicalsT1 Melanoma stage 1T2 Melanoma stage 2T3 Melanoma stage 3T4 Melanoma stage 4TCGA The Cancer Genome AtlasTERT Telomerase reverse transcriptaseTHCA Thyroid carcinomaTis In situ stage of melanomaUCEC Uterine Corpus Endometrial CarcinomaUV Ultraviolet
X

1 Introduction
Systems biology, as an emerging field in science, seeks to understand biological systemsas a whole by considering the structure of the systems and interactions between the entitiesimplicated in a system rather than focusing on properties of the individual genes or proteinsand their associated properties. It is not restricted to the study of single genes or proteins butalso covers the dynamics as well as the different interactions of its subparts i.e. genes, proteins,single cells, and tissues (Kitano, 2002; Kitano and Others, 2001).
The systems approach is mainly holistic, meaning that all the parts of a system are inter-connected and their interactions should not be neglected. As stated by Aristotle "The wholeis more than the sum of its parts" (Upton et al., 2014). However, this does not mean thatthe reductionist approach is wrong. In fact, by taking apart and studying the single pieces of awhole (as in reductionism), important information can be gained. Thus, the systems approachtries to combine both holistic and reductionist approaches towards gaining the most informationabout a given system.
Understanding these systems is currently one of the biggest challenges in biology. In orderto elucidate and analyse the functions of a biological system, computational models of differentkinds have been created. Examples of biological systems can be single cells, protein networks,or whole organisms such as E. coli (Escherichia coli), a popular model organism whose genomewas completely sequenced in 1997 (Blattner et al., 1997). The E. coli metabolic map, oneof the first genome-scale metabolic models, was constructed shortly after the sequencing ofits genome. By mapping annotated transcripts (retrieved from databases) to the reactomean in silico representation of the E. coli metabolism was constructed (Edwards and Palsson,2000). The same procedure was used for all of the following genome-scale reconstructions.Other examples of computational models are protein interaction networks which allow for therepresentation of the interactions between different proteins. These networks can be verycomplex as seen in the yeast (Saccharomyces cerevisiae) protein-protein interaction network orthe human signalling network (Figure 1.1) (Schwikowski et al., 2000). Other networks suchas gene regulatory networks, signalling networks, neuronal networks or metabolic networks alsoplay an important role in studying an organism.
As a branch of systems science, systems biology had already appeared by the middle of the20th century, however, there is little information on its history (Trewavas, 2006). The field ofsystems biology gained more popularity and applications after important advances in molecularbiology, such as the possibility to perform whole genome analyses or the invention of mRNAmicroarrays. Computer sciences helped in the generation of high throughput data or "-omics"data as well as in making these data publicly available through different databases. GEO(Gene Expression Omnibus) (Barrett et al., 2013) or ArrayExpress (Kolesnikov et al., 2015) areexamples for microarray data (mRNA-expression) databases. A recent review states that "thecost of such data generation has decreased exponentially and the amount of data generated
1

Figure 1.1: Yeast protein-protein interaction network (left) and the human signallingnetwork (right)Left: The yeast protein-protein interaction network is shown. The nodes represent yeast proteinsand the edges (lines) their interaction. The network encompasses 1,548 proteins and 2,358interactions where the proteins are colour-coded according to their function. Image taken from(Schwikowski et al., 2000).Right: Hairball representation of the human signalling network The nodes represent the genesand the edges (lines) their interactions. In this example, the interactions and genes are colour-coded. Image taken from (Liu et al., 2014).——————————————————————————————————————–
has become more abundant, which enables biologists to view and study cells as systems ofinteracting components" (Bordbar et al., 2014).
According to Dr. Trey Ideker, systems biology is a "discovery and hypothesis-driven science"(Ideker et al., 2001). Both discovery and hypothesis-driven science are in high contrast toeach other. While the first one seeks to characterize and analyse all the subparts of a givensystem, even if this involves the creation of gigantic datasets in order to find patterns andcorrelations in the data, the latter "creates hypotheses and attempts to distinguish amongthem experimentally" (Ideker et al., 2001).
Furthermore, systems biology can be divided into a bottom-up and top-down systems biologyapproach. The bottom-up approach collects as much information on the underlying mechanismsand parts of a system ("bottom") as possible and tries to combine the data to ultimately createa model of the system. The top-down approach, on the contrary, gathers detailed informationon the whole system ("top"), then tries to divide it into smaller pieces or systems to elucidateunderlying parts and interactions. The aim of the top-down approach is the discovery of new(molecular) mechanisms (Bruggeman and Westerhoff, 2007).
2

As stated before (and in my previous research practical report), "systems biology does notonly call for knowledge in biological fields but also in (bio-)informatics. Dr. Hiroaki Kitanoputs the computational approach to systems biology as follows: "Computational biology hastwo distinct branches: knowledge discovery, or data-mining, which extracts the hidden patternsfrom huge quantities of experimental data, forming hypotheses as a result; and simulation-based analysis, which tests hypotheses with in silico experiments, providing predictions to betested by in vitro and in vivo studies" (Hiroaki, 2009). Thus, systems biology can be seen asan interdisciplinary field of study, combining both biology and computer sciences" (Bintener,2015).
In the following sub-sections different approaches in systems biology will be discussed aswell as the use and creation of (context-specific) metabolic models, specifically in cancer.
1.1 Networks and modelling approaches in systems biology
By combining biology and computer sciences, computational models which represent a givennetwork as accurately as possible can be established and in silico experiments can be performed.The studied network, system, or organism can be either very simple or very complex (i.e. theyeast protein-protein interaction network or the human signalling network as seen in Figure1.1).
For the creation of metabolic models, two popular modelling frameworks are used as foun-dation: kinetic modelling and stoichiometric modelling. In kinetic modelling, the interactionsbetween the subparts of a systems are mainly represented by ordinary differential equations withkinetic rates. Kinetic rates or parameters describe the change in concentration or amount of agiven metabolite in the system and add some dynamics to the system. However, it is not alwayspossible to determine all of the parameters for a given network if the size of the network is toolarge or the concentrations of the metabolites too small. In contrast, stoichiometric modelling,assumes a quasi steady state of the model i.e. its state is not changing over time. Further-more, the metabolites and reactions of the model can be summarized by the stoichiometricmatrix which is a simple representation of which metabolite takes place in a given reaction.Stoichiometric modelling is devoid of kinetic parameters and can therefore take part in largescale models.
By taking a small metabolic network as an example and by adding the reaction rates ormetabolic fluxes v1, v2, v3, v4, and v5, the stoichiometric matrix S can be created (see Figure1.2). If a metabolite acts as a substrate in a reaction, its coefficient for the given reactionis negative as it is considered to be consumed. If it acts as a product in a given reaction, itscoefficient for the given reaction is positive as it is considered to be produced (Orth et al.,2010).
Genome scale network reconstructions (GENREs) are used to model the metabolic networkof a given organism. So far, the metabolism of over 100 different organisms, including bacteria,
3

S =
v1 v2 v3 v4 v5
A −1 0 0 0 0
B +1 −1 −1 0 0
C 0 +1 0 −1 +1
D 0 0 +1 +1 −1
Figure 1.2: Simplified metabolic network with reaction rates (upper) and stoichiometricmatrix S (lower)The upper image represents a simplified metabolic network. A, B, C and D are differentmetabolites, v1 to v5 designate the reaction rates or metabolic fluxes of the reaction taking placebetween the metabolites. The lower matrix depicts the stoichiometric matrix of the metabolicnetwork above. A, B, C, and D on the left side of the matrix represent the metabolites andv1 to v5 above the matrix represent the reactions taking place. The matrix itself harbours thecoefficient for the given metabolite and the given reaction.——————————————————————————————————————–
4

archaea, and eukarya, has been modelled using GENREs and its number is steadily increasing(Monk et al., 2014). There are, however, major differences in quality and coverage of thedifferent reconstructions. Formerly, GENREs were constructed manually by using informationavailable from literature and databases. Nowadays, it is possible to construct these networksautomatically, although, manual refinement and manual curation is often needed in order tocreate a high quality reconstruction (Thiele and Palsson, 2010). As the reconstructions try tocover whole organisms, it is possible to extract a subnetwork from the original network if theneed arises and then optimize the subnetwork.
Several GENREs dedicated to the human metabolism have also been published. Some ex-amples are Recon 1 (Rolfsson et al., 2011), Recon 2 (Thiele et al., 2013), the Human MetabolicReconstruction (Agren et al., 2012), the Human Metabolic Reconstruction 2 (Mardinoglu et al.,2014), and the Edinburgh Human Metabolic Network (Hao et al., 2010).
The aim of GENREs is to provide a reliable tool which "provide[s] the best representationof the metabolic capabilities of a target organism on the basis of the information availableat the time of reconstruction" (Monk et al., 2014). Thus, they are an important source ofinformation in regard to the metabolism of an organism. Further, in silico experiments such asthe perturbation of metabolites or fluxes as well as gene deletions can help in elucidating thenetwork and its underlying properties.
In order to properly analyse a computational model, several approaches have been devel-oped. Different approaches are used for different models but not all approaches are suitablefor GENREs such as logical or boolean approaches which focus more on signalling and tran-scriptional regulatory networks. In Boolean approaches, the prediction consists of assessing the"global activity sates and on-off states of genes" (Bordbar et al., 2014).
For GENREs, in order to predict the flux of a metabolite or to find essential genes, aconstraint based modelling approach is usually used. A popular method to predict those fluxesis flux balance analysis which is based on the idea that "a cell is "striving" to achieve a metabolicobjective" (Bordbar et al., 2014). This metabolic goal can be of different types and is usuallydefined as the objective function of a metabolic model. Common objective functions, assessingthe growth rate of an organism, are the optimization for biomass production or growth of acell or the energy production in form of ATP by minimizing the use of substrate. Thus, it wassaid that flux balance analysis is often used to "predict [i.e.] the growth rate of an organism orthe rate of production of a biotechnologically important metabolite" (Orth et al., 2010). Thisis achieved by using linear programming to search for the optimal flux distribution in order tomaximize the objective function. As kinetic parameters of the reactions are not being takeninto account, flux balance analysis cannot predict metabolite concentrations.
Flux variability analysis is another method used in constraint based modelling. It seeks todiscover alternative optimal fluxes by searching for the "existence of alternate optimal solutionswherein the same maximal objective (e.g., growth rate) can be achieved through different fluxdistributions" (Mahadevan and Schilling, 2003). The objective does not have to be maximized.
5

Figure 1.3: Graphical representation of the solution space in flux balance analysisThe leftmost image shows the unconstrained three dimensional solution space where no con-straints are applied. The image in the centre shows the solution space after applying all of thegiven constraints in the model. All solutions found in the allowable solution space are accepted.The rightmost image shows the optimal solution by flux balance analysis. Here the optimalsolution is one single value in the solution space. Image taken from (Orth et al., 2010)——————————————————————————————————————–
Flux variability analysis can also search for the "minimum and maximum flux for reactions inthe network while maintaining some state of the network, e.g., supporting 90% of maximalpossible biomass production rate." (Gudmundsson and Thiele, 2010). If optimal growth cannotbe achieved, flux variability analysis can be used to assess the flux distribution of the reactions(Reed and Palsson, 2004). Further, flux variability analysis can also be used to evaluate therobustness or flexibility of a metabolic model (Thiele et al., 2010).
Constraint based modelling would not be called as such if there were no constraints. Ingeneral, while simulating a metabolic model on a computer, several constraints need to betaken into account while performing the flux balance analysis. If a cell wants to grow anddivide it needs nutrients. However, nutrients are normally neither freely available nor availablein unlimited amount. Further, space is also a constraint for any living organism as the naturalenvironment is limiting the organism or cell. These limits are used to constrain the space ofallowed solutions (allowable solution space, see Figure 1.3).
According to Dr. Nathan Price and Professor Bernard Palsson, there are four differentcategories of constraints which limit cellular functions. Therefore, different phenotypes can beobserved. These available phenotypes include "physico-chemical constraints (conservation ofmass, energy and momentum), topobiological constraints (available space for the cell to exertits functions), environmental constraints (nutrient availability, pH, temperature), and regulatory(self-imposed) constraints" (Price et al., 2004).
During this master thesis, a constraint based modelling approach was used to explore,analyse and draw conclusions about different reconstructed context-specific metabolic models.
6
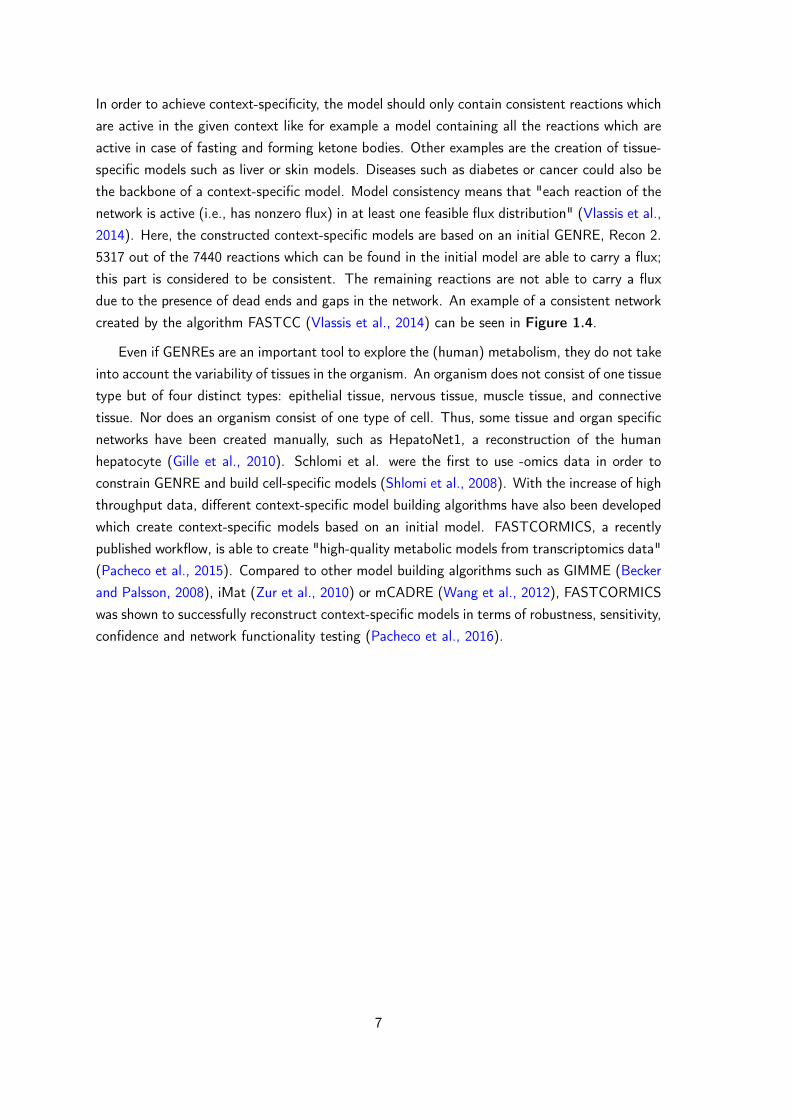
In order to achieve context-specificity, the model should only contain consistent reactions whichare active in the given context like for example a model containing all the reactions which areactive in case of fasting and forming ketone bodies. Other examples are the creation of tissue-specific models such as liver or skin models. Diseases such as diabetes or cancer could also bethe backbone of a context-specific model. Model consistency means that "each reaction of thenetwork is active (i.e., has nonzero flux) in at least one feasible flux distribution" (Vlassis et al.,2014). Here, the constructed context-specific models are based on an initial GENRE, Recon 2.5317 out of the 7440 reactions which can be found in the initial model are able to carry a flux;this part is considered to be consistent. The remaining reactions are not able to carry a fluxdue to the presence of dead ends and gaps in the network. An example of a consistent networkcreated by the algorithm FASTCC (Vlassis et al., 2014) can be seen in Figure 1.4.
Even if GENREs are an important tool to explore the (human) metabolism, they do not takeinto account the variability of tissues in the organism. An organism does not consist of one tissuetype but of four distinct types: epithelial tissue, nervous tissue, muscle tissue, and connectivetissue. Nor does an organism consist of one type of cell. Thus, some tissue and organ specificnetworks have been created manually, such as HepatoNet1, a reconstruction of the humanhepatocyte (Gille et al., 2010). Schlomi et al. were the first to use -omics data in order toconstrain GENRE and build cell-specific models (Shlomi et al., 2008). With the increase of highthroughput data, different context-specific model building algorithms have also been developedwhich create context-specific models based on an initial model. FASTCORMICS, a recentlypublished workflow, is able to create "high-quality metabolic models from transcriptomics data"(Pacheco et al., 2015). Compared to other model building algorithms such as GIMME (Beckerand Palsson, 2008), iMat (Zur et al., 2010) or mCADRE (Wang et al., 2012), FASTCORMICSwas shown to successfully reconstruct context-specific models in terms of robustness, sensitivity,confidence and network functionality testing (Pacheco et al., 2016).
7

Figure 1.4: Creation of a consistent network via FASTCCOn the upper left, a global model is represented. The nodes represent different metabolicproducts (A-F) and the edges represent the fluxes in the model (v1-v8). Flux v3 leads tometabolite C resulting in a dead end of the model. On the upper right, the consistent globalmodel is represented. The flux from B to C has been removed. On the lower right, theconsistent model is shown. Fluxes in red represent the core set C i.e. the reactions which areactive in the given context. On the lower left, the final context-specific reconstruction is shown.Reactions with fluxes v6 to v8 have been removed with metabolites E and F. Figure taken andmodified from (Vlassis et al., 2014).——————————————————————————————————————–
8

1.2 Cancer as a disease of interest for metabolic modelling
The creation of i.e. cancer specific models is one important application of the previouslylisted algorithms. Cancer is a disease characterized by the abnormal growth and proliferationof cells. In "The Hallmarks of Cancer", Dr. Douglas Hanahan suggests that this abnormaltumour growth is the result of "six essential alterations in cell physiology [...]: self-sufficiency ingrowth signals, insensitivity to growth-inhibitory (antigrowth) signals, evasion of programmedcell death (apoptosis), limitless replicative potential, sustained angiogenesis, and tissue invasionand metastasis"(Hanahan and Weinberg, 2000). Even though these hallmarks are already olderthan a decade, they are still holding true and present a solid base in tumour research. In amore recent paper, Dr. Douglas Hanahan proposed some minor changes and refinements to theoriginal concepts while revising some other emerging concepts in tumour research. These includethe avoidance of immune destruction, tumour promoting inflammation, genome instability andmutation, and the deregulation of cellular energetics resulting in the ten hallmarks of cancer(Hanahan and Weinberg, 2011) (see Figure 1.5).
One type of cancer which is known to be particularly aggressive at late stages is melanoma.Around 20% of patients diagnosed with malignant melanoma will succumb to the disease eventhough early detection rate has improved drastically (Schadendorf and Hauschild, 2014). Ma-lignant melanoma is more commonly known as a form of cancer of the skin and is characterizedby the abnormal proliferation of melanocytes. Thus, it is not only limited to the skin (cutaneousmelanoma) but can also affect the eye (uveal melanoma) or the mucosa (mucosal melanoma).There are other types of skin cancer which are unrelated to melanoma (non-melanoma skincancer): the most common forms are basal-cell cancer and squamous-cell cancer. For the for-mer, the origin of cell type is not yet completely known, whereas the latter affects keratinocytes(Rajpar and Marsden, 2009).
Different but specific characteristics such as melanoma thickness, ulceration and metastasisclassify cutaneous malignant melanoma into five stages (see Figure 1.6 for a description ofthe stages), varying in severity according to the American Joint Committee on Cancer (Balchet al., 2001; Balch et al., 2009). Depending on the tumour stage, survival rates vary greatly,declining as the tumour progresses. The metastatic form of melanoma often spreads furtherinto the skin and can invade lymph nodes, lungs, liver, and brain. In patients where morethan three metastatic sites have been detected, the clinical prognosis is very poor: more than95% of the patients die within one year with a median survival rate ranging from 6-12 months(Damsky et al., 2014; Schadendorf and Hauschild, 2014). To worsen the case, melanoma ishighly resistant to drug therapies and is therefore "considered one of the most aggressive andtreatment-resistant human cancers" (Tsao et al., 2012).
Different factors can lead to the abnormal growth of melanocytes. Sunlight exposure ormore specifically ultraviolet (UV) radiation has been widely accepted as the main exogenouscause for malignant melanoma (Gandini et al., 2005b). UV light differs in the degree ofharmfulness to cells, the most harmful being UVA, UVB and UVC wavelengths. Even though
9

Figure 1.5: "The Hallmarks of Cancer"This illustration represents the ten hallmarks of cancer. In blue are the original six hallmarksand in green the newly added ones. Each hallmark contributes to the progression of a normalcell into a tumour cell. Taken and modified from (Hanahan and Weinberg, 2011)——————————————————————————————————————–
10

Figure 1.6: Stages of cutaneous melanoma cancerThis figure shows the different stages of malignant melanoma tumour progression. There arefive stages which differ in severity and progression:
• Stage 0 (Tis) or in situ melanoma. It is still localized in the epidermis and has not yetbreached the basal layer. Excision of the tumour yields the best results in terms of survivalas it has not spread.
• Stages I and II (T1 and T2) or "Localized Melanoma". It has not yet spread to otherorgans but has already invaded part of the dermis. The risk of metastasis in T2 is higherthan in T1.
• Stage III (T3) or "Regional Metastatic Melanoma (stage III)". It has already spread toclose by lymphnodes showing microscopic nodal metastases.
• Stage IV (T4) or "Distant Metastatic Melanoma (stage IV)". It has spread to otherorgans and distant lymph nodes. Serum levels of lactic dehydrogenase are high.
Image taken from http://melanomatreatment.net/melanoma-stages/, accessed on May4, 2016.——————————————————————————————————————–
11

UVC light is almost completely absorbed by the ozone layer, UVB light still passes throughthe layer and causes damage to cells. After long exposures to sunlight, sunburn is the bestknown effect of UVB light. As the UVB light passes through the first layers of the skin, it canpotentially damage the DNA and cause mutations, notably pyrimidine dimers (de Gruijl, 1999).This specific damage by UV light is said to lead to "UV signature mutations" (Brash, 2015) aC to T transition. Albeit harmful, UVB radiation is also needed for vitamin D production. UVAradiation has also been linked to DNA damage caused by reactive oxygen species production(Lund and Timmins, 2007).
Most of the UVB-induced DNA damage can be successfully repaired by the cellular DNArepair process and does not cause permanent mutagenic alterations. Unfortunately, in somecases, the DNA repair mechanisms are not successful and can thus lead to permanent DNAdamage. Examples of UV induced genetic damage are mutations in the tumour suppressorgene p53 in non-melanoma skin cancer and late stage melanoma (Zaidi et al., 2008) as well asmutations in the cell cycle regulators p14ARF and p16INK4A (Hodis et al., 2012).
However, most genetic mutations in malignant melanoma do not show any UV signaturemutations. Some known non-UV induced gene mutations in melanoma affect BRAFV600E,NRASQ61L/R, KRAS, HRAS, KITV559A and GNA11Q209L (Schadendorf et al., 2015). Eventhough no UV signature could be found for those mutations, the UVA induced reactive oxygenspecies production could be one cause.
Other causes for malignant melanoma or familial melanoma is hereditary predisposition.A meta-analysis on melanoma concluded that some physical phenotypes correlate with an in-creased risk in melanoma such as fair-skin, red or blond hair, the inability to tan as well as afreckling phenotype (Gandini et al., 2005c). Furthermore, a count of more than 100 melanocyticnevi is also associated with a high risk of melanoma (Gandini et al., 2005a). However, not onlythe physical phenotype can pose individuals at a high risk for melanoma development but alsoseveral germline mutations. People with a CDKN2A (cyclin dependent kinase inhibitor 2A, cellcycle regulation) germline mutation are more prone to develop melanoma due to a defect in theregulation of the cell cycle (Schadendorf et al., 2015). The CDKN2A mutation accounts forapproximately 40% of familial melanoma cases (Goldstein et al., 2007). CDKN2A together withmutations in CDK4 (cyclin-dependent kinase 4, cell cycle progression) and RB (retinoblastoma,cell cycle regulator) demonstrate the "linkages between the CDKN2A/CDK/RB pathways oftumour suppression in humans" (Tsao et al., 2012). However, these mutations are not onlyfound in melanoma but also in other cancer types. Other mutations, which involve defects ingenes linked to pigmentation, are MC1R (melanocortin-1 receptor, responsible for skin pigmen-tation)(Matichard et al., 2004; Raimondi et al., 2008) and MITF (microphthalmia-associatedtranscription factor, melanocyte development) (Bertolotto et al., 2011). Furthermore, muta-tions in BAP1 (BRCA1 Associated Protein, implicated in the DNA damage response) (Wiesneret al., 2011), POT1 (protection of telomeres) (Robles-Espinoza et al., 2014), and in the pro-moter of TERT (telomerase reverse transcriptase) (Abecasis et al., 2002) have been associatedwith familial melanoma. It is important to note that "the high rate of mutations in melanoma
12
makes it particularly difficult to distinguish between causative ("driver") mutations and by-stander ("passenger") mutations" (Shtivelman et al., 2014). There is one specific populationin which the incidence of skin cancer is extremely high: people suffering from xeroderma pig-mentosum are very susceptible to UV damage as their DNA repair mechanism for the nucleotideexcision repair is faulty, therefore mutations in their DNA keep accumulating (Cleaver, 1969;de Gruijl, 1999).
Genetic mutations present in cancer can either be activating (gain of function) or deacti-vating (loss of function) of the translated protein. Examples for gain of function mutationsin melanoma are BRAF, NRAS, KIT and GNAQ/GNA11 and examples for loss of functionmutations are CDKN2A, PTEN, NF1 and BAP1 (Griewank et al., 2014).
Besides genetic alterations, several metabolic changes have already been suggested to takeplace in cancer. The Warburg effect is probably the best known metabolic change in cancer,producing energy via glycolysis and lactic acid fermentation leading to a higher lactate produc-tion. It was shown that changes in seven metabolic subsystems underlie the Warburg effect suchas glutamine metabolism, nucleotides, glycolysis, oxidative phosphorylation, pentose phosphatepathway, citric acid cycle and pyruvate metabolism (Asgari et al., 2015).
There are also some metabolic changes that can be found specifically in malignant melanoma.Most melanomas show reduced amino acid production such as arginine (Yoon et al., 2013) (dueto a deficiency in the argininosuccinate synthetase), leucine (Sheen et al., 2011), and glutamine(Wang et al., 2014). Further, in PGC1 positive cells (Vazquez et al., 2013) both oxidative phos-phorylation as well as glycolysis play an important role. A metabolic symbiosis between lactateand ATP production has also been suggested (Nakajima and Van Houten, 2013) taking intoaccount tumour heterogeneity. Advanced melanomas show higher levels of lactate dehydro-genase, proteins associated with glycolysis and oxidative phosphorylation as well as lactatetransport regulators, suggesting an increased metabolic flexibility in advanced melanomas (Hoet al., 2012). Melanin synthesis affects melanoma behaviour and has been associated withmetabolism (Li et al., 2009). Furthermore, thioredoxin reductase 1 was found to correlatewith metabolic changes in melanoma and that "its attenuation sensitizes the mitochondria tooxidative damage" (Cassidy et al., 2015). Hersey et al. list several metabolic approaches fortreating melanoma by e.g. blocking acid excretion, reducing glycolysis or depletion of energysources for the tumour (Hersey et al., 2009).
Besides surgical extraction and radiation therapy, there exist various drugs which can treatthe previously mentioned alterations occurring in cancer and specifically in melanoma, rangingfrom chemotherapy to targeted therapy and immunotherapy. Chemotherapy agents are a widelyused and non-specific treatment, mainly for tumour metastases, as they target rapidly growingand dividing cells. Some of these cytotoxic agents are inhibitors of DNA synthesis whereas othersphysically damage the DNA or other components needed for DNA assembly, maintenance andtranscription (Chabner and Roberts, 2005). Unfortunately, not only cancer cells are affectedbut all active cells. Chemotherapy comes with severe side effects with the most noticeable
13

being hair loss. Even though, chemotherapy can show remarkable improvements in terms ofcancer cell reduction it is not always able to eradicate all cancer cells. After some time, thepatient relapses and the tumour returns with a more aggressive and drug-resistant phenotype.It was already shown in 1937 that one single cancer cell was sufficient to induce leukaemia inmice (Furth.J. and Kahn.M.C., 1937). Usually a combination of chemotherapy drugs are givento a patient, as "combinations of drugs proved to be more effective than single agents againstboth metastatic cancer and in patients at high risk of relapse after primary surgical treatment"(Chabner and Roberts, 2005).
Important advances in cell biology such as the exploration of cell signalling networks shedlight on cellular activity underlying cell proliferation and survival. In cancer, where these sig-nalling pathways are altered or disrupted, targeted cancer therapy was thought to be able torepair faulty proteins and molecules and to specifically drive cancer cells into apoptosis leadingto the emergence of several promising anticancer drugs (Chabner and Roberts, 2005). One ofthe most important and first targeted cancer drugs is imatinib (Gleevec), it inhibits the fusedBCR-ABL kinase in chronic myelocytic leukaemia by binding to the ATP-binding site of the ki-nase and deactivating it (DeVita and Chu, 2008). Similar to chemotherapy drugs, not all cancercells are eliminated by targeted cancer drugs, supporting the existence of cancer subpopulationsinside of a tumour, even before treatment.
Concerning melanoma, anticancer drugs can be divided into pathway inhibitors and im-munomodulators (immunotherapy). The former comprises drugs targeting mutated genes suchas BRAF, NRAS and MEK whereas the latter comprises monoclonal antibodies augmenting T-cell activation, proliferation and thus immune response to the tumour (Eggermont and Robert,2011). The best known targeted cancer drug for malignant melanoma is vemurafenib (Zelb-oraf) (Chapman et al., 2011), an inhibitor of the mutant BRAF kinase (but not the healthyvariant) which has been approved in 2011 by the Food and Drug Administration. Other drugsused in the treatment of melanoma are ipilimumab (Yervoy, a CTLA-4 (cytotoxic T-lymphocyte-associated antigen 4) inhibitor) (Hodi et al., 2010), dabrafenib (Tafinlar, another mutant BRAFinhibitor)(Hauschild et al., 2012), trametinib (Mekinist, a MEK inhibitor) (Falchook et al.,2012) and cobimetinib (Cotellic, another MEK inhibitor) (Larkin et al., 2014). Similar to thechemotherapy drugs, targeted drug therapy may also result in a drug resistant tumour phe-notype as is the case with nearly all tumours treated with BRAF inhibitors (Griewank et al.,2014).
As none of these drugs are able to completely eliminate all cancer cells in all cases, moreand more anticancer drugs are being developed. However, these newly discovered drugs have toundergo specific tests and need to pass four phases of clinical trials. Hence, the time from thediscovery of a new drug until its approval may be significant. In the past, the discovery of newdrugs was mainly driven by chance (i.e. the discovery of penicillin by Dr. Alexander Fleming(Fleming, 1929)). Nowadays, advances in chemistry, biochemistry, and molecular biology, suchas the concept of enzymes binding to their corresponding receptors (Drews, 2000), facilitatethe discovery of new targeted drugs. Furthermore, the appearance of open access databases
14
on chemical and protein interactions expanded the field of drug discovery to computationalscience.
1.3 Metabolic modelling and its use in drug discovery
Computational modelling has become an important tool for the discovery of new drugs,drug combinations and drug targets. There are four main types of drug targets which can bedefined: proteins, polysaccharides,lipids and nucleic acids. So far, mainly proteins are regardedas successful targets. Therefore, the concept of the "druggable genome" has emerged in theearly 2000s (Hopkins and Groom, 2002). The druggable genome is described as the part of thegenome which can be targeted by already known and unknown drug-like molecules. Hopkinsand Groom estimate, that out of the 30000 genes present in the human genome, approximately10% of the genes belong to the druggable genome, whereas drugs only exists for 600 to 1500genes so far.
Nearly 75% of the drugs are being cleared by the human metabolism notably by cytochromeP450s, UDP-glucuronosyltransferases, aldehyde oxidase and sulfotransferases (Di, 2014). Con-sequently, "understanding metabolic processes at the molecular level is of fundamental impor-tance for successful drug discovery and development" (Kirchmair et al., 2015). The creationand exploration of gene networks, signalling networks and metabolic models can help to studythese underlying metabolic processes in silico. Computational modelling is both time and costeffective. Drugs which potentially inhibit essential pathways of a cell (such as the productionof ATP) can be filtered out and removed from the drug candidate list, reducing the number ofdrugs to be later tested in vitro.
A simple and efficient way to find potential drug targets through metabolic modelling,is the in silico deletion of genes followed by flux balance analysis. By knocking down onegene at a time and measuring the growth rate through flux balance analysis an insight on theessentiality of a gene in the network can be given. Flux balance analysis has further been shownto be able to "identify potential mechanisms by which these gene essentialities arise" (Gattoet al., 2015). The identification of drug combinations and synergies of already approved drugshas an important potential application in metabolic modelling. For the already available andapproved drugs, there might be some unexploited properties which can be determined throughmodelling. One successful example in finding and repurposing approved drugs, was the killingof the parasite Leishmania major by an antimalarial agent found by integrating drug target dataand metabolic modelling (Chavali et al., 2012). "The ability of constraint-based modelling topredict the effects of gene knockouts provides an important tool for drug targeting studies"(Bordbar et al., 2014).
Metabolic modelling has also been used to study the metabolic alterations occurring incancer and healthy tissues. A recent review on the modelling of cancer metabolism pointsout the current attempts to target cancer metabolic pathways (Yizhak et al., 2015). In 2011,
15

Folger et al. successfully predicted 52 cytostatic drug targets (with 40% having approved orexperimental drugs) by creating the first genome scale metabolic model of cancer (Folger et al.,2011). A year later, in 2012, Facchetti et al. described an algorithm which finds "the optimalcombination of drugs which guarantees the inhibition of an objective function, while minimizingthe side effect on the other cellular processes" (Facchetti et al., 2012). Furthermore, Oberhardtet al. discussed the use of currently available genome scale metabolic models as well as howcomputational models might contribute to the discovery of new drugs (Oberhardt et al., 2013).
Very recently, a metabolic modelling approach has been used to predict drug side effects(Shaked et al., 2016). Unfortunately, side effects of newly developed drugs are responsible foraround 20% of the drug failures in trial phases II and III. Finding new anti cancer drugs targetingthe metabolism poses a challenge to researchers as the "majority of metabolic pathways usedby cancer cells are also essential for the survival of normal ones, as reflected by the undesirableside effects of several chemotherapy agents" (Yizhak et al., 2015).
1.4 Aim
The aim of this master thesis was to develop a new workflow for the prediction of drugtargets using metabolic modelling. In a first step, genes from a genome scale metabolic recon-struction (Recon 2) were extracted. Databases were mined in order to find approved drugs whichinhibit the protein(s) translated from the given genes, creating gene-drug data. In a secondstep, context-specific models have been created from an RNA-sequencing dataset containinginformation for different cancer cell lines and from microarray data containing information onmelanoma. A constraint based modelling approach was used to explore these context-specificmodels and genes exclusively essential in cancer have been determined and combined with thegene-drug data. Thus, only drugs affecting the cancerous tissue have been selected.
16

2 Material and methods
2.1 Initial model and model reconstruction
The reconstruction of context-specific models requires an input model as well as informationon which genes are active (gene expression data) in a given context. Therefore, as inputmodel, Recon 2 (version 2.04) (Thiele et al., 2013), a genome scale reconstruction of thehuman metabolism was used. The model consists of 2140 gene transcripts, 7440 reactions, and5063 metabolites in 8 compartments: extracellular space, cytoplasm, mitochondrion, nucleus,endoplasmic reticulum, peroxisome, and Golgi apparatus. The reactions take place in 100different subsystems or pathways.
Unfortunately, Recon 2 has several gaps or dead end reactions which could cause problemsfor the context-specific model reconstruction. Hence, a flux consistent subnetwork of Recon 2(called consistent Recon 2) was obtained with FASTCC (Vlassis et al., 2014), it contains 2140genes, 5317 reactions, and 2960 metabolites. The creation of the flux consistent subnetworkremoves all the reactions which were not able to carry a flux. Further, metabolites which areno longer assigned to a reaction were also removed leading to the removal of any gaps or deadend reactions in the consistent Recon 2 model.
For context-specificity, two distinct datasets were used: (1) The first set contains RNA-sequencing data of 10005 patient biopsies, for both healthy and cancer tissue. Only a subset ofthe data was used for model reconstruction. (2) The second set contains microarray expressiondata for melanoma (primary and metastatic) and healthy skin.
2.1.1 The RNA-sequencing dataset from the TCGA
The initial RNA-sequencing data originates from The Cancer Genome Atlas (TCGA) (Wein-stein et al., 2013) and contains a total of 10005 samples across 24 cancers types, 741 samplescame from healthy and 9264 samples came from cancerous tissues. The "Level 3" RNA-sequencing data was reprocessed with the "Rsubread" package to realign and summarize thedata by (Rahman et al., 2015). The reprocessed RNA-sequencing data can be found at theGene Expression Omnibus website (http://www.ncbi.nlm.nih.gov/geo/) with the acces-sion number GSE62944.
For the model reconstruction, a random subset of at most 10 samples per cancer andcondition (healthy or diseased) was selected. As the sample size for the healthy tissues was notas abundant as compared to the cancerous tissues, only 10 samples were selected in order tohave as many healthy as cancer samples for nearly each tissue. Out of the 24 unique cancers, 18cancer types could be found in both healthy and diseased conditions. Samples were selected forall cancer types for which both healthy and cancerous samples were available. This resulted ina total of 318 samples for 18 different cancer types. The sample names were then forwarded to
17

Maria Pacheco who did the context-specific model reconstruction. Table 2.1 gives an overviewon the TCGA dataset which has been used for the model reconstruction.
Table 2.1: Overview of the TCGA dataset used for model creationExplanation of the abbreviations used in the TCGA dataset with the corresponding numberof arrays for each cancer used for model reconstruction. The number of arrays represents thesample size for healthy and cancer. For three cancer types, the samples size was below 10:CESC, GBM and SKCM. A more detailed table can be seen in Table 5.1.
Abbreviation Full name Number of arraysBLCA Bladder Urothelial Carcinoma 10
BRCA Breast Invasive Carcinoma 10
CESC Cervical Squamous Cell Carcinoma and En-docervical Adenocarcinoma
3
COAD Colon Adenocarcinoma 10
GBM Glioblastoma Multiforme 5
HNSC Head and Neck Squamous Cell Carcinoma 10
KICH Kidney Chromophobe 10
KIRC Kidney Renal Clear Cell Carcinoma 10
KIRP Kidney Renal Papillary Cell Carcinoma 10
LIHC Liver Hepatocellular Carcinoma 10
LUAD Lung Adenocarcinoma 10
LUSC Lung Squamous Cell Carcinoma 10
PRAD Prostate Adenocarcinoma 10
READ Rectum Adenocarcinoma 10
SKCM Skin Cutaneous Melanoma 1
STAD Stomach Adenocarcinoma 10
THCA Thyroid Carcinoma 10
UCEC Uterine Corpus Endometrial Carcinoma 10
2.1.2 The melanoma microarray dataset, GSE46517
The microarray dataset used for the reconstruction of the second set of context-specificmodels contains expression data for skin (S), nevi (N), normal epithelial melanocytes (NEM),primary melanoma (PM), and metastatic melanoma (MM). The dataset consists of a total of121 microarrays: 7 for skin, 9 for nevi, 1 for normal epithelial melanocytes, 31 for primarymelanoma and 52 for metastatic melanoma, whereas data for 21 samples could not be down-loaded. The melanoma samples were obtained from the Medical University of Vienna, theMemorial Sloan Kettering and the Brigham and Women’s Hospital. Clinical information of thesamples and patients is also available and includes age, sex, outcome, BRAFV600E mutation sta-
18

Table 2.2: Overview of the microarray data used for model creationExplanation of the abbreviations used for the microarray data as well as the number of arrayfor each condition. Skin, nevi and the normal epithelial melanocytes were treated as healthycontrol against primary and metastatic melanoma. A more detailed table can be seen in Table3.1.
Abbreviation Condition Number of arraysS Skin 7
N Nevi 9
NEM Normal epithelial melanocytes 1
PM Primary melanoma 31
MM Metastatic melanoma 52
tus, body site as well as the location of the sample (Kabbarah et al., 2010). The microarray dataused in this thesis was generated using the human Affymetrix U133A microarray chip and canbe found at the Gene Expression Omnibus website (http://www.ncbi.nlm.nih.gov/geo/)
with the accession number GSE46517.
In order to pre-process the data for the context-specific model reconstruction (as describedin (Pacheco et al., 2015)), the ReadAffy command from the Affy package was used to readthe microarrays into R (v. 3.2.2). The raw expression data from the microarrays was thennormalized using the frozen Robust Multi-array Average (fRMA) (McCall et al., 2010) whichconsiders previous background and parameter knowledge on microarrays from the same platform.This previous knowledge is taken from large publicly available microarray databases. In general,some parameters which are "estimates of probe-specific effects and variances are precomputedand frozen" (McCall et al., 2010) for different microarray platforms. These frozen parametersare then applied in the normalization process of the raw expression data. As summarizationmethod, the "median_polish" was used, taking the median to normalize the data.
The microarray expression data was plotted before and after normalization to verify thedistribution of the probe intensities of each microarray in a barplot (see Figure 5.1 in thesupplementary data). Normalization returned even distribution of the microarray expressionintensities along the arrays. As further quality control, a heatmap based on the Pearson cor-relation and principal component analysis was performed on the normalized data. After thequality control, the data was further processed with Barcode in R, an important tool which"minimize[s] the impact of false positives (positive results due to technical artefacts and notbiology) on gene expression studies" (McCall et al., 2014).
19

2.1.3 Reconstruction of context-specific models from the datasets
As stated before, the context-specific models were reconstructed based on either RNA-sequencing data or microarray expression data using a recently published workflow, FAST-CORMICS (Pacheco et al., 2015). FASTCORMICS is an algorithm (adapted from FASTCORE(Vlassis et al., 2014)) which is able to directly implement microarray data in the model re-construction and therefore creating context-specific models based on gene expression data.Compared to other model reconstruction algorithms, it has a low computational demand andis "devoid of arbitrary parameter settings" (Pacheco et al., 2015).
For the RNA-sequencing data, the models were reconstructed using a modified version ofFASTCORMICS which converts the FPKM (Fragments Per Kilo base of transcript per Millionmapped reads) into zFPKM values. Genes are said to be unexpressed if the zFPKM valueis below the maximum of the lowest mode and expressed if the value is above 0. For themicroarray data, the original FASTCORMICS, was used to reconstruct context-specific modelsin Matlab2015b. Two reactions were set to be always present in the model for further evaluation:the "DM atp(c)" and the "Generic human biomass reaction" reactions. These reactions willbe used as objective function for the in silico knockouts.
The DM ATP(c) reaction is a demand/exchange reaction:
H2O(c) + ATP(c)−−−−−−→H(c) + ADP(c) + Pi(c)
By optimizing for this reaction, the maximal ATP production of the model can be evaluated.That is, if there is no ATP production in the model, the demand/exchange reaction cannottake place and its flux equals zero. In this case, the model cannot produce any energy andthus the cell or organism would die. However, if there is ATP production, the reaction can takeplace and optimising for the reactions gives a good estimation of the energy production.
The biomass reaction is also a demand/exchange reaction and "describes the rate at whichall of the biomass precursors are made in the correct proportions" (Feist and Palsson, 2010).Biomass precursors include amino acids, lipids, water, nucleotides and others.
For both the TCGA dataset and the microarray dataset, two separate series were created.Initially, one model per array (MPA) was created, resulting in a total of 318 and 100 distinctmodels, for the TCGA and microarray data, respectively. Secondly, one model per condition(MPC) was created, resulting in 36 and 5 distinct models; 18 models for healthy and cancerfor the TCGA dataset and healthy skin, nevi, normal epithelial melanocytes, primary melanomaand metastatic melanoma for the microarray dataset. In order to create the MPC, a thresholdof 90% was set, meaning that for all the corresponding microarrays and RNA-sequencing data,reactions which are found in 90% of the cases are used for the model reconstruction.
The Jaccard index is a score between 0 and 1 which determines the similarity between at
20

least two different datasets. An index or similarity score of 0 means that the two datasetsare dissimilar to each other. Correspondingly, an index or similarity score of 1 means thatboth datasets are the same. For the TCGA dataset and the microarray data (both MPAand MPC), the Jaccard index between each model was calculated in order to determine thesimilarity between the context-specific models using the reactions present in the models. Thethereby resulting Jaccard index matrices were then clustered and visualized using the clustergramfunction in Matlab2015b.
2.2 In silico knockouts and essential genes
Single gene deletion (or in silico knockouts) is a useful tool to analyse gene essentiality andmetabolic capabilities of a metabolic model. Before the gene knockout, an objective functionhas to be set. By default, the biomass production is the primary objective of the Recon 2model and thus all fluxes will be optimized to reach that goal. Here, two sets of single genedeletions will be performed: the first set uses the biomass production and the second uses theATP demand as objective function. The fluxes through the objective function were measuredusing flux balance analysis before and after the gene deletion in order to obtain a ratio.
A gene is said to be essential if its knockout results in a zero flux through the objectivefunction. For each reconstructed context-specific model, single gene deletion was carried outin order to find the essential genes. The singleGeneDeletion function from the COBRA toolbox(Schellenberger et al., 2011) was used to knock out one gene at a time and record the optimizedflux through the specified objective function in Matlab. As linear programming solver, the IBMILOG CPLEX Optimizer was used to solve the optimization problem. As only the ATP demandand the biomass reaction were set as objective functions, we can denominate the flux as growthratio (1/h) of the organism or cell. If the knockout of the gene results in a growth ratio of 0,the organism or cell is no longer able to carry out its main function and will most likely die.Thus, if the growth ratio is 0, the gene is said to be essential to the organism or cell. If thegrowth ratio is between 0 and 1, the deletion of the gene results in an intermediate phenotype.
The lists of essential genes for each model were compared between each other and saved forfurther evaluation, especially genes which are essential exclusively in cancer. Those exclusivegenes mark possible anti-cancer drug targets in the model. Here the goal was to find drugswhich inhibit essential functions in cancer but not in healthy models.
Lastly, the found essential genes were automatically looked up in two different gene-disease association databases in order to confirm if the genes have an existing link to cancer.The databases were ccmGDB (Cancer Cell Metabolism Gene Database) (Kim et al., 2016)and DisGeNET (Piñero et al., 2015). The ccmGDB database focusses on cell metabolismand provides information on 2071 cell metabolism genes and 514 cancer cell metabolismgenes, a text file containing these cancer cell metabolism genes can be downloaded fromtheir website (https://bioinfo.uth.edu/ccmGDB/download/514genes_geneid.txt). The
21

DisGeNet "discovery platform" gathers and provides information on more than 380000 gene-disease associations. A file containing all curated gene-disease associations is available at theirwebsite for download (http://www.disgenet.org/ds/DisGeNET/results/curated_gene_disease_associations.tsv.gz). The curated gene-disease associations have been obtainedfrom different databases (UniProt and CTD), and from text-mining of the available literature.Some predicted gene-disease associations have also been obtained from the mouse and ratgenome databases. Both databases were chosen due to their simplicity for data mining as theinformation is downloadable and stored in a text file. Other databases, such as the ComparativeToxicogenomics Database (Davis et al., 2015) also had a downloadable files containing the genesymbol and associated disease name. However, a disease such as cancer has several differentnames and in order to find all of the associations, all these names need to be found in order toget correct results. WikiGenes (Hoffmann, 2008) for example, did not have a downloadable fileand the genes had to be checked one after the other which is very time consuming.
2.3 Drug target prediction and side effects
The main part of this thesis consisted in the prediction of drug targets. In order to do so,a pipeline from gene to drug had to be established. The generic metabolic model, Recon 2,contains 2140 gene transcripts in total. Out of those genes, 407 have different transcripts whichwere removed as no solid information on the transcripts is publicly available. After transcriptremoval, 1733 unique genes and, thus, possible drug targets remain in the Recon 2 model.
For the remaining 1733 genes a link to the drugs had to be established. Gene deletion canbe reproduced in vitro by inhibiting the protein translated from the given gene. Thus, onlydrugs which inhibit a protein had to be looked into. However, entering all the genes by handand looking for the associated protein would require a large amount of time, thus a script forthe automated querying of the needed data was written in Matlab2015b.
Two interaction databases were data-mined to explore which steps are needed to get fromthe gene to inhibiting drugs. The two databases are: the DrugBank (Law et al., 2014), a drug-target database, and STITCH (Kuhn et al., 2014), a protein-chemical interaction database.Even though both databases contain data on protein-chemical interactions, the manner inhow the information is stored, is different. For the protein identification, the DrugBank usesthe UniProtKB/Swiss-Prot (The UniProt Consortium, 2015) identifier and STITCH uses theEnsembl (Yates et al., 2016) protein identifier (ENSP).
But first of all, for each of the 1733 unique genes from the Recon 2 model, the correct geneidentifier had to be found. The genes in the model are Entrez gene IDs, thus the Entrez Genedatabase by NCBI (Maglott, 2004) was data mined to get (1) the official gene symbol (providedby the HUGO gene Nomenclature Committee), (2) the UniProtKB/Swiss-Prot protein identifierand (3) the Ensembl protein identifier. Thus, the genes were mapped to both the UniProtKBand Ensembl protein database. Then, only inhibiting drugs and chemicals were sought in the
22

DrugBank and STITCH database for the UniProtKB and Ensembl protein identifier respectively.
The DrugBank database gives further information on the drugs besides its action: the druggroup and if there is a pharmacological action. There are seven distinct drug groups which arenot mutually exclusive: approved, approved for veterinarian use, experimental, investigational,nutraceutical, illicit and withdrawn. Therefore, for the DrugBank a second restriction was set:only inhibiting and approved drugs were taken into account.
The STITCH database provides a confidence score for each compound interacting with aprotein. However, for simplification, the score was not taken into account. The chemicalsfound in STITCH are represented by their PubChem Compound Identifier (CID) which can beeither stereo-specific compounds (CID0) or flat compounds (CID1). The PubChem databasewas used to identify these compounds. Again, for simplicity, different isomeric compounds weretreated as one. STITCH does only provide information about the type of the protein chemicalinteraction. Therefore, no further information on the drug is given. The database can bedownloaded from their website (http://stitch.embl.de/cgi/show_download_page.pl).
After data mining both protein interaction databases, two gene-drug matrices, one for eachdatabase, were created for later use.
2.3.1 Databases used for finding drugs and their targets
Different databases were used to perform different tasks in the workflow. The Entrez Genedatabase was used for finding and associating the genes in Recon 2 to their respective proteinsand identifiers. Two interaction databases were data mined for finding drugs: the DrugBankand STITCH database. Lastly, SIDER, a side-effect resource was used to find the side-effectsof these drugs. A more detailed explanation of the databases is found below.
Entrez Gene database by NCBI The database is a public repository for identified genes fromseveral sequenced genomes maintained by the National Center for Biotechnology Information(NCBI). The goal of the Entrez gene database is to "provide tracked, unique identifiers for genesand to report information associated with those identifiers for unrestricted public use" (Maglott,2004). Gene-specific information such as the genomic context (chromosomal localization),involved pathways, gene variation and phenotypes, as well as transcripts and products can befound on their website (http://www.ncbi.nlm.nih.gov/gene).
UniProt database The database contains information on more than 80 million protein se-quences and annotations (amino acid sequence and structure). Cross-references to otherdatabases can also be found. The UniProt database is divided in two sub-databases: (1)The UniProtKB/TrEMBL contains automatically annotated but unreviewed records await-ing manual curation. More than 60 million protein records are found in this sub-database.(2) The UniProtKB/Swiss-Prot contains information on manually curated and reviewed se-
23

quences and is far smaller with around half a million records. The goal of the UniProtdatabase is to "facilitates scientific discovery by organizing biological knowledge and enablingresearchers to rapidly comprehend complex areas of biology" (The UniProt Consortium, 2015).(http://www.uniprot.org/).
DrugBank Version 4.5 The database is a collection of information on drugs, their targetsand actions in the human body. With more than 8000 curated drug entries, the DrugBank isoften referred to by pharmaceutical and medical researchers and has served for in silico drugdiscovery. The information on the drugs is very broad, it ranges from a short description of thedrug, molecular and chemical properties to other drug interactions and pharmacology. In oneof the recent updates, the Anatomical Therapeutic Chemical (ATC) classification system hasbeen added to the DrugBank (Law et al., 2014). (http://www.drugbank.ca/).
STITCH Version 4.0: Search Tool for InTeracting CHemicals The database is basedon the protein-chemical interactions for more than 300000 chemicals and more than 3 millionproteins. The information on the interaction can "be used to study a variety of cellular func-tions and the impact of drug treatment on the cell" (Kuhn et al., 2014). The aim of STITCHis to "combine sources of protein-chemical interactions from experimental databases, path-way databases, drug-target databases, text mining and drug-target predictions into a unifiednetwork" (Kuhn et al., 2014). One feature of the STITCH database is the graphical represen-tation ("Network view") of the interactions between a protein and its interacting chemicals orvice versa. The network view gives an overview on the complexity of the interactions whereproteins and chemicals are represented as nodes an the interaction as colour-coded edges.(http://stitch.embl.de/)
PubChem database by NCBI The database is a public repository for small molecules i.e.chemical substances maintained by the National Center for Biotechnology Information (NCBI).The PubChem database is divided in three sub-databases: (1) PubChem BioAssay for bioactivitydata on the chemical substances, (2) PubChem Substance for depositor-contributed informationon the chemical substance and (3) PubChem Compound for unique and validated chemicalstructures extracted from the PubChem Substance database (Kim et al., 2015). Accordingto their latest publication, the database contains "157 million depositor-provided chemicalsubstance descriptions, 60 million unique chemical structures and 1 million biological assaydescriptions, covering about 10 thousand unique protein target sequences" (Kim et al., 2015).Each PubChem Compound has a unique identifier (CID) attributed to it which can either bestereo-specific compounds (CID0) or flat compounds (CID1) which is used in the STITCHdatabase. (https://pubchem.ncbi.nlm.nih.gov/)
SIDER Version 4.1: Side Effect Resource The database contains information for morethan 1400 approved drugs and more than 5000 unique side effects. For the side effects, the
24

official MedDRA (Medical Dictionary for Regulatory Activities) terms are used. The MedDRAterms represent a "single, internationally acceptable, medical terminology" (Brown et al., 1999)and are thus easier to compare between drugs. STITCH uses the ATC code and CID for drugidentification. The aim of the SIDER database is to "combine data on drugs, targets and sideeffects into a more complete picture of the therapeutic mechanism of actions of drugs and theways in which they cause adverse reactions"(Kuhn et al., 2015).
2.3.2 Finding side effects
The SIDER database was data mined for finding the side effects for each drug targeting agene in the Recon 2 model. However, in order to find the drug in the SIDER database, thecorrect CID had to be associated to each drug. In a first step, the CID was extracted fromDrugBank. Yet, by checking the CID in the SIDER database only a few drugs were foundand were missed. In a second step, each drug was associated to the Anatomical TherapeuticChemical (ATC) code as found in the DrugBank. The ATC classification system is a straight-forward drug grouping and consists of 7 letters and numbers divided in five levels: (1) the mainanatomic group i.e. the site of drug activity, (2) the therapeutic group, (3) the pharmacologicalgroup, (4) the pharmacological subgroup and, (5) the chemical substance (Natsch et al., 1998).After retrieving the ATC code for each drug found through the DrugBank, a list with chemicalaliases and synonyms was downloaded from the STITCH database to associate the correct CIDto a drug with a specific ATC code. In the case where one of the CIDs corresponded to a drug,the automated querying returned all of the side effects (in MedDRA terms) for the given drug.
25

3 Results
3.1 Overview and schematic of the workflow
Below is an overview of the established workflow (see Figure 3.1). There were two mainparts: the in silico knockouts and the drug target prediction. Both parts require a genericmetabolic model such as Recon 2. In order to reconstruct context-specific models for the insilico gene knockouts, microarray data for different conditions is needed. Here the conditionswere healthy vs. cancer. After the model reconstruction with FASTCORMICS, single genedeletion was performed and essential genes exclusive to cancer were extracted. For the drugtarget prediction, genes from the generic metabolic model, were automatically looked up indifferent drug or chemical targeted databases and a gene-drug matrix was created. For thepreviously extracted cancer genes, the gene-drug matrix was used to find drugs which inhibitthe said genes. Then, the side effects for each drug are listed.
Figure 3.1: Workflow overviewThere are two main parts making up the workflow: the in silico knockouts for finding essentialgenes exclusive to cancer and the drug target prediction for finding inhibiting drugs. Bothresults were combined to find drugs inhibiting the cancer genes and side effects were listed forthese drugs.
26

3.2 Creation of a consistent model, model reconstruction andcomparison
As said previously, the reconstruction of a context-specific model requires a generic metabolicmodel such as Recon 2 and as input information on gene activity such as RNA-sequencing dataor microarray data. Here, only the quality control of the microarray data will be presented asthe RNA-sequencing data was provided.
The Recon 2 model consists of 2140 gene transcripts, 7440 reactions and 5063 metabolites.Transcript duplicate removal displayed that there are 1733 genes out of the 2140 transcripts.The consistent Recon 2 model was extracted with the use of the FASTCC algorithm. Comparedto the original model, the consistent Recon 2 has a smaller size with 1913 genes (1550 areunique), 5317 reactions and 2960 metabolites. Hence, the overall number of genes was reducedby approximately 80% whereas the number of reactions and metabolites was reduced by 71%and 57%, respectively.
3.2.1 Microarray quality control
The dataset consists of 100 microarrays: 7 for skin, 9 for nevi, 1 for normal epithelialmelanocytes, 31 for primary melanoma and 52 for metastatic melanoma. After fRMA nor-malization, the microarray dataset (GEO accession number: GSE46517) was clustered andvisualized with the heatmap.2 function in R (using the Pearson correlation, see Figure 3.2).No feature filtering was done. A bar was added between the dendrogram an the heatmap toeasily visualize the different conditions: healthy skin is represented in green, nevi in black, ep-ithelial melanocytes in blue, primary melanoma in pink, and metastatic melanoma in red. Twolarge clusters can be observed in the figure. In one cluster, metastatic melanoma can clearlybe seen clustered together and setting itself apart from the other conditions and samples. Onlytwo primary melanoma samples and the single normal epithelial melanocytes sample can beobserved inside of the metastatic melanoma cluster. The second cluster is a combination ofprimary melanoma, nevi and healthy skin, whereas the latter is well clustered together. How-ever, the 9 nevi samples did not cluster together but can be found in-between of the primarymelanoma samples.
Principal component analysis was also performed on the fRMA normalized expression dataand supports the previous results from the heatmap clustering (see Figure 5.2 in the supple-mentary data). The colour coding for the samples is the same as for the heatmap: healthyskin is represented in green, nevi in black, epithelial melanocytes in blue, primary melanoma inpink, and metastatic melanoma in red. The different conditions can be distinguished along thefirst principal component where the healthy skin is clearly separated from metastatic melanoma.The second and third principal component do not seem to be a good single indicator to discernbetween the conditions. There were 83 principal components in total, the first componentaccounts for around 8% of the variance. A three-dimensional principal component analysis plot
27

Figure 3.2: Heatmap of the microarray expression dataThis heatmap was based on the Pearson correlation calculated between the samples. The barbetween the heatmap and the dendrogram colour codes for different conditions: healthy skinis represented in green, nevi in black, epithelial melanocytes in blue, primary melanoma inpink, and metastatic melanoma in red. The higher the correlation the lighter the rectanglesbetween the samples. Two large clusters can be observed: one mainly composed of metastaticmelanoma samples and the other one composed of primary melanoma, nevi and, a small healthyskin cluster. Overall, a distinction between healthy skin and cancer can be observed.
28
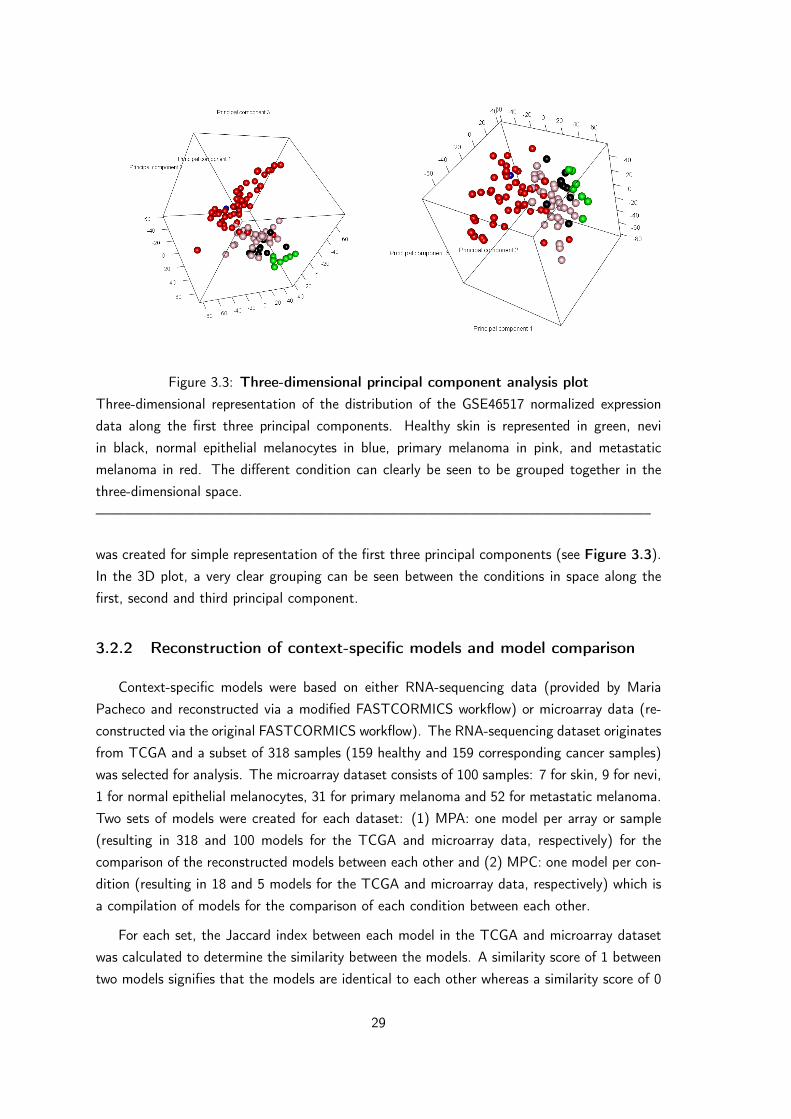
Figure 3.3: Three-dimensional principal component analysis plotThree-dimensional representation of the distribution of the GSE46517 normalized expressiondata along the first three principal components. Healthy skin is represented in green, neviin black, normal epithelial melanocytes in blue, primary melanoma in pink, and metastaticmelanoma in red. The different condition can clearly be seen to be grouped together in thethree-dimensional space.——————————————————————————————————————–
was created for simple representation of the first three principal components (see Figure 3.3).In the 3D plot, a very clear grouping can be seen between the conditions in space along thefirst, second and third principal component.
3.2.2 Reconstruction of context-specific models and model comparison
Context-specific models were based on either RNA-sequencing data (provided by MariaPacheco and reconstructed via a modified FASTCORMICS workflow) or microarray data (re-constructed via the original FASTCORMICS workflow). The RNA-sequencing dataset originatesfrom TCGA and a subset of 318 samples (159 healthy and 159 corresponding cancer samples)was selected for analysis. The microarray dataset consists of 100 samples: 7 for skin, 9 for nevi,1 for normal epithelial melanocytes, 31 for primary melanoma and 52 for metastatic melanoma.Two sets of models were created for each dataset: (1) MPA: one model per array or sample(resulting in 318 and 100 models for the TCGA and microarray data, respectively) for thecomparison of the reconstructed models between each other and (2) MPC: one model per con-dition (resulting in 18 and 5 models for the TCGA and microarray data, respectively) which isa compilation of models for the comparison of each condition between each other.
For each set, the Jaccard index between each model in the TCGA and microarray datasetwas calculated to determine the similarity between the models. A similarity score of 1 betweentwo models signifies that the models are identical to each other whereas a similarity score of 0
29

signifies that the model are completely different to each other. Based on the Jaccard similarityscore, four different clustergrams were created: MPA and MPC for the TCGA data and MPAand MPC for the microarray data. As the clustergram is based on a squared distance matrix,the x-axis is equal to the y-axis and the diagonal represents the similarity score (= 1) betweenthe same model.
RNA-sequencing dataset from the TCGA For the MPA clustergram (Figure 5.3 in thesupplementary data), several clusters varying in size could be observed. The clusters mainlyconsisted of models from the same tissue type, regardless if they were cancerous or not. Fur-thermore, models from related tissues were also found to be clustered together such as KICH,KIRC and KIRP (originating from kidney tissues) or COAD, READ and STAT (originatingfrom the gastrointestinal tract: colon, rectum and stomach). Models for LIHC are clusteredseparately from the others (leftmost branch of the dendrogram).
As no evident healthy or cancer model cluster could be observed, the similarity score betweenall of the healthy and cancer model for one condition was represented in another clustergram(see Figure 5.4 in the supplementary data). Overall, healthy and cancer models showed to bedistinguishable by the Jaccard index. GBM and KICH showed the best clustering, the healthyand cancer models are more dissimilar between each other (0.8 - 0.85 and 0.7 - 0.8, respectively)than within each other (0.8 - 0.9 and 0.75 - 0.9, respectively). Clusters could be observed, butto a lesser extend, for KIRC, KIRP, LUAD, LUSC, READ, STAD, THCA and UCEC. Healthymodels were more often clustered together than cancer model. The similarity scores within thecancer models were lower than for healthy probably presenting the heterogeneity in the differentcancer models and samples.
The MPC clustergram (Figure 5.5 in the supplementary data) did show modest clustering.Three clusters are indicated by the dendrogram above the figure: two clusters are mainlycomposed of cancer models with a total of three healthy models whereas the third is mainlycomposed of healthy models with 2 cancer models. Furthermore, one possible outlier could beobserved (healthy_LIHC, leftmost branch of the dendrogram) which is found to be clusteredapart from all the other models. However, the tendency of similar healthy tissues to be clusteredtogether could be observed. Again, KICH, KIRC and KIRP as well as COAD, READ and STATwere clustered together.
Microarray dataset. The MPA clustergram (Figure 3.4) displays one large cluster whichis mainly composed of primary and metastatic melanoma (similarity scores above 0.5 withinthe cluster). Only one nevi model and the single normal epithelial melanocyte model werefound inside that cluster. Furthermore, the second cluster which is mainly composed of healthyskin models and some melanoma models, appears to be divided into three sub-clusters: Onecluster that is solely composed of melanoma models, a second cluster composed of both healthyand melanoma model and a third cluster composed of only healthy models. Overall, a clearseparation between healthy and cancer (similarity scores below 0.5) can be observed based on
30

Figure 3.4: Clustergram based on the Jaccard index of the microarray data (MPA)100 context-specific models were reconstructed from microarray data (MPA: one model perarray) via FASTCORMICS and clustered according to their similarity score (Jaccard index).Healthy skin (S), nevi (N), normal epithelial melanocytes (NEM), primary melanoma (PM) andmetastatic melanoma (MM). PM and MM are mainly clustered together and make up one largecluster. S and N are also grouped together and are separate from the large melanoma cluster.
31

the similarity of the context-specific models.
For the MPC clustergram (Figure 5.6 in the supplementary data), the normal epithelialmelanocyte model is the most dissimilar to all of the other models and can be seen as apossible outlier as only one microarray sample was used for model reconstruction. Beside theNEM model, two clusters can be observed: a healthy skin and nevi cluster and a primaryand metastatic melanoma cluster (with a similarity score of 0.7 and 0.8 inside each cluster,respectively.) Both clusters (healthy and cancer) show a similarity score between 0.4 and 0.5.
3.2.3 Model comparison
The reconstructed context-specific models for each condition (MPC for both datasets) havebeen compared to the original model, Recon 2 and between each other. Naturally, the recon-structed context-specific models have fewer genes, reactions, metabolites and active pathwaysthan the original model. Interestingly, the number of genes and metabolites was smaller in allcancer models whereas the number of active reactions was higher in only two cancer modelsfrom the TCGA data (BRCA and UCEC). The number of active pathways was the same inBRCA and PRAD and higher in cancer for GBM and UCEC. The difference between healthyand cancer was most prominent in the microarray dataset, where the primary and metastaticmelanoma models showed fewer genes, reactions and metabolites compared to the healthy skinmodel.
A more complete overview on the number genes, reactions, metabolites and pathwayspresent in each model reconstructed from the TCGA and microarray data can be seen in Table5.1 (in the supplementary data) and Table 3.1, respectively. The normal epithelial melanocytemodel will not be discussed as the model was reconstructed from only one microarray and couldpresent a possible outlier.
Table 3.1: Overview of the MPC models from the GSE46517 datasetThe following table provides an overview on the genes, unique genes, reactions, metabolites,and active reactions in each of the context-specific models as well as Recon 2 and consistentRecon 2 for comparison.
Model Name Genes Unique genes Reactions Metabolites PathwaysRecon 2 2140 1733 7440 5063 96
Consistent Recon 2 1913 1550 5317 2960 86
Skin 704 576 674 632 52
Nevi 609 504 574 548 50
Normal epithelial melanocytes 884 718 978 754 59
Primary melanoma 574 465 488 473 46
Metastatic melanoma 587 477 462 464 51
32
Active pathways The consistent Recon 2 model possesses 86 different pathways rangingfrom the metabolism of amino acids, fatty acids, glucose, vitamins and other metabolites totransport reactions. In order to observe differences in these metabolic pathways (or subsystems),the number of active genes and the fraction of active reactions in each pathway were determinedfor the healthy and cancer models. A modified version of the findSubSysGen function from theCOBRA toolbox was used to find all the reactions encoded by a given gene in each pathway.Pathways can be either present or absent in the models.
Genes The pathways in the consistent Recon 2 involving the most genes (more than 100)are the extracellular transport, nucleotide interconversion and oxidative phosphorylation.
For the TCGA dataset, differences in the number the active genes involved in the pathwayscan be observed between healthy and cancer. Cancer showed fewer active genes in 38 pathwaysand more active genes in 4 pathways, 35 pathways showed no difference and 9 did not haveany active genes (see Figure 5.7 in the supplementary data).
For the microarray data, differences in the number of active genes between healthy andmelanoma could be observed. Primary and metastatic melanoma showed fewer active genes in22 and 29 pathways, respectively, and more active genes in 10 and 12 pathways respectively.29 pathways did not have any active genes (see Figure 5.8 in the supplementary data).
Reactions The fractions of the active reactions in the healthy and cancer models weredetermined and plotted against each other to observe the up- or down-regulation of pathwaysin the models.
For the TCGA data (MPC), the overall comparison between healthy and cancer modelsrevealed up-regulation of 4 and down-regulation of 38 pathways in cancer whereas 44 pathwaysdid not show a difference compared to the healthy model (see Figure 5.9).
For the microarray data (MPC), the median fraction of active reactions of both primaryand metastatic melanoma revealed up-regulation of 10 pathways and down-regulation of 35pathways whereas 41 pathways did not show a difference compared to healthy. For primary andmetastatic melanoma alone, 29 and 35 pathways were down-regulated and 10 and 10 pathwayswere up-regulated, respectively (see Figure 5.10 in the supplementary data).
There was a total of 21 pathways which were down-regulated in both datasets in cancerincluding some amino acid pathways such as alanine, arginine, aspartate, glutamate, histi-dine, isoleucine, leucine, proline, tryptophan, tyrosine, valine, methionine and phenylalanine.Other down-regulated pathways included the inositol phosphate pathway and starch and su-crose metabolism. No consensus regarding the up-regulated pathways could be found. Figure3.5 shows the up- and down-regulated pathways in cancer for both datasets.
Table 5.3 (in the supplementary data) shows the difference between the active fractions ofreactions in each pathways, for healthy and cancer and both datasets (MPC). Negative numbers
33

Figure 3.5: Up- and down-regulated pathways in cancer for both datasetsBoth figures show which pathways are up- and down-regulated in cancer. For the GSE46517dataset, not only the median of the difference between the fractions of active reactions be-tween healthy and cancer was plotted but also for primary and metastatic melanoma alone. Aconsensus of 21 pathways is down-regulated in both datasets.
34

depict down-regulation of a pathway in cancer and positive numbers its up-regulation.
Furthermore, in order to observe the distribution of the fractions of active reactions for eachmodel (MPA), the data was represented as box plots and sorted in an ascending order basedon the median. Then, the median pathway distributions for healthy and cancer were plotted onthe box plots. By studying the figures (see Figure 5.11 and Figure 5.12 in the supplemen-tary data.), the previously found results are supported: down-regulation of the phenylalanine,arginine, proline, valine, leucine and isoleucine metabolism, urea cycle and cholesterol synthesis.
3.3 Gene deletions (in silico knock-outs and disease associa-tion)
Gene deletions were carried out for each context-specific model (MPC) from the TCGA andmicroarray dataset. Each gene in the given model was tested if its knock-out had an effect onthe ATP or biomass production represented by the growth ratio. Genes were said to be essentialif the growth ratio was below 0.9 for healthy and below 0.5 for cancer. Both thresholds couldalso be set to 0, however, genes whose knock-out results in a growth ratio below 1 do havea negative effect on the model and can in theory cause side effects. Therefore, the thresholdfor healthy was set to 0.9 in order to avoid possible side effects and the threshold for cancerwas set to 0.5 in order to have a reduction of the growth ratio i.e. inhibit the growth by 50%.Essential genes for healthy and cancer were compared and genes exclusively essential to cancerwere explored.
3.3.1 Single gene deletion
For the single gene deletion, ATP demand an biomass production were set as objectivefunction for all of the conditions. Even though the biomass reaction is not the primary objectiveof healthy cells (they do not grow and divide as fast as possible) the biomass production wasstill taken into account for healthy skin model in order to compare it to the cancer models as, tosome extent, the biomass reactions also resembles the basal protein turnover rate. Therefore,gene essentiality was determined for three different cases: (1) comparing growth ratios with onlythe ATP demand set as objective function, (2) comparing growth ratios with only the biomassreaction set as objective function and (3) comparing growth ratio with the ATP demand set forhealthy and biomass reaction for cancer. The last case determines genes which are essentialin cancer but do not inhibit the normal processes in healthy cells, such as the ATP demandreactions. Figure 3.6 presents the growth ratios for the single gene deletion and Table 3.2summarizes the number of essential genes per model and case.
TCGA dataset The median growth ratio between all of the healthy and cancer models wascalculated and used for finding essential genes. Single gene deletion returned gene essentiality
35
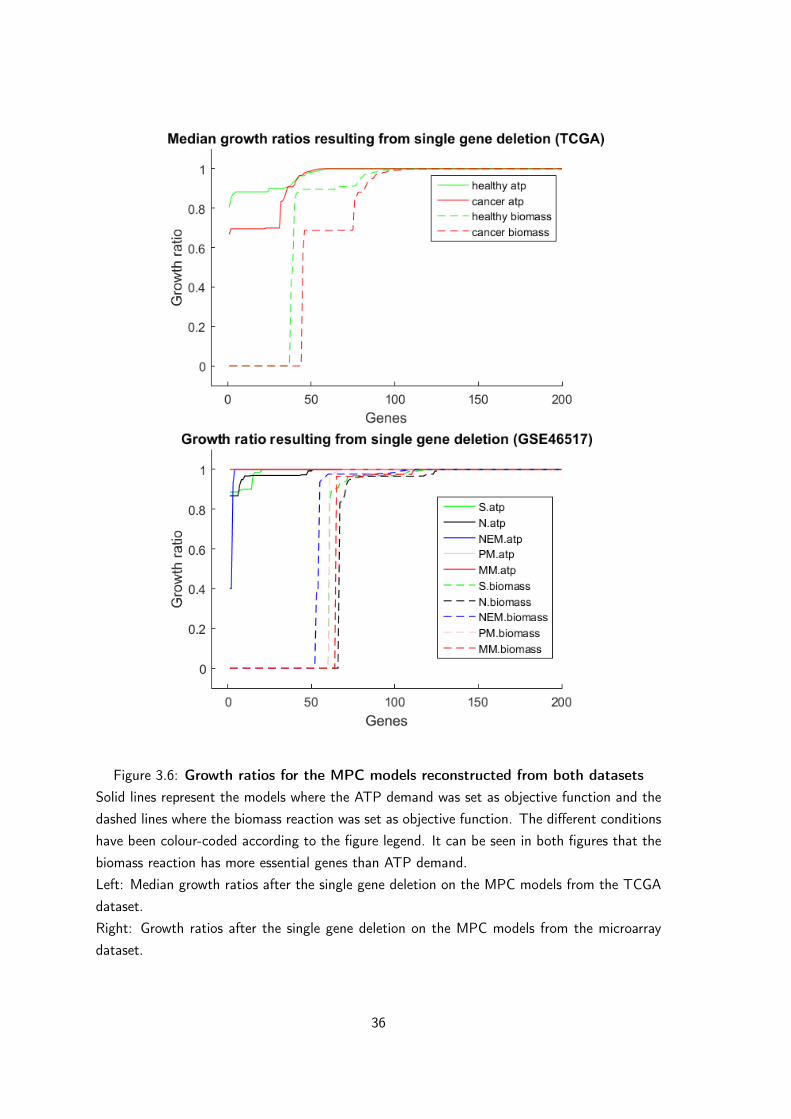
Figure 3.6: Growth ratios for the MPC models reconstructed from both datasetsSolid lines represent the models where the ATP demand was set as objective function and thedashed lines where the biomass reaction was set as objective function. The different conditionshave been colour-coded according to the figure legend. It can be seen in both figures that thebiomass reaction has more essential genes than ATP demand.Left: Median growth ratios after the single gene deletion on the MPC models from the TCGAdataset.Right: Growth ratios after the single gene deletion on the MPC models from the microarraydataset.
36

Table 3.2: Number of essential genes for each condition, case and datasetThe three different cases describe the objective function(s) which have been set for the singlegene deletion (1) ATP demand for both, (2) biomass reaction for both and (3) ATP demandfor healthy and biomass reaction for cancer. Table 5.6 (in the supplementary data) depicts allthe essential genes which have been found in case 2 and 3 and where at least 1 inhibiting drughas been found.
Microarray dataset Number of essential genes
Condition case 1 case 2 case 3
Healthy 8 63 8
Primary melanoma 0 60 60
Metastatic melanoma 0 64 64
Union melanoma 0 65 65
Unique to melanoma 0 10 64
TCGA dataset Number of essential genes
Condition case 1 case 2 case 3
Healthy 24 64 24
Cancer 0 44 44
Unique to cancer 0 6 44
for 24 and 64 genes in healthy (ATP demand and biomass reaction, respectively) and 0 and 44genes in cancer (ATP demand and biomass reaction, respectively). No essential cancer genesfor cancer could be found for case 1, whereas for case 2 and 3, 10 and 64 genes are exclusivelyessential in cancer.
Microarray dataset, GSE46517 Essential genes for healthy skin were compared with theunion of the essential genes between primary and metastatic melanoma. Single gene deletionreturned gene essentiality for 8 and 63 genes in healthy (ATP demand and biomass reaction,respectively) and 0 and 65 genes in cancer (ATP demand and biomass reaction, respectively).For the first case, no genes essential in only cancer could be found, whereas for the second andthird case 10 and 64 essential cancer genes have been found.
3.3.2 Gene-disease associations
Two different gene-disease association databases have been searched in order to verify ifany of the previously found essential genes had a link to melanoma or cancer. As the first caseof the single gene deletion (ATP demand as objective function for both) did not return anyexclusive essential genes for cancer, only the genes found in the second and third case havebeen looked up.
37
The databases, in which a link between the gene and cancer was sought, were ccmGDB andDisGeNET. A hypergeometric test was used to investigate if these findings were due to chanceor statistically significant. Statistical significance (p-value below 0.05) can only be observed forcase 2 of the TCGA dataset (ccmGDB) and case 3 from the microarray dataset (DisGeNET).The results from case 2 of the microarray data (DisGeNET) could also be of interest (p-value= 0.0530). Table 5.5 and Table 5.2 (both in the supplementary data) summarize the findingsfrom the gene-disease association.
Overall, 65 different genes have been investigated: 11 genes have been found in the ccmGDBand 20 in DisGeNET whereas the following 7 have been found to be associated with cancer inboth databases:
CAD : carbamoyl-phosphate synthetase 2, aspartate transcarbamylase, and dihydroorotase.
FASN : fatty acid synthase
KDSR : 3-keto-dihydrosphingosine reductase
MVK : mevalonate kinase
RRM1 : ribonucleotide reductase catalytic subunit M1
SLCO1B1 : solute carrier organic anion transporter family member 1B1
TYMS : thymidylate synthetase
Further literature research showed that FASN (Kuhajda, 2000; Furuta et al., 2010), KDSR(or FVT-1) (Leslie et al., 2013), MVK (Clendening et al., 2010), RRM1 (Furuta et al., 2010),SLCO1B1 (Cui et al., 2003) and TYMS (Rahman et al., 2004; Furuta et al., 2010) have knownevidence to play an important role in cancer.
3.4 Drug targets
3.4.1 From genes to drug targets
The genome scale metabolic reconstruction, Recon 2, was used for finding possible drugtargets. After the removal of 407 gene transcripts, the number of genes present in the modelwas reduced from 2140 to 1733. Genes were associated with two different protein identifiers,the UniProtKB/Swiss-Prot protein identifier and the Ensembl protein identifier (ENSP), fordata mining of the DrugBank and STITCH database, respectively. Some genes did not posses acorresponding UniProtKB/Swiss-Prot protein identifier in the NCBI Entrez Gene database, thesegenes were either pseudogenes (gene ID 286297), withdrawn by the NCBI (gene ID 100507855),without a validated RefSeq status(gene ID 102724197) or not found in the database (gene IDAI971036). A total of 1716 translated proteins from the Recon 2 model have been found.
38

Only 1705 genes had a corresponding Ensembl protein identifier (ENSP). Table 3.3 gives anoverview on the gene-drug findings.
Table 3.3: Summary of the number of interactions and drugs found in the DrugBankand STITCH databaseThis tables gives a summary about the drugs found via the DrugBank and STITCH as wellas the type of the interaction and drug groups. * Drug groups could not be searched for inSTITCH, as the database does not provide further information on the drugs.
Name DrugBank STITCHUnique genes 1733 1733
Proteins 1716 1705
For all interactionsAll interactions 6220 25036
Unique drugs 2313 5547
Unique drug targets 659 520
Inhibiting interactions 2003 8296
Inhibiting drugs 802 3143
Drug groups of the inhibiting drugs*Approved drugs 727 /
Experimental drugs 41 /
Nutraceutical drugs 47 /
Illicit drugs 28 /
Withdrawn drugs 47 /
Approved and inhibiting drugs*Interactions 1861 /
Unique drugs 727 /
Unique drug targets 192 /
DrugBank database The DrugBank is a database containing information on drugs, theirtargets and actions in the human body. Search queries can either be performed by using theofficial gene name or the UniProtKB/Swiss-Prot protein identifier, the DrugBank then returnsa list of drugs, their corresponding drug group, the pharmaceutical action and the actions of thedrug on the entered protein. Drug groups range from approved, experimental, investigational,nutraceutical (from food), illicit and withdrawn. The action of the drug can either be anactivator, antagonist, binder, inhibitor, substrate, inducer or nothing/not known.
Data mining showed that, out of the 1729 proteins, 661 have been found in the DrugBankand 659 are drug targets (regardless of the drug group or action). Three proteins only hadentries and no interaction information. A total of 6220 different protein-drug interactions have
39

been found where 2313 unique drugs interact with 659 genes. In order to later test the findingsfrom the gene deletions in vitro, only inhibiting drugs were chosen (802 unique drugs from2003 inhibiting interactions). Out of the 802 inhibiting drugs, 727 drugs are approved, 41 areexperimental, 47 are nutraceutical, 28 are illicit and 47 are withdrawn. Note that the druggroups are not mutually exclusive.
STITCH database The STITCH database is protein-chemical and chemical-chemical in-teraction database and the interaction data can be downloaded via their website (http:
//stitch.embl.de/cgi/show_download_page.pl). Interactions where the chemical is act-ing on the protein were selected whereas the interaction can either be "activating", "inhibiting"or not given. The complete database for Homo sapiens includes a total of 5105793 chemical-protein and chemical-chemical interactions. By filtering for the interactions where the chemicalis acting on the protein and by removing the different chemical isomers, 196169 interactions re-main. Out of those 196169 interactions, 29133 are activating, 37086 are inhibiting and 1129950are not given. There were 12988 unique chemicals acting on 15153 unique proteins.
Out of the 1733 unique genes in Recon 2, 1705 had an Ensembl protein identifier associ-ated and 987 proteins were possible drug targets. A total of 25036 interactions were found(regardless of interaction type) involving 5547 unique drugs. 8296 inhibiting interaction werefound involving 3143 unique drugs inhibiting 520 unique proteins.
The top ten targeted genes from the DrugBank and STITCH were determined and compared(see Figure 3.7). Cytochromes (CYP) and proteins from the solute carrier family (SLC) werefound to be targets of most drugs. CYP3A4 is targeted by 215 approved and inhibiting drugsfound in the DrugBank.
The top ten drugs with the most targets from the DrugBank and STITCH were also deter-mined and compared. Cimetidine was found to be the drug with the highest number of targets(16). For STITCH, estradiol was the chemical targeting the most genes. Some drug entriescan be found multiple times, however the CID for each entry is a different one even though thecommon name is the same. Estradiol, for example, is only one of the names for both CID 450and CID 5757.
3.4.2 Cancer and melanoma drug targets
By combining the results from the single gene deletion and the drug target data mining,drugs inhibiting the cancer exclusive essential genes could easily be found. Three cases hadbeen established for the single gene deletion: (1) comparing growth ratios with only the ATPdemand set as objective function, (2) comparing growth ratios with only the biomass reactionset as objective function and (3) comparing growth ratio with the ATP demand set for healthyand biomass reaction for cancer. As no essential genes exclusive to cancer were found for case1, only case 2 and case 3 will be further evaluated for both datasets.
40

Figure 3.7: Top ten targeted genes and drugs from the DrugBank and STITCHA and B. Top ten targeted genes via DrugBank and STITCH. For both databases, the top 10targets are proteins from the family of cytochromes and solute carriers. A consensus of sixcytochromes could be found in both databases where CYP3A4 was found to be the top target.C and D. Top ten drugs with the most targets via DrugBank and STITCH. As, STITCH isa chemical-protein association database and does not necessary contain information only ondrugs but on all chemicals inhibiting the given protein from a gene. Some chemicals names canbe found multiple times in the STITCH database, however, the CID is different.——————————————————————————————————————–
41

For the TCGA dataset, 6 and 44 genes have been found to be exclusively essential in cancerfor case 2 and 3, respectively. Out of the 6 genes (case 2), 3 and 5 genes are possible targetsfor inhibiting drugs found by the DrugBank and STITCH. Out of the 44 genes (case 3), 8 and23 genes are possible targets for inhibiting drugs found by the DrugBank and STITCH.
For the microarray dataset, 10 and 64 genes have been found to be exclusively essentialin melanoma for case 2 and 3, respectively. Out of the 10 genes (case 2), 0 and 4 genes arepossible targets for inhibiting drugs found by the DrugBank and STITCH. Out of the 64 genes(case 2), 11 and 33 genes are possible targets for inhibiting drugs found by the DrugBank andSTITCH (see Table 3.4). Table 5.6 (in the supplementary data) summarizes, for each datasetand case, the essential genes found exclusively for cancer as well as the number of inhibitingdrugs and if the genes have an association to cancer.
Table 3.4: Number of drug targets found for both datasets and casesThis table gives an overview on how many cancer exclusive genes have been found as well asthe number of targets and drugs found via the DrugBank and STITCH. More information onthe genes can be found in Table 5.6 in the supplementary data. The highest number of targetshas been found for the microarray data, case 3: 11 and 33 out of 64 essential genes are drugtargets in the DrugBank and STITCH, respectively. In case 2, the biomass was set as objectivefunction for both healthy and cancer and in case 3, the ATP demand was set as objectivefunction for healthy and the biomass reaction was set for cancer in order to find genes affectingthe growth of cancer but not the genes essential for the ATP demand reaction in healthy.
Dataset case Genes essentialexclusive to
cancer
DrugBank STITCH
targets drugs targets drugs
TCGA 2 6 3 8 5 42
TCGA 3 44 8 25 23 282
GSE46517 2 10 0 0 4 101
GSE46517 3 64 11 54 33 465
42

4 Discussion
Metabolic modelling and the reconstruction of genome scale metabolic models are powerfultools in systems biology for the exploration of underlying reactions in the metabolism of a givenorganism. Not only can metabolic reconstructions and models be used to better understand thehuman metabolism but it can also be used for other purposes such as metabolic engineering ormodel-driven discovery. For example, in 2005, Fong et al. applied findings from in silico genedeletions on E. coli to successfully induce lactate production (Fong et al., 2005). This showsthat the in silico modelling followed by in vivo phenotype optimization can be used on a largescale to "produce industrial and therapeutically relevant compounds" (McCloskey et al., 2013).Furthermore, a review from 2008, describes and summarizes systems metabolic engineering asthe "application of systems biology for bioprocess development" (Park et al., 2008). On theother hand, model-driven discovery can be used for the identification of disease-relevant drugtargets such as the discovery of new antimicrobial drugs (Kim et al., 2010; Krueger et al., 2016)or the re-purposing of already known drugs (Chavali et al., 2012).
4.1 Comparison of the healthy and cancer models
This thesis presents the development of a new workflow by implementing metabolic mod-elling for finding new drug targets. Contrary to other studies, this workflow also includes theknown side effects of the found drugs and therefore a better choice between the efficiency andtoxicity of a treatment can be taken. By exploring a genome scale metabolic reconstructionand creating context specific models for healthy and diseased tissues (such as cancer in thiscase), exclusive genes which are essential to the diseased condition can be found. Then, in asecond step, drugs targeting these genes have been sought and their side effects extracted. Itis important that the effects on the healthy tissues should be kept as minimal as possible inorder to reduce these side effects while still affecting the growth of cancer cells.
Two datasets focussing on cancer and melanoma have been used to find metabolic differ-ences between healthy and cancer tissues The TCGA dataset comprises RNA-sequencing dataon 24 different cancer tissues as well as their healthy counterparts. Unfortunately, the TCGAdataset did not contain enough information on skin cancer, as only one healthy control wasavailable. Hence, the TCGA dataset was used as a general overview on all cancer tissues.As the focus was set on melanoma, a second dataset was considered: the microarray dataset(GSE46517) contains information on the gene expression in melanoma (primary and metastatic)and healthy skin.
After the creation of context-specific models for each array (MPA) and condition (MPC)via FASTCORMICS, the Jaccard index between and within the models was calculated, basedon the active reaction in each model. The healthy and cancer models reconstructed from bothdatasets were compared. For the TCGA dataset (Figure 5.3, MPA), no clear difference between
43

healthy and cancer could be observed, however different tissue types could be distinguished andfound to be clustered together such as healthy renal tissues (KICH, KIRC and KIRP) or thegastrointestinal tissues (COAD, READ, STAD). No clear differences between healthy and cancercould be observed because the effect of the tissues (conditions) has a greater impact on theJaccard index than their status (healthy and cancer). Different tissues in the human body havedifferent functions and therefore different reactions can be found clustered together for examplethe kidney tissue and the gastrointestinal tissues.
After splitting the clustergram into each condition (Figure 5.4), more or less clear differ-ences between healthy and cancer could be observed, supporting the idea of the tissues havinga greater impact on the Jaccard index than its state (healthy or cancer). The third clustergram(Figure 5.5, MPC) of the TCGA dataset consists of 36 different models, 2 for each tissue type(healthy and cancer). Again, it can be observed that the healthy renal tissue and gastrointesti-nal tissues are clustered together. For the microarray dataset, both clustergrams (Figure 3.4and Figure 5.6) showed that there is a clear difference between healthy and melanoma and be-tween cancer stages (primary and metastatic melanoma). Furthermore, the mixed third clusterin Figure 3.4 shows the heterogeneity of melanoma and designates a possible sub-populationwhose metabolism is closer to that of healthy tissues. There was also one healthy sample whichhas been found inside of the melanoma cluster indicating a possible metabolic shift towardscancer.
In conclusion, the effect and the reactions present in different tissues is more decisivethan the effect between healthy and cancer models. However, if this effect is taken out, bysplitting the different tissues, differences between healthy and cancer can be observed. Theclustergrams based on the Jaccard indexes demonstrate that, cancer cells do have a specificmetabolism which is different from their healthy counterparts. Therefore, the reactions presentin the altered metabolism in cancer can be seen as potential drug targets if the given reaction(s)is not needed in healthy tissue or can be compensated by alternative pathways not present incancer.
In order to see where the differences lie, the reconstructed context-specific models werecompared in terms of their number of genes, metabolites and reactions. The comparisonrevealed a relatively small model size for the melanoma models from the microarray data with674, 488 and 462 active reactions in skin, primary and metastatic melanoma, respectively. Themodels reconstructed from the TCGA data were noticeably larger (on average 1730 reactions forhealthy and 1562 reactions for each cancer type). The smaller size of the models, reconstructedfrom the microarray expression data, could be explained by the microarray data itself, whichis subject to contain a high amount of background noise. As the arrays were read into R,normalized with fRMA, and then processed with Barcode, there could have been an issue withthe threshold set for the discretization step in FASTCORMICS. Several active and inactivegenes might not have been captured due to this threshold resulting in several false negatives.The set "threshold is arbitrary and critical for the output metabolic models as in response tothis threshold complete branches, alternative pathways, or subsystems might be included or
44

excluded, thereby heavily changing the functionalities of the model" (Pacheco et al., 2015).Therefore, as stated in the same publication, future work is required to correctly adjust and setthe right threshold for the input data. Moreover, there is the possibility that skin has a loweroverall gene expression because it is mainly made up of dead skin cells.
In general, the cancer models were smaller than their healthy counterparts in both datasets,indicating a reduction or a shift in cancer metabolism. The number of active genes in the differ-ent pathways was reduced in the cancer models and accordingly a consensus of 21 pathways hasbeen found to be down-regulated in cancer for both datasets, mainly affecting the amino acidmetabolism of alanine, arginine, aspartate, glutamate, histidine, isoleucine, leucine, methion-ine, phenylalanine, proline, tryptophan, tyrosine and valine. Other affected pathways in bothdatasets were the nucleotide interconversion, the starch and sucrose metabolism, the inositolphosphate metabolism, the pyrimidine catabolism and cholesterol metabolism. Although, evenif we know that the amino acid metabolism of i.e. phenylalanine is down-regulated in cancer,it is unclear which part of the metabolism is down-regulated, it could either be the breakingdown (catabolism) or building up (anabolism) of the given amino acid. It is known that, as atumour undergoes different stages of progression, the "genes that directly control the rate ofkey metabolic pathways including glycolysis, lipogenesis and nucleotide synthesis are drasticallyaltered" (Furuta et al., 2010). Therefore, metabolic modelling can be used to re-program someof these pathways and return the cell to a normal healthy state or cause the death of thesemetabolically altered cells. However, further research on this topic is required.
However, limiting some of the needed nutrients in cancer by e.g. amino acid restriction,has already been proposed as a novel treatment for cancer (López-lázaro, 2015) supporting thefindings of the down-regulation of the different amino acid metabolism in cancer. Hence, withan already down-regulated amino acid metabolism, the cancer cell is not able to produce therequired amounts by itself and relies on external sources. If no outside source is provided (bye.g. food), the cell will most probably die. On the other hand, the reduced pathway activityin cancer shows that there is a deficiency in the given pathway. By targeting genes coding forimportant enzymes in the cancerous pathway, cell death can be induced as the healthy cell (witha fully functioning pathway) might be able to use alternative pathways for the production of agiven metabolite. Even though the restriction of phenylalanine and tyrosine has been proven tobe effective in mice models, the same effects could not be observed in humans (Harvie et al.,2002).
4.2 Results from the single gene deletion study: essentialgenes in cancer
As the major objective of cancer cells is growth and proliferation, they need large amountsof lipids, amino acids, nucleic acids and energy in the form of ATP and glucose. Severalmetabolic alterations are present in tumours; some metabolic pathways are partially shut down
45
and alternative pathways are used instead. The use of aerobic glycolysis instead of oxidativephosphorylation, also known as the "Warburg effect" (Vander Heiden et al., 2009), is oneexample of an alternative though less efficient pathway. Targeting these alternative or alteredpathways present in cancer and not in healthy tissues is one of the main approaches to reducecancer growth. Therefore, single gene deletion was carried out and two different objectivefunctions have been used for optimization: the ATP demand reaction and the biomass reaction.Three different cases have been investigated, for both datasets: (1) the ATP demand was setas objective function for both the healthy and cancer models, (2) the biomass reaction was setas objective function for both healthy and cancer models and (3) the ATP demand was set asobjective function for healthy and the biomass reaction was set as objective function for thecancer model. Both the ATP demand and biomass reaction are good indicators for the growthrate of a model. However, the biomass reaction is generally not used to account for the growthratio of healthy cells as their primary objective is not to grow and divide, unlike cancer cells.The ATP demand reaction is an essential function for every cell and without ATP, the cell isno longer provided with energy and will be unable to perform its functions and eventually die.The biomass on the contrary is not necessarily needed for healthy cells at all times but is agood indicator of protein turnover. Genes were said to be essential if the growth ratio wasbelow 0.9 and 0.5 for healthy and cancer, respectively. These threshold were set such that, theknockout of a gene will reduce cancer growth by at least 50% but not affect the healthy celltoo much (90% reduction). Therefore, for case 3, only the genes exclusively essential in cancerwere selected; their knockout will reduce the growth in cancer but not affect the needed ATPdemand reaction for healthy.
The results from the single gene deletion returned gene essentiality exclusively in cancer for6 and 10 genes (case 2) and 44 and 64 genes (case 3) for the TCGA and microarray dataset,respectively. Overall, the ATP demand reaction is very robust and was not found to be shutdown by the single gene deletion. The ATP production is essential for each cell and representsan important part of the cell metabolism. The biomass reaction, on the other hand, is moresensitive as more reactions are needed to meet its demands. However, the biomass reaction isnot necessary for cells that lay dormant and do not need to actively grow and divide.
Fewer essential genes exclusive to cancer have been found for case 2; the biomass produc-tion seems to be equally affected by gene deletions in both healthy and cancer cells whereasthe TCGA models show higher differences between healthy and cancer. Furthermore, the setthreshold for the growth ratio affected the results because the deletion of genes causes thehealthy cells to reduce their biomass production to 90%. The overlap of essential genes be-tween healthy and cancer was therefore increased. By comparing the essential genes for theATP demand reaction and biomass production more genes have been found because differentgenes participate in these two reactions. See Table 5.6 in the supplementary data for details.All essential genes which have been found in case 2, were also found to be essential in case3, for both datasets. As can be seen in Figure 4.1, 43 out of the 65 unique genes have beenfound in both datasets, 1 and 21 genes were exclusive to the TCGA and microarray dataset,
46

respectively.
All found essential cancer genes have been looked up in two different databases (ccmGDBand DisGeNET) to explore if they had a known link to cancer and 24 unique metabolic cancergenes have been found (16 in both datasets and 8 exclusive to melanoma). A hypergeometrictest was used to determine if the findings were due to chance, however, for some the samplesize was too small to get a meaningful result. Furthermore, more gene-disease databasesare available online and could be explored such as Malacards (Rappaport et al., 2014), theCTD database (Davis et al., 2015), DISEASES (Pletscher-Frankild et al., 2015) or IntOGen(Gonzalez-Perez et al., 2013). However, as most gene-disease databases do not focus onmetabolic genes but more on regulatory genes it is important to find an adequate database,therefore, and due to the easy access to this information, the ccmGB and DisGeNet were used.In addition, as many databases as possible should be explored because there is no leadingdatabase covering all of the known associations. In the future, a confidence score for eachgene-disease association should be added with reference to the related paper.
Three of the genes found to be essential to cancer through the single gene deletion, havealready been reviewed and identified as metabolic cancer genes (Furuta et al., 2010): the fattyacid synthase (FAS encoded by the FASN gene), the ribonucleotide reductase (RRM2) and thethymidylate synthase (TYMS).
FASN was already shown to be highly up-regulated in cancer (Kuhajda, 2000). As cancercells need fatty acids as building blocks for the cell membrane, and thus for proliferation,inhibition of FASN was shown to inhibit cellular growth and cause apoptosis (Currie et al.,2013).
RRM2 is an enzyme needed for the synthesis of deoxyribonucleotides, the building blocks ofDNA. It was shown that the overexpression of ribonucleotide reductase induces lung neoplasmin transgenic mice (Xu et al., 2008).
TYMS is a well known metabolic cancer gene and acts as en enzyme for the thymidinemonophosphate biosynthesis, one of the four nucleosides of the DNA. Over expression of thethymidylate synthase was shown to induce tumour formation in nude mice (Rahman et al.,2004).
Note that there exist more metabolic cancer genes than only the three described above, butfor these three, gene essentiality was suggested by the single gene deletion. The knock-down ofthese genes does cause an impairment in the growth ratio of the cancer models but not healthymodels, suggesting that the healthy counterparts have some alternative pathways.
4.3 Drug targets in cancer - drugs and their side effects
In the second step of the workflow, drug targets have been predicted with the use oftwo databases, the DrugBank, a drug-protein interaction database, and STITCH, a chemical-
47

Figure 4.1: Venn diagram of the cancer exclusive essential genes and their distributionThis four-circle Venn diagram gives an overview on which genes are exclusive or mutual to eachcase and dataset, TCGA case 2, TCGA case 3, GSE46517 case 2 and GSE46517 case 3. Case1 is not shown, as no cancer exclusive essential genes had been found. All the cancer exclusiveessential genes found in case 2, have also been found in case 3. Only one gene is unique tothe TCGA dataset and 21 genes to the GSE46517 dataset or melanoma. 43 essential genes aremutual to both datasets.Venn diagram created by Venny 2.1 (Oliveros, 2007).——————————————————————————————————————–
protein interaction database. In order to be able to later test the results from the in silico genedeletions in vitro, drugs known to inhibit these proteins have been extracted. For the DrugBank,2003 inhibiting interactions involving 802 unique drugs (727 approved) have been found andfor STITCH 8296 inhibiting interactions involving 3143 unique drugs have been found. Thenumber of interactions and drugs is higher than for DrugBank because STITCH does not onlycontain interaction data on known drugs but also on different chemicals.
Out the 24 genes (unique and essential metabolic cancer genes known to have a link tocancer), 19 have been found to be targets via the STITCH database, 8 out those 19 have alsobeen found in the DrugBank. The other genes did now have any inhibiting drugs associated tothem. As the DrugBank is more focussed on actual drugs, and providing information if thesedrugs are approved or not, only the genes found in both interaction databases will be discussedbelow, see Table 4.1. The official gene symbol is given in bold, drugs in italic are used inanti-cancer therapy according to the DrugBank and their drug indication.
48

Table 4.1: Overview and inhibiting drugs of the eight candidate genes with a knownlink to cancerThe following tables gives information on the eight candidate genes which have been foundthrough single gene deletion. These eight genes have a known link to cancer and are knowndrug targets in the DrugBank and STITCH. The official gene is in bold and drugs in italic areused in anti-cancer therapy according to the DrugBank. The number between the parenthesisdescribes the number of side-effects associated to the drug.
Gene symbol Full name Involved pathway Inhibiting drugsATIC Bi-functional purine
biosynthesis proteinPURH
purine biosynthesispathway
Methotrexate (276)Pemetrexed (113)
DHODH Dihydroorotate dehy-drogenase
pyrimidine biosyn-thesis pathway
Atovaquone (65)Leflunomide (218)Teriflunomide (99)
FASN Fatty acid synthase fatty acidmetabolism
CeruleninOrlistat (146)
RRM1 Ribonucleoside-diphosphate reductaselarge subunit
nucleotide synthe-sis pathway
Cladribine (175)Clofarabine (167)Fludarabine(154)Gemcitabine (161)Hydroxyurea (105)
RRM2 Ribonucleoside-diphosphate reductasesubunit M2
nucleotide synthe-sis pathway
Cladribine (175)Gallium nitrate
RRM2B Ribonucleoside-diphosphate reductasesubunit M2 B
nucleotide synthe-sis pathway
Cladribine (175)
SQLE Squalene monooxyge-nase
sterol biosynthesispathway
Butenafine (5)Terbinafine (130)Naftifine (16)
TYMS Thymidylate synthase nucleotide synthe-sis pathway
Capecitabine (427)Gemcitabine (161)Leucovorin (53)Pemetrexed (113)Pralatrexate (37)Raltitrexed (53)TrifluridineTrimethoprim (94)
49

For 5 genes, currently used anti-cancer drugs have been found. Though, some of the founddrugs which are not indicated in anti-cancer therapy might have the potential to be used assuch. Cerulenin and Orlistat, for example, have already been proposed as anti-cancer agents byinhibiting the fatty acid synthase (Flavin et al., 2010; Hersey et al., 2009; Yoshii et al., 2013),or atovaquone, an anti-malarial drug and used to treat different bacterial infections (Fiorilloet al., 2016). Trifluridine, on the other hand, is currently used in combination with tipiracilhydrochloride (TAS-102) to treat metastatic colorectal cancer (Mayer et al., 2015). Currently,there are 7 FDA approved drugs used in targeted cancer therapy for melanoma: ipilimumab,vemurafenib, trametinib, dabrafenib, pembrolizumab, nivolumab, and cobimetinib (NationalCancer Institute, 2016), however none of these drugs have been found here.
Other essential genes which have been found through the single gene deletion could be offurther interest, however due to a problem during the data mining of the Entrez Gene databaseby NCBI, some DrugBank entries were not found and checked manually:
DHFR dihydrofolate reductase had already been proposed as a potential target in cancer in1990 (Schweitzer et al., 1990) and plays a role in the thymidylate biosynthesis pathwayand is therefore important for DNA synthesis. There are seven different approved andinhibiting drugs for DHFR, some are already in use in anti-cancer therapy such asmethotrexate.
MVK mevalonate kinase plays a role in the synthesis of isoprenoids and sterols. Mutationsof the tumour suppressor p53 have been linked to the up-regulation of MVK in cancer(Freed-Pastor et al., 2012). Furthermore statins, a common cholesterol managementdrug, inhibits the mevalonate pathway and has been proposed as anti-cancer drug(Thurnher et al., 2012).
HMGCR HMG-CoA reductase also participates in the mevalonate pathway and is needed forcholesterol synthesis. High levels of HMGCR (and other genes in the mevalonatepathway) are linked to a poor prognosis in breast cancer (Clendening et al., 2010).
Folger et al. performed a similar gene knockout experiment by using a constraint basedmodelling approach on a genome scale metabolic reconstruction to successfully predicted 52"cytostatic drug targets, of which 40% are targeted by known, approved or experimental an-ticancer drugs" (Folger et al., 2011). The comparison of the essential genes for cancer foundin this thesis and the genes found by Folger et al. showed a consensus of 36 genes (out of 65unique genes). These findings demonstrate that metabolic modelling can be used for findingessential genes in cancer. Similar to this study, Facchetti et al. used a metabolic modellingapproach to develop an algorithm which identifies new drug combinations and their synergisticeffects in order to inhibit a target function (i.e. biomass in cancer) in silico (Facchetti et al.,2012). Further development of the established workflow by implementing the findings of thedouble gene deletion is therefore needed.
50

Furthermore, single gene deletion also revealed 12 genes coding for different proteins ofthe solute carrier family (SLC). One of these solute carriers is SLCO1B1 (solute carrier organicanion transporter family member 1B1) and has been found in both gene-disease associationdatabases. Single nucleotide polymorphism in the gene have been associated to elevated risksof breast cancer (Lee et al., 2011). Even though data mining did not return the correct drugsfor this target, there are 39 approved and inhibiting drugs for SLCO1B1, several of whoseare known anti-cancer drugs. There exist different synonyms for the SLCO1B1 gene: LST-1,OATP-C, OATP-2 and SLC21A6. The transporter is found in the liver, an important player indrug clearance, and has been shown to be differentially synthesized in hepatocellular carcinomas(Cui et al., 2003).
Two other solute carriers have been linked to cancer: SLC5A3, belonging to the sodiumglucose co-transporter family, and SLC26A4, belonging to the multifunctional anion exchangerfamily. The former was shown to be significantly mutated in papillary renal cell carcinomas(Durinck et al., 2015) whereas the latter was found to be hyper-methylated in thyroid cancer(Xing et al., 2003). Solute carrier proteins are responsible for different important transportreactions e.g. "controlling [the] uptake and efflux of crucial compounds such as sugars, aminoacids, nucleotides, inorganic ions and drugs" (Hediger et al., 2004). Therefore, targeting SLCsin cancer could prove to be beneficial for the patient outcome by i.e. blocking the nutrient fluxto the tumour and slowing down its progression or desensitize the tumour to chemotherapeuticalagents (El-Gebali et al., 2013). A recent paper showed that, in cancer, some solute carriers areup-regulated and might function as tumour promoters (Bhutia et al., 2016). Therefore, findingthese SLCs through the single gene deletion is not surprising.
Another important aspect in finding potential drugs is the exploration of its off-targets andside effects. A given drug does not necessarily bind to only one single protein but might haveseveral targets. For example, cimetidine, a histamine antagonist and used to inhibit gastric acidsecretion (Brimblecombe and Duncan, 1975), inhibits 16 different genes in the Recon 2 model.The inhibition or activation of these off-targets can lead to undesired side effects, also calledadverse drug effects which can vary widely in severity, ranging from e.g. a light headache tomore severe side effects such as internal bleeding or death. A total of 3112 and 3143 uniqueside-effect have been extracted and the average number of side-effects per drug was 90 and 93for the DrugBank and STITCH database, respectively.
For the eight drugs found to inhibit TYMS, capecitabine, gemcitabine and pemetrexed, allknown chemotherapy agents, present more than 100 different side effects each (more than 400for Capecitabine), ranging from fatigue, mood swings and hair loss to agranulocytosis, renalfailure or even death to give a few examples. leucovorin, pralatrexate and raltitrexed are alsoknown chemotherapy drugs but do not have as many side effects as the previous three. However,trimethoprim, is not an approved chemotherapy agent but is an inhibitor of TYMS and usuallyused in the treatment of infections but might also be used to treat cancer. It is thereforeimportant to find a balance between the efficacy and toxicity of a given drug. Note that nonovel side effects have been predicted as the listed side effects are known to be associated to
51

the given drug.
4.4 Outlook
Even though only two datasets containing information in healthy and cancer tissues havebeen used for finding essential genes exclusive to cancer, the results are promising. 24 out ofthe 65 unique metabolic genes, found through in silico single gene deletion, are known to berelated to cancer. The comparison to a similar study (Folger et al., 2011) revealed a consensusof 36 genes whose knock-down results in a reduced growth ratio in cancer. Thus, by integratingmore datasets on different tissues and tumour stages, the proposed workflow can be refinedand ultimately be used to successfully predict specific drug targets in different cancer types andstages.
Furthermore, the complete data from the RNA-sequencing dataset should have been imple-mented instead of the rather small selection. By doing so, the gene deletion results from boththe TCGA melanoma-only data and microarray data can be properly compared. Unfortunately,the TCGA melanoma data included only one healthy sample, thus the focus should not only beset onto one tissue type.
In the near future, personalized medicine will be more advanced and can be applied to alarge range of patients. Due to high throughput methods such as microarrays becoming moreavailable and cost effective, the creation of a patient-tailored metabolic model of a disease willbe facilitated. In case of cancer, the phenotype of a tumour can be determined with the use ofthe model and be compared to its healthy counterpart. Then, target genes can be determinedand the most effective treatment (with minimal side effects) selected.
However, in order to reconstruct correct context-specific models, the initial GENRE needsto be as accurate as possible. If the initial model does not capture the whole metabolic network,the reconstructed models are also prone to errors. So far, all GENREs are still under constantdevelopment and improvement, thus, by far not all reactions, metabolites and genes are correctlycaptured by these reconstructions and models. Currently, there exist different reconstructionsof the human metabolism such Recon 2, the Human Metabolic Reconstruction 2 and theEdinburgh Human Metabolic Network, among others. Only recently, an independent groupupdated and manually curated Recon 2 and claimed that they created the "most predictivemodel of human metabolism to date" (Swainston et al., 2016).
Furthermore, elucidating the synergies between two drugs marks another important step inthe prediction of drug targets. Even if one single drug does not have a significant effect whenused alone, the combination with another drug could prove beneficial, reducing the amount ofthe drugs and possibly also reducing side effects. Therefore, a double gene knockout experimentcould be performed to look for these synergies. Moreover, identifying chromosomal deletionsin cancer could help in finding drugs for a specific type of cancer. For example, the genecoding for the ribulose 5-phosphate 3-epimerase is often deleted in head and neck squamous
52

cell carcinoma but not in other cancers. Here, Folger et al. also pointed out that differentcancers show different patterns of gene deletions which could be exploited as synergistic drugtargets (Folger et al., 2011).
The in silico prediction of side effects will greatly reduce the cost of the creation of newdrugs as only the most promising drugs can be selected to undergo the clinical trial phases.Metabolic modelling can be used to predict side effects of different drugs as demonstrated byShaked et al. who developed an approach for the prediction of drugs side effects using "model-based phenotype predictors" (Shaked et al., 2016) which could be implemented in the future.Lastly, a severity scale or ranking of the side-effects should be established in order to assign ascore to each drug, also taking into account the frequencies of the side effects. This score willthen help in choosing a drug with minimal toxicity to the organism.
53

References
Abecasis, G. R., Cherny, S. S., Cookson, W. O., and Cardon, L. R. (2002). Merlin–rapid analysisof dense genetic maps using sparse gene flow trees. Nature genetics, 30(1):97–101.
Agren, R., Bordel, S., Mardinoglu, A., Pornputtapong, N., Nookaew, I., and Nielsen, J. (2012).Reconstruction of genome-scale active metabolic networks for 69 human cell types and 16cancer types using INIT. PLoS computational biology, 8(5):e1002518.
Asgari, Y., Zabihinpour, Z., Salehzadeh-Yazdi, A., Schreiber, F., and Masoudi-Nejad, A. (2015).Alterations in cancer cell metabolism: The Warburg effect and metabolic adaptation.Genomics, 105(5-6):275–281.
Balch, C. M., Buzaid, a. C., Soong, S. J., Atkins, M. B., Cascinelli, N., Coit, D. G., Fleming,I. D., Gershenwald, J. E., Houghton, a., Kirkwood, J. M., McMasters, K. M., Mihm, M. F.,Morton, D. L., Reintgen, D. S., Ross, M. I., Sober, a., Thompson, J. a., and Thompson,J. F. (2001). Final version of the American Joint Committee on Cancer staging systemfor cutaneous melanoma. Journal of clinical oncology : official journal of the AmericanSociety of Clinical Oncology, 19(16):3635–3648.
Balch, C. M., Gershenwald, J. E., Soong, S. J., Thompson, J. F., Atkins, M. B., Byrd, D. R.,Buzaid, A. C., Cochran, A. J., Coit, D. G., Ding, S., Eggermont, A. M., Flaherty, K. T.,Gimotty, P. A., Kirkwood, J. M., McMasters, K. M., Mihm, M. C., Morton, D. L., Ross,M. I., Sober, A. J., and Sondak, V. K. (2009). Final version of 2009 AJCC melanomastaging and classification. Journal of Clinical Oncology, 27(36):6199–6206.
Barrett, T., Wilhite, S. E., Ledoux, P., Evangelista, C., Kim, I. F., Tomashevsky, M., Marshall,K. A., Phillippy, K. H., Sherman, P. M., Holko, M., Yefanov, A., Lee, H., Zhang, N.,Robertson, C. L., Serova, N., Davis, S., and Soboleva, A. (2013). NCBI GEO: archive forfunctional genomics data sets–update. Nucleic Acids Research, 41(D1):D991–D995.
Becker, S. A. and Palsson, B. O. (2008). Context-specific metabolic networks are consistentwith experiments. PLoS Computational Biology, 4(5).
Bertolotto, C., Lesueur, F., Giuliano, S., Strub, T., de Lichy, M., Bille, K., Dessen, P., D’Hayer,B., Mohamdi, H., Remenieras, A., Maubec, E., de la Fouchardière, A., Molinié, V., Vabres,P., Dalle, S., Poulalhon, N., Martin-Denavit, T., Thomas, L., Andry-Benzaquen, P., Dupin,N., Boitier, F., Rossi, A., Perrot, J.-L., Labeille, B., Robert, C., Escudier, B., Caron, O.,Brugières, L., Saule, S., Gardie, B., Gad, S., Richard, S., Couturier, J., Teh, B. T.,Ghiorzo, P., Pastorino, L., Puig, S., Badenas, C., Olsson, H., Ingvar, C., Rouleau, E.,Lidereau, R., Bahadoran, P., Vielh, P., Corda, E., Blanché, H., Zelenika, D., Galan, P.,Aubin, F., Bachollet, B., Becuwe, C., Berthet, P., Bignon, Y. J., Bonadona, V., Bonafe,J.-L., Bonnet-Dupeyron, M.-N., Cambazard, F., Chevrant-Breton, J., Coupier, I., Dalac,S., Demange, L., D’Incan, M., Dugast, C., Faivre, L., Vincent-Fétita, L., Gauthier-Villars,
V

M., Gilbert, B., Grange, F., Grob, J.-J., Humbert, P., Janin, N., Joly, P., Kerob, D.,Lasset, C., Leroux, D., Levang, J., Limacher, J.-M., Livideanu, C., Longy, M., Lortholary,A., Stoppa-Lyonnet, D., Mansard, S., Mansuy, L., Marrou, K., Matéus, C., Maugard, C.,Meyer, N., Nogues, C., Souteyrand, P., Venat-Bouvet, L., Zattara, H., Chaudru, V., Lenoir,G. M., Lathrop, M., Davidson, I., Avril, M.-F., Demenais, F., Ballotti, R., and Bressac-dePaillerets, B. (2011). A SUMOylation-defective MITF germline mutation predisposes tomelanoma and renal carcinoma. Nature, 480(7375):94–8.
Bhutia, Y. D., Babu, E., Ramachandran, S., Yang, S., Thangaraju, M., and Ganapathy, V.(2016). SLC transporters as a novel class of tumour suppressors: identity, function andmolecular mechanisms. Biochemical Journal, 473(9):1113–1124.
Bintener, T. (2015). Research practical report: Prediction of drug targets using metabolicmodelling. University of Luxembourg.
Blattner, F. R., Plunkett, G. I., Bloch, A. C., Perna, T. N., Burland, V., Riley, M., Collado-vides,J., Glasner, D. J., Rode, K. C., Mayhew, F. G., Gregor, J., Davis, W. N., Kirkpatrick, A. H.,Goeden, A. M., Rose, J. D., Mau, B., Shao, Y., Bloch, C. A., Perna, N. T., Burland, V.,Riley, M., Collado-vides, J., Glasner, J. D., Rode, C. K., Mayhew, G. F., Gregor, J., Davis,N. W., Kirkpatrick, H. A., Goeden, M. A., Rose, D. J., Mau, B., and Shao, Y. (1997).The Complete Genome Sequence of Escherichia coli K-12. Science, 277(5331):1453–1462.
Bordbar, A., Monk, J. M., King, Z. A., and Palsson, B. O. (2014). Constraint-based modelspredict metabolic and associated cellular functions. Nature Reviews Genetics, 15(2):107–120.
Brash, D. E. (2015). UV signature mutations. Photochemistry and Photobiology, 91(1):15–26.
Brimblecombe, R. and Duncan, W. (1975). Cimetidine - a non-thiourea H2-receptor antagonist.Journal of.
Brown, E. G., Wood, L., and Wood, S. (1999). The Medical Dictionary for Regulatory Activities(MedDRA). Drug Safety, 20(2):109–117.
Bruggeman, F. J. and Westerhoff, H. V. (2007). The nature of systems biology. Trends inMicrobiology, 15(1):45–50.
Cassidy, P. B., Honeggar, M., Poerschke, R. L., White, K., Florell, S. R., Andtbacka, R.H. I., Tross, J., Anderson, M., Leachman, S. A., and Moos, P. J. (2015). The roleof thioredoxin reductase 1 in melanoma metabolism and metastasis. Pigment Cell andMelanoma Research, 28(6):685–695.
Chabner, B. a. and Roberts, T. G. (2005). Timeline: Chemotherapy and the war on cancer.Nature reviews. Cancer, 5(1):65–72.
VI
Chapman, P. B., Hauschild, A., Robert, C., Haanen, J. B., Ascierto, P., Larkin, J., Dummer, R.,Garbe, C., Testori, A., Maio, M., Hogg, D., Lorigan, P., Lebbe, C., Jouary, T., Schadendorf,D., Ribas, A., O’Day, S. J., Sosman, J. A., Kirkwood, J. M., Eggermont, A. M. M., Dreno,B., Nolop, K., Li, J., Nelson, B., Hou, J., Lee, R. J., Flaherty, K. T., and McArthur, G. A.(2011). Improved survival with vemurafenib in melanoma with BRAF V600E mutation.The New England journal of medicine, 364(26):2507–16.
Chavali, A. K., Blazier, A. S., Tlaxca, J. L., Jensen, P. A., Pearson, R. D., and Papin, J. A.(2012). Metabolic network analysis predicts efficacy of FDA-approved drugs targeting thecausative agent of a neglected tropical disease. BMC Systems Biology, 6(May 2016):27.
Cleaver, J. E. (1969). Xeroderma pigmentosum: a human disease in which an initial stage ofDNA repair is defective. Proceedings of the National Academy of Sciences of the UnitedStates of America, 63(2):428–435.
Clendening, J. W., Pandyra, A., Boutros, P. C., El Ghamrasni, S., Khosravi, F., Trentin, G. A.,Martirosyan, A., Hakem, A., Hakem, R., Jurisica, I., and Penn, L. Z. (2010). Dysregulationof the mevalonate pathway promotes transformation. Proceedings of the National Academyof Sciences of the United States of America, 107(34):15051–6.
Cui, Y., König, J., Nies, A. T., Pfannschmidt, M., Hergt, M., Franke, W. W., Alt, W., Moll,R., and Keppler, D. (2003). Detection of the human organic anion transporters SLC21A6(OATP2) and SLC21A8 (OATP8) in liver and hepatocellular carcinoma. Laboratory inves-tigation; a journal of technical methods and pathology, 83(4):527–38.
Currie, E., Schulze, A., Zechner, R., Walther, T. C., and Farese, R. V. (2013). Cellular fattyacid metabolism and cancer. Cell Metabolism, 18(2):153–161.
Damsky, W. E., Theodosakis, N., and Bosenberg, M. (2014). Melanoma metastasis: newconcepts and evolving paradigms. Oncogene, 33(19):2413–22.
Davis, A. P., Grondin, C. J., Lennon-Hopkins, K., Saraceni-Richards, C., Sciaky, D., King, B. L.,Wiegers, T. C., and Mattingly, C. J. (2015). The Comparative Toxicogenomics Database’s10th year anniversary: Update 2015. Nucleic Acids Research, 43(D1):D914–D920.
de Gruijl, F. R. (1999). Skin cancer and solar UV radiation. European journal of cancer (Oxford,England : 1990), 35(14):2003–9.
DeVita, V. T. and Chu, E. (2008). A history of cancer chemotherapy. Cancer Research,68(21):8643–8653.
Di, L. (2014). The role of drug metabolizing enzymes in clearance. Expert opinion on drugmetabolism & toxicology, 10(3):379–393.
Drews, J. (2000). Drug discovery: a historical perspective. Science, 287(5460):1960–1964.
VII

Durinck, S., Stawiski, E. W., Pavía-Jiménez, A., Modrusan, Z., Kapur, P., Jaiswal, B. S.,Zhang, N., Toffessi-Tcheuyap, V., Nguyen, T. T., Pahuja, K. B., Chen, Y.-J., Saleem, S.,Chaudhuri, S., Heldens, S., Jackson, M., Peña-Llopis, S., Guillory, J., Toy, K., Ha, C.,Harris, C. J., Holloman, E., Hill, H. M., Stinson, J., Rivers, C. S., Janakiraman, V., Wang,W., Kinch, L. N., Grishin, N. V., Haverty, P. M., Chow, B., Gehring, J. S., Reeder, J.,Pau, G., Wu, T. D., Margulis, V., Lotan, Y., Sagalowsky, A., Pedrosa, I., de Sauvage,F. J., Brugarolas, J., and Seshagiri, S. (2015). Spectrum of diverse genomic alterationsdefine non-clear cell renal carcinoma subtypes. Nature genetics, 47(1):13–21.
Edwards, J. S. and Palsson, B. O. (2000). The Escherichia coli MG1655 in silico metabolicgenotype: its definition, characteristics, and capabilities. Proceedings of the NationalAcademy of Sciences of the United States of America, 97(10):5528–5533.
Eggermont, A. M. M. and Robert, C. (2011). New drugs in melanoma: It’s a whole new world.European Journal of Cancer, 47(14):2150–2157.
El-Gebali, S., Bentz, S., Hediger, M. A., and Anderle, P. (2013). Solute carriers (SLCs) incancer. Molecular Aspects of Medicine, 34(2-3):719–734.
Facchetti, G., Zampieri, M., and Altafini, C. (2012). Predicting and characterizing selectivemultiple drug treatments for metabolic diseases and cancer. BMC Systems Biology, 6.
Falchook, G. S., Lewis, K. D., Infante, J. R., Gordon, M. S., Vogelzang, N. J., DeMarini, D. J.,Sun, P., Moy, C., Szabo, S. A., Roadcap, L. T., Peddareddigari, V. G. R., Lebowitz, P. F.,Le, N. T., Burris, H. A., Messersmith, W. A., O’Dwyer, P. J., Kim, K. B., Flaherty, K.,Bendell, J. C., Gonzalez, R., Kurzrock, R., and Fecher, L. A. (2012). Activity of the oralMEK inhibitor trametinib in patients with advanced melanoma: A phase 1 dose-escalationtrial. The Lancet Oncology, 13(8):782–789.
Feist, A. M. and Palsson, B. O. (2010). The biomass objective function. Current Opinion inMicrobiology, 13(3):344–349.
Fiorillo, M., Lamb, R., Tanowitz, H. B., Mutti, L., Krstic-Demonacos, M., Cappello, A. R.,Martinez-Outschoorn, U. E., Sotgia, F., and Lisanti, M. P. (2016). Repurposing ato-vaquone: Targeting mitochondrial complex III and OXPHOS to eradicate cancer stemcells. Oncotarget, 5(23).
Flavin, R., Peluso, S., Nguyen, P., and Loda, M. (2010). Fatty acid synthase as a potentialtherapeutic target in cancer. Future Oncology, 6(4):551–562.
Fleming, A. (1929). On the antibacterial action of cultures of a penicillium, with specialreference to their use in the isolation of B. influenzae. British journal of experimentalpathology, 10(3):226.
VIII

Folger, O., Jerby, L., Frezza, C., Gottlieb, E., Ruppin, E., and Shlomi, T. (2011). Predictingselective drug targets in cancer through metabolic networks. Molecular systems biology,7(501):501.
Fong, S. S., Burgard, A. P., Herring, C. D., Knight, E. M., Blattner, F. R., Maranas, C. D.,and Palsson, B. O. (2005). In silico design and adaptive evolution of Escherichia coli forproduction of lactic acid. Biotechnology and Bioengineering, 91(5):643–648.
Freed-Pastor, W. A., Mizuno, H., Zhao, X., Langerød, A., Moon, S. H., Rodriguez-Barrueco,R., Barsotti, A., Chicas, A., Li, W., Polotskaia, A., Bissell, M. J., Osborne, T. F., Tian,B., Lowe, S. W., Silva, J. M., Børresen-Dale, A. L., Levine, A. J., Bargonetti, J., andPrives, C. (2012). Mutant p53 disrupts mammary tissue architecture via the mevalonatepathway. Cell, 148(1-2):244–258.
Furth.J. and Kahn.M.C. (1937). The transmission of leukaemia of mice with a single cell. Am.J. Cancer, 31(276):282.
Furuta, E., Okuda, H., Kobayashi, A., and Watabe, K. (2010). Metabolic genes in cancer:Their roles in tumor progression and clinical implications. Biochimica et Biophysica Acta- Reviews on Cancer, 1805(2):141–152.
Gandini, S., Sera, F., Cattaruzza, M. S., Pasquini, P., Abeni, D., Boyle, P., and Melchi, C. F.(2005a). Meta-analysis of risk factors for cutaneous melanoma: I. Common and atypicalnaevi. European Journal of Cancer, 41(1):28–44.
Gandini, S., Sera, F., Cattaruzza, M. S., Pasquini, P., Picconi, O., Boyle, P., and Melchi,C. F. (2005b). Meta-analysis of risk factors for cutaneous melanoma: II. Sun exposure.European Journal of Cancer, 41(1):45–60.
Gandini, S., Sera, F., Cattaruzza, M. S., Pasquini, P., Zanetti, R., Masini, C., Boyle, P., andMelchi, C. F. (2005c). Meta-analysis of risk factors for cutaneous melanoma: III. Familyhistory, actinic damage and phenotypic factors. European Journal of Cancer, 41(14):2040–2059.
Gatto, F., Miess, H., Schulze, A., and Nielsen, J. (2015). Flux balance analysis predicts essentialgenes in clear cell renal cell carcinoma metabolism. Scientific Reports, 5:10738.
Gille, C., Bölling, C., Hoppe, A., Bulik, S., Hoffmann, S., Hübner, K., Karlstädt, A., Gane-shan, R., König, M., Rother, K., Weidlich, M., Behre, J., and Holzhütter, H.-G. (2010).HepatoNet1: a comprehensive metabolic reconstruction of the human hepatocyte for theanalysis of liver physiology. Molecular Systems Biology, 6(411).
Goldstein, A. M., Chan, M., Harland, M., Hayward, N. K., Demenais, F., Bishop, D. T., Azizi,E., Bergman, W., Bianchi-Scarra, G., Bruno, W., Calista, D., Albright, L. A. C., Chaudru,V., Chompret, A., Cuellar, F., Elder, D. E., Ghiorzo, P., Gillanders, E. M., Gruis, N. A.,Hansson, J., Hogg, D., Holland, E. A., Kanetsky, P. A., Kefford, R. F., Landi, M. T.,
IX

Lang, J., Leachman, S. A., MacKie, R. M., Magnusson, V., Mann, G. J., Bishop, J. N.,Palmer, J. M., Puig, S., Puig-Butille, J. A., Stark, M., Tsao, H., Tucker, M. A., Whitaker,L., and Yakobson, E. (2007). Features associated with germline CDKN2A mutations: aGenoMEL study of melanoma-prone families from three continents. Journal of medicalgenetics, 44(2):99–106.
Gonzalez-Perez, A., Perez-Llamas, C., Deu-Pons, J., Tamborero, D., Schroeder, M. P., Jene-Sanz, A., Santos, A., and Lopez-Bigas, N. (2013). IntOGen-mutations identifies cancerdrivers across tumor types. Nature, 10(11):1081–1084.
Griewank, K. G., Scolyer, R. A., Thompson, J. F., Flaherty, K. T., Schadendorf, D., and Murali,R. (2014). Genetic alterations and personalized medicine in melanoma: progress and futureprospects. Journal of the National Cancer Institute, 106(2).
Gudmundsson, S. and Thiele, I. (2010). Computationally efficient flux variability analysis. BMCbioinformatics, 11(1):489.
Hanahan, D. and Weinberg, R. A. (2000). The Hallmarks of Cancer. Cell, 100(1):57–70.
Hanahan, D. and Weinberg, R. A. (2011). Hallmarks of cancer: The next generation. Cell,144(5):646–674.
Hao, T., Ma, H.-W., Zhao, X.-M., and Goryanin, I. (2010). Compartmentalization of theEdinburgh Human Metabolic Network. BMC bioinformatics, 11:393.
Harvie, M. N., Campbell, I. T., Howell, A., and Thatcher, N. (2002). Acceptability and toleranceof a low tyrosine and phenylalanine diet in patients with advanced cancer - A pilot study.Journal of Human Nutrition and Dietetics, 15(3):193–202.
Hauschild, A., Grob, J. J., Demidov, L. V., Jouary, T., Gutzmer, R., Millward, M., Rutkowski,P., Blank, C. U., Miller, W. H., Kaempgen, E., Martín-Algarra, S., Karaszewska, B.,Mauch, C., Chiarion-Sileni, V., Martin, A. M., Swann, S., Haney, P., Mirakhur, B., Guckert,M. E., Goodman, V., and Chapman, P. B. (2012). Dabrafenib in BRAF-mutated metastaticmelanoma: A multicentre, open-label, phase 3 randomised controlled trial. The Lancet,380(9839):358–365.
Hediger, M. A., Romero, M. F., Peng, J. B., Rolfs, A., Takanaga, H., and Bruford, E. A. (2004).The ABCs of solute carriers: Physiological, pathological and therapeutic implications ofhuman membrane transport proteins. Pflugers Archiv European Journal of Physiology,447(5):465–468.
Hersey, P., Watts, R. N., Zhang, X. D., and Hackett, J. (2009). Metabolic approaches totreatment of melanoma. Clinical cancer research : an official journal of the AmericanAssociation for Cancer Research, 15(21):6490–6494.
Hiroaki, K. (2009). Computational Systems Biology. Methods, 541(November):1–19.
X

Ho, J., de Moura, M. B., Lin, Y., Vincent, G., Thorne, S., Duncan, L. M., Hui-Min, L.,Kirkwood, J. M., Becker, D., Van Houten, B., and Moschos, S. J. (2012). Importanceof glycolysis and oxidative phosphorylation in advanced melanoma. Molecular cancer,11(1):76.
Hodi, F. S., O’Day, S. J., McDermott, D. F., Weber, R. W., Sosman, J. A., Haanen, J. B.,Gonzalez, R., Robert, C., Schadendorf, D., Hassel, J. C., Akerley, W., van den Eertwegh,A. J., Lutzky, J., Lorigan, P., Vaubel, J. M., Linette, G. P., Hogg, D., Ottensmeier, C. H.,Lebbé, C., Peschel, C., Quirt, I., Clark, J. I., Wolchok, J. D., Weber, J. S., Tian, J.,Yellin, M. J., Nichol, G. M., Hoos, A., and Urba, W. J. (2010). Improved survival withipilimumab in patients with metastatic melanoma. The new england journal of medicine,363(8):711–23.
Hodis, E., Watson, I. R., Kryukov, G. V., Arold, S. T., Imielinski, M., Theurillat, J. P., Nick-erson, E., Auclair, D., Li, L., Place, C., Dicara, D., Ramos, A. H., Lawrence, M. S.,Cibulskis, K., Sivachenko, A., Voet, D., Saksena, G., Stransky, N., Onofrio, R. C., Winck-ler, W., Ardlie, K., Wagle, N., Wargo, J., Chong, K., Morton, D. L., Stemke-Hale, K.,Chen, G., Noble, M., Meyerson, M., Ladbury, J. E., Davies, M. A., Gershenwald, J. E.,Wagner, S. N., Hoon, D. S. B., Schadendorf, D., Lander, E. S., Gabriel, S. B., Getz, G.,Garraway, L. A., and Chin, L. (2012). A landscape of driver mutations in melanoma. Cell,150(2):251–263.
Hoffmann, R. (2008). A wiki for the life sciences where authorship matters. Nature genetics,40(9):1047–1051.
Hopkins, A. L. and Groom, C. R. (2002). The druggable genome. Nature reviews. Drugdiscovery, 1(9):727–30.
Ideker, T., Galitski, T., and Hood, L. (2001). A N EW A PPROACH TO DECODING L IFE:Systems Biology. Annu. Rev. Genomics Hum. Genet., 2:343–372.
Kabbarah, O., Nogueira, C., Feng, B., Nazarian, R. M., Bosenberg, M., Wu, M., Scott, K. L.,Kwong, L. N., Xiao, Y., Cordon-Cardo, C., Granter, S. R., Ramaswamy, S., Golub, T.,Duncan, L. M., Wagner, S. N., Brennan, C., and Chin, L. (2010). Integrative genomecomparison of primary and metastatic melanomas. PLoS ONE, 5(5).
Kim, P., Cheng, F., Zhao, J., and Zhao, Z. (2016). ccmGDB: a database for cancer cellmetabolism genes. Nucleic acids research, 44(D1):D959–68.
Kim, S., Thiessen, P. A., Bolton, E. E., Chen, J., Fu, G., Gindulyte, A., Han, L., He, J., He,S., Shoemaker, B. A., Wang, J., Yu, B., Zhang, J., and Bryant, S. H. (2015). PubChemSubstance and Compound databases. Nucleic Acids Research, page gkv951.
Kim, T. Y., Kim, H. U., and Lee, S. Y. (2010). Metabolite-centric approaches for the dis-covery of antibacterials using genome-scale metabolic networks. Metabolic Engineering,12(2):105–111.
XI

Kirchmair, J., Göller, A. H., Lang, D., Kunze, J., Testa, B., Wilson, I. D., Glen, R. C., andSchneider, G. (2015). Predicting drug metabolism: experiment and/or computation?Nature Reviews Drug Discovery, 14(6):387–404.
Kitano, H. (2002). Systems biology: a brief overview. Science (New York, N.Y.),295(5560):1662–4.
Kitano, H. and Others (2001). Foundations of systems biology. MIT press Cambridge.
Kolesnikov, N., Hastings, E., Keays, M., Melnichuk, O., Tang, Y. A., Williams, E., Dylag, M.,Kurbatova, N., Brandizi, M., Burdett, T., Megy, K., Pilicheva, E., Rustici, G., Tikhonov,A., Parkinson, H., Petryszak, R., Sarkans, U., and Brazma, A. (2015). ArrayExpressupdate–simplifying data submissions. Nucleic acids research, 43(Database issue):D1113–6.
Krueger, A. S., Munck, C., Dantas, G., Church, G. M., Galagan, J., Lehár, J., and Sommer, M.O. A. (2016). Simulating Serial-Target Antibacterial Drug Synergies Using Flux BalanceAnalysis. Plos One, 11(1):e0147651.
Kuhajda, F. P. (2000). Fatty-acid synthase and human cancer: new perspectives on its role intumor biology. Nutrition (Burbank, Los Angeles County, Calif.), 16(3):202–208.
Kuhn, M., Letunic, I., Jensen, L. J., and Bork, P. (2015). The SIDER database of drugs andside effects. Nucleic acids research, pages 1–5.
Kuhn, M., Szklarczyk, D., Pletscher-frankild, S., Blicher, T. H., Mering, C. V., Jensen, L. J.,Bork, P., Von Mering, C., Jensen, L. J., Bork, P., Mering, C. V., Jensen, L. J., Bork, P., VonMering, C., Jensen, L. J., and Bork, P. (2014). STITCH 4: Integration of protein-chemicalinteractions with user data. Nucleic Acids Research, 42(November 2013):401–407.
Larkin, J., Ascierto, P. A., Dréno, B., Atkinson, V., Liszkay, G., Maio, M., Mandalà, M.,Demidov, L., Stroyakovskiy, D., Thomas, L., de la Cruz-Merino, L., Dutriaux, C., Garbe,C., Sovak, M. A., Chang, I., Choong, N., Hack, S. P., McArthur, G. A., and Ribas, A.(2014). Combined vemurafenib and cobimetinib in BRAF-mutated melanoma. The NewEngland journal of medicine, 371(20):1867–76.
Law, V., Knox, C., Djoumbou, Y., Jewison, T., Guo, A. C., Liu, Y., Maciejewski, A., Arndt,D., Wilson, M., Neveu, V., Tang, A., Gabriel, G., Ly, C., Adamjee, S., Dame, Z. T., Han,B., Zhou, Y., and Wishart, D. S. (2014). DrugBank 4.0: shedding new light on drugmetabolism. Nucleic Acids Research, 42(D1):D1091–D1097.
Lee, E., Schumacher, F., Lewinger, J. P., Neuhausen, S. L., Anton-Culver, H., Horn-Ross, P. L.,Henderson, K. D., Ziogas, A., Van Den Berg, D., Bernstein, L., and Ursin, G. (2011). Theassociation of polymorphisms in hormone metabolism pathway genes, menopausal hormonetherapy, and breast cancer risk: a nested case-control study in the California Teachers Studycohort. Breast cancer research : BCR, 13(2):R37.
XII

Leslie, L. K., Cohen, J. T., Newburger, J. W., Alexander, M. E., Wong, J. B., Sherwin,E. D., Mae, A., Parsons, S. K., and Triedman, J. K. (2013). Expression of the FollicularLymphoma Variant Translocation 1 Gene in Diffuse Large B-Cell Lymphoma CorrelatesWith Subtype and Clinical Outcome. 125(21):2621–2629.
Li, W., Slominski, R., and Slominski, A. T. (2009). High-resolution magic angle spinning nuclearmagnetic resonance analysis of metabolic changes in melanoma cells after induction ofmelanogenesis. Analytical Biochemistry, 386(2):282–284.
Liu, G., Li, D. Z., Jiang, C. S., and Wang, W. (2014). Transduction motif analysis of gastriccancer based on a human signaling network. Brazilian Journal of Medical and BiologicalResearch, 47(5):369–375.
López-lázaro, M. (2015). Selective amino acid restriction therapy ( SAART ): a non- pharma-cological strategy against all types of cancer cells. 2(10).
Lund, L. P. and Timmins, G. S. (2007). Melanoma, long wavelength ultraviolet and sunscreens:Controversies and potential resolutions. Pharmacology and Therapeutics, 114(2):198–207.
Maglott, D. (2004). Entrez Gene: gene-centered information at NCBI. Nucleic Acids Research,33(Database issue):D54–D58.
Mahadevan, R. and Schilling, C. H. (2003). The effects of alternate optimal solutions inconstraint-based genome-scale metabolic models. Metabolic Engineering, 5(4):264–276.
Mardinoglu, A., Agren, R., Kampf, C., Asplund, A., Uhlen, M., and Nielsen, J. (2014). Genome-scale metabolic modelling of hepatocytes reveals serine deficiency in patients with non-alcoholic fatty liver disease. Nature communications, 5(May 2013):3083.
Matichard, E., Verpillat, P., Meziani, R., Gérard, B., Descamps, V., Legroux, E., Burnouf, M.,Bertrand, G., Bouscarat, F., Archimbaud, a., Picard, C., Ollivaud, L., Basset-Seguin, N.,Kerob, D., Lanternier, G., Lebbe, C., Crickx, B., Grandchamp, B., and Soufir, N. (2004).Melanocortin 1 receptor (MC1R) gene variants may increase the risk of melanoma inFrance independently of clinical risk factors and UV exposure. Journal of medical genetics,41(2):e13.
Mayer, R. J., Van Cutsem, E., Falcone, A., Yoshino, T., Garcia-Carbonero, R., Mizunuma,N., Yamazaki, K., Shimada, Y., Tabernero, J., Komatsu, Y., Sobrero, A., Boucher, E.,Peeters, M., Tran, B., Lenz, H. J., Zaniboni, A., Hochster, H., Cleary, J. M., Prenen, H.,Benedetti, F., Mizuguchi, H., Makris, L., Ito, M., Ohtsu, A., and Group, R. S. (2015).Randomized trial of TAS-102 for refractory metastatic colorectal cancer. N Engl J Med,372(20):1909–1919.
McCall, M. N., Bolstad, B. M., and Irizarry, R. A. (2010). Frozen robust multiarray analysis(fRMA). Biostatistics, 11(2):242–253.
XIII

McCall, M. N., Jaffee, H. A., Zelisko, S. J., Sinha, N., Hooiveld, G., Irizarry, R. A., and Zilliox,M. J. (2014). The Gene Expression Barcode 3.0: improved data processing and miningtools. Nucleic Acids Research, 42(D1):D938–D943.
McCloskey, D., Palsson, B. Ø., and Feist, A. M. (2013). Basic and applied uses of genome-scale metabolic network reconstructions of Escherichia coli. Molecular systems biology,9(1):661.
Monk, J., Nogales, J., and Palsson, B. O. (2014). Optimizing genome-scale network recon-structions. Nature Biotechnology, 32(5):447–452.
Nakajima, E. C. and Van Houten, B. (2013). Metabolic symbiosis in cancer: Refocusing theWarburg lens. Molecular Carcinogenesis, 52(5):329–337.
National Cancer Institute (2016). Targeted cancer therapies.
Natsch, S., Hekster, Y. A., De Jong, R., Heerdink, E. R., Herings, R. M. C., and Van Der Meer,J. W. M. (1998). Application of the ATC/DDD methodology to monitor antibiotic druguse. European Journal of Clinical Microbiology and Infectious Diseases, 17(1):20–24.
Oberhardt, M. a., Yizhak, K., and Ruppin, E. (2013). Metabolically re-modeling the drugpipeline. Current Opinion in Pharmacology, 13(5):778–85.
Oliveros, J. C. (2007). Venny. An interactive tool for comparing lists with Venn’s diagrams.
Orth, J. D., Thiele, I., and Palsson, B. Ø. (2010). What is flux balance analysis? NatBiotechnol, 28(3):245–248.
Pacheco, M. P., John, E., Kaoma, T., Heinäniemi, M., Nicot, N., Vallar, L., Bueb, J.-L.,Sinkkonen, L., and Sauter, T. (2015). Integrated metabolic modelling reveals cell-typespecific epigenetic control points of the macrophage metabolic network. BMC Genomics,16(1):809.
Pacheco, M. P., Pfau, T., and Sauter, T. (2016). Benchmarking Procedures for High-Throughput Context Specific Reconstruction Algorithms. Frontiers in Physiology Front.Physiol, 6(6):1–19.
Park, J. H., Lee, S. Y., Kim, T. Y., and Kim, H. U. (2008). Application of systems biology forbioprocess development. Trends in Biotechnology, 26(8):404–412.
Piñero, J., Queralt-Rosinach, N., Bravo, À., Deu-Pons, J., Bauer-Mehren, Anna Baron, M.,Sanz, F., Furlong, and I., L. (2015). DisGeNET : a discovery platform for the dynamicalexploration of human diseases and their genes. pages 1–17.
Pletscher-Frankild, S., Palleja, A., Tsafou, K., Binder, J. X., and Jensen, L. J. (2015). DIS-EASES: Text mining and data integration of disease-gene associations. Methods, 74:83–89.
XIV

Price, N. D., Reed, J. L., and Palsson, B. Ø. (2004). Genome-scale models of microbial cells:evaluating the consequences of constraints. Nature Reviews Microbiology, 2(11):886–897.
Rahman, L., Voeller, D., Rahman, M., Lipkowitz, S., Allegra, C., Barrett, J. C., Kaye, F. J., andZajac-Kaye, M. (2004). Thymidylate synthase as an oncogene? Cancer Cell, 5(4):301–302.
Rahman, M., Jackson, L. K., Johnson, W. E., Li, D. Y., Bild, A. H., and Piccolo, S. R. (2015).Alternative preprocessing of RNA-Sequencing data in the Cancer Genome Atlas leads toimproved analysis results. Bioinformatics, 31(22):3666–3672.
Raimondi, S., Sera, F., Gandini, S., Iodice, S., Caini, S., Maisonneuve, P., and Fargnoli,M. C. (2008). MC1R variants, melanoma and red hair color phenotype: A meta-analysis.International Journal of Cancer, 122(12):2753–2760.
Rajpar, S. and Marsden, J. (2009). ABC of skin cancer, volume 94. John Wiley & Sons.
Rappaport, N., Twik, M., Nativ, N., Stelzer, G., Bahir, I., Stein, T. I., Safran, M., and Lancet,D. (2014). MalaCards: A Comprehensive automatically-mined Database of human diseases.Current Protocols in Bioinformatics, 2014(September):1.24.1–1.24.19.
Reed, J. L. and Palsson, B. (2004). Genome-scale in silico models of E. coli have multipleequivalent phenotypic states: Assessment of correlated reaction subsets that comprisenetwork states. Genome Research, 14(9):1797–1805.
Robles-Espinoza, C. D., Harland, M., Ramsay, A. J., Aoude, L. G., Quesada, V., Ding, Z.,Pooley, K. A., Pritchard, A. L., Tiffen, J. C., Petljak, M., Palmer, J. M., Symmons, J.,Johansson, P., Stark, M. S., Gartside, M. G., Snowden, H., Montgomery, G. W., Martin,N. G., Liu, J. Z., Choi, J., Makowski, M., Brown, K. M., Dunning, A. M., Keane, T. M.,López-Otín, C., Gruis, N. A., Hayward, N. K., Bishop, D. T., Newton-Bishop, J. A., andAdams, D. J. (2014). POT1 loss-of-function variants predispose to familial melanoma.Nature genetics, 46(5):478–81.
Rolfsson, O., Palsson, B. Ø., and Thiele, I. (2011). The human metabolic reconstruction Recon1 directs hypotheses of novel human metabolic functions. BMC systems biology, 5(1):155.
Schadendorf, D., Fisher, D. E., Garbe, C., Gershenwald, J. E., Grob, J.-J., Halpern, A., Herlyn,M., Marchetti, M. A., McArthur, G., Ribas, A., Roesch, A., and Hauschild, A. (2015).Melanoma. Nature Reviews Disease Primers, (April):15003.
Schadendorf, D. and Hauschild, A. (2014). Melanoma in 2013: MelanomaâĂŤthe run of successcontinues. Nature Reviews Clinical Oncology, 11(2):75–76.
Schellenberger, J., Que, R., Fleming, R. M. T., Thiele, I., Orth, J. D., Feist, A. M., Zielinski,D. C., Bordbar, A., Lewis, N. E., Rahmanian, S., and Others (2011). Quantitative pre-diction of cellular metabolism with constraint-based models: the COBRA Toolbox v2. 0.Nature protocols, 6(9):1290–1307.
XV

Schweitzer, B. I., Dicker, A. P., and Bertino, J. R. (1990). Dihydrofolate reductase as atherapeutic target. FASEB journal : official publication of the Federation of AmericanSocieties for Experimental Biology, 4(8):2441–52.
Schwikowski, B., Uetz, P., and Fields, S. (2000). A network of protein âĂŞ protein interactionsin yeast. Nature Biotechnology, pages 1257–1261.
Shaked, I., Oberhardt, M. A., Atias, N., Sharan, R., and Ruppin, E. (2016). Metabolic NetworkPrediction of Drug Side Effects. Cell Systems, 2(3):209–213.
Sheen, J. H., Zoncu, R., Kim, D., and Sabatini, D. M. (2011). Defective Regulation ofAutophagy upon Leucine Deprivation Reveals a Targetable Liability of Human MelanomaCells In Vitro and In Vivo. Cancer Cell, 19(5):613–628.
Shlomi, T., Cabili, M. N., Herrgard, M. J., Palsson, B. O., and Ruppin, E. (2008). Network-based prediction of human tissue-specific metabolism. Nature Biotechnology, 26(9):1003–1010.
Shtivelman, E., Davies, M. Q. a., Hwu, P., Yang, J., Lotem, M., Oren, M., Flaherty, K. T.,and Fisher, D. E. (2014). Pathways and therapeutic targets in melanoma. Oncotarget,5(7):1701–52.
Swainston, N., Smallbone, K., Hefzi, H., Dobson, P., Brewer, J., Hanscho, M., Zielinski, D.,Ang, K., Gardiner, N., Gutierrez, J., Kyriakopoulos, S., Lakshmanan, M., Li, S., Liu, JK, Martinez, V., Orellana, C., Quek, L., Thomas, A., Zanghellini, J., Borth, N., Lee, D.,Nielsen, L., Kell, D., Lewis, N., and Mendes, P. (2016). Recon 2.2: from reconstructionto model of human metabolism. Metabolomics.
The UniProt Consortium (2015). UniProt: a hub for protein information. Nucleic Acids Re-search, 43(D1):D204–D212.
Thiele, I., Fleming, R. M. T., Bordbar, A., Schellenberger, J., and Palsson, B. . (2010). Func-tional characterization of alternate optimal solutions of escherichia coli’s transcriptionaland translational machinery. Biophysical Journal, 98(10):2072–2081.
Thiele, I. and Palsson, B. Ø. (2010). A protocol for generating a high-quality genome-scalemetabolic reconstruction. Nature protocols, 5(1):93–121.
Thiele, I., Swainston, N., Fleming, R. M. T., Hoppe, A., Sahoo, S., Aurich, M. K., Haraldsdottir,H., Mo, M. L., Rolfsson, O., Stobbe, M. D., Thorleifsson, S. G., Agren, R., Bölling, C.,Bordel, S., Chavali, A. K., Dobson, P., Dunn, W. B., Endler, L., Hala, D., Hucka, M.,Hull, D., Jameson, D., Jamshidi, N., Jonsson, J. J., Juty, N., Keating, S., Nookaew, I.,Le Novère, N., Malys, N., Mazein, A., Papin, J. A., Price, N. D., Selkov, E., Sigurdsson,M. I., Simeonidis, E., Sonnenschein, N., Smallbone, K., Sorokin, A., van Beek, J. H. G. M.,Weichart, D., Goryanin, I., Nielsen, J., Westerhoff, H. V., Kell, D. B., Mendes, P., and
XVI
Palsson, B. Ø. (2013). A community-driven global reconstruction of human metabolism.Nature Biotechnology, 31(5):419–425.
Thurnher, M., Nussbaumer, O., and Gruenbacher, G. (2012). Novel aspects of mevalonatepathway inhibitors as antitumor agents. Clinical Cancer Research, 18(13):3524–3531.
Trewavas, A. (2006). A Brief History of Systems Biology. The Plant cell, 18(10):2420–2430.
Tsao, H., Chin, L., Garraway, L. A., and Fisher, D. E. (2012). Melanoma: From mutations tomedicine. Genes and Development, 26(11):1131–1155.
Upton, J., Janeka, I., and Ferraro, N. (2014). The whole is more than the sum of its parts:aristotle, metaphysical. Journal of Craniofacial Surgery, 25(1):59–63.
Vander Heiden, M., Cantley, L., and Thompson, C. (2009). Understanding the Warburg effect:The metabolic Requiremetns of cell proliferation. Science, 324(5930):1029–1033.
Vazquez, F., Lim, J. H., Chim, H., Bhalla, K., Girnun, G., Pierce, K., Clish, C. B., Granter,S. R., Widlund, H. R., Spiegelman, B. M., and Puigserver, P. (2013). PGC1a ExpressionDefines a Subset of Human Melanoma Tumors with Increased Mitochondrial Capacity andResistance to Oxidative Stress. Cancer Cell, 23(3):287–301.
Vlassis, N., Pacheco, M. P., and Sauter, T. (2014). Fast reconstruction of compact context-specific metabolic network models. PLoS computational biology, 10(1):e1003424.
Wang, Q., Beaumont, K. A., Otte, N. J., Font, J., Bailey, C. G., Van Geldermalsen, M., Sharp,D. M., Tiffen, J. C., Ryan, R. M., Jormakka, M., Haass, N. K., Rasko, J. E. J., and Holst,J. (2014). Targeting glutamine transport to suppress melanoma cell growth. InternationalJournal of Cancer, 135(5):1060–1071.
Wang, Y., Eddy, J. a., and Price, N. D. (2012). Reconstruction of genome-scale metabolicmodels for 126 human tissues using mCADRE. BMC systems biology, 6:153.
Weinstein, J. N., Collisson, E. A., Mills, G. B., Shaw, K. R. M., Ozenberger, B. A., Ellrott,K., Shmulevich, I., Sander, C., and Stuart, J. M. (2013). The Cancer Genome AtlasPan-Cancer analysis project. Nature genetics, 45(10):1113–1120.
Wiesner, T., Obenauf, A. C., Murali, R., Fried, I., Griewank, K. G., Ulz, P., Windpassinger,C., Wackernagel, W., Loy, S., Wolf, I., Viale, A., Lash, A. E., Pirun, M., Socci, N. D.,Rütten, A., Palmedo, G., Abramson, D., Offit, K., Ott, A., Becker, J. C., Cerroni, L.,Kutzner, H., Bastian, B. C., and Speicher, M. R. (2011). Germline mutations in BAP1pre. 43(10):1018–1022.
Xing, M., Tokumaru, Y., Wu, G., Westra, W. B., Ladenson, P. W., and Sidransky, D. (2003).Hypermethylation of the Pendred syndrome gene SLC26A4 is an early event in thyroidtumorigenesis. Cancer Research, 63(9):2312–2315.
XVII

Xu, X., Page, J. L., Surtees, J. A., Liu, H., Lagedrost, S., Lu, Y., Bronson, R., Alani, E.,Nikitin, A. Y., and Weiss, R. S. (2008). Broad overexpression of ribonucleotide reductasegenes in mice specifically induces lung neoplasms. Cancer Research, 68(8):2652–2660.
Yates, A., Akanni, W., Amode, M. R., Barrell, D., Billis, K., Carvalho-Silva, D., Cummins,C., Clapham, P., Fitzgerald, S., Gil, L., Girón, C. G., Gordon, L., Hourlier, T., Hunt,S. E., Janacek, S. H., Johnson, N., Juettemann, T., Keenan, S., Lavidas, I., Martin, F. J.,Maurel, T., McLaren, W., Murphy, D. N., Nag, R., Nuhn, M., Parker, A., Patricio, M.,Pignatelli, M., Rahtz, M., Riat, H. S., Sheppard, D., Taylor, K., Thormann, A., Vullo,A., Wilder, S. P., Zadissa, A., Birney, E., Harrow, J., Muffato, M., Perry, E., Ruffier, M.,Spudich, G., Trevanion, S. J., Cunningham, F., Aken, B. L., Zerbino, D. R., and Flicek,P. (2016). Ensembl 2016. Nucleic acids research, 44(D1):D710–D716.
Yizhak, K., Chaneton, B., Gottlieb, E., and Ruppin, E. (2015). Modeling cancer metabolismon a genome scale. Molecular Systems Biology, 11(6):817–817.
Yoon, J.-K., Frankel, A. E., Feun, L. G., Ekmekcioglu, S., and Kim, K. B. (2013). Argi-nine deprivation therapy for malignant melanoma. Clinical pharmacology : advances andapplications, 5:11–9.
Yoshii, Y., Furukawa, T., Oyama, N., Hasegawa, Y., Kiyono, Y., Nishii, R., Waki, A., Tsuji,A. B., Sogawa, C., Wakizaka, H., Fukumura, T., Yoshii, H., Fujibayashi, Y., Lewis, J. S.,and Saga, T. (2013). Fatty Acid Synthase Is a Key Target in Multiple Essential Tu-mor Functions of Prostate Cancer: Uptake of Radiolabeled Acetate as a Predictor of theTargeted Therapy Outcome. PLoS ONE, 8(5).
Zaidi, M. R., Day, C.-P., and Merlino, G. (2008). From UVs to metastases: modelingmelanoma initiation and progression in the mouse. The Journal of investigative dermatol-ogy, 128(10):2381–2391.
Zur, H., Ruppin, E., and Shlomi, T. (2010). iMAT: An integrative metabolic analysis tool.Bioinformatics, 26(24):3140–3142.
XVIII

5 Supplementary data
5.1 Supplementary Figures
Figure 5.1: Distribution of the microarray expression data before and after fRMA nor-malizationOn the left, the distribution of the microarray expression data is shown before fRMA normaliza-tion for all 100 arrays. On the right, the distribution of the microarray expression data is shownafter fRMA normalization for all 100 arrays. After normalization, the data was distributedevenly and showed little variance, the medians are well aligned.
I

Figure 5.2: Principal component analysis of the GSE46517 datasetBoth upper figures and the lower left figures show the data distribution along the first, secondand third principal component. Only the first component seems to clearly distinguish betweenthe different conditions: green (healthy skin), black (nevi), blue (normal epithelial melanocytes),pink (primary melanoma) and red (metastatic melanoma). The lower right figure shows howmuch each component contributes to the standard deviation along the components. The firstprincipal component accounts for more than 7% of the standard deviation.
II

Figure 5.3: Clustergram based on the Jaccard index of 318 models (MPA), recon-structed from RNA-sequencing data318 context-specific models (159 healthy and 159 cancer models) were reconstructed fromRNA-sequencing data and clustered according to their similarity score (Jaccard index). Someclusters grouping tissue-specific models can be observed such as the KICH, KIRC and KIRPcluster representing kidney tissue as well as COAD, READ and STAD representing tissue fromthe gastrointestinal tract.
III

Figure 5.4: 18 clustergrams based on the Jaccard index of 318 models (MPA), recon-structed from RNA-sequencing data, regrouped by tissue typeFor an explanation to the abbreviations please refer to the tabel on page IX.
IV

Figure 5.5: Clustergram of 36 models (MPC), reconstructed from RNA-sequencingdata36 context-specific models (18 healthy and 18 cancer models) were reconstructed from RNA-sequencing data and clustered according to their similarity score (Jaccard index). For an expla-nation to the abbreviations please refer to the tabel on page IX.
V

Figure 5.6: Clustergram of 5 models (MPC), reconstructed from microarray data5 context-specific models were reconstructed from microarray data via FASTCORMICS andclustered according to their similarity score (Jaccard index). Healthy skin (S), nevi (N), normalepithelial melanocytes (NEM), primary melanoma (PM) and metastatic melanoma (MM).
VI

Figure 5.7: Number of active genes in each pathway (TCGA)This figure shows the relation of active genes in each condition to the number of active genesin the Recon 2 model. Note that the bars are not stacked but on top of each other. It can beobserved that the healthy models have more active genes than cancer in general.
VII

Figure 5.8: Number of active genes in each pathway (GSE46517)This figure shows the relation of active genes in each condition to the number of active genesin the Recon 2 model. Note that the bars are not stacked but on top of each other. It can beobserved that the healthy models have more active genes than cancer in general.
VIII

Figure 5.9: Fractions of active reactions for healthy vs. cancer (TCGA data)The fraction of active reaction for healthy was plotted against the fraction of active reaction forcancer. Each point corresponds to one pathway and is numbered according to Table 5.3. Pointin the upper left are up regulated in cancer and down regulated in healthy whereas pathwaysin the lower right are up regulated in healthy and down regulated in cancer.
IX

Figure 5.10: Fractions of active reactions for healthy vs. healthy (GSE46517)The fraction of active reaction for healthy was plotted against the fraction of active reaction forcancer. Each point corresponds to one pathway and is numbered according to Table 5.3. Pointin the upper left are up regulated in cancer and down regulated in healthy whereas pathwaysin the lower right are up regulated in healthy and down regulated in cancer.
X

Figure 5.11: Median pathway distribution for the TCGA datasetThe box plots show the distribution of all the fractions of active reactions for each pathway(sorted by the median). Green dots and red crosses represent the median fraction of activereactions for the given pathway for healthy and cancer respectively.
XI

Figure 5.12: Median pathway distribution for the GSE46517 datasetThe box plots show the distribution of all the fractions of active reactions for each pathway(sorted by the median). Green dots and red crosses represent the median fraction of activereactions for the given pathway for healthy and cancer respectively.
XII

5.2 Supplementary Tables
Table 5.1: Overview of the MPC models from the TCGA datasetThis tables provides an overview on the number of genes, reactions, metabolites and pathwaysfound for each MPC model in the TCGA dataset as well as the number of arrays used for themodel reconstruction. Overall, the cancer models present fewer genes, reactions metabolitesand pathways.
Name Unique Genes Reactions Metabolites Pathways ArraysState healthy cancer healthy cancer healthy cancer healthy cancer
BLCA 972 907 1576 1551 1323 1294 73 71 10
BRCA 929 913 1417 1451 1203 1236 73 73 10
CESC 927 874 1426 1388 1218 1208 74 72 3
COAD 1074 997 1972 1590 1581 1312 78 75 10
GBM 1009 937 1598 1566 1331 1306 73 74 5
HNSC 915 884 1648 1450 1367 1268 74 73 10
KICH 1058 960 1772 1549 1463 1299 77 74 10
KIRC 1070 1034 1857 1728 1503 1419 78 76 10
KIRP 1095 959 1914 1637 1527 1374 78 75 10
LIHC 1096 922 2118 1581 1667 1334 79 76 10
LUAD 940 900 1767 1550 1452 1303 78 74 10
LUSC 979 956 1766 1651 1455 1378 77 73 10
PRAD 943 972 1720 1695 1420 1426 75 75 10
READ 1046 958 1894 1742 1547 1411 78 76 10
SKCM 993 863 1745 1415 1440 1227 77 72 1
STAD 882 869 1625 1445 1369 1254 74 70 10
THCA 1043 912 1752 1485 1442 1270 75 69 10
UCEC 953 945 1565 1638 1309 1359 74 75 10
XIII

Table 5.2: Number of genes and exclusive genes found for the TCGA datasetThe total number of genes in healthy and cancer as well as the number of genes exclusive tothem are given in this table for each tissue. In general, cancer models have fewer genes thanhealthy models.
Name All genesin healthy
Genes exclusivein healthy
All genesin cancer
Genes exclusiveto cancer
BLCA 972 134 907 71
BRCA 929 105 913 87
CESC 927 135 874 85
COAD 1074 175 997 91
GBM 1009 146 937 66
HNSC 915 86 884 58
KICH 1058 138 960 37
KIRC 1070 85 1034 47
KIRP 1095 193 959 54
LIHC 1096 240 922 58
LUAD 940 123 900 81
LUSC 979 149 956 123
PRAD 943 48 972 77
READ 1046 148 958 60
SKCM 993 160 863 28
STAD 882 107 869 87
THCA 1043 172 912 38
UCEC 953 89 945 83
Table 5.3: Difference of the fractions of active reactions between healthy and cancerin each pathway for both datasetsThis table shows all the differences of the fraction of active reaction between healthy andcancer. Negative number signify the dow nregulation of the given pathway in cancer and positivenumbers signify up-regulation in cancer. There are 21 pathways which are downregulated in allconditions in cancer.
Number Pathway TCGA GSE46517median PM MM
1 Alanine and aspartate metabolism -0.07 -0.21 -0.14 -0.29
2 Aminosugar metabolism -0.02 0.07 0.00 0.14
3 Androgen and estrogen synthesis andmetabolism
0.00 0.00 0.00 0.00
XIV

4 Arachidonic acid metabolism 0.00 0.00 0.00 0.00
5 Arginine and Proline Metabolism -0.08 -0.18 -0.21 -0.16
6 Bile acid synthesis -0.01 -0.33 -0.33 -0.33
7 Biotin metabolism -1.00 0.00 0.00 0.00
8 Blood group synthesis -0.09 0.00 0.00 0.00
9 Butanoate metabolism 0.00 0.39 0.00 0.78
10 C5-branched dibasic acid metabolism -0.50 0.00 0.00 0.00
11 Cholesterol metabolism 0.00 -0.31 -0.31 -0.31
12 Chondroitin sulfate degradation 0.00 0.00 0.00 0.00
13 Citric acid cycle -0.11 -0.04 -0.04 -0.04
14 CoA catabolism 0.00 0.00 0.00 0.00
15 CoA synthesis 0.00 0.00 0.00 0.00
16 Cysteine Metabolism 0.00 0.00 0.00 0.00
17 Cytochrome metabolism 0.00 0.00 0.00 0.00
18 D-alanine metabolism 0.00 0.00 0.00 0.00
19 Eicosanoid metabolism 0.00 -0.28 -0.28 -0.28
20 Fatty acid oxidation -0.10 0.04 0.04 0.04
21 Fatty acid synthesis 0.00 -0.43 -0.43 -0.43
22 Folate metabolism 0.17 0.00 0.00 0.00
23 Fructose and mannose metabolism 0.00 0.12 0.07 0.17
24 Galactose metabolism 0.00 -0.04 0.07 -0.14
25 Glutamate metabolism -0.08 -0.30 -0.30 -0.30
26 Glutathione metabolism 0.00 -0.08 0.00 -0.16
27 Glycerophospholipid metabolism -0.02 -0.17 -0.17 -0.17
28 Glycine, serine, alanine and threoninemetabolism
-0.02 0.09 0.00 0.17
29 Glycolysis/gluconeogenesis -0.02 -0.08 -0.04 -0.13
30 Glycosphingolipid metabolism 0.00 0.00 0.00 0.00
31 Glyoxylate and dicarboxylatemetabolism
0.65 -0.04 -0.04 -0.04
32 Heme degradation 0.00 0.00 0.00 0.00
33 Heme synthesis -0.13 0.00 0.00 0.00
34 Heparan sulfate degradation 0.00 0.00 0.00 0.00
35 Histidine metabolism -0.23 -0.73 -0.73 -0.73
36 Hyaluronan metabolism 0.00 0.50 0.00 1.00
37 Inositol phosphate metabolism -0.01 -0.51 -0.50 -0.52
38 Keratan sulfate degradation 0.00 0.00 0.00 0.00
39 Keratan sulfate synthesis 0.00 0.00 0.00 0.00
40 Limonene and pinene degradation 0.00 0.00 0.00 0.00
XV

41 Lysine metabolism 0.00 0.00 0.00 0.00
42 Methionine and cysteine metabolism -0.04 -0.13 -0.13 -0.13
43 Miscellaneous -0.09 0.03 0.06 0.00
44 N-glycan degradation 0.00 0.00 0.00 0.00
45 N-glycan synthesis 0.00 0.00 0.00 0.00
46 NAD metabolism -0.10 0.14 0.24 0.05
47 Nucleotide interconversion -0.36 -0.07 -0.06 -0.08
48 Nucleotide salvage pathway 0.00 0.00 0.00 0.00
49 O-glycan synthesis 0.04 0.00 0.00 0.00
50 Oxidative phosphorylation 0.00 -0.02 -0.02 -0.02
51 Pentose phosphate pathway 0.00 0.05 0.09 0.00
52 Phenylalanine metabolism -0.80 -0.90 -0.90 -0.90
53 Phosphatidylinositol phosphatemetabolism
-0.02 0.00 0.00 0.00
54 Propanoate metabolism -0.09 -0.16 0.09 -0.41
55 Purine catabolism 0.00 -0.08 -0.08 -0.08
56 Purine synthesis 0.00 0.00 0.00 0.00
57 Pyrimidine catabolism -0.08 -0.36 -0.36 -0.36
58 Pyrimidine synthesis 0.00 0.00 0.00 0.00
59 Pyruvate metabolism 0.00 0.03 0.03 0.03
60 ROS detoxification -0.25 0.00 0.00 0.00
61 Sphingolipid metabolism -0.16 -0.08 0.02 -0.18
62 Squalene and cholesterol synthesis 0.00 -0.14 -0.14 -0.14
63 Starch and sucrose metabolism -0.11 -0.26 -0.22 -0.30
64 Steroid metabolism -0.10 -0.10 -0.10 -0.10
65 Taurine and hypotaurine metabolism -0.17 0.00 0.00 0.00
66 Tetrahydrobiopterin metabolism 0.00 0.00 0.00 0.00
67 Thiamine metabolism 0.00 0.00 0.00 0.00
68 Transport, endoplasmic reticular -0.20 0.05 0.00 0.10
69 Transport, extracellular -0.02 -0.06 -0.07 -0.05
70 Transport, golgi apparatus 0.00 0.00 0.00 0.00
71 Transport, lysosomal 0.00 0.48 0.00 0.96
72 Transport, mitochondrial 0.00 0.00 0.03 -0.03
73 Transport, peroxisomal -0.20 0.00 0.00 0.00
74 Triacylglycerol synthesis -0.15 -0.06 0.00 -0.12
75 Tryptophan metabolism -0.02 -0.23 -0.21 -0.24
76 Tyrosine metabolism -0.20 -0.17 -0.15 -0.20
77 Ubiquinone synthesis 0.00 0.00 0.00 0.00
78 Unassigned -0.13 -0.27 -0.27 -0.27
XVI

79 Urea cycle -0.19 -0.21 -0.24 -0.19
80 Valine, leucine, and isoleucinemetabolism
-0.11 -0.14 -0.14 -0.14
81 Vitamin A metabolism 0.00 0.00 0.00 0.00
82 Vitamin B2 metabolism 0.00 0.00 0.00 0.00
83 Vitamin B6 metabolism 0.25 0.00 0.00 0.00
84 Vitamin C metabolism 0.00 0.00 0.00 0.00
85 Vitamin D metabolism 0.00 0.00 0.00 0.00
86 beta-Alanine metabolism 0.00 -0.44 -0.44 -0.44
Table 5.5: Number of gene-disease associations found in different databases and p-values for the gene-disease associations from the hypergeometric test
Dataset Genes Database p-valuesccmGDB DisGeNET ccmGDB DisGeNET
Recon 2 1733 224 392 / /
TCGA, case 2 6 2 2 0.0316 0.1333
TCGA, case 3 44 8 14 0.1044 0.0530
GSE46517, case 2 10 1 3 0.3777 0.1708
GSE46517, case 3 64 11 20 0.1132 0.0371
XVII
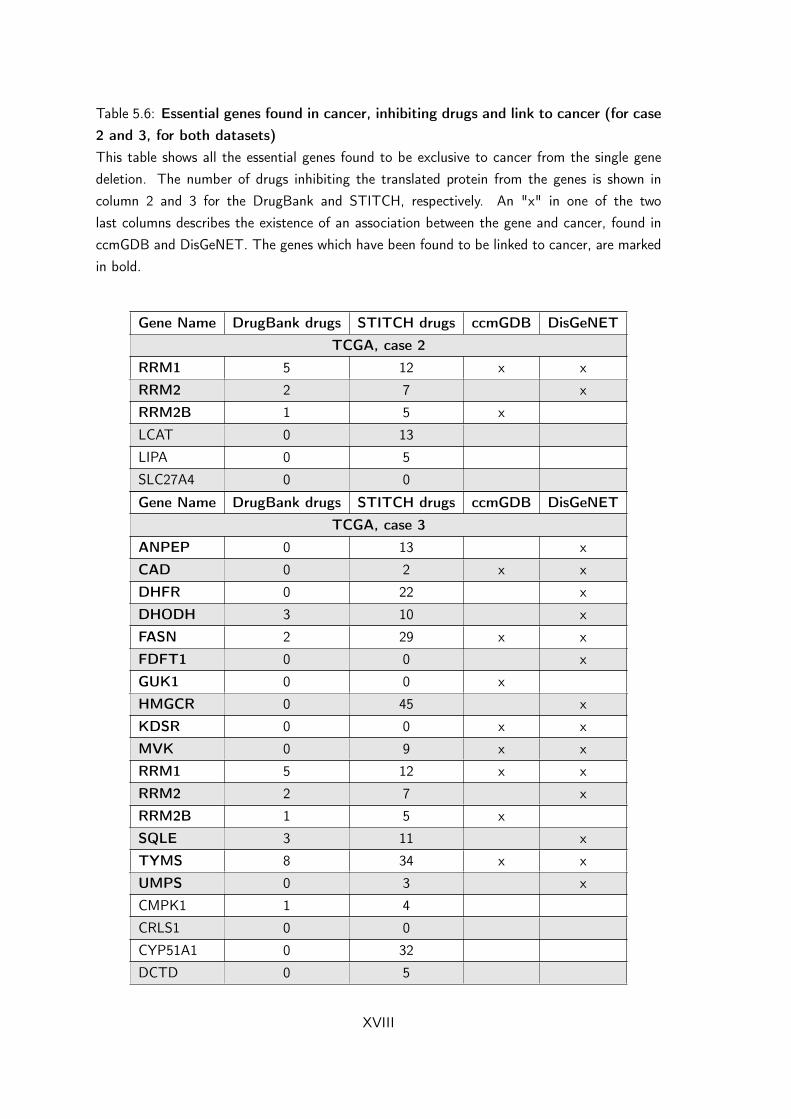
Table 5.6: Essential genes found in cancer, inhibiting drugs and link to cancer (for case2 and 3, for both datasets)This table shows all the essential genes found to be exclusive to cancer from the single genedeletion. The number of drugs inhibiting the translated protein from the genes is shown incolumn 2 and 3 for the DrugBank and STITCH, respectively. An "x" in one of the twolast columns describes the existence of an association between the gene and cancer, found inccmGDB and DisGeNET. The genes which have been found to be linked to cancer, are markedin bold.
Gene Name DrugBank drugs STITCH drugs ccmGDB DisGeNETTCGA, case 2
RRM1 5 12 x x
RRM2 2 7 x
RRM2B 1 5 x
LCAT 0 13
LIPA 0 5
SLC27A4 0 0
Gene Name DrugBank drugs STITCH drugs ccmGDB DisGeNETTCGA, case 3
ANPEP 0 13 x
CAD 0 2 x x
DHFR 0 22 x
DHODH 3 10 x
FASN 2 29 x x
FDFT1 0 0 x
GUK1 0 0 x
HMGCR 0 45 x
KDSR 0 0 x x
MVK 0 9 x x
RRM1 5 12 x x
RRM2 2 7 x
RRM2B 1 5 x
SQLE 3 11 x
TYMS 8 34 x x
UMPS 0 3 x
CMPK1 1 4
CRLS1 0 0
CYP51A1 0 32
DCTD 0 5
XVIII

DHCR7 0 0
EBP 0 6
HSD17B4 0 0
LCAT 0 13
LIPA 0 5
LSS 0 2
MSMO1 0 0
MVD 0 4
NSDHL 0 0
PGS1 0 0
PMVK 0 0
PTPMT1 0 0
RPIA 0 7
SGMS1 0 0
SLC17A1 0 0
SLC27A4 0 0
SLC2A13 0 0
SLC37A4 0 0
SLC38A4 0 0
SLC43A1 0 0
SPTLC1 0 0
SPTLC2 0 2
SPTLC3 0 0
TM7SF2 0 0
Gene Name DrugBank drugs STITCH drugs ccmGDB DisGeNETGSE46517, case 2
PGD 0 13 x
SLC26A4 0 5 x
SLCO1B1 0 64 x x
GGPS1 0 0
H6PD 0 19
SLC2A13 0 0
SLC37A4 0 0
SLC38A3 0 0
SLC38A4 0 0
SLC43A1 0 0
Gene Name DrugBank drugs STITCH drugs ccmGDB DisGeNETGSE46517, case 3
ANPEP 0 13 x
XIX

ATIC 2 23 x
CAD 0 2 x x
DHFR 0 22 x
DHODH 3 10 x
FASN 2 29 x x
FDFT1 0 0 x
GUK1 0 0 x
HMGCR 0 45 x
KDSR 0 0 x x
MVK 0 9 x x
PGD 0 13 x
PKM 0 0 x
PLD2 0 0 x
PPAT 0 2 x
RRM1 5 12 x x
RRM2 2 7 x
RRM2B 1 5 x
SLC26A4 0 5 x
SLC5A3 0 1 x
SLCO1B1 0 64 x x
SQLE 3 11 x
TYMS 8 34 x x
UMPS 0 3 x
CMPK1 1 4
CRLS1 0 0
CYP51A1 0 32
DHCR7 0 0
DTYMK 0 2
EBP 0 6
GART 1 6
GGPS1 0 0
GPD1 0 2
H6PD 0 19
HSD17B4 0 0
LCAT 0 13
LIPA 0 5
LSS 0 2
MSMO1 0 0
MVD 0 4
XX

NSDHL 0 0
PAICS 0 0
PFAS 0 0
PGS1 0 0
PISD 0 0
PKLR 0 0
PMVK 0 0
PTDSS1 0 0
PTPMT1 0 0
RPIA 0 7
SGMS1 0 0
SLC16A10 26 51
SLC17A1 0 0
SLC25A19 0 0
SLC27A4 0 0
SLC2A13 0 0
SLC37A4 0 0
SLC38A3 0 0
SLC38A4 0 0
SLC43A1 0 0
SPTLC1 0 0
SPTLC2 0 2
SPTLC3 0 0
TM7SF2 0 0
XXI