master of agribusiness kansas state … · michigan greenhouse and nursery financial study by cindy...
TRANSCRIPT

MICHIGAN GREENHOUSE AND NURSERY FINANCIAL STUDY
by
CINDY BIRCHMEIER
B.S., University of Wisconsin-River Falls, 2000
A THESIS
Submitted in partial fulfillment of the requirements
for the degree
MASTER OF AGRIBUSINESS
Department of Agricultural Economics
College of Agriculture
KANSAS STATE UNIVERSITY
Manhattan, Kansas
2005
Approved by:
Major Professor (Allen Featherstone)
ABSTRACT
Currently the Michigan greenhouse and nursery industry ranks second in
agriculture commodities in cash receipts in Michigan. It accounts for 15.2% of Michigan’s
total agriculture industry and for 3.8% of the total U.S. greenhouse and nursery receipts.
Because of this industry’s growing importance to Michigan agriculture, this research is
dedicated to identifying those factors that affect the profitability of Michigan’s greenhouse
and nursery operations. The goal is to provide accurate financial information to producers
and service providers in this industry so that these operations will remain viable into the
future.
The results show that the wholesale operations had higher profit margins than the
retail operations and that the most profitable wholesale firms were those that sold the
majority of their product to brokers and retail operations. From a balance sheet standpoint,
the wholesale operations also showed more financial strength in that they were more liquid
and more solvent than the retail operations. However, the sample size is relatively limited
for the retail segment of this study, so the results may not be representative of the
greenhouse and nursery industry in Michigan as a whole.
A model was developed to analyze those factors that had the most impact on
profitability. Results of the regression analysis suggest that it is difficult to predict the
factors that influence profitability; however, the return on assets was more easily predicted.
Results suggest that net profit margin and solvency are correlated with the return on assets
of a firm.

i
TABLE OF CONTENTS
LIST OF TABLES ............................................................................................................... iii
LIST OF FIGURES .............................................................................................................. v
CHAPTER 1: INTRODUCTION ....................................................................................... 1
CHAPTER 2: LITERATURE REVIEW ........................................................................... 4
CHAPTER 3: THEORETICAL MODEL ......................................................................... 7
3.1 Introduction ................................................................................................................. 7
3.2 Business Categories .................................................................................................... 7
3.3 Financial and Accounting Definitions ........................................................................ 8
3.4 Regression Modeling ................................................................................................. 13
CHAPTER 4: METHODOLOGY .................................................................................... 14
4.1 Objectives .................................................................................................................. 14
4.2 Data Gathering ......................................................................................................... 14
4.3 Survey Design ............................................................................................................ 15
4.4 Model Design ............................................................................................................ 16
4.5 Summary .................................................................................................................... 17
CHAPTER 5: RESULTS ................................................................................................... 18
5.1 General Business Characteristics ............................................................................. 18
5.2 Financial Introduction .............................................................................................. 21
5.3 Balance Sheet Analysis ............................................................................................. 23
5.4 Ratio Analysis ............................................................................................................ 29
5.5 Income and Expense Analysis ................................................................................... 32
5.6 Profitability Analysis ................................................................................................. 36
5.7 Efficiency Analysis .................................................................................................... 38
5.8 Regression Analysis .................................................................................................. 43
5.9 Wholesale Segment Analysis ..................................................................................... 44
5.10 Summary .................................................................................................................. 50
CHAPTER 6: CONCLUSION .......................................................................................... 51
6.1 Overview .................................................................................................................... 51

ii
6.2 Limitations of the Research ...................................................................................... 53
6.3 Future Research ........................................................................................................ 53
REFERENCES .................................................................................................................... 54
APPENDIX A: SURVEY ................................................................................................... 55
APPENDIX B: BALANCE SHEETS ............................................................................... 59
APPENDIX C: INCOME STATEMENTS ...................................................................... 62

iii
LIST OF TABLES
TABLE 5.1 BUSINESS ACTIVITY AND STRUCTURE CHARACTERISTICS ..... 20
TABLE 5.2 BUSINESS FACTOR IMPACT ................................................................... 21
TABLE 5.3 DESCRIPTIVE STATISTICS ON THE SIZE AND SCOPE OF
BUSINESSES ....................................................................................................................... 23
TABLE 5.4 AVERAGE BALANCE SHEET COMPARISONS, FISCAL YEAR 2003
............................................................................................................................................... 28
TABLE 5.5 AVERAGE LIQUIDITY COMPARISONS, FISCAL YEAR 2003 ......... 30
TABLE 5.6 AVERAGE INCOME STATEMENT FOR MICHIGAN
GREENHOUSE AND NURSERY OPERATIONS, FISCAL YEAR 2003 ................. 33
TABLE 5.7 AVERAGE INCOME STATEMENT FOR MICHIGAN WHOLESALE
GREENHOUSE AND NURSERY OPERATIONS ........................................................ 34
TABLE 5.8 AVERAGE INCOME STATEMENT FOR MICHIGAN RETAIL
GREENHOUSE AND NURSERY OPERATIONS ........................................................ 35
TABLE 5.9 PROFITABILITY RATIO ANALYSIS ALL SEGMENTS, FISCAL
YEAR 2003 ........................................................................................................................... 37
TABLE 5.10 GREENHOUSE AND NURSERY PROFITABILITY COMPARISONS,
ALL OPERATIONS, BY ROA QUARTILE, 2003 ........................................................ 38
TABLE 5.11 AVERAGE ASSET TURNOVER AND WORKING CAPITAL/SALES
EFFICIENCY RATIOS, 2003 ........................................................................................... 39
TABLE 5.12 DETAILED EFFICIENCY ANALYSIS FOR MICHIGAN
GREENHOUSE AND NURSERY OPERATIONS, FISCAL YEAR 2003 ................. 40
TABLE 5.13 GREENHOUSE BUSINESS EFFICIENCY COMPARISONS: ALL
OPERATIONS, BY RETURN ON ASSETS QUARTILE, 2003 .................................. 42
TABLE 5.14 REGRESSION ANALYSIS- ROA ............................................................. 44
TABLE 5.15 COMPARATIVE AVERAGE BALANCE SHEET FOR WHOLESALE
OPERATIONS BY DISTRIBUTION CHANNEL, FISCAL YEAR 2003 .................. 46
TABLE 5.16 AVERAGE ASSET BASE COMPARISON BY DISTRIBUTION
CHANNEL ........................................................................................................................... 47
iv
TABLE 5.17 COMPARATIVE AVERAGE WHOLESALE INCOME STATEMENT
BY DISTRIBUTION CHANNEL, FISCAL YEAR 2003 .............................................. 47
TABLE 5.18 COMPARATIVE RATIO ANALYSIS WHOLESALE OPERATIONS
BY DISTRIBUTION CHANNEL, FISCAL YEAR 2003 .............................................. 49
TABLE 5.19 GREENHOUSE BUSINESS EFFICIENCY COMPARISONS:
WHOLESALE OPERATIONS, BY RETURN ON ASSETS QUARTILE, 2003 ....... 50
TABLE 5.20 GREENHOUSE BUSINESS PROFITABILITY COMPARISONS:
WHOLESALE OPERATIONS, BY RETURN ON ASSETS QUARTILE, 2003 ....... 50

v
LIST OF FIGURES
FIGURE 1.1: MICHIGAN’S TOP 5 AGRICULTURE COMMODITIES AS A
PERCENT OF THE TOTAL AGRICULTURE INDUSTRY, 2003 .............................. 2
FIGURE 5.1 MAP OF SURVEY PARTICIPANTS ....................................................... 18
FIGURE 5.2 MICHIGAN GREENHOUSE AND NURSERY AVERAGE BALANCE
SHEET, FISCAL YEAR 2003 ........................................................................................... 24
FIGURE 5.3 MICHIGAN WHOLESALE GREENHOUSE AND NURSERY
OPERATIONS AVERAGE BALANCE SHEET, FISCAL YEAR 2003 ..................... 26
FIGURE 5.4 MICHIGAN RETAIL GREENHOUSE AND NURSERY
OPERATIONS AVERAGE BALANCE SHEET, FISCAL YEAR 2003 ..................... 27
FIGURE 5.5 AVERAGE EQUITY COMPARISONS, FISCAL YEAR 2003 ............. 30

vi
ACKNOWLEDGMENTS
This thesis is dedicated to all those who supported me and encouraged me while I
have completed this program. To my husband, Darron, thank you for your patience,
understanding, proof reading of countless papers and doing chores while I dedicated my
time to the MAB program. To my parents, Clarence and Dorothy, you have always
supported me in whatever I have wanted to do. Thank you for believing in me and
teaching me that hard work and dedication do pay off. Thank you to my brothers, sister,
other relatives and friends for all of your encouragement throughout the years. Your love
and support mean more than you will ever know.
To my classmates, thank you for your friendship. Getting to know and learn from
each of you has been a wonderful experience. I wish you all the best in your future
endeavors and hope that our paths will cross again.
I want to thank the staff at GreenStone Farm Credit Services for your
encouragement and support as I dedicated my time to this process. I would like to
especially thank all of you that assisted me in gathering information for this study. Your
help and time is appreciated.
I would also like to thank the facility and staff that work with the MAB program at
Kansas State. Your contributions to this program are too numerous to mention and are
what have made this a rewarding experience. To Drs. Featherstone, Boland, Williams and
Williams I would like to thank you for serving as members of my committee. Your
patience and mentorship through this process have made this thesis possible.

1
CHAPTER 1: INTRODUCTION
The United States is the largest producer and marketer of nursery and greenhouse
crops in the world and is the fastest growing segment in American agriculture. According
to the American Nursery and Landscape association, in terms of economic output, nursery
and greenhouse crops represent the third most important sector in US crop agriculture, and
ranks seventh among all commodities in cash receipts and is among the highest sectors for
net farm income.
The Michigan nursery and greenhouse industry is no exception to that rule, and
plays a vital role in Michigan’s agricultural industry. In 2003, the greenhouse and nursery
industry ranked second among Michigan’s agriculture commodities in cash receipts
according to the Economic Research Service of the U.S. Department of Agriculture (2004).
The greenhouse and nursery industry in Michigan had total receipts of $579,694,000 during
2003. This accounts for 15.2% of Michigan’s total agriculture industry and for 3.8% of the
total U.S. greenhouse and nursery receipts of $15,193,378,000 in 2003 (figure 1.1). In
addition, the Michigan Farm Bureau states that Michigan ranks first in nation in the
production of impatiens, petunias, flowering hanging baskets and geraniums. Michigan
produces 14% of the nation’s petunias with over 6 million flats. The state also produces
2.4 million flats of impatiens, and sells 4.78 million hanging baskets and more than 1.84
million pots of geraniums.

2
Figure 1.1: Michigan’s Top 5 Agriculture Commodities as a Percent of the Total Agriculture Industry, 2003
Corn11.10%
Soybeans10.40%
Cattle and Calves5.40%
Dairy Products20.80%
Greenhouse/Nursery15.2%
Dairy Products
Greenhouse/Nursery
Corn
Soybeans
Cattle and Calves
As a significant portion of Michigan’s agricultural economy, it is imperative that
producers in the industry along with individuals that service this industry understand the
current market conditions. The industry has seen drastic changes and developments in the
structure of the industry within the last few years. This includes the emergence and major
market presence of the big box stores and home supply stores carrying a large percentage
of greenhouse and nursery products. This phenomenon has had an effect on both the
wholesale and retail sectors of the industry.
This study utilizes the financial information from GreenStone Farm Credit Services
on various retail and wholesale operations in the greenhouse and nursery industry
throughout the state of Michigan. Moreover, a voluntary survey of GreenStone customers
was conducted in order to gather consistent production and efficiency data to be analyzed.

3
The underlying motive for this research is that in order to have a long-term viable
operation in this industry or to be able to correctly service this type of operation, one must
know the financial position that a producer is facing. Currently very limited information
has been published regarding the financial position of the industry as a whole. The goal of
this research is to provide producers within the industry as well as service providers that
deal with these operations the information needed to understand the variables that affect
these accounts. Therefore, this study will attempt to provide accurate financial analysis and
benchmarking information that can be used by producers and service providers within the
industry as a means of improving operations. Furthermore, this thesis will determine what
segment(s) are most profitable within the Michigan greenhouse and nursery industry and
specifically examine the net profit margins of retail and wholesale operations in Michigan.
In addition, those forces that affect these margins will be identified.

4
CHAPTER 2: LITERATURE REVIEW
In the last two decades, major market changes have reshaped the green industry.
According to Brumfield in a speech given at the 2003 Agricultural Outlook Forum
“Producers on the wholesale side of the industry are becoming more segmented into those
producing for the big chain stores and those who direct market or sell to independent,
upscale garden centers.” She went on to say, “The industry has shifted to a consumer-
driven, rather than producer-driven, economy.” In other words, producers are concerned
about the cost of production and are looking for ways to manage labor expenses while at
the same time improving their own business management to control costs while providing
consumers the products they desire.
It is logical to conclude that in order for producers to control costs they must have
sound financial analysis. The importance of detailed, accurate, and timely financial
reporting has become a ‘hot topic’ within the green industry. This notion is further
supported by Brumfield and Mafoua when they state, “The preventive approach to
managing financial risk is to have accurate, up-to-date financial records, financial analysis
of key ratios and cash flow projections and statements” (8). Moreover, it is important to
benchmark those financial numbers with others in the same business segment.
P.J.van Blokland, also supports the importance of financial analysis by saying,
“Agricultural firms need to make good marketing and financing decisions” (41). One of
those decisions is determining the goals of the organization and this typically includes the
firm being profitable. The major tools van Blokland encourages managers to use include
the following: balance sheet compilation including liquidity and solvency analysis,

5
complete income statement including profitability and margin analysis as well as efficiency
and repayment analysis, enterprise budgeting, and a firm cash flow statement.
Uva and Richards (2003) developed a financial analysis tool that allowed them to
analyze greenhouse business operators specifically located in New York State to complete
a comprehensive business analysis of the firms included in their survey. At the same time,
the operations were able to benchmark their financial performance with other operators
located in New York whom participated in the financial analysis research survey. Their
research reported financial information including: balance sheet analysis including ratio
analysis, income statement analysis and measures of profitability, cash flow analysis,
analysis of capital, operating and labor efficiency and then benchmarking of the previously
mentioned measures. The information was then broken out by marketing channels, size of
greenhouses, and geographical locations. The study consisted of 45 New York greenhouse
operations and was completely voluntary; therefore, the information contained therein may
not be representative of the entire New York industry. To compensate for the comparison
of different sized greenhouses, many of the variables analyzed were calculated on a “square
foot week” basis thus allowing for the allocation of indirect, variable and fixed costs for
operations of different sizes and operating cycles. Uva and Richards state that although the
financial analysis helps greenhouse managers evaluate the firm’s performance during a
given year, there is no universal agreement among experts on which ratios to use in the
financial analysis. While the analysis provides valuable information about the firm, the
value of the information improves if other similar businesses provide the same information
for comparison purposes. Financial benchmarking is even more useful if it can be related

6
to specific driving forces that cause certain phenomenons within a given industry to occur.
In other words, if there is a continuing trend among similar firms within an industry, then it
is important to understand the driving force that is causing the trend among those firms.
For example, a person would want to identify the fact that margins are narrowing, but it
would be even more valuable to know that increased labor costs are the major cause of
those narrowing margins.
As presented in the discussion above, financial analysis is deemed by many experts
to be perhaps the most important aspect in the successful strategic management of any
business. However, because many businesses are unwilling or unable to provide accurate
financial information, it is often difficult to benchmark a given industry. Another major
hurdle for this type of analysis is the inconsistent methods used for collecting the
information. This is not helped by the fact that industry experts do not unanimously agree
upon the ratios that are critical for analysis. This makes it difficult to be consistent within
and between studies for comparison purposes. Therefore, the financial analysis and
business summary information on the greenhouse industry that is available for review is
limited. Uva and Richards have been leaders in compiling a greenhouse business summary
and financial analysis study and then using that study for benchmarking purposes. The
purpose of this study is to further develop the financial and business industry analysis
information available in Michigan and to identify which business segments within the
industry are most profitable. In addition, the study will also determine what variables are
most closely related to the overall profit margins.

7
CHAPTER 3: THEORETICAL MODEL
3.1 Introduction
Information compiled by financial institutions and academic researchers for
financial analysis and green industry benchmarking require that fundamental economic
aspects need to be defined in order to understand and compare the results between studies.
Greenhouse categories must be explained and financial and accounting considerations
defined. This study also provides an explanation of regression modeling, which will be
used as a means of identifying the relationship between independent and dependent
variables.
3.2 Business Categories
The green industry is made up of floriculture and nursery crops. “Floriculture crops
include: bedding plants, cut cultivated greens, cut flowers, flowering potted plants, foliage
plants, and floriculture propagative material. Nursery crops include: broadleaf evergreens,
coniferous evergreens, deciduous shade trees, deciduous flowering trees, deciduous shrubs
and other ornamentals, fruit and nut plants, Christmas trees (cut and to be cut), transplants
for commercial truck crop production and propagation material (except transplants for
commercial crop production)” (Brumfield, 2003). Floriculture and nursery operations can
be split into two different marketing channels. These channels are retail or wholesale. In
this study, retailers are defined as those businesses having more than 50 percent of total
receipts from retail transactions, while wholesalers are defined as those businesses having
more than 50 percent of total receipts from wholesale transactions. The wholesale group
can be further defined as to whom their product is sold to. Typically wholesalers sell their
product to the following groups: box centers, independent retail garden centers, retail

8
locations-other, landscape operations and to re-wholesalers or brokers. Box centers are
referred to as those retail outlets that carry multiple product lines of home and garden
merchandise. Examples include but are not limited to Home Depot, Lowe’s, Wal-Mart and
K-Mart. The wholesale category can therefore be further broken down based on the
distribution of their product. The various sub categories are the operations that sell their
product to box stores, retail garden centers, other retail outlets, landscape firms and brokers
or other wholesalers. The operations fit into one of these categories based on where the
majority, 50% or greater, of their product is sold.
The categories are defined as such because that is typically how the green industry
is divided in Michigan. The main focus of this study is to determine which of these
business segments is most profitable and what variables are most highly correlated to
profitability.
3.3 Financial and Accounting Definitions
Because there are no universally accepted formulas or definitions by experts on
financial reporting and ratio analysis, it is imperative that financial and accounting
functions be clearly defined. The following are definitions for the specified segments of
the financial analysis that will be used in this study. The following measures can be used
by lending firms, management and others as a means of critically analyzing the strengths
and weaknesses for a given firm and how that firm compares in relation to similar firms in
the industry. There are several key measures and statistics that will be used to determine
capital and capacity characteristics of the firms analyzed. These key measures are
commonly classified into the following four categories: liquidity, solvency, efficiency and

9
profitability. Some of these calculations will be used for regression analysis to determine
which dependent variables have the greatest impact on profitability.
Balance Sheet- The balance sheet reports a business’ assets, liabilities and equity at
a specified time. The accounting equation is as follows:
Assets = Liabilities + Owner’s Equity
The balance sheet is also referred to as the “Statement of financial position”
because it shows what proportion of the assets the owner can claim versus what the bank
can claim (Uva and Richards, 2003).
Income Statement- The income statement is a summary of all receipts and
expenditures a business has over a particular period of time (Uva and Richards, 2003). The
time period used in this study is one year. The result is either net income or net loss. The
income statement is also referred to as a profit and loss statement.
As stated previously, one common way to analyze the financial soundness of a
company is to look at the company based on liquidity, solvency, efficiency and profitability
factors.
Liquidity as a whole measures the company’s ability to pay current obligations.
This is commonly determined through the following measures:
Working Capital- (Current Assets - Current Liabilities)
Current Ratio- (Current Assets / Current Liabilities)

10
Working Capital/Asset- (Working Capital / Total Assets)
Equity- (Total Assets – Total Liabilities) This is the amount in dollars that the firm
owns.
Solvency ratios measure the company’s ability to meet payments associated with
the total debt structure of the business including long-term debt. How solvent or leveraged
a company is may most commonly be measured by the following ratio.
Owner Equity- (Equity / Total Assets)
Profitability measures often provide an individual with a basis for determining how
well a business operates.
Gross Operating Sales- is defined as total dollars generated from sales of the
business.
Cost of Goods Sold- is defined as the cost associated with obtaining the product or
service that is to be sold.
Gross Profit- (Gross Operating Sales - Cost of Goods Sold)
Operating Expense- is defined as the cost associated with selling and administering
the product to be sold.
Total Operating Income- (Gross Profit - Operating Expenses)

11
Total Net Income- (Total Operating Income + Non Operating Income – Interest
Expense – Income Taxes (+/-) Extraordinary Gains or Losses)
Gross Profit Margin- (Gross Profit/ Gross Operating Sales) is expressed as a
percentage. According to investorwords.com (A, 2005), gross margin reveals how much a
company earns taking into account the costs that it incurs for producing its products and/or
services. Companies that are closer to the end retail customer typically have higher gross
margins then those that are closer to the raw product. This occurs because a majority of a
retail company’s expenses are associated with costs related to marketing and delivery,
whereas a wholesale company typically incurs their costs in the production of the product
and therefore has slimmer gross margins.
Operating Profit Margin- (Total Operating Income/ Gross Operating Sales) is
expressed as a percentage. This percentage indicates how efficiently the company is
operating and is a measure of how well variable operating expenses are controlled
(Investorwords.com, C, 2005).
Net Profit Margin – (Total Net Income / Gross Operating Sales) is expressed as a
percent. Investorwords.com (B, 2005) states, “This percentage is indicative of how
effective a company is at cost control.” The higher the net profit margin the more effective
the company is at converting revenue into actual profit. Net profit margin is a good way of
comparing companies in the same industry. It can also be used to compare companies in
different industries, as it gauges relative profitability. For the purposes of this thesis, net

12
profit margin is used to determine which business segment is the most profitable within the
green industry.
Debt Coverage Ratio- is a measure of repayment ability of the firm and is
calculated as such: EBITDA / (Current Portion Long Term Debt + interest).
EBITDA- Earnings before interest, taxes, depreciation and amortization is
calculated by adding interest, taxes, depreciation and amortization to total net income.
Amortization-
Return on Assets (ROA)- (Total Net Income + Interest Paid) / Total Assets
Return on Equity (ROE)- (Total Net Income / Equity)
Efficiency measures determine how well a company is utilizing its asset base and
the following measures are indicators of efficiency.
Asset Turnover (ATO) - (Gross Operating Sales / Total Assets)
Working Capital/Sales (WC/Sales) - (Working Capital / Gross Operating Sales)
Sales/Total Facility Area- Gross Operating Sales / Total Square Feet of Greenhouse
and Sales Area
Net Income/Total Facility Area- Total Net Income / Total Square Feet of
Greenhouse and Sales Area

13
Total Facility area/Labor Hour- Total square Feet of Growing Area + Sales Area)/
Labor Hour
Sales/Labor Hour- Gross Operating Sales / Labor Hour
Net Income/Labor Hour- Total Net Income / Labor Hour
Labor Hour- is defined as the total annual number of labor hours for both
permanent and temporary employees.
3.4 Regression Modeling
Regression analysis is “A statistical technique that attempts to explain movements
in one variable as a function of movements in a set of other variables through the
quantification of a single equation,” as explained by Studenmund, (2001 7). In other
words, regression attempts to explain how independent or explanatory variable movements
affect the movement of a single dependent variable. Regression analysis is used to quantify
estimates of economic relationships. It quantifies the relationship and strength that
independent variables have on a dependent variable. This is done through the use of
financial data from the group. However, the regression does not prove causality between
the independent and dependent variables, but sound economic theory along with a
significant quantitative relationship can lead to inferring a causal relationship. This study
uses regression analysis to quantify the relationship between the independent variables: net
profit margin, working capital to sales and owner equity and the dependent variable: return
on assets.

14
CHAPTER 4: METHODOLOGY
4.1 Objectives
The objectives of this thesis are to utilize financial data to determine what segment
within the green industry is most profitable, and to use linear regression modeling to
determine what factors are highly correlated with profit. Variables measuring liquidity,
solvency, profitability and efficiency are being used for the financial analysis
measurements and numerous variables will be utilized for the regression analysis to
determine the effect on profitability.
4.2 Data Gathering
Based on the information supplied by the National Agricultural Statistics Service,
sales in the state of Michigan for 2003 nursery crops were $150,451,000 and the sales for
floriculture products was $322,754,000. Therefore, total green industry sales were
$473,205,000 in the state of Michigan for 2003. GreenStone Farm Credit Services data
were used to determine what percentage of the total green industry market share were
customers of GreenStone by sales. Product codes 180 and 181, which are the codes used
for customers who are engaged in ornamental floriculture and nursery products and
horticultural specialties sales were used. Once duplicate files were eliminated, thus
ensuring that there was only one representative file per actual business and sole
proprietorship, GreenStone customers accounted for total gross farm income from nursery
and floriculture products of $238,008,225 within the state of Michigan. Thus, GreenStone
customers make up roughly 50% of the market share as determined by total sales.

15
The decision to limit the study to GreenStone customers was made because
financial data on these customers were readily available. A survey was used that collected
production information along with gaining permission to be involved in the study.
Information within the study was only used on those customers who provided permission.
The financial information was then gathered on the respondents from various financial
analytical tools used by GreenStone, mainly Farm Equity Manager and Moody’s on fiscal
year 2003 data. By using the financial information collected on these customers by
GreenStone, it ensured that the financial information used in the study was sound and was
relatively uniform in nature.
4.3 Survey Design
The survey had voluntary participation, and all information on an individual
company basis has been and will remain strictly confidential. The survey was sent to 162
operations throughout the state of Michigan. An initial letter explaining the study along
with the survey, found in appendix A, was sent to all GreenStone customers with product
codes of 180 and 181. Of the 162 surveys sent out, 73 were returned for a response rate of
45.06%.
The survey was designed with multiple sections. The sections asked for
information in key areas including: demographics, general farm operations, products sold
and ownership structure. The demographic information of each business was uncovered
through questions regarding origin and location. General farm operation questions
consisted of items such as labor hours, number of full time employees, number of part time
employees, business operation hours (open all year or part of the year), list of managers and

16
their respective job duties, and computer usage for inventory, accounting, marketing,
communications and greenhouse production control. Products sold asked for the
percentage of sales in various plant categories as well as the percentage of space devoted to
various operations. Ownership questions asked about the business structure, management
team and their responsibilities, and any contracting services that are used by the business.
4.4 Model Design
The estimation technique used in this study is the linear regression model. A linear
regression model utilizes independent variables and functional form to estimate the
equation for a dependent variable.
In general, linear regression is specified as follows:
Y = f (X1, X2, X3, … Xn)
where Y is the dependent variable since it depends on or is correlated with the X variables
and X’s are independent variables.
The functional form of the model is the following:
ROAt = B0 + B1NPMt + B2WC_Sales01t + B3OEt +Ei
where t refers to an observation, B0 is the intercept, ROA is the return on assets NPM is net
profit margin, WC_Sales01 is the percentage of working capital to sales, OE is owner and
Ei is the error term.

17
Net profit margin is expected to be positive because as the net profit margin
increases for a firm so does the return on assets. Working capital to sales could be either
positive or negative as the relationship of this ratio to return on assets is unknown. Owner
equity could be positive or negative as the relationship of this ratio to the return on assets is
unknown.
With the completion of the model setup, the definition of the variables and the
expected signs for each variable, the dependent variables are tested for statistical
significance in respect to the independent variable. Multiple scenarios are tested to
determine if additional variables influence return on assets and if there are other dependent
variables that have more explanatory ability in relation to independent variables than ROA
does. This testing is completed using Eviews software. This is different from the rest of
the statistical analysis completed in the study, which uses SPSS 12.0.
4.5 Summary
The chapter summarizes how the data was gathered and modeled to complete the
financial and regression analysis in order to meet the objectives of this thesis.
18
CHAPTER 5: RESULTS
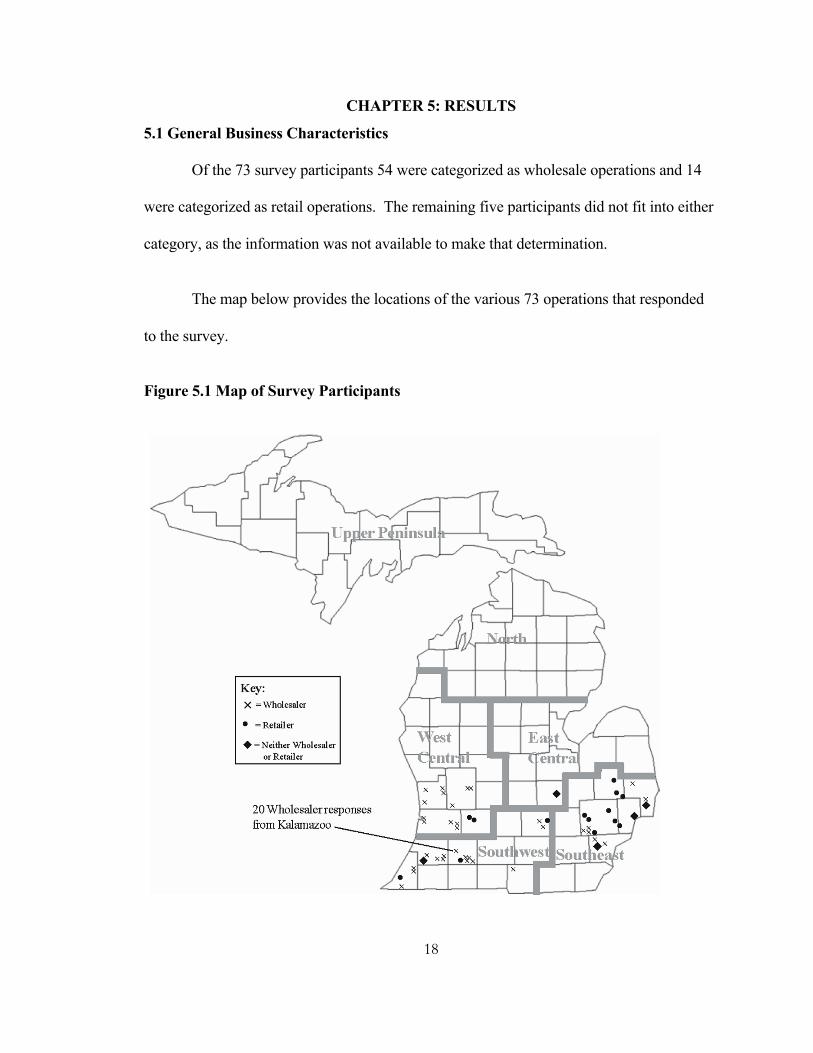
5.1 General Business Characteristics
Of the 73 survey participants 54 were categorized as wholesale operations and 14
were categorized as retail operations. The remaining five participants did not fit into either
category, as the information was not available to make that determination.
The map below provides the locations of the various 73 operations that responded
to the survey.
Figure 5.1 Map of Survey Participants

19
Computerization for the group as a whole is used to varying degrees (Table 5.1).
Overall, computerization is used mostly for accounting, e-mailing and production
scheduling as well as for inventory, faxing and greenhouse production control. The use of
the computer for financial investing, banking, marketing, and landscape design is done
minimally. The wholesale sector typically uses the computer more than the retail sector for
accounting, production scheduling and greenhouse production. The retail sector utilizes
computers more than the wholesale sector for marketing and landscape design (Table 5.1).
In general, the retail operations used contracting services more than the wholesale
operations (Table 5.1). As a percentage, the retail operations contracted more business
planning, payroll, marketing, inventory, financial investing and accounting activities than
the wholesale operations. The wholesale operations as a percentage contracted more tax
consulting than the retail operations. Overall, tax consulting and accounting were the two
most widely contracted business activities with 79.5% and 61.6% of the 73 respondents
stating that they used these services.
As a group, retail operations were slightly more likely to have multiple entities in
their business organization than wholesale operations with 28.6% of retail operations
having multiple entities and 25.9% of the wholesale operations having multiple business
entities (Table 5.1). In addition, only 17 or 23.3% of the operations are sole
proprietorships. Thirty-five or 47.9% of the operations are incorporated, which is the
dominant ownership structure for both the wholesale and retail categories. The remaining
operations were comprised of limited liability corporations, limited liability partnerships, or
general partnerships. Ownership structure was fairly uniform between the wholesale and

20
retail operations with 24.1% of the 54 wholesale firms and 28.6% of the 14 retail firms
operated as sole proprietorships. The only difference between the ownership structures was
that 14.3% of the retail operations were partnerships as compared to 1.9% of wholesale
operations.
Table 5.1 Business Activity and Structure Characteristics
Number % of Total Number % of Total Number % of TotalComputerized Business Activity Accounting 64 94.10% 11 84.60% 48 96.00% Inventory 38 55.90% 7 53.80% 28 56.00% Financial Investments 19 27.90% 3 23.10% 13 26.00% Banking- Wires/ACH 23 33.80% 4 30.80% 18 36.00% Marketing 21 30.90% 8 61.50% 13 26.00% E-Mail 55 80.90% 11 84.60% 42 84.00% Faxing 35 51.50% 7 53.80% 25 50.00% Landscape Design 7 10.30% 3 23.10% 3 6.00% Production Scheduling 41 60.30% 5 38.50% 34 68.00% Greenhouse Production Controls 36 52.90% 4 30.80% 31 62.00% Other 6 8.80% 2 15.40% 4 8.00%Contracting Services No Contracting Services Used 10 13.70% 1 7.10% 8 14.80% Tax Consulting 58 79.50% 11 78.60% 43 79.60% Business Planning 20 27.40% 5 35.70% 14 25.90% Payroll 28 38.40% 9 64.30% 18 33.30% Marketing 11 15.10% 7 50.00% 3 5.60% Inventory 13 17.80% 3 21.40% 9 16.70% Financial Investing 17 23.30% 4 28.60% 12 22.20% Accounting 45 61.60% 10 71.40% 32 59.30%Multiple Entity Structure Yes 21 29.20% 4 28.60% 14 26.40% No 51 70.80% 10 71.40% 39 73.60%Ownership Structure Partnership 3 4.20% 2 14.30% 1 1.90% Incorporation 35 48.60% 7 50.00% 24 45.30% Sole Proprietorship 17 23.60% 4 28.60% 13 24.50% Limited Liability Corporation 16 22.20% 1 7.10% 14 26.40% Limited Liability Partnership 1 1.40% 0 0.00% 1 1.90%
Entire Group WholesaleRetail
Entire Group Retail Wholesale
Entire Group Retail Wholesale
Entire Group Retail Wholesale

21
As a group the respondents said that weather and market demand were the factors
that had the most impact on business results (Table 5.2). A total of 69 participants said that
weather had an important or very important impact on their business and 68 said that
market demand had an important or very important impact on their business. Land, water
supply and employee turnover were rated as having the least amount of impact on business
results. Thirty respondents said land had a minor or very minor impact on business results
and 21 said that water supply and employee turnover had a minor to very minor impact on
business results.
Table 5.2 Business Factor Impact Very Minor Minor Neutral Important Very Important Total Weather 0 2 2 15 54 73 Market Demand 0 2 3 19 49 73 Land 19 11 26 6 11 73 Labor 3 3 21 28 18 73 Water Supply 11 10 10 12 29 72 Capital 2 2 15 31 23 73 Competition 2 7 12 29 23 73 Environmental Regulations 7 7 21 25 13 73 Other Governmental Regulations 7 9 22 25 10 73 Employee Turnover 8 13 26 22 4 73 Own Managerial Expertise 3 5 10 24 30 72
5.2 Financial Introduction
Of the 73 respondents to the survey only 44 had sufficient financial information to
do a comprehensive financial analysis for fiscal year end 2003 data. The remaining 29
participants’ financial information was not complete because of their limited loan size.
Therefore, the financial data included in this study is only from the 44 respondents that had
sufficient information to complete the financial analysis.
22
Among the 44 respondents that had sufficient financial information to include in the
financial analysis, 37 of the respondents are categorized as wholesale greenhouse
operations and the remaining seven are classified as retail operations. The 44 operations
had total gross sales of $120,844,702, which equates to 27.64% of the total green industry
sales for Michigan in 2003. The majority of the 44 operations (37) sell primarily annual
bedding plant material with only two operations having sales of greater than 50% in
perennial plant material and four operations having greater than 50% of sales in nursery
stock. One operation had diversified sales in all three categories and therefore did not have
greater than 50% of sales in any given plant material category. Due to the limited number
of retail operations with detailed financial information, the data may not be a representative
sample of the retail greenhouse and nursery industry in Michigan.
Overall, the 44 operations included in the financial analysis had an average total
facility area including both growing and sales space of 367,003 ft2 and averaged $2,746,470
of annual gross sales (Table 5.3). Table 5.3 illustrates the overall size and scope of the
operations and provides a comparison between the retail and wholesale operations. The
retail greenhouses on average were larger than the wholesale greenhouses and also had
higher gross sales; however, the wholesale greenhouses had higher averages for gross,
operating and net profit margins. Typically one might expect that the wholesale
greenhouses would be larger than the retail businesses as this usually the case with most
operations in this industry. However, this study has significantly large retail operations that
responded and therefore, the average size and scope of the retail operations may not be
representative of the entire industry. In comparison to the size and scope of the operations
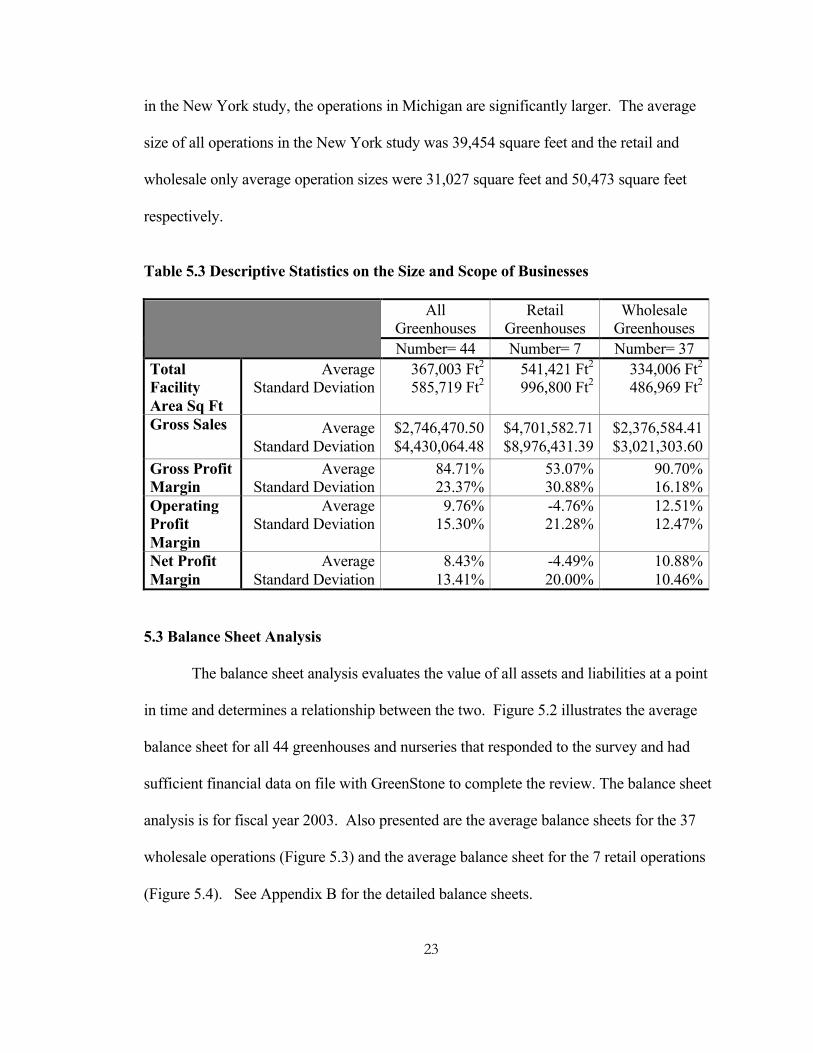
23
in the New York study, the operations in Michigan are significantly larger. The average
size of all operations in the New York study was 39,454 square feet and the retail and
wholesale only average operation sizes were 31,027 square feet and 50,473 square feet
respectively.
Table 5.3 Descriptive Statistics on the Size and Scope of Businesses
All Greenhouses
Retail Greenhouses
Wholesale Greenhouses
Number= 44 Number= 7 Number= 37 Total Facility Area Sq Ft
Average Standard Deviation
367,003 Ft2 585,719 Ft2
541,421 Ft2 996,800 Ft2
334,006 Ft2 486,969 Ft2
Gross Sales Average
Standard Deviation $2,746,470.50 $4,430,064.48
$4,701,582.71 $8,976,431.39
$2,376,584.41 $3,021,303.60
Gross Profit Margin
Average Standard Deviation
84.71% 23.37%
53.07% 30.88%
90.70% 16.18%
Operating Profit Margin
Average Standard Deviation
9.76% 15.30%
-4.76% 21.28%
12.51% 12.47%
Net Profit Margin
Average Standard Deviation
8.43% 13.41%
-4.49% 20.00%
10.88% 10.46%
5.3 Balance Sheet Analysis
The balance sheet analysis evaluates the value of all assets and liabilities at a point
in time and determines a relationship between the two. Figure 5.2 illustrates the average
balance sheet for all 44 greenhouses and nurseries that responded to the survey and had
sufficient financial data on file with GreenStone to complete the review. The balance sheet
analysis is for fiscal year 2003. Also presented are the average balance sheets for the 37
wholesale operations (Figure 5.3) and the average balance sheet for the 7 retail operations
(Figure 5.4). See Appendix B for the detailed balance sheets.

24
Figure 5.2 Michigan Greenhouse and Nursery Average Balance Sheet, Fiscal Year 2003
ASSETS LIABILITIES Current Assets Current Liabilities Cash $120,565 Accounts Payable $136,326
Marketable Bonds & Securities
$21,366 Operating Loan $179,100
Current Accounts Receivable
$205,554 Current Portion Long Term Debt
$77,480
Inventory $136,524 Accrued Interest $13,776 Growing Crops $95,187 Other Current Liabilities $88,571 Prepaids $102,826 Total Current Liabilities $495,253 Other Current Assets $30,176 Total Current Assets $712,198 Non Current Liabilities
Long Term Debt $628,763 Non Current Assets Other Non Current
Liabilities $24,750
Machinery & Equipment $607,452 Total Non Current Liabilities
$653,513
Vehicles $57,216 Non Current Accounts Receivable
-$3,604 TOTAL LIABILITIES $1,148,767
Not Readily Mkt Bonds & Securities
$86,474
Real Estate $1,726,795 Other Non Current Assets $133,782 TOTAL EQUITY $2,171,545 Total Non Current Assets $2,608,113
TOTAL ASSETS $3,320,311
n= 44 operations
Overall, the operations had a total asset value of $3,320,311 with liabilities of
$1,148,767 and owner equity of $2,171,545 (Figure 5.2). The majority of the asset base
resides in the value of the real estate. Meanwhile, the liabilities are more dispersed and a
greater percentage of the overall liabilities are found in the current portion than the
percentage of total assets that is found in current assets.

25
It is important to note that of the 44 operations in the financial study, 2 operations
had book value balance sheets while the remaining 42 operations had adjusted market value
balance sheets.
In this sample, the retail operations show greater variance in the balance sheet than
the wholesale operations do, as the average standard deviations are higher for the retail
operations than the wholesale operations.
A comparison of the New York operations and the Michigan operations balance
sheet is limited in value because the New York study analyzed the operations on a book
value basis whereas the operations in Michigan were analyzed using adjusted market
values.

26
Figure 5.3 Michigan Wholesale Greenhouse and Nursery Operations Average Balance Sheet, Fiscal Year 2003
ASSETS LIABILITIES Current Assets Current Liabilities Cash $124,567 Accounts Payable $116,159 Marketable Bonds &
Securities $19,301 Operating Loan $163,150
Current Accounts Receivable $217,338 Current Portion Long Term Debt
$79,421
Inventory $53,756 Accrued Interest $14,327 Growing Crops $109,141 Other Current Liabilities $1,143 Prepaids $118,448 Total Current Liabilities $374,200 Other Current Assets $26,431 Total Current Assets $668,983 Non Current Liabilities
Long Term Debt $592,656 Non Current Assets Other Non Current
Liabilities $0
Machinery & Equipment $362,023 Total Non Current Liabilities
$592,656
Vehicles $62,349 Non Current Accounts
Receivable -$4,435 TOTAL LIABILITIES $966,856
Not Readily Mkt Bonds & Securities
$99,968
Real Estate $1,650,970
Other Non Current Assets $142,414 TOTAL EQUITY $2,015,416 Total Non Current Assets $2,313,290
TOTAL ASSETS $2,982,272 n=37 operations
The 37 wholesale operations had total assets of $2,982,272 and total liabilities of
$966,856 for owner equity of $2,015,416 (Figure 5.3). The majority of this group’s asset
base was found in real estate. This group proportionately had a higher percentage of
current liabilities to total liabilities than it did current assets to total assets.
In this group, one firm had a book value balance sheet and the remaining 36
operations had adjusted market value balance sheets. The one book value balance sheet

27
accounted for 2.7% of the group total. The book value balance sheet does not take into
account the market value of appreciable assets (land), but rather is the original cost of the
asset minus accumulated depreciation. The importance of this is that the real estate value
for that greenhouse could be significantly less on a book value basis versus a market value
basis.
Figure 5.4 Michigan Retail Greenhouse and Nursery Operations Average Balance Sheet, Fiscal Year 2003
ASSETS LIABILITIES
Current Assets Current Liabilities
Cash $99,413 Accounts Payable $242,919 Marketable Bonds & Securities $32,282 Operating Loan $263,409 Current Accounts Receivable
$143,269 Current Portion Long Term Debt
$67,223
Inventory $574,012 Accrued Interest $10,866 Growing Crops $21,429 Other Current Liabilities $550,689 Prepaids $20,248 Total Current Liabilities $1,135,105 Other Current Assets $49,971 Total Current Assets $940,624 Non Current Liabilities
Long Term Debt $819,616 Non Current Assets Non Current Liabilities $155,571 Machinery & Equipment $1,904,716 Total Non Current
Liabilities $975,187
Vehicles $30,083 Non Current Accounts Rec. $786 TOTAL LIABILITIES $2,110,292 Not Readily Mkt Bonds & Securities
$15,143
Real Estate $2,127,581
Other Non Current Assets $88,157 TOTAL EQUITY $2,996,797 Total Non Current Assets $4,166,466
TOTAL ASSETS $5,107,090
n=7 operation
The seven retail operations had total assets of $5,107,090 and total liabilities of
$2,110,292 for owner equity of $2.996,797 (Figure 5.4). Although this group had a

28
significant portion of its asset value in real estate, it also had a significant portion of its
asset base in machinery and equipment. Approximately, 37% of the total asset value for
this group was based in machinery and equipment. The retail operations also had more
current liabilities than current assets as a group; thus, indicating that they had negative
working capital. Another item to note is that even though this group had a significant
portion of its asset base, almost 82%, in non current assets, its non-current liabilities were
only 46% of its total liabilities.
This group had one firm that had a book value balance sheet with the remaining
having adjusted market value balance sheets. The one book value balance sheet accounted
for 14.3% of the group as a total. This firm that had the book value balance sheet is the
largest firm in this group. However, the quantifiable difference between the book value
balance sheet and the market value balance is not able to be determined.
Table 5.4 Average Balance Sheet Comparisons, Fiscal Year 2003
Group Wholesale
Operations Retail
Operations Current Assets $712,198 $668,983 $940,624 Non Current Assets $2,608,113 $2,313,290 $4,166,466 Total Assets $3,320,311 $2,982,272 $5,107,090 Current Liabilities $495,253 $374,200 $1,135,105 Non Current Liabilities $653,513 $592,656 $975,187 Total Liabilities $1,148,767 $966,856 $2,110,292 Total Equity $2,171,545 $2,015,416 $2,996,797 Current Assets as % of Total Assets 21.45% 22.43% 18.42% Non-Current Assets as a % of Total Assets 78.55% 77.57% 81.58% Current Liabilities as a % of Total Liabilities 43.11% 38.70% 53.79% Non-Current Liabilities as a % of Total Liabilities 56.89% 61.30% 46.21%

29
In comparison, the retail operations had higher values in all asset and liability
categories as well as equity than the wholesale operations (Table 5.4).
5.4 Ratio Analysis
An important part of the balance sheet analysis is examining the ratios. The
numbers themselves provide a means of asking questions and give detail regarding the
make up of the assets and liabilities of the operation, but it is the ratio analysis that details
the relationships of the financial position. Ratio analysis allows for a comparison between
two items that the balance sheet figures themselves simply do not provide. As stated
earlier, there are two main categories in financial position analysis: liquidity and solvency.
The liquidity ratios specifically relate the relationship between current assets and
liabilities. As a group, the 44 operations had average working capital or current assets
greater than current liabilities of $216,945 (Table 5.5). This means that after all current
assets are liquidated and all current liabilities are paid for there is $216,945 surplus.
Working capital to assets for the group was 6.53% and the current ratio or number of times
current assets cover current liabilities is 1.44 times.
The 37 wholesale operations have average working capital of $294,782, have
9.88% working capital to assets and a current ratio of 1.79 (Table 5.5). All three of these
numbers are higher than the averages of the retail operations.
The retail operations have a working capital position of negative $194,481, which
means that even with all current assets liquidated current liabilities could not be paid (Table

30
5.5). Working capital to assets is –3.81% and the current ratio is 0.83. This means for
every dollar of current liabilities there is only $0.83 of current asset value.
Table 5.5 Average Liquidity Comparisons, Fiscal Year 2003 Group Wholesale Retail Working Capital $216,945 $294,782 -$194,481 Working Capital/Assets 6.53% 9.88% -3.81% Current Ratio 1.44 1.79 0.83
The solvency ratios specifically explain the relationship of the overall total financial
position of the company including both current and non-current assets and liabilities.
Overall, equity is the portion of the operation that is owned by the company or individual
versus the portion that is funded by an outside source. The 44 operations have an equity
position of 65.4%. The wholesale group has a higher equity position than the retail group at
67.58% and 58.68% respectively (Figure 5.5).
Figure 5.5 Average Equity Comparisons, Fiscal Year 2003
65.40%67.58%
58.68%
50.00%52.00%54.00%56.00%58.00%60.00%62.00%64.00%66.00%68.00%70.00%
Group Wholesale Retail
Industry Segment
Perc
ent

31
Overall, both the retail and wholesale groups are solvent, but the wholesale group
does have a higher owner equity position even though total equity is lower than the average
total equity value held by the retail operations. Debt to assets and debt to equity on a
relationship basis are less for the wholesale segment as well as for the retail segment. The
wholesale operations are more liquid than the retail operations. The retail operations show
negative working capital and are carrying a higher debt load both on the current side and on
the non-current side than the wholesale operations.
The New York operations show similar results in that the wholesale operations
showed significantly more dollars of working capital than the retails operations. However,
the New York retail operations did show a positive working capital position of $69,393 and
the New York retail operations have a higher current ratio than did the wholesale
operations. It should be noted that the Michigan retail working capital is skewed
significantly by one operation of the seven showing a large negative working capital
position.
The New York wholesale operations show a significantly higher owner equity
position than did the New York retail operations. The equity percentages are lower for
both the retail and wholesale operations in New York compared to the Michigan
operations, but that is due to book valuation versus adjusted market value analysis. The
important take away is that both the Michigan and New York studies have results that show
the wholesale operations having more dollars of working capital and are more solvent as
evidenced by the owner equity percentage than the retail operations. However, one

32
difference is that based on the current ratio the New York operations are more liquid than
the wholesale operations which is not the case in the Michigan study.
5.5 Income and Expense Analysis
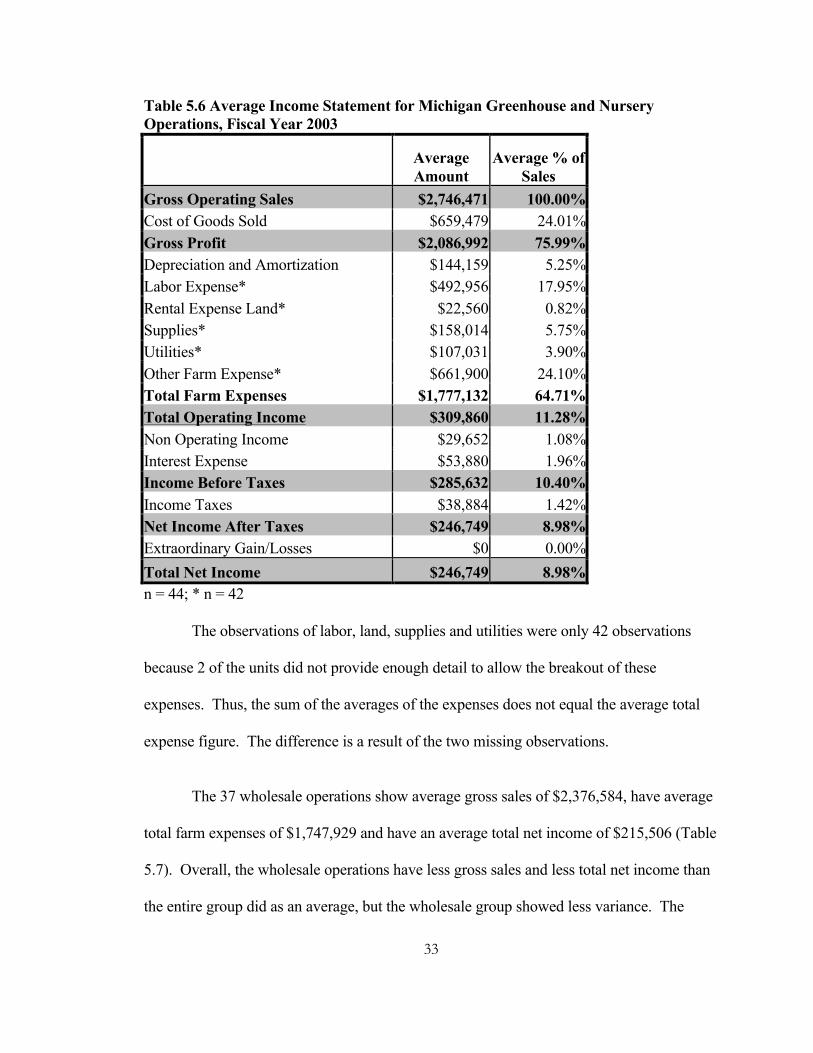
The 44 operations averaged total sales of $2,746,471 and had total net income of
$246,749 (Table 5.6). Total Sales range from a maximum of $24,985,846 to a minimum of
$209,402 while total net income ranges from $2,909,131 to -$140,827 (Appendix C). The
average total operating income is $309,860 and ranges from $144,937 to $8,860,855.
There is a wide variance in the income statement. The standard deviations for gross sales,
total farm expenses and total net income are respectively $4,430,064, $2,193,335 and
$511,835.
33
Table 5.6 Average Income Statement for Michigan Greenhouse and Nursery Operations, Fiscal Year 2003
Average Amount
Average % of Sales
Gross Operating Sales $2,746,471 100.00% Cost of Goods Sold $659,479 24.01% Gross Profit $2,086,992 75.99% Depreciation and Amortization $144,159 5.25% Labor Expense* $492,956 17.95% Rental Expense Land* $22,560 0.82% Supplies* $158,014 5.75% Utilities* $107,031 3.90% Other Farm Expense* $661,900 24.10% Total Farm Expenses $1,777,132 64.71% Total Operating Income $309,860 11.28% Non Operating Income $29,652 1.08% Interest Expense $53,880 1.96% Income Before Taxes $285,632 10.40% Income Taxes $38,884 1.42% Net Income After Taxes $246,749 8.98% Extraordinary Gain/Losses $0 0.00% Total Net Income $246,749 8.98% n = 44; * n = 42
The observations of labor, land, supplies and utilities were only 42 observations
because 2 of the units did not provide enough detail to allow the breakout of these
expenses. Thus, the sum of the averages of the expenses does not equal the average total
expense figure. The difference is a result of the two missing observations.
The 37 wholesale operations show average gross sales of $2,376,584, have average
total farm expenses of $1,747,929 and have an average total net income of $215,506 (Table
5.7). Overall, the wholesale operations have less gross sales and less total net income than
the entire group did as an average, but the wholesale group showed less variance. The

34
standard deviations are $3,021,304, $2,033,438 and $322,216 for gross sales, total farm
expenses and total net income respectively (Appendix C).
Table 5.7 Average Income Statement for Michigan Wholesale Greenhouse and Nursery Operations
Average Amount
Average % of Sales
Gross Operating Sales $2,376,584 100.00% Cost of Goods Sold $372,021 15.65% Gross Profit $2,004,563 84.35% Depreciation and Amortization $133,072 5.60% Labor Expense* $522,155 21.97% Rental Expense Land* $26,110 1.10% Supplies* $177,350 7.46% Utilities* $114,051 4.80% Other Farm Expense* $722,288 30.39% Total Farm Expenses $1,747,929 73.55% Total Operating Income $256,634 10.80% Non Operating Income $26,269 1.11% Interest Expense $50,176 2.11% Income Before Taxes $232,727 9.79% Income Taxes $17,222 0.72% Net Income After Taxes $215,505 9.07% Extraordinary Gain/Losses $1 0.00%
Total Net Income $215,506 9.07% n = 37; * n = 36
There were only 36 observations of the 37 total that had sufficient information to
break down labor, land rent, supplies, utilities and other farm expenses. Therefore, the sum
of these variables does not equal the total average farm expenses number.

35
Table 5.8 Average Income Statement for Michigan Retail Greenhouse and Nursery Operations
Average Amount
Average % of Sales
Gross Operating Sales $4,701,583 100.00% Cost of Goods Sold $2,178,897 46.34% Gross Profit $2,522,686 53.66% Depreciation and Amortization $202,760 4.31% Labor Expense* $317,765 6.76% Rental Expense Land* $1,255 0.03% Supplies* $42,002 0.89% Utilities* $64,910 1.38% Other Farm Expense* $299,571 6.37% Total Farm Expenses $1,931,489 41.08% Total Operating Income $591,197 12.57% Non Operating Income $47,531 1.01% Interest Expense $73,454 1.56% Income Before Taxes $565,274 12.02% Income Taxes $153,382 3.26% Net Income After Taxes $411,893 8.76% Extraordinary Gain/Losses $0 0.00%
Total Net Income $411,893 8.76% n = 7 ; * n = 6
There were only 6 observations of the 7 total that had sufficient information to
break down labor, land rent, supplies, utilities and other farm expenses. Therefore, the sum
of these variables does not equal the total average farm expenses number.
The retail operations show a significantly higher average gross sales amount than
the wholesale group did at $4,701,583 (Table 5.8). The retail operations also have higher
total expenses than the wholesale group does at $1,931,489. However, the retail operations
also have a higher total net income on average than the wholesale operations have at
36
$411,893. The retail operations average total net income is almost double of the wholesale
operations average total net income. The variance is higher for the retail operations than
for the wholesale operations. The standard deviation for gross sales, total farm expenses
and total net income for the retail operations are $8,976,431, $3,103,958 and $1,103,047
respectively (Appendix C).
5.6 Profitability Analysis
As a group, the operations are quite profitable. The average gross and net profit
margins are lower for the retail operations than the wholesale operations, but are still
acceptable at levels of 53.66%, and 8.76%, respectively (Table 5.9). The retail operations
have a higher average operating profit margin than the wholesale operations at 12.57%
versus 10.8% for the wholesale operations. The wholesale operations have gross,
operating, and net profit margins of 84.35% 10.8% and 9.07% respectively. The entire
group has an average gross profit margin of 75.99%, an operating profit margin of 11.28%
and a net profit margin of 8.98%.
The debt coverage is acceptable for both the retail and wholesale operations, but is
higher on average for the wholesale operations at 5.13 times versus 2.51 times for the retail
operations (Table 5.9).
The entire group has a return on assets (ROA) and return on equity (ROE) of 7.74%
and 12.57% respectively. These ratios are calculated as defined in chapter three. The
wholesale group has a higher ROA and ROE than the retail group does at 8.73% and
14.54%. The retail group’s ROA and ROE are 2.49% and 2.16% respectively (Table 5.9).

37
Overall, the retail operations have higher sales and higher total net income on
average than the wholesale operations. When you compare the two using ratio analysis, the
ratios are stronger for the wholesale operations and show that the wholesale group is
relatively more profitable than the retail group.
The New York study shows the same overall relationships for the wholesale and
retail operations, as did the Michigan operations. The New York retail operations also
show double the net income of the wholesale operations, but the net profit margins are
significantly lower for the retail operations versus the wholesale operations at 2.5% and
8.1% respectively.
Table 5.9 Profitability Ratio Analysis all Segments, Fiscal Year 2003
Table 5.10 illustrates the profitability ratios based on return on assets by quartile for
2003. The top 25% of the operations based on ROA had the highest operating profit
margin, net profit margin, ROA and ROE of all the quartiles. The 2nd quartile had the
strongest debt coverage ratio and the 3rd quartile had the highest gross profit margin. The
bottom quartile had the weakest profitability ratios across the board, and was the only
quartile to have negative values for net profit margin, ROA and ROE.
Entire Group Wholesale RetailGross Profit Margin 75.99% 84.35% 53.66%
Operating Profit Margin 11.28% 10.80% 12.57%Net Profit Margin 8.98% 9.07% 8.76%
ROA 7.74% 8.73% 2.49%ROE 12.57% 14.54% 2.16%
Debt Coverage 4.71 5.13 2.51

38
Table 5.10 Greenhouse and Nursery Profitability Comparisons, All Operations, by ROA Quartile, 2003
Business by ROA
Gross Profit Margin
Operating Profit Margin
Net Profit Margin
ROA ROE Debt Coverage Ratio
Top 25% 87.64% 22.73% 18.91% 16.50% 29.79% 5.172nd 25% 83.82% 12.36% 12.82% 8.96% 15.42% 7.113rd 25% 92.73% 9.09% 6.27% 5.60% 6.80% 4.14
Bottom 25% 74.64% -4.91% -4.45% -0.11% -1.73% 2.44
5.7 Efficiency Analysis
Efficiency analysis attempts to identify how well an asset base is being utilized. In
this study, the asset turnover ratio and working capital/ sales are the main identifiers of
efficiency, but labor and facility efficiency ratios are also analyzed. All 44 of the
operations responded as to the size of their operation, but 11 of the 44 operations did not
provide the number of labor hours for their operation. Two of the eleven operations that
did not respond to labor hours were in the retail segment and nine were in the wholesale
segment.
As defined by Investor Words.com, asset turnover is “A measure of how well assets
are being used to produce revenue.” The higher the ratio the more the assets are being
utilized. Table 5.11 shows that wholesale operations are more efficiently using their asset
base than the retail operations as their ratios are 0.68 and 0.45 respectively. In other words,
the wholesale operations have $0.68 cents in sales for every dollar in assets while the retail
operations have $0.45 in sales for every dollar in assets.
The retail segment has 38% less working capital (WC) to sales than the wholesale
group (Table 5.11). Both groups have WC/sales less than 15%. Because of a steadier cash

39
flow, the retail operations may have less working capital and at the same time maintain
operations versus the wholesale operations.
Table 5.11 Average Asset Turnover and Working Capital/Sales Efficiency Ratios, 2003
Both sales and total net income to total facility area are higher for the wholesale
operations than the retail operations (Table 5.12). The standard deviation for both groups is
quite high. However, the difference in total net income to total facility area is $0.79 higher
per square foot for the wholesale operations than the retail operations. On a percentage
basis, net income per square foot of total facility area is 877% higher for the wholesale
operations than the retail operations.
Working Capital/Sales Asset Turnover Entire Group 12.05% 0.65 Wholesale 12.84% 0.68 Retail 7.92% 0.45

40
Table 5.12 Detailed Efficiency Analysis for Michigan Greenhouse and Nursery Operations, Fiscal Year 2003 Entire Group N Mean Std. Deviation
Sales/Total Facility Area ($) 44 9.24 7.87 Net Income/Total Facility Area ($) 44 0.76 0.97
Total Facility Area/ Labor Hour (Square Feet) 44 49.76 161.74 Sales/ Labor Hour ($) 33 295.24 629.44
Net Income/ Labor Hour ($) 33 19.60 50.34 Working Capital/Sales (%) 44 12.05 31.57
Asset Turnover Ratio 44 0.65 0.33
Retail Operations Only N Mean Std. Deviation
Sales/Total Facility Area ($) 7 9.12 5.39 Net Income/Total Facility Area ($) 7 0.10 0.67 Total Facility Area/ Labor Hour (Square Feet) 7 4.51 4.13 Sales/ Labor Hour ($) 5 48.01 14.21 Net Income/ Labor Hour ($) 5 1.97 3.61 Working Capital/Sales (%) 7 7.92 21.83
Asset Turnover Ratio 7 0.45 0.38
Wholesale Operations Only N Mean Std. Deviation
Sales/Total Facility Area ($) 37 9.26 8.31 Net Income/Total Facility Area ($) 37 0.89 0.97 Total Facility Area/ Labor Hour (Square Feet) 37 58.32 175.41 Sales/ Labor Hour ($) 28 339.38 675.42 Net Income/ Labor Hour ($) 28 22.75 54.16 Working Capital/Sales (%) 37 12.84 33.27
Asset Turnover Ratio 37 0.68 0.31
The wholesale operations are quite a bit more efficient than the retail operations
when it comes to utilizing labor in comparison to sales and net income. The wholesale
operations have a sales per labor hour that is 606% higher than the retail operations at
$339.38 of gross sales per labor hour (Table 5.12). The retail operations’ sales per hour of
labor is $48.01. The standard deviation is quite high for the wholesale group indicating
that there is a great degree of variance from one operation to the next. Net income per

41
labor hour is $22.75 for the wholesale operations versus $1.97 for the retail operations.
This means that the net income per labor hour is a 1055% higher for the wholesale
operations than the retail operations.
The total square foot of facility area that is covered per labor hour tells how
efficiently labor is being utilized. In other words, it tells how many square feet of facility
are being cared for per one hour of labor. The higher the number of square feet covered,
the more efficient the operation utilizes their labor resources. The wholesale operations
have an average square foot of total facility area per labor hour of 58.32 sq ft/hour (Table
5.12). The retail operations have an average square foot of total facility area of 4.51 square
feet per labor hour. This ratio was used as a measure of labor efficiency versus labor cost
as a percentage of net income because the dollar amount of labor expense can be reported
in either cost of goods sold or selling, general and administrative expenses. The
breakdown of total labor expense was not able to be discerned from the financial
information provided whereas the total number of labor hours was provided in the survey.
Therefore, even though the income and expenses shows that labor cost is more for the
wholesale operations, there may be a considerable amount of labor in the cost of good sold
number for both the retail and wholesale operations that can not be accounted for.
Overall, the wholesale operations exhibit quite a bit more efficiency than the retail
operations as evidenced by the ratios presented. This may result from the fact that the
wholesale operations utilize much more onsite technology to control the environmental
conditions and to track inventory than do the retail operations. Thus, the increase in
technology at the wholesale operations replaces the need for additional labor per square

42
foot of facility area and potential extra space for inventory that is needed at the retail
operations. The use of onsite-computerized technology for inventory tracking and
environmental controls was shown to be used by a greater percentage of the wholesale
operations than the retail operations as illustrated in table 5.1.
Comparatively, the New York study shows the same results as the Michigan study
with the wholesale operations having more square feet per labor hour covered than do the
retail operations.
Table 5.13 illustrates the average values for the defined efficiency ratios based on
return on assets (ROA) by quartile for 2003. Overall the top quartile based on ROA had
the largest average total facility area and had more than double the average sales amount
than the other quartiles. In addition to this, the top quartile showed the most efficient use of
each operation as demonstrated by sales and net income per total facility area and the
strongest sales and net income per labor hour.
The operations in the 3rd quartile had the highest asset turnover ratio and highest
percentage of working capital to sales (Table 5.13).
Table 5.13 Greenhouse Business Efficiency Comparisons: All operations, By Return On Assets Quartile, 2003
Business by ROA
Greenhouse Size
Sales Total Net Income
Sales/ Total
Facility Area
Net Income / Total Facility
Area
Total Facility Area/Labor
Hour
Sales/ Labor Hour
Net Income/ Labor Hour
Asset Turnover
Ratio
Working Capital /
Sales
Top 25% 542,538 ft2 $5,549,226 $692,689 $10.74 $1.62 45.94 ft2 $421.43 $42.46 0.76 13.55%2nd 25% 255,301ft2 $1,996,295 $201,214 $9.78 $1.04 27.65 ft2 $229.52 $13.52 0.64 4.48%3rd 25% 457,878 ft2 $2,068,287 $113,381 $9.48 $0.50 99.43 ft2 $215.38 $5.54 0.77 17.52%
Bottom 25% 212,297 ft2 $1,372,075 -$20,287 $6.96 -$0.11 26.01 ft2 $281.33 -$1.98 0.41 12.68%

43
5.8 Regression Analysis
As stated in the theory and methods sections, the regression analysis was
completed using return on asset (ROA) as the dependent variable with net profit margin
(NPM), owner equity and working capital to sales as the independent variables (Table
5.14). NPM was expected to have a positive coefficient as the larger the net income the
higher the return would be to the asset base. The working capital to sales coefficient did
not have an expected sign, as it is not known how working capital to sales affects ROA.
The coefficient for owner equity could be either positive or negative.

44
Table 5.14 Regression Analysis- ROA Dependent Variable: ROA Method: Least Squares Sample: 1 44 Included observations: 44
Variable Coefficient Std. Error t-Statistic Prob. C 0.074505 0.017086 4.360640 0.0001
NPM 0.434335 0.041170 10.54991 0.0000 WC_SALES01 0.013050 0.018057 0.722701 0.4741
OE -0.054318 0.024798 -2.190379 0.0344 R-squared 0.752403 Mean dependent var 0.077403 Adjusted R-squared 0.733833 S.E. of regression 0.035879
The adjusted R-squared figure in Table 5.14 indicates that over 73% of the
variability in ROA is explained by the independent variables. The average ROA based on
this output is 7.7%, and the standard error of regression in this scenario predicated that
ROA will range between 1.7% and 13.7% 95% of the time. As predicted, NPM has a
positive coefficient and is a strong predictor of ROA. The only variable that was not
statistically significant was working capital to sales. Owner equity is negative and is not
statistically significant. Hence, it does not explain a portion of the variability to ROA.
Therefore, solvency is an indicator of ROA, but liquidity is not.
5.9 Wholesale Segment Analysis
The 37 wholesale operations that had sufficient financial information to complete
the financial analysis sold their product to box stores, retail garden centers, other retail
centers, landscape companies and to re-wholesalers/brokers. Of these 37 firms, 2 sold a
majority of their product to landscape firms, 5 sold the principal amount of their product to
box stores, 6 sold to retail garden centers and 21 sold the majority of their product to
brokers. There were two operations that did not sell at least 50% of their product to any

45
one of these distribution outlets and therefore are not classified in any of these groups.
Although the wholesale operations did sell to other retail centers, none of the operations
sold at least 50% of their product through this distribution channel. Because of the limited
number of firms that sold a majority of their product to landscape firms, this segment is not
analyzed individually.
Table 5.l5 shows the average balance sheets for the operations that sold their
product to the respective distribution channels. On average, the balance sheets were
relatively similar for the operations no matter what distribution channel they used. Overall,
those operations that sold to box centers had a larger asset base than operations who sold a
majority of their product elsewhere (Table 5.16).

46
Table 5.15 Comparative Average Balance Sheet for Wholesale Operations by Distribution Channel, Fiscal Year 2003 Box Stores Retail Broker Cash 231793.00 88124.17 125508.57 Marketable Bonds & Securities .00 10833.33 23079.76 Current Accounts Receivable 566524.80 197753.50 158357.86 Inventory 29800.00 49033.33 37476.19 Growing Crops .00 43333.33 48196.67 Prepaids 190272.60 114049.17 116363.00 Other Current Assets 81201.20 .00 27235.19 Total Current Assets 1099591.60 503126.83 536217.24 Machinery & Equipment 553688.40 571198.83 277076.10 Vehicles 221580.00 11916.67 42047.62 Non Current Accounts Receivable .00 .00 47.62
Not Readily Mkt Bonds & Securities 152661.60 52563.83 122376.14
Real Estate 3475128.80 1365227.00 1339379.10 Other Non Current Assets 84060.00 8906.50 222884.14 Total Non Current Assets 4487118.80 2009812.83 2003810.71 Total Assets 5586710.40 2512939.67 2540027.95 Accounts Payable 237948.00 100404.50 104138.52 Operating Loan 365801.00 64029.33 102453.10 Current Portion Long Term Debt 130024.80 24342.17 89565.52 Accrued Interest 16651.80 3702.83 16849.38 Other Current Liabilities .00 1465.17 1057.71 Total Current Liabilities 750425.80 193944.00 314064.24 Long Term Debt 768380.60 454907.17 542673.43 Other Non Current Liabilities .00 .00 .00 Total Non Current Liabilities 768380.60 454907.17 542673.43 Total Liabilities 1518806.40 648851.17 856737.67 Total Equity 4067904.00 1864088.50 1683290.29
n = 5 n = 6 n = 21

47
Table 5.16 Average Asset Base Comparison by Distribution Channel Box Stores Retail Broker Total Current Assets $1,099,592 $503,127 $536,217 Total Non Current Assets $4,487,119 $2,009,813 $2,003,811 Total Assets $5,586,710 $2,512,940 $2,540,028 % of assets in Current portion 19.68% 20.02% 21.11% % of assets in non-current portion 80.32% 79.98% 78.89%
On average, gross sales and net income were highest for those operations that sold
their product to box stores (Table 5.17). The operations that sold their product to retail
garden centers and brokers had relatively similar gross sales and net income.
Table 5.17 Comparative Average Wholesale Income Statement by Distribution Channel, Fiscal Year 2003 Box Stores Retail Broker Gross Operating Sales 4395689.80 2271998.67 2016589.86 Cost of Goods Sold 1207558.80 83571.83 253981.81 Gross Profit 3188131.00 2188426.83 1762608.05 Depreciation and Amortization 221598.20 111312.83 132722.52
Labor Expense 613677.50 585414.67 489346.76 Rental Expense Land 21750.00 70448.67 16876.05 Supplies 184458.00 141563.17 191971.29 Utilities 207243.75 147462.67 91990.57 Other Farm Expense 1253751.50 984767.17 554992.48 Total Farm Expenses 2750182.80 2040968.33 1477898.24 Total Operating Income 437948.20 147458.50 284709.81 Non Operating Income 12997.00 35647.17 28253.05 Interest Expense 90087.80 31740.67 42868.81 Income Before Taxes 360857.40 151365.00 270094.05 Income Taxes 7148.40 9832.00 25484.52 Net Income After Taxes 353709.00 141533.00 244609.52 Extraordinary Gain/Losses .00 .00 .95
Total Net Income 353709.00 141533.00 244610.48
n = 5 n = 6 n = 21

48
Although the numbers are relatively similar on a value basis between the wholesale
segments by distribution channel, the ratios tell another story. Comparatively, net profit
margin is highest for the operations that sell the majority of their product to brokers
(13.71%) and the smallest profit margins are held by those operations that sell to box stores
(3.60) (Table 5.18). Return on asset and return on equity are highest for the operations that
sell to brokers at 10.18% and 17.12% respectively. The debt coverage ratio is highest for
the firms that sell to retail operations at 10.82. From a liquidity standpoint the operations
that sell to retails firms are the most liquid with a current ratio of 4.49. Owner equity is
highest for those operations that sell to box stores and retail centers at 77.72% and 74.65%
respectively. The firms that sell to brokers have the lowest average owner equity position
at 64.33%. The operations selling product to the retail firms have the highest asset turnover
and have the highest percentage of working capital to sales. Labor efficiency is strongest
for those operations that sell to the box stores and the operations that sell their product to
the retail firms has the lowest labor efficiency. The facility area based on sales and net
income per square foot of the total facility area is most efficiently used by those operations
that sell to retail garden centers and brokers.

49
Table 5.18 Comparative Ratio Analysis Wholesale Operations by Distribution Channel, Fiscal Year 2003 Box Stores Retail Broker Gross Profit Margin 86.87% 89.09% 93.47% Operating Profit Margin 4.61% 7.47% 15.74% Net Profit Margin 3.60% 8.86% 13.71% ROA 4.08% 7.77% 10.18% ROE 4.66% 8.95% 17.12% Debt Coverage Ratio 2.97 10.82 4.72 Working Capital $349,165 $309,182 $222,153 Working Capital/Sales 13.43% 14.89% 3.87% Working Capital/Assets 16.93% 12.713% 1.94% Current Ratio 1.85 4.49 1.71 Owner Equity 77.72% 74.65% 64.33% Asset Turnover Ratio .61 .74 .68 Sales/Work Hour $1234.66 $70.98 $219.31 Net Income/Work Hour $59.82 $6.82 $23.90 Total Greenhouse Area/WkHr 115.58 Ft2 8.05 Ft2 15.58 Ft2 Sales/Total Facility Area $7.49 $11.70 $10.33 NI/Total Facility Area $.34 $.99 $1.16
Table 5.19 shows the efficiency comparison on the wholesale operations only by quartile
based on return on assets (ROA). The table illustrates that the first quartile on average has
the third smallest facility area and at the same time has the highest dollar value of sales. In
addition, this first quartile exhibits the highest dollars in sales and net income per total
facility area, but shows the least amount of total facility area and gross sales per labor hour.
The bottom quartile has the largest average total facility area, lowest gross sales and net
income of all of the quartiles and has the highest working capital to sales percentage on
average of all of the quartiles.

50
Table 5.19 Greenhouse Business Efficiency Comparisons: Wholesale Operations, By Return On Assets Quartile, 2003
Business by ROA
Greenhouse Size
Sales Total Net Income
Sales/ Total
Facility Area
Net Income / Total Facility
Area
Total Facility Area/Labor
Hour
Sales/ Labor Hour
Net Income/ Labor Hour
Asset Turnover
Ratio
Working Capital / Sales
Top 25% 232,342 ft2 $2,893,979.78 $432,103.22 $11.11 $1.78 16.48 ft2 $116.83 $21.71 0.73 16.51%2nd 25% 334,284 ft2 $2,668,315.20 $252,368.80 $9.66 $1.03 53.68 ft2 $584.55 $31.21 0.64 4.11%3rd 25% 224,600 ft2 $2,314,887.22 $167,460.67 $10.44 $0.72 19.15 ft2 $345.92 $14.44 0.76 9.34%
Bottom 25% 544,766 ft2 $1,596,740.89 $5,994.44 $5.79 $0.01 144.48 ft2 $342.96 $0.85 0.60 22.35%
Table 5.20 illustrates that based on return on assets (ROA )the top quartile has the highest
operating and net profit margins, ROA and return on equity, but has a lower debt coverage
on average than the second quartile. The bottom quartile has the highest gross profit
margin but has the lowest values on average for the rest of the profitability measures.
Table 5.20 Greenhouse Business Profitability Comparisons: Wholesale Operations, By Return On Assets Quartile, 2003
Business by ROA
Gross Profit Margin
Operating Profit Margin
Net Profit Margin
ROA ROE Debt Coverage
RatioTop 25% 95.67% 24.78% 20.89% 17.29% 32.25% 4.852nd 25% 77.60% 11.10% 12.90% 9.49% 16.84% 7.233rd 25% 92.89% 12.44% 8.00% 6.79% 8.40% 4.56
Bottom 25% 98.11% 1.44% 1.33% 1.27% 0.40% 3.64
5.10 Summary
The chapter presented the results of the financial and regression analysis for this
study including quartile analysis for all operations and the wholesale operations only.
Because of the small number of retail operations included in this analysis, there are
limitations on the conclusions that can be drawn from this study as the results may not be
representative of the industry.

51
CHAPTER 6: CONCLUSION
6.1 Overview
Financial analysis is necessary for improved management of greenhouse and
nursery operations in Michigan and across the country. As the industry continues to
change, this will become more vital. Limited research has been done in this area because
of the proprietary aspects of the financial information required to complete the analysis.
Many operations simply do not want to share their financial and production information
because of competition in the industry. However, to stay viable in a more competitive
setting, it is important to understand the financial position is of a company. To benchmark a
company against other similar operations leads to operations developing better practices to
become more efficient and gain financial strength.
This research was designed to provide producers within the industry as well as
service providers that deal with these operations, the information needed to understand the
variables that affect these firms. The goal was to provide accurate financial information
that could be used by producers and service providers within the industry as a means of
improving operations.
The results suggest that the wholesale segment was more financially sound in 2003
as well as more efficient than the retail segment. The wholesale operations showed a
stronger solvency position, exhibited more liquidity, and had a higher net profit margin and
return on assets than retail operations.
One may conclude that the wholesale operations are more efficient in both labor
and use of facilities as a result of an increased use in computerization to manage inventory

52
and environmental conditions when comparing the square feet of facility area per labor
hour and net income per square feet of facility area. This increased use in technology
allows the wholesale operations to reduce labor expenses and get more saleable product per
square foot of facility area.
There are multiple reasons that may explain why the wholesale operations have a
higher net profit margin in this study as compared to the retail operations. The gains in
labor and facility efficiencies are two possible reasons for the higher net profit margins on
the wholesale side. However, there may be some unexplained reasons in this report as to
why the retail side is showing lower net income. One of these unproven reasons is that
there are generally more cash transactions handled at a retail operation than a wholesale
operation. If the cash transactions are not reported by the retail operations and are slid
under the table then there could possibly be an under reporting of actual earnings by the
retail operations. The other area that was studied in this analysis was shrink. There could
possibly be a much higher shrink factor on the retail side that would lower sales, and at the
same time increase expenses. As previously discussed in the regression analysis section it
is difficult to explain the variability in net profit margin and this study provides a slim
margin of information that proves why the wholesale operations have a higher net profit
margin than the retail operations. Another item to again mention is that because of the
limited number of retail operations that participated in the survey, the results may not be
representative of the industry as a whole.
In the segmentation of the wholesale segment, those operations that sell the
majority of their product to brokers and retail garden centers are the most profitable, have

53
the highest debt coverage ratio and have the highest sales and net income per square feet of
facility area. The wholesale operations that sell the majority of their product to box stores
are the most solvent and utilize their labor resources most efficiently.
The regression analysis showed that it is difficult to predict the variability in
profitability, and that net profit margin and solvency are predictors of return on assets while
liquidity is not.
6.2 Limitations of the Research
Although the response rate was good for a survey at over 45%, the number of retail
operations that participated in the survey limited the scope of that portion of the research.
The data results for the sample consist of 27.3% of sales throughout the state of Michigan.
However, the conclusions about that segment of the industry are still limited.
6.3 Future Research
The regression analysis indicated that net profit margin and solvency were
indicators of ROA. However, it would be beneficial for future research to do a more robust
study that includes cost accounting and shrink numbers in order to determine what other
factors if any predict the variability in profitability. It would also be beneficial to analyze
more years in order to study the trends of the industry over time.

54
REFERENCES
American Nursery and Landscape Association Website, 2004 <http://www.anla.org/industry/indes.htm> (November 5, 2004).
Brumfield, R.G. Economic and Marketing Issues From a Grower’s Perspective. Washington DC: U.S. Department of Agriculture. 2003
Brumfield, R.G., E. K. Mafoua. “Risk Management for Greenhouse and Nursery Growers in the United States.” Department of Agricultural Economics. FS1001, The State University of New Jersey, Rutgers, 2002.
ERS at USDA, Floriculture and Nursery Crop Outlook Report, September 2004, <http:www.ers.usda.gov/publications/flo/sep04/FL003.pdf> (March 4, 2005).
Investor Words.com Website, 2005 <http://www.investorwords.com/2245/gross_margin.html> (January 6, 2005)
Investor Words.com Website, 2005 <http://www.investorwords.com/3260/net_profit_margin.html> (January 6, 2005)
Investor Words.com Website, 2005 <http://www.investorwords.com/5932/operating_profit_margin.html > (January 6, 2005).
Michigan Farm Bureau Website, 2005 <http://www.michiganfarmbureau.com/press/2005/20050519.php> (May 19, 2005).
NASS at USDA, Michigan 2003-2004 Highlights, October 2004, <http:www.nass.usda.gov/mi/templates/STHILGTS.pdf> (February 17, 2005).
Studenmund, A.H. Using Econometrics: A Practical Guide. Boston: Addison Wesley Longman, Inc., 2001
Uva, W. and S. Richards. “New York Greenhouse Business Summary and Financial Analysis.” Department of Applied Economics and Management. EB2003-12, Cornell University, 2003.
van Blokland, P.J. “Enhancing Profitability in Greenhouse Firms.” SCSB 401, Southern Cooperative Series Bulletin, 2002.

55
APPENDIX A: SURVEY
March 17, 2005 Dear «Proper_Name», Being involved in the green industry, you understand the value of obtaining greater efficiencies to increase profits. Your operation was identified as belonging to the greenhouse and/or nursery industry based on GreenStones’ records. As a Masters student and a GreenStone employee, I established a goal to develop a thesis project that will be beneficial to three interested parties: GreenStone customers, GreenStone as an organization, and myself as a lending professional. Enclosed with this letter is a survey and self-addressed return envelope pertaining to my thesis project. My project involves an efficiency and profitability study on various segments within the green industry. I am completing this project as part of the Masters in Agribusiness program at Kansas State University. This study will identify several characteristics of the nursery and greenhouse operations located throughout Michigan. The project analysis will help draw conclusions that will help improve the profitability and efficiency of operations in the green industry and will assist those who provide a multitude of services to those operations. I believe this project will provide a service to you, our customer, by helping you understand the factors that create the greatest efficiency and are highly correlated with profitability. The project will also help GreenStone and myself as a lending professional, by providing us with a greater understanding of your industry which will help us serve you better. As a GreenStone customer, your survey responses will be matched with your financial information on file. If you would like a condensed copy of the thesis results, check “yes” to the final question of the survey and a copy will be mailed to you at no charge. The survey will take about 20 minutes to complete. Your answers will be kept confidential and will be used only for the purposes of this study. Your name is needed so it can be matched with the financial information on file. The information you provide will not be seen on an individual basis by any GreenStone employee other than myself and will have no affect on your current relationship with GreenStone. The results will only be presented as a combined analysis with all other survey respondents. Please return the completed survey to me using the self-addressed stamped envelope by April 7, 2005. A similar study was completed at Cornell University and can be viewed via the following web address: http://aem.cornell.edu/outreach/extensionpdf/eb0312.pdf. Feel free to contact me if you have any comments, questions or concerns about the survey or the study. Thank you for your time and assistance with this project. Sincerely, Cindy M. Birchmeier Commercial Producer- FSO/Analyst [email protected] (517) 318-5361

56
PLEASE RETURN THE COMPLETED SURVEY BY APRIL 7, 2005. «Proper_Name» «Number»
Demographics
1. How many years has your operation been in business? _______________________ 2. Location(s) of operation (List City and County)? ____________________________
____________________________________________________________________________________________________________________________________
3. Does your business operate a nursery/greenhouse in another state? ____yes ____no If yes, where? _______________________________________________________
Ownership/Labor
4. Is your operation solely Family Owned and operated? _____________ 5. What is the ownership structure of your operation?
Partnership ______ Limited Liability Corporation ______ Incorporation ______ Limited Liability Partnership ______ Sole proprietorship ______ If other please explain _______________________________________________
6. Is your operation structured to have multiple entities? ___________________
If yes, please list the multiple entities and explain the purpose of each entity (Operating, real estate holding, etc.). _________________________________________________________________________________________________________________________________________________________________________________________________________
7. List the title of the individual that handles the following activities within your operation and state if the person with this title is a family member to the owner/manager of the operation.
Production ____________________________________________________________ Marketing _____________________________________________________________ Personnel Management __________________________________________________ Finance _______________________________________________________________
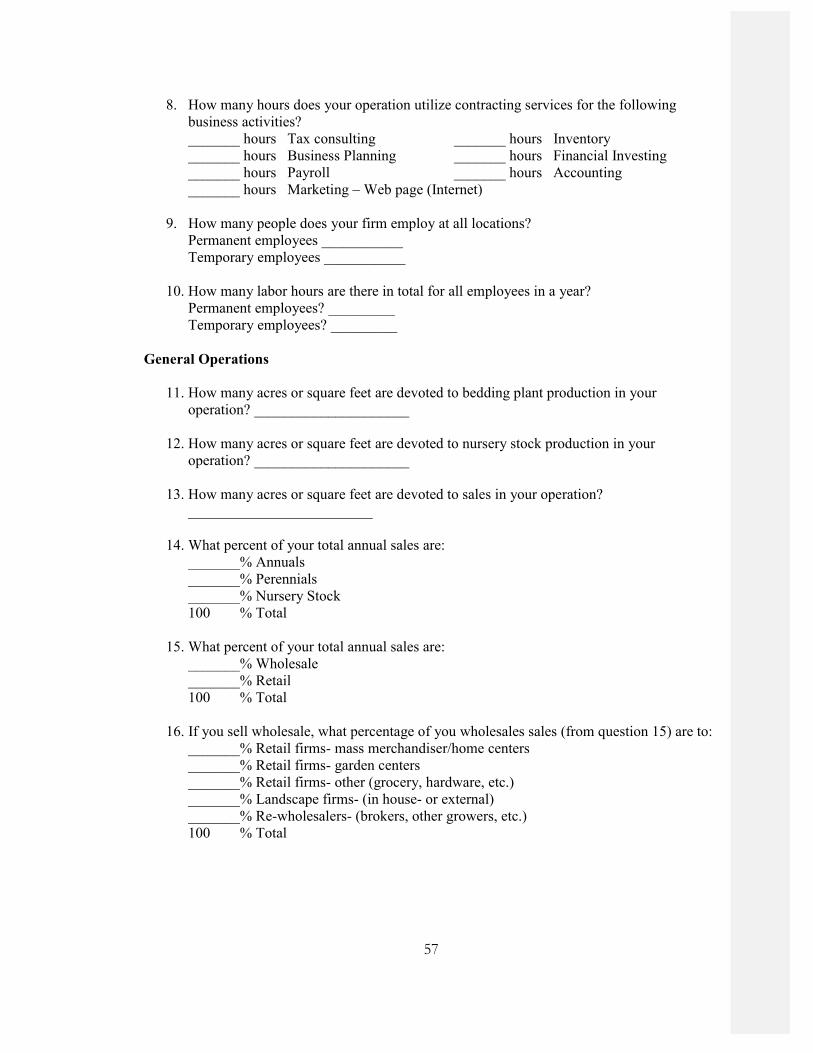
57
8. How many hours does your operation utilize contracting services for the following business activities?
_______ hours Tax consulting _______ hours Inventory _______ hours Business Planning _______ hours Financial Investing _______ hours Payroll _______ hours Accounting
_______ hours Marketing – Web page (Internet) 9. How many people does your firm employ at all locations?
Permanent employees ___________ Temporary employees ___________
10. How many labor hours are there in total for all employees in a year?
Permanent employees? _________ Temporary employees? _________
General Operations
11. How many acres or square feet are devoted to bedding plant production in your operation? _____________________
12. How many acres or square feet are devoted to nursery stock production in your
operation? _____________________ 13. How many acres or square feet are devoted to sales in your operation?
_________________________ 14. What percent of your total annual sales are: _______% Annuals _______% Perennials _______% Nursery Stock 100 % Total
15. What percent of your total annual sales are:
_______% Wholesale _______% Retail 100 % Total
16. If you sell wholesale, what percentage of you wholesales sales (from question 15) are to:
_______% Retail firms- mass merchandiser/home centers _______% Retail firms- garden centers _______% Retail firms- other (grocery, hardware, etc.) _______% Landscape firms- (in house- or external) _______% Re-wholesalers- (brokers, other growers, etc.) 100 % Total

58
17. What are your hours of operation for each month of the year? January ________ February ________ March _______
April ________ May ________ June _______ July ________ August ________ September _______ October ________ November ________ December _______ 18. What percentage of your operation’s total sales occurs during each month? ____ % January ____ % February ____ % March ____ % April ____ % May ____ % June ____ % July ____ % August ____ % September ____ % October ____ % November ____ % December 19. What functions of your operation are computerized? Function Check if computer is currently utilized for task Accounting _______________________ Inventory _______________________ Financial Investments _______________________ Banking (wires/ACH) _______________________ Marketing – Web page (Internet) _______________________ Communications – E-mail _______________________ Faxing _______________________ Landscape design _______________________ Production scheduling _______________________ Greenhouse production controls _______________________ Other (please specify) _______________________ 20. Please rate each of the factors listed below according to how much they impact your
business. Use a 1 to 5 scale, with 1=very minor; 2=minor; 3=neutral; 4=important; 5=very important.
Weather uncertainty ______ Competition ______
Land ______ Environmental regulations ______ Market demand ______ Other gov’t regulations ______ Labor ______ Employee turnover ______ Water Supply ______ Own managerial expertise ______ Capital ______
21. Would you like a condensed copy of the thesis report once the results are compiled? It is
at no cost to you. (Check yes or no) ___________ Yes ___________ No

59
APPENDIX B: BALANCE SHEETS
Michigan Greenhouse and Nursery Operations, Entire Group, 2003 Balance Sheet
N Mean Std. Deviation Cash 44 120,565.14 200,126.34 Marketable Bonds & Securities 44 21,366.48 53,414.54
Current Accounts Receivable 44 205,554.16 479,175.55
Inventory 44 136,524.14 426,775.86 Growing Crops 44 95,186.93 301,950.45 Prepaids 44 102,825.50 209,548.25 Other Current Assets 44 30,175.89 94,686.58 Total Current Assets 44 712,198.23 994,104.72 Machinery & Equipment 44 607,451.50 1,856,233.06 Vehicles 44 57,215.50 117,717.86 Non Current Accounts Receivable 44 -3604.09 24,923.66
Not Readily Mkt Bonds & Securities 44 86,473.50 113,363.29
Real Estate 44 1,726,794.86 1,783,354.20 Other Non Current Assets 44 133,781.95 427,203.05 Total Non Current Assets 44 2,608,113.23 3,222,680.70 Total Assets 44 3,320,311.45 4,070,166.49 Accounts Payable 44 136,325.66 292,077.30 Operating Loan 44 179,099.98 269,492.42 Current Portion Long Term Debt 44 77,480.23 142,601.04
Accrued Interest 44 13,776.41 35,619.78 Other Current Liabilities 44 88,570.91 572,830.00 Total Current Liabilities 44 495,253.20 981,282.88 Long Term Debt 44 628,763.41 889,651.05 Other Non Current Liabilities 44 24,750.00 164,172.92
Total Non Current Liabilities 44 653,513.41 946,060.17
Total Liabilities 44 1,148,766.59 1,783,270.10 Total Equity 44 2,171,544.86 2,534,539.30 Valid N (listwise) 44

60
Michigan Retail Greenhouse and Nursery Operations, 2003 Balance Sheet
N Mean Std. Deviation Cash 7 99,412.57 166,335.07 Marketable Bonds & Securities 7 32,282.29 52,329.17
Current Accounts Receivable 7 143,269.14 285,193.69
Inventory 7 574,012.29 946,717.06 Growing Crops 7 21,428.57 36,759.83 Prepaids 7 20,248.14 31,623.70 Other Current Assets 7 49,970.57 119,497.82 Total Current Assets 7 940,623.57 1,464,259.73 Machinery & Equipment 7 1,904,716.14 4,614,369.22 Vehicles 7 30,083.14 45,523.50 Non Current Accounts Receivable 7 785.71 2078.80
Not Readily Mkt Bonds & Securities 7 15,142.86 25,712.69
Real Estate 7 2,127,581.00 1,513,920.79 Other Non Current Assets 7 88,157.14 129,780.42 Total Non Current Assets 7 4,166,466.00 6,136,864.55 Total Assets 7 5,107,089.57 7,592,611.31 Accounts Payable 7 242,918.57 506,072.62 Operating Loan 7 263,409.43 246,257.87 Current Portion Long Term Debt 7 67,222.57 81,562.95
Accrued Interest 7 10,865.57 14,210.47 Other Current Liabilities 7 550,688.71 1,433,582.08 Total Current Liabilities 7 1,135,104.86 2,189,771.12 Long Term Debt 7 819,616.00 726,398.63 Other Non Current Liabilities 7 155,571.43 411,603.31
Total Non Current Liabilities 7 975,187.43 1,084,779.19
Total Liabilities 7 2,110,292.14 3,236,392.80 Total Equity 7 2,996,797.43 4,418,260.12 Valid N (listwise) 7

61
Michigan Wholesale Greenhouse and Nursery Operations, 2003 Balance Sheet
N Mean Std. Deviation Cash 37 124,566.97 207,661.92 Marketable Bonds & Securities 37 19,301.32 54,073.49
Current Accounts Receivable 37 217,337.81 509,708.24
Inventory 37 53,756.11 154,653.53 Growing Crops 37 109,141.22 327,748.67 Prepaids 37 118,448.24 225,178.08 Other Current Assets 37 26,430.95 90,765.03 Total Current Assets 37 668,982.62 900,552.51 Machinery & Equipment 37 362,023.05 421,553.42 Vehicles 37 62,348.65 126,634.84 Non Current Accounts Receivable 37 -4434.59 27,144.04
Not Readily Mkt Bonds & Securities 37 99,968.49 118,589.12
Real Estate 37 1,650,970.46 1,838,373.95 Other Non Current Assets 37 142,413.68 463,357.89 Total Non Current Assets 37 2,313,289.73 2,359,389.59 Total Assets 37 2,982,272.35 3,072,668.31 Accounts Payable 37 116,159.43 237,875.73 Operating Loan 37 163,149.54 273,856.08 Current Portion Long Term Debt 37 79,420.86 152,170.99
Accrued Interest 37 14,327.11 38,468.92 Other Current Liabilities 37 1143.22 5632.31 Total Current Liabilities 37 374,200.19 506,259.26 Long Term Debt 37 592,656.16 921,418.83 Other Non Current Liabilities 37 .00 .00
Total Non Current Liabilities 37 592,656.16 921,418.83
Total Liabilities 37 966,856.35 1,356,063.72 Total Equity 37 2,015,416.00 2,064,460.51 Valid N (listwise) 37

62
APPENDIX C: INCOME STATEMENTS All Michigan Greenhouse and Nursery Operations, Entire Group, 2003 Income Statement
N Mean Std. Deviation Gross Operating Sales 44 2,746,470.50 4,430,064.48 Cost of Goods Sold 44 659,478.75 1,992,871.66 Gross Profit 44 2,086,991.75 2,759,107.26 Depreciation and Amortization 44 144,158.77 272,,477.29
Labor Expense 42 492,956.45 742,795.07 Rental Expense Land 42 22,559.52 36,494.99 Supplies 42 158,014.17 257,536.15 Utilities 42 107,031.24 113,964.13 Other Farm Expense 42 661,899.52 930519.45 Total Farm Expenses 44 1,777,131.84 2,193,335.42 Total Operating Income 44 309,859.91 694,010.70 Non Operating Income 44 29,651.86 54,523.29 Interest Expense 44 53,879.61 74,672.00 Income Before Taxes 44 285,632.16 634,196.41 Income Taxes 44 38,883.50 149,155.78 Net Income After Taxes 44 246,748.66 511,835.11 Extraordinary Gain/Losses 44 .45 3.01
Total Net Income 44 246,749.11 511,834.96 Valid N (listwise) 42

63
Michigan Wholesale Greenhouse and Nursery Operations, 2003 Income Statement
N Mean Std. Deviation Gross Operating Sales 37 2,376,584.41 3,021,303.60 Cost of Goods Sold 37 372,021.30 1,039,165.70 Gross Profit 37 2,004,563.11 2,324,318.34 Depreciation and Amortization 37 133,072.11 ,246,780.92
Labor Expense 36 522,155.11 792,517.72 Rental Expense Land 36 26,110.28 38,320.17 Supplies 36 177,349.56 271,291.04 Utilities 36 114,051.47 119,550.91 Other Farm Expense 36 722,287.58 988,246.44 Total Farm Expenses 37 1,747,929.11 2,033,437.90 Total Operating Income 37 256,634.00 3,757,58.698 Non Operating Income 37 26,269.24 54,420.36 Interest Expense 37 50,176.35 70,628.90 Income Before Taxes 37 232,726.89 324,801.17 Income Taxes 37 17,221.68 42,744.72 Net Income After Taxes 37 215,505.22 322,216.14 Extraordinary Gain/Losses 37 .54 3.28
Total Net Income 37 215,505.76 322,215.91 Valid N (listwise) 36

64
Michigan Retail Greenhouse and Nursery Operations Only, 2003 Income Statement
N Mean Std. Deviation Gross Operating Sales 7 4701582.71 8,976,431.39 Cost of Goods Sold 7 2178896.71 4,333,650.61 Gross Profit 7 2522686.00 4,677,540.74 Depreciation and Amortization 7 202759.71 402,382.66
Labor Expense 6 317764.50 291,110.77 Rental Expense Land 6 1255.00 2639.23 Supplies 6 42001.83 99,144.85 Utilities 6 64909.83 63,002.47 Other Farm Expense 6 299571.17 282,653.82 Total Farm Expenses 7 1931489.14 3,103,957.84 Total Operating Income 7 591196.86 1,579,509.80 Non Operating Income 7 47531.43 55,605.91 Interest Expense 7 73454.00 97,459.95 Income Before Taxes 7 565274.29 1,463,216.21 Income Taxes 7 153381.71 360,955.59 Net Income After Taxes 7 411892.57 1,103,046.62 Extraordinary Gain/Losses 7 .00 .00
Total Net Income 7 411892.57 1,103,046.62 Valid N (listwise) 6