master of science in maritime science master …
TRANSCRIPT

MASTER OF SCIENCE IN MARITIME SCIENCE
MASTER DISSERTATION
Academic year 2017 – 2018
The role of public agents in sustainable intermodal transport network: an
international comparison.
Cassandra Van Bossche
Submitted in partial fulfillment of the requirements for the degree of: Master of Science in Maritime Science
Supervisor: Prof. Dr. Cathy Macharis
Assessor: Dr. Tom Vermeiren


I
ACKNOWLEDGEMENTS
This master dissertation means the end of my student years and more specific, the end of the
programme Maritime Science. Last year I graduated in a Master Public Administration and
Management and I started this programme with the purpose of working in the public sector and
more specific in a maritime context. Therefore, I was looking for a topic whereby I could combine
knowledge of both master degrees. Thanks to prof. dr. Cathy Macharis and dr. Tom Vermeiren I
had the possibility to combine both master degrees in a thesis research. Therefore, I would like
to thank them for this opportunity and I want to express my gratitude to dr. Vermeiren for his
guidance and advice.
I would also like to thank the various government bodies and terminal operators for their time
and cooperation. Thanks to their enthusiasm about my thesis, I was able to plan a lot of interviews
in a short time.
Also my friend, Dagmar Stockman, deserves an acknowledgement for encouraging and advising
me. But also my boyfriend who supported me throughout the whole process and who showed
great patience. Last but not least, I would like to thank my parents who gave me the opportunity
to study and to graduate twice. Doing this research was not possible without their unconditional
support and understanding. My father I would also want to thank for proofreading my thesis and
my mother for believing in me.
Thank you.
Cassandra Van Bossche
August 2018, Ghent
II
TABLE OF CONTENTS
ACKNOWLEDGEMENTS ............................................................................................................... I
TABLE OF CONTENTS ................................................................................................................ II
ABBREVIATIONS ......................................................................................................................... IV
LIST OF TABLES AND FIGURES ................................................................................................ V
TABLES ............................................................................................................................................. V FIGURES ............................................................................................................................................ V
INTRODUCTION........................................................................................................................... 1
PART 1. THEORETICAL FRAME ............................................................................................... 3
1.1. THE EVOLUTION OF FREIGHT TRANSPORT ............................................................................. 3 1.2. THE DIFFERENT TRANSPORT MODES ...................................................................................... 7 1.2.1. ROAD TRANSPORT ...................................................................................................................... 8 1.2.2. RAIL TRANSPORT ...................................................................................................................... 11 1.2.3. WATERBORNE TRANSPORT ....................................................................................................... 12 1.2.4. SUMMARY ................................................................................................................................. 15 1.3. INTERMODAL TRANSPORT .................................................................................................... 17 1.3.1. DEFINING THE CONCEPT ........................................................................................................... 17 1.3.2. INTERMODAL TRANSPORT CHAIN ............................................................................................. 19 1.3.3. BENEFITS AND DRAWBACKS ...................................................................................................... 21 1.4. ROLES OF THE GOVERNMENT ................................................................................................ 23
PART 2. EMPIRICAL FRAME .................................................................................................... 24
2.1 PROBLEM DEFINITION ............................................................................................................ 24 2.2 RESEARCH QUESTION AND SCOPE .......................................................................................... 25 2.3 RESEARCH DESIGN ................................................................................................................. 26
PART 3. RESULTS....................................................................................................................... 29
3.1 EU LEVEL ............................................................................................................................... 29 3.2 NATIONAL LEVEL ................................................................................................................... 33 3.2.1 BELGIUM .................................................................................................................................... 34 3.2.1.1 Federal government........................................................................................................... 34 3.2.1.2 Regional government ........................................................................................................ 38

III
3.2.1.3 Flemish government .......................................................................................................... 40 3.2.1.4 Walloon government ......................................................................................................... 45 3.2.1.5 Provincial and local government .................................................................................... 46 3.2.2 THE NETHERLANDS ................................................................................................................... 49 3.2.2.1 Central government ........................................................................................................... 50 3.2.2.2 Provincial and local government .................................................................................... 51
CONCLUSION .............................................................................................................................. 54
BIBLIOGRAPHY .......................................................................................................................... 57
ANNEXES ..................................................................................................................................... 62
A. OVERVIEW INTERVIEWS ........................................................................................................... 62 B. INTERVIEW QUESTIONS ............................................................................................................ 63

IV
ABBREVIATIONS
CEF = Connecting Europe Facility
DPVNI = Direction de la Promotion des Voies Navigables et de l’Intermodalité
ERTMS = European Rail Traffic Management System
ETCS = European Train Control System
EU = European Union
GDP = gross domestic product
GHG = GreenHouse Gasses
IWW = Inland WaterWay
JIT = Just-In-Time
MoS = Motorways of the Sea
ODG = Operational directorate-general
SSS = Short Sea Shipping
TEU = Twenty-foot equivalent unit
WHO = World Health organization
VWW = Vlaamse Waterweg

V
LIST OF TABLES AND FIGURES
Tables
Table 1: summary (dis)advantages transport modes 15
Figures
Figure 1: Evolution of the global trade 3
Figure 2: Evolution of container shipping 4
Figure 3: Evolution of transport EU-28 5
Figure 4: Emissions per sector 6
Figure 5: performance freight transport per mode 7
Figure 6: modal split EU-28, 2016 8
Figure 7: Modal split EU-28 8
Figure 8: External costs per transport mode 10
Figure 9: Share of transport GHG emissions 11
Figure 10: Transport capacity 13
Figure 11: cost structure transport modes 16
Figure 12: Concept frame 18
Figure 13: intermodal chain 19
Figure 14: Party logistics providers 20
Figure 15: The Core Network Corridors 31
Figure 16: Modal split Belgium (2016, in %) 33
Figure 17: Modal split Netherlands (2016, in %) 33
Figure 18: modal split port of Antwerp 39
Figure 19: modal split port of Liège 40
Figure 20: modal split ambition 2030 Antwerp 47
Figure 21: Modal split port of Rotterdam 49

1
INTRODUCTION
Transport represents a crucial sector of the economy. The sector accounts for five percent of the
European gross domestic product (GDP). The demand for transport continues to increase and this
even with approximately three percent per year (Europa Nu, sd). When talking about transport,
a distinction can be made between passenger and freight transport. The latter is what will be
discussed in this research. In the globalized world we live in today, freight transport is very
important. Especially road transport seems to be very attractive to transport goods between
places. Unfortunately, this does not come along without any issues. The various government
institutions are aware of these issues as the impact increases. Therefore, goals and regulations
are set up to tackle or avoid the problems.
More and more attention is given to sustainable developments. Sustainable development can be
defined as “development that meets the needs of the present without compromising the ability of
future generations to meet their own needs” (Brundtland Commission, 1987). In the transport
sector the focus lies on sustainability as well. An example is intermodal transport, which is
believed to be a sustainable solution for the negative effects that the transport sector now
produces.
For years, governments are trying to reduce the road freight transport by promoting intermodal
transport. However, after all the effort they have made until now, no change in the share of road
transport can be perceived. This raises questions concerning the efforts of the governments.
Therefore, I would like to investigate what efforts the various government bodies are making.
The research answers the following main question:
“To what extent are the different public agents trying to stimulate intermodal transport in the
port of Antwerp, Liège and Rotterdam in fields of investments, policy and traffic management?”

2
This thesis starts with a theoretical framework wherein the evolution of freight transport is
discussed. The various transport modes and their advantages and disadvantages are also
examined in this part followed by the explanation and situation of concepts such as intermodal
transport. The goal is to frame the topic of this thesis and to clarify some matters. The second
part consists of the empirical frame explaining the approach of the research. This part is dedicated
to explaining which research strategies are used and to motivate several choices. At last, the third
part contains the results of the research. The collected data will be analysed and discussed in this
part, to formulate answers to the questions.

3
PART 1. Theoretical frame
1.1. The evolution of freight transport
Until 1800 there was a long period of low international trade. However, in the beginning of the
18th century the industrial revolution with its technological advances has made a change in this
situation. This period was characterized by a massive expansion of trade, capital and technology
flows and is known as the so-called ‘first wave of globalization’ (Ortiz-Ospina & Roser, 2018;
Hayuth, 1987). Over the years many global developments, such as the rise of e-commerce,
generated a continuous growth in the global trade as can be seen in figure 1. Figure 1 indicates
that the financial crisis in 2008 has led to a strong drop in the global trade but after a sharp
recovery in 2009, global trade is continuing to rise again.
Figure 1: Evolution of the global trade (Source: (Fox, 2017))
Hence, for many years goods are shipped across the oceans but it was not always as easy as it is
today. Before, loading and unloading of sacks and wooden crates was a very slow and
burdensome process and is known as ‘break bulk shipping’ (World Shipping Council, 2018). Only
in the second half of the 20th Century a change in the process has occurred with the invention of
the container. Malcolm McLean came up with the idea of transporting entire truck trailers filled
with cargo to improve the process of loading and unloading (Meisel, 2009; Hayuth, 1987). He
believed that efficiency could be improved by containers that demanded minimum interruption
and which could easily be moved via different transport modes (World Shipping Council, 2018;
Kuipers, 2014).

4
This invention was one of the developments that led to a revolution in the international trade and
since then, more and more is being transported in containers. Figure 2 indicates this growth in
container shipping with a decline in 2008 due to the financial crisis, and it is believed that the
demand for container transport will continue to increase.
Figure 2: Evolution of container shipping (Source: (Hunkar, 2011))
Thus, several developments such as containerization has shaped the world into the global market
as we know it today. In this globalized and liberalized trade world, the demand for freight
transport is continuously rising. When looking at the EU-28 (figure 3), a growth in the transport
of goods can be observed. A substantial decline was caused by the financial crisis but the latest
years it is recovering from this situation and starting to increase again. An explanation for the
growing demand could be the increasing consumption of goods and services but also the
production of goods and services that is more spread over the world (OECD, 1997).

5
Figure 3: Evolution of transport EU-28 (Source: (European Union, 2017))
The growing demand for transport is beneficial for the economy but also brings about several
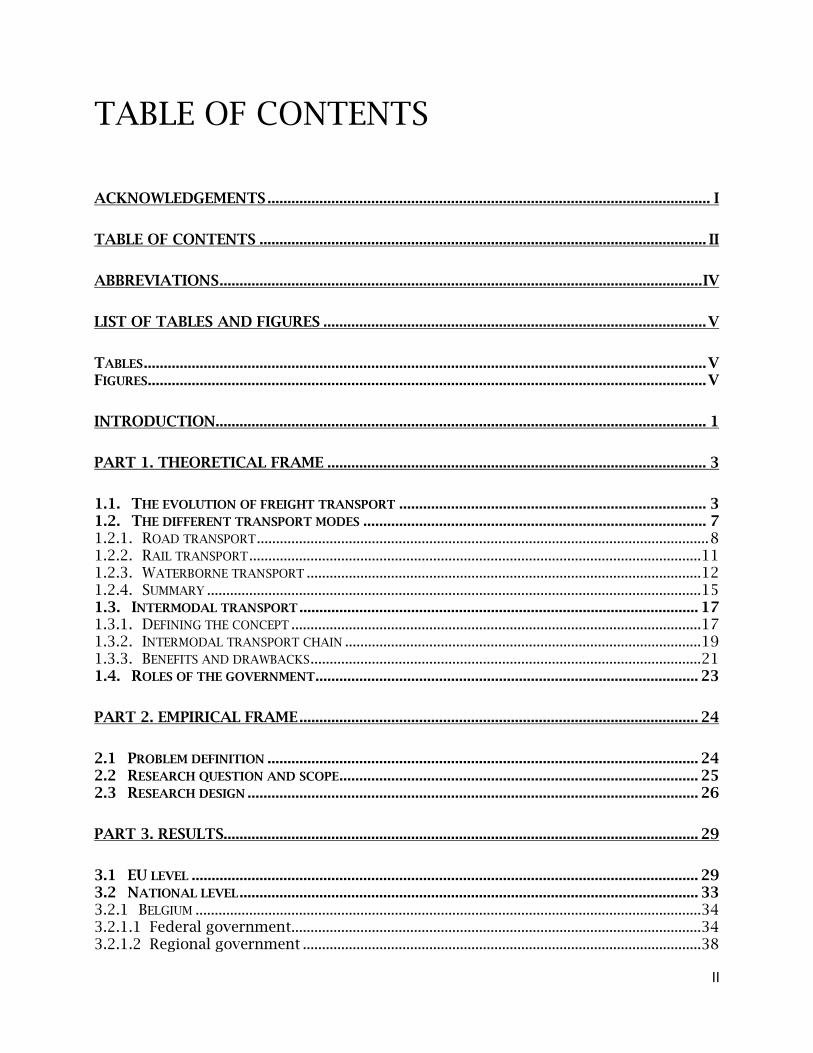
disadvantages. The first drawback are the emissions generated by the transport sector. The figure
below (4) provides an overview of the share in emissions of each sector. It indicates that the
transport sector generates the highest amounts of emissions and, unlike the other sectors, has
not been able to reduce its share yet. All the other sectors show a gradual decline in emissions
over the years, and although the transport sector started a decrease in 2007, the amount remains
higher than in 1990 (European Union, sd). Emissions form a big environmental threat since it
increases the temperature on earth leading to a climate change. Thus, the challenge the world is
facing nowadays is increasing the economic growth and at the same time reducing the
greenhouse gases.
6
Figure 4: Emissions per sector ( (European Union, sd)
Nowadays, due to increasing goods and passengers transport over the road, Europe keeps on
suffering from a traffic infarction. Annually, the congestion in the EU costs approximately 100
billion euros. This equals 1 % of the GDP of the EU (European Union, sd). Besides emissions and
congestion, the transport sector also contributes to other externalities such as noise pollution
and accidents. Noise pollution is a major concern in Europe as it can lead to stress, sleep
disturbance and it affects the wildlife. According to the World Health organization (WHO) noise
is the second worst environmental factor affecting the human health in Europe. Thus, the
increasing transport leads to several negative environmental effects affecting the human and
wildlife health. Due to this, the EU has set several directives with initiatives in order to tackle
these problems (European Environment Agency, 2016).

7
1.2. The different transport modes
First, it is important to know the advantages and disadvantages of the different transport modes.
When considering the different transport modes, the utilization for each mode has developed in
a specific way. Figure 5 shows that the prominent transport mode is the road transport while the
rail and inland waterways are less utilized. The road transport is starting to increase again after
the financial crisis, whereas the rail and inland waterways transport generally remain constant. In
order to understand the choice of using a specific mode, it is necessary to delve into the
characteristics of each mode. The choice of mode depends on several elements such as the
transportation cost, destination, time and reliability. The modes that will be scrutinized are road,
rail and waterborne transport. There are several other modes such as pipelines and air transport
but due to the focus on transport by one loading unit, these are not relevant for this thesis.
Figure 5: performance freight transport per
mode (Source: (European Union, 2017))
8
1.2.1. Road transport
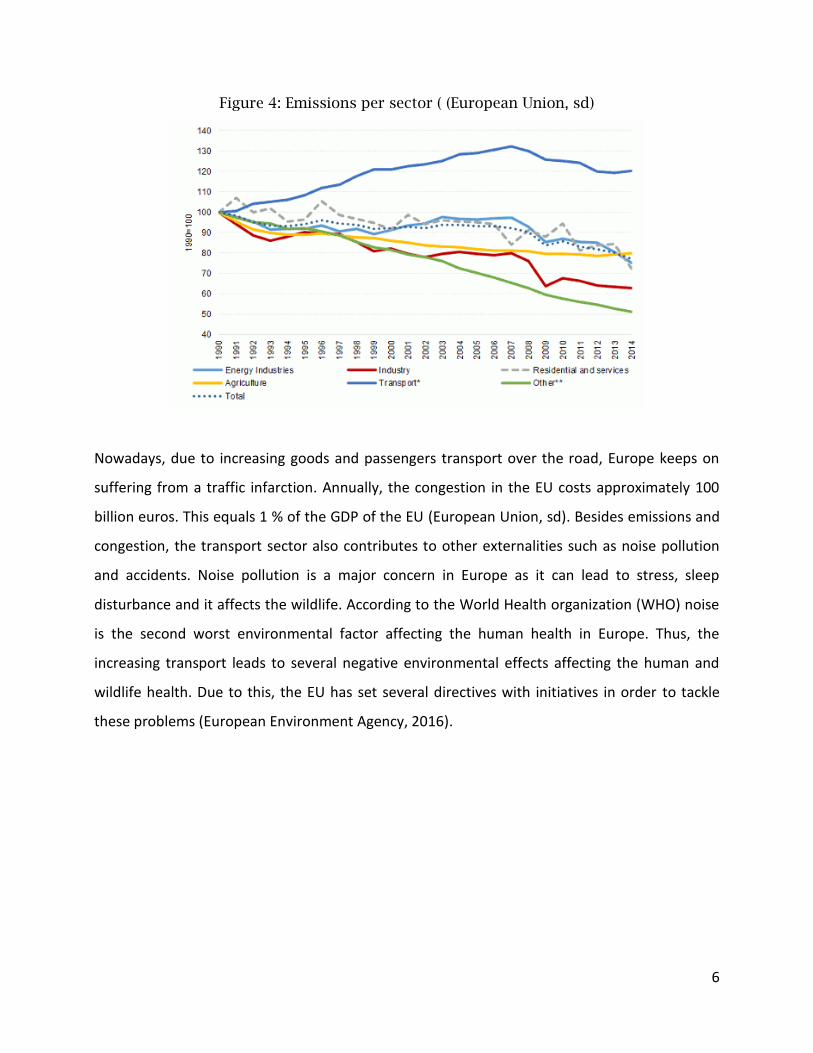
The first mode that will be discussed is the road transport by means of trucks. It is one of the most
common mode of transportation and is used worldwide. As can be seen in figures 6 and 7, for the
past 13 years road transport has had the biggest share in the EU-28 with a percentage of 77 in
2016. Thereby, it is striking that the share of each mode remains the same over the years.
Figure 6: modal split EU-28, 2016 Figure 7: Modal split EU-28, 2005-2016
Source: retained from (Eurostat, 2017)
The question is why road transport is so attractive and used more than other transportation
modes? At first, road transport has the ability to deliver door-to-door without transhipment due
to the extensive road network. This means that goods or containers do not have to be unloaded
to be loaded into another transport mode to reach the destination. Furthermore, it offers high
flexible services and a short lead time which is the time between ordering something and having
it delivered. On the other hand, road transportation has a limited capacity. When transporting
containers with trucks, every truck can only transport one TEU which equals a 20-foot-long
container (Flanders Investment & Trade, 2011; Majerčák, Kudláč, & Panák, 2015).
77%
17%
6%
Road
Rail
IWW0%
20%
40%
60%
80%
100%
20
05
20
06
20
07
20
08
20
09
20
10
20
11
20
12
20
13
20
14
20
15
20
16
Modal split EU-28, 2005-2016
Road Rail IWW

9
In terms of cost, a distinction can be made between the transport costs and the external costs. At
first the transport costs will be considered. The transport costs can be divided in fixed and variable
costs. Fixed costs are unavoidable because it are the costs that incur before any transport is done.
Some examples are the cost for providing infrastructure, for equipping terminal facilities and for
staff (Raghav, sd). For road transport the fixed cost is much lower than for rail or inland
waterways. Road transport requires less expensive equipment, so the investment cost is relatively
limited. Though, when adding the variable costs road transport becomes more expensive than
the other two modes (C. Macharis, personal communication (lesson hinterland transportation), 8
March 2018). Variable costs occur when there is actual movement and it depends on the distance
travelled (Raghav, sd). A reason for the fast-increasing price per unit for road transport is the
limited capacity but also the fuel consumption is relatively high (Macharis & Verbeke, 1999). Thus,
when considering transport costs, road transport is only advantageous for short distances
(Majerčák, Kudláč, & Panák, 2015).
The external costs are costs that arise ‘when the social or economic activities of one group of
persons have an impact on another group and when that impact is not fully accounted, or
compensated for, by the first group’ (Bickel & Friedrich, 2005). These costs include noise,
transport safety, climate gases, air pollution and congestion. As mentioned earlier, the growing
road traffic, for both passengers and freight transport, is leading towards more congestion
problems. This also gives the problem that a truck is affected by congestion and so the reliability
becomes smaller. Due to congestion it is hard to arrive on time or to know when the goods will
be delivered. Thereby, in road transport more accidents occur involving trucks and a reason for
this is for example the congestion. So, in figure 8 we see that road transport is also more
dangerous than rail or waterborne transport (Majerčák, Kudláč, & Panák, 2015).

10
Figure 8: External costs per transport mode (Source: (European Court of Auditors, 2015))
Another external factor is indicated in the figure below (9). This figure represents the share of
each transport mode in Greenhouse Gas emissions for the EU-28. This shows that the road
transport is the major contributor. Even in figure 8 which indicates the external costs in cents per
ton-kilometre, it can be seen that road transport has the biggest share concerning climate gases
but also air pollutants. But road traffic is not only the biggest contributor to air pollution, it is also
the major contributor of environmental noise. A study of the European Environment Agency
(2016) has revealed that at least 100 million people are exposed to traffic noise that exceeds the
EU indicator of noise annoyance. This number makes road traffic the most important source of
environmental noise. So, in general, the sum of the external costs for road transport is very high.

11
Figure 9: Share of transport GHG emissions (Source: (EEA, 2017))
1.2.2. Rail transport
The second mode is the rail transport. Unlike road transport, rail transport has a high capacity. A
train can have hundreds of wagons but only needs one driver for it. It is the most efficient land
transportation mode as one train can take over 400 trucks. Thereby, rail transport depends less
on weather conditions and is not affected by congestion which makes it fast and more reliable.
Though, a door-to-door service is impossible for rail transport and thus it requires transhipment
onto road transport (Majerčák, Kudláč, & Panák, 2015; Flanders Investment & Trade, 2011;
Modes transportation explained best, 2018). The rail network is extensive, in 2015 the usable
railway lines in Europe amounted 218.000 kilometres, but it is more restricted than road network
which makes it quite impossible to reach final destinations (Statista, 2018).
The necessary transhipment creates additional costs for rail transport. When looking at the costs,
the fixed cost is much higher than for road transport. The investment cost is significantly higher
due to for example expensive locomotives, expensive cranes to load and unload a train or
expensive infrastructure. Because rail transport cannot offer door-to-door services, road
transport still must be used to reach the final destination.

12
This transhipment requires extra handling, leading to more costs. However, after a certain
distance the variable costs of rail transport becomes much lower than road transport. Due to the
big capacity that can be transported the price per unit decreases in distance (Macharis & Verbeke,
1999; Flanders Investment & Trade, 2011; Majerčák, Kudláč, & Panák, 2015). So unlike road
transport, rail transport is more suitable for long distances (C. Macharis, personal communication
(lesson hinterland transportation), 8 March 2018).
Also the external costs are in general much lower for rail transport. As already mentioned, in the
rail transport there is no congestion problem. Thereby, the accidents involving freight trains is
very low so rail transport is much safer than road transport (Flanders Investment & Trade, 2011;
Majerčák, Kudláč, & Panák, 2015; Modes transportation explained best, 2018). As shown in figure
8 above, rail transport contributes the least to air pollution and has low GHG emissions. Though,
it has a great share in the environmental noise. More specific, rail transport is the second major
contributor to noise pollution in the EU exposing 19 million people (EEA, 2017).
1.2.3. Waterborne transport
When talking about waterborne transport a distinction can be made between inland waterways
(IWW) and Short Sea Shipping (SSS). The European Union defines SSS as ‘The movement of cargo
by sea between ports situated in geographical Europe or between those ports and ports situated
in non-European countries having a coastline on the enclosed seas bordering Europe.’ (European
Shortsea Network, sd). For example, a ship going from the port of Antwerp to the port of Ghent
will use the coastal waters instead of the IWW. Inland waterway transport is one of the main
three land transport modes. The waterways include canals, rivers, lakes, etc.
The waterborne transport is characterized by a big capacity. The figure below (10) compares the
capacities of each transport mode. This gives a clear view on the fact that waterborne transport
can replace a lot of trucks on the road but also a lot of railway wagons. However, just like rail
transport, no door-to-door service is possible due to the limited network (European Court of
Auditors, 2015).

13
Although an inland waterway network of 40.000 kilometres in the EU, a big disadvantage of
waterborne transport is the limited geographical scope compared to the previous two modes
(Inland Navigation Europe, 2018). Thereby, the navigability of the waterways can change in time.
When there is low water for example, ships cannot be heavy loaded. Just like road transport,
waterborne transport depends on the weather conditions because in the winter for example
water can become ice (Saver, 2002). These elements make waterborne transport less reliable.
Another disadvantage of this transport mode is the low travel speed which in terms affects the
lead time (Majerčák, Kudláč, & Panák, 2015; Flanders Investment & Trade, 2011).
Figure 10: Transport capacity (Source: (European Court of Auditors, 2015))
In terms of transport costs, waterborne transport is similar to rail transport. To start with, the
investment costs for equipment, infrastructure, … is very high. Compared to the other two modes,
waterborne transport has the highest fixed cost. Also due to the necessary transhipment for door-
to-door services the cost increases a lot. Yet, the total transport cost is much cheaper for
waterborne transport. The reason for this are the variable costs which are characterized by
increasing economies of scale. Due to the biggest capacity, the price per unit decreases much
more in distance (Majerčák, Kudláč, & Panák, 2015; Macharis & Verbeke, 1999).

14
Thus, waterborne transport is the best choice for transporting goods over a long distance that do
not require fast delivery times. Also in fields of external costs, the waterborne transport scores
the best. Although it creates more air pollutants than rail transport, the overall external cost is
much lower. This is especially due to the environmental noise which is significantly low for this
transport mode. Moreover, the inland waterways have a very good safety record (European Court
of Auditors, 2015). So, concerning the environment, waterborne transport is the best mode to
choose.

15
1.2.4. Summary
Table 1: summary (dis)advantages transport modes
Advantages Disadvantages
Road + Door-to-door service
+ Extensive network
+ High flexibility
+ Short lead time
+ Limited investment costs
- Limited capacity (1 container)
- Affected more by congestion and creates more congestion
- Dependent on weather conditions
- Transport costs high when long distances
- High emissions and air pollutants
- High environmental noise
- Less safe (accidents)
Rail + Big capacity
+ More reliable in poor weather condition
+ Fast
+ Lower transport costs for long distances
+ Safe
+ Low emissions and air pollutants
- No door-to-door possible
- Additional handling (transhipment) with additional costs
- High investment costs
- Still high environmental noise but less than road transport
Waterborne + Big capacity
+ Lowest transport costs for long distances
+ Lowest emissions and air pollutants
+ Low environmental noise
+ Safe
- No door-to-door possible
- Additional handling (transhipment) with additional costs
- High investment costs
- Slow
- Unreliable lead time
- Availability and available network/routes
16
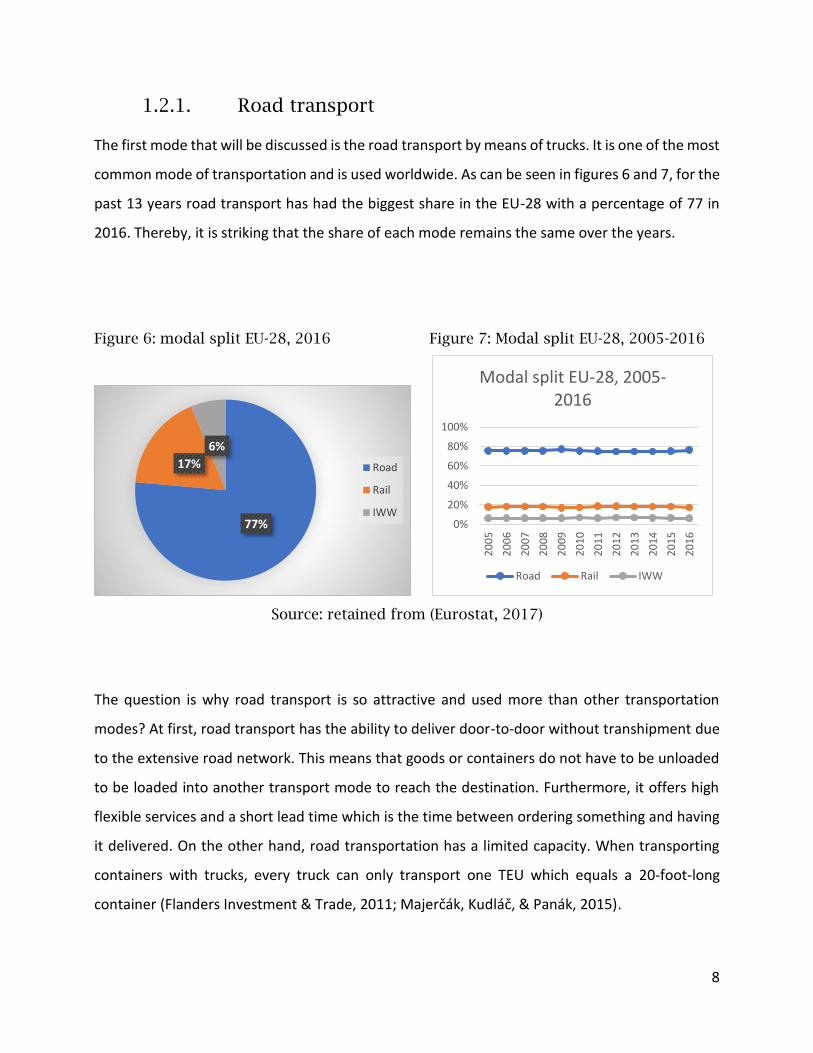
Thus, each transport mode has its own advantages and disadvantageous. Depending on several
elements; the type of cargo that needs to be transported, the available time to deliver, the
distance, etc., a transport mode with its specific characteristics will be chosen. Road transport has
always been the most used mode as indicated previously in figure 7. Although road transport has
several benefits, table 1 shows that it also has several disadvantages such as congestion and
emissions which can be decreased by using the other two modes. Thereby, the figure below also
shows us the differences in transport cost which clearly indicates that long distances are much
cheaper when using rail or especially waterborne transport.
Figure 11: cost structure transport modes (Source: (Macharis & Verbeke, 1999))
The past years there is a growing attention for sustainability due to e.g. global warming and
intermodal transport is believed to be a sustainable solution to tackle the various impacts of
transport. But what is intermodal transport? In the next part, the rise of this concept will be
explained and a definition will be given.

17
1.3. Intermodal transport
1.3.1. Defining the concept
Although it recently receives a lot of attention, intermodal transport is not a new phenomenon.
The concept was already introduced in the sixties but nowadays there is a growing attention due
to the increasing environmental problems that were discussed in the previous chapter (Macharis
& Verbeke, 1999). It is, of course, important to understand what is meant with intermodal
transport. Since the rise of the concept various definitions were formulated. As there is no
consensus definition, it is interesting to list some of these definitions and to clarify which
definition is used for this thesis.
Already in 1987 Hayuth defined intermodality as the displacement of cargo by at least two
transport modes with the objective to transport it in a continuous flow from origin to destination
(D'hoedt, 2010). Intermodal transport is also defined as the transportation of a person or cargo
from the origin to the destination by at least two modes and the transfer between the modes is
done at an intermodal terminal (Crainic & Kim, 2007). According to the Conference of European
Ministers of Transport (CEMT) intermodal transport is “the movement of goods in one and the
same loading unit or vehicle using successively several modes of transport without handling of the
goods themselves during changing modes” (Macharis & Verbeke, 1999; OECD, 2003). Thereby,
when the major part is done by rail or inland waterway and the initial or final part is transported
by road, it is called combined transport. The UIRR defines combined transport as the use of at
least two transport modes in one transport chain whereby the goods do not have to be changed
from containers and whereby the major part is done by rail, inland waterways or short sea
shipping and the shortest part is done by road (OECD, 2003). Combined and intermodal transport
are sometimes considered as two different concepts but in this thesis no distinction is made.

18
Thus, in this thesis, intermodal transport is considered to be the transport of goods in loading
units by means of at least two different transport modes whereby the longest distance is done by
rail, IWW or SSS and the shortest initial or final part is done by road transport. The important
elements when talking about intermodal transport is in the first place the displacement of loading
units. When talking about loading units, there are three different possibilities namely containers,
swap bodies or semi-trailers. So, it is important to know that for intermodal transport no
treatment of the goods is needed during the transhipment by virtue of the loading unit (C.
Macharis, personal communication (lesson hinterland transportation), 8 March 2018). Thereby,
due to the limited network of IWW and rail, it is impossible to exclude road transport to reach the
final destination. But in intermodal transport the goal is to shorten the distance done by road
transport.
Furthermore, it is important to distinguish several concepts concerning transport. The
fundamental way of moving something from A to B by one mode is called unimodal transport.
When at least two modes are used, it is called multimodal transport. So intermodal transport is
not a synonym for multimodal transport. Intermodal transport falls under multimodal transport
but with an extra characteristic namely the loading unit that is used (C. Macharis, personal
communication (lesson hinterland transportation), 8 March 2018).
Figure 12: Concept frame (Source: (Christiaens, 2015))

19
Co-modal transport is another concept that should not be confused with intermodal transport.
Co-modal transport focuses on the efficiency of each component of the transport chain.
Throughout the chain the purpose is to make optimal use of the available modes in order to obtain
the advantages of each mode (Somers & Tißen, 2015). When the focus is on the whole network
instead of the chain, we talk about synchromodal transport (C. Macharis, personal
communication (lesson hinterland transportation), 8 March 2018). Synchromodal transport is
more flexible than the previous concepts because the mode can be changed at any time. When
delays or malfunctions occur, it is easier to find a solution and to seek for an alternative.
Therefore, real-time information is important in order to make this possible (Christiaens, 2015;
Somers & Tißen, 2015). Figure 12 illustrates the difference between the concepts.
1.3.2. Intermodal transport chain
Figure 13: intermodal chain
(Source: (C. Macharis, personal communication (lesson hinterland transportation), 8 March 2018)
Figure 13 gives an overview of the intermodal transport chain. The first step in the chain is
collecting the goods in a nearby inland terminal. This initial part is done by road and it should be
as short as possible because it has a great share in the total cost (Macharis & Bontekoning, 2004).
Hossain, 2009). The goods that are collected in the inland terminal are then transported to a sea
port by barge or train. Once the goods are at the sea port, the transport continues to the next sea
port with big vessels.

20
In an inland terminal goods can be collected, stored for a short period and then transported to
the final destination (Janic, 2007). In the inland terminal the interchange between transport
modes is taken care of. Depending on the transport mode there are different terminals; terminals
for rail, for barge or for all transport modes (Neuteleers, 2013). Subsequently, at the next sea port
the goods are brought to the inland terminal once again via rail or barge. As said before, the
network of these transport modes is restricted so in order to reach the final destination the goods
are transported by truck. Thus, when considering the whole intermodal chain, it can be said that
is a door-to-door concept.
When considering the actors involved in the intermodal chain, the consignor is the first one. The
consignor is the person who wants to send goods to the consignee. The consignee is the one who
bought the goods and who will receive them. For transporting there are several options such as
a shipping company or a shipping agent. These are partners who help to manage the transport.
More and more shippers are outsourcing their transport and logistic activities to these partners.
Figure 14 indicates the degree of outsourcing. One party logistics provider is when you do
everything yourself, so you produce goods and put it in a truck to transport it. When a transport
company is paid to do the transporting, it is second party logistics provider. Third is when the
logistics are outsourced, and fourth party logistics providers have a chain perspective and they
design it which is then executed by 3PL (C. Macharis, personal communication (lesson hinterland
transportation), 8 March 2018).
Figure 14: Party logistics providers
(Source: (C. Macharis, personal communication (lesson strategy and trends), 15 February 2018).

21
1.3.3. Benefits and drawbacks
In the intermodal transport chain several transport modes are used. As already discussed, each
transport mode has its benefits and disadvantages. A good combination of the different transport
modes can allow to use each mode for the part of the transportation to which it suits best. In this
way the benefits of each mode can be obtained leading to a more efficient, cheaper and
environmental-friendly transport (Van Hoof, 2006). Reducing the part done by road leads to a
reduction of the environmental impacts (congestion, noise pollution, accidents etc.) and to cost-
effectiveness (Wesselink, 2017). Nowadays, the Just-In-Time (JIT) principle is gaining attention.
The idea of JIT is to only produce when there is a demand. The right quantity of goods must be at
the right place and this at the right time. In this way no stock is needed, and it is easier to react
to changes in demand (Theunissen, 1996). Due to the high flexibility of road transport it is more
suitable to deliver the goods right on time. Though, because of the increasing transport via road,
congestion is increasing which makes road transport less liable because the travel time increases.
For this, intermodal transport forms a good solution to avoid congestion (Neuteleers, 2013).
When considering the costs, the transport costs and external costs both reduce when using
intermodal transport. As the main part is done by rail or barge, the transport costs decreases
because they are much lower for long distances. The short distances are done by truck which is
also more cost-efficient. Furthermore, as road transport is done as short as possible, the external
costs reduce.
Although intermodal transport offers a lot of benefits, no modal shift has occurred over the years.
Several reasons can be given for not using intermodal transport. At first, speed is a big issue. Rail
and IWW transport do not offer direct routes to the final destination which slows down. Also the
speed of a barge is much lower. Thereby, transhipping containers to another transport mode
requires additional time. Another reason is the lack of reliability. The intermodal chain is longer
than the unimodal chain which increases the chances for disruptions. The transhipments during
the intermodal transport also carries a bigger risk for damage. Damage can be avoided by
overpacking, but this also leads to added weight and expenses.

22
Furthermore, as mentioned before, rail and IWW transport have a high fixed cost because they
require expensive infrastructure. Heavy-duty cranes and equipment are needed to handle large
containers and these are very expensive so not every port has these available (Allen, 2017).
Another issue that rail transport brings along, concerns the profitability. Rail transport is only
profitable when you are able to transport a certain percentage of containers. So filling up a train
is necessary in order to avoid losses but a large quantity is not always possible. This is a big issue
that stands in the way of a modal shift (personal communication, P. Hegge, 10 April 2018).

23
1.4. Roles of the government
A perfect market does not exist and when imperfections occur, the government has the task to
intervene. In the previous chapter external costs have been mentioned several times. The
external costs disrupt the market forces and are at the expense of the society. In order to increase
the welfare of the society, the government intervenes by taking measures (CD&V, 2017). There
are different roles the government can take on in context of stimulating intermodal transport. At
first, the government can make policy regarding the transport modes. New or adjusted
regulations can make certain transport modes more or less attractive. Furthermore, the
government can also invest and this can be done in two ways. At first, the government can invest
in infrastructure. Infrastructure is a key element in transport economy and is also important for
the national economy and competitiveness. Another way is by providing subsidies for e.g. projects
with the goal to stimulate intermodal transport (T. Vermeiren, personal communication, February
2018; (Sannen, 2016)).
As the transport is increasing, it is important to secure a safe and fluent traffic flow. Traffic
management is another task the government can fulfil for road, rail and IWW transport. Also
promotion can be done by the government. Persuading or attracting companies to switch to
sustainable transport modes is also a possibility and this can be done by for example campaigns.
At last, the government has also the task to give information. It is possible that not all companies
are aware of the possibilities to do transport via rail or IWW. The government can then inform
the companies of the available alternatives (T. Vermeiren, personal communication, February
2018).

24
PART 2. Empirical frame
2.1 Problem definition
A growing demand in transport benefits the economy of the world. Though, what most people
do not consider are the external effects that come along with transport. An enumeration has
indicated that there were approximately 13 million heavy duty vehicles on the roads of the EU in
2015. Moreover, annually, approximately 1.7 trillion tonne-kilometres of freight is transported by
road in the EU (Muncrief & Sharpe, 2015; Transport & Environment, sd). As mentioned before,
the share of road transport accounts for 75%. This means that road transport is the most used
mean to transport freight, but road transport is also the major contributor to the external effects
of transport. Thereby, it is expected that the coming years more freight will be moved and
especially by road.
In order to prevent the increasing external effects, the European Union has made several
regulations to save the environment and the society from the growing transport. In 2011 the EU
has set new goals in the White Paper regarding transport. A big concern of the EU is the global
warming and as said before, the transport sector is the major cause of greenhouse gasses. In this
context the EU has set the goal to reduce the amount of greenhouse gasses in the transport sector
with 60 % compared to the amount in 1990 and this by 2050. In order to achieve this, by 2030,
30 % of the road freight transport for distances above 300 kilometres should be done by rail or
water transport (Europese Commissie, 2011).
Although several measures and initiatives have been taken to realize a modal shift towards more
sustainable transport modes, no decrease can be perceived in the use of road transport. So even
though there is growing attention for sustainable transport, no difference has been made yet.
Intermodal transport still holds several uncertainties which restrains transporters from making a
modal shift. In order to be able to achieve the goals by 2030 and 2050, the government has the
duty to increase their effort to make a modal shift more attractive. As discussed in the previous
chapter, the government can take on several roles in order to stimulate intermodal transport.

25
2.2 Research question and scope
In this master dissertation I want to examine which government agencies are involved in
stimulating intermodal transport. Furthermore, the goal is to investigate what the contribution is
of each government agency in the stimulation and this for rail and IWW transport. In this way a
view can be created on what is provided by the public sector in order to achieve a modal shift.
The purpose is to compare three ports where different government bodies are operating. Due to
the focus on loading units, it was important to choose ports that are handling a big number of
containers. At first, the port of Rotterdam and Antwerp are the number 1 and 2 of ports in Europe.
Also in terms of container transport both ports are the biggest ports of Europe. Comparing these
two ports is therefore a very logical choice and even very interesting as Belgium and the
Netherlands have a different governmental structure. Belgium knows a four-layer structure and
in the Netherlands there is a three-layer structure. The governmental structure of both countries
will be discussed in detail in part 3. Because Belgium is divided also in regions, namely the Flemish,
the Walloon and Brussels-Capital region, it is also interesting to compare the Flemish and Walloon
governments. And again, it was important to choose a port where a sufficient number of
containers is handled. The port of Liège does not handle the same volume as Antwerp or
Rotterdam, but it is the biggest port of Wallonia. Moreover, the port of Liège is the third largest
inland port in Europe.
The government has different possibilities to intervene. Discussing all the roles of the government
would be too broad and therefore I have chosen to take a closer look at three roles. I have chosen
to examine policy, traffic management and investment. In order to examine the actions that are
taken, the policy that is developed should also be considered. Investment is an important factor
because the expensive infrastructure of rail and IWW transport is a major cause of the reluctance
of transporters. Due to the expected increase in traffic on rails and IWW the government has the
duty to secure a fluent and safe traffic flow by operating locks for example. IWW transport for
example is considered not to be reliable which makes it unattractive.

26
Nowadays congestion in ports also occurs and in order to increase the reliability, actions need to
be taken concerning smooth traffic flows and handling. At last, policy is an important instrument
of the government to make modes more attractive or less attractive.
The goal of this fundamental research is to create an overview of the governmental efforts in the
ports of Antwerp, Liège and Rotterdam. Once this overview is created, similarities or differences
should be able to be identified.
Thus, the research question of this thesis is as follows:
“To what extent are the different public agents trying to stimulate intermodal transport in the
port of Antwerp, Liège and Rotterdam in fields of investments, policy and traffic management? “
Before being able to answer this research question, a few sub-questions should be examined: S1. How does the governmental structure of Belgium and the Netherlands look like? S2. What is the policy goal of each level concerning intermodal transport or the port and what do they provide for it? S3. Which public agents are involved for the implementation of the previous policy? S4. What specific actions do the public agents take?
2.3 Research design
The purpose of the research is not to gain numerical data and to analyse these. Therefore,
qualitative research methods were used. The primary source of the research is a literature study.
Before deciding to write a master dissertation about this topic, literature has been consulted to
inform myself about the topic. At first, it was important to understand the concept of intermodal
transport. Each research strategy has its advantages and disadvantages and so does a literature
study. A literature study is important to inform yourself about what has been investigated
already, what is known, what is not known yet, etc. On the other hand, it is also a time-consuming
work and it also has issues concerning subjectivity and selectivity. When collecting data by means
of a literature study, choices have to be made on what data to use (van Thiel, 2010).
Therefore, it is important to not use information based on one source but to compare different

27
sources and to seek for resemblances or differences. In order to find relevant literature several
databases were used such as Google Scholar, Lib.ugent and Web of Science.
Though, it is always possible that not all recent developments and opinions are written and so
not to be found in literature (van Thiel, 2010). Therefore, the next step in the research are expert-
interviews with several government bodies. With the help of the interviews, I was able to get a
clearer idea of which bodies are involved in each port. At first, I contacted the Flemish
department of Mobility and Public Works for an interview to get a view on the involved public
instances. This interview only served as a means to understand who I should contact and to
receive contacts. After this conversation, I briefly examined the different government bodies in
order to be able to formulate some questions. The goal of the interviews was not to gain
numerical data and thus semi-structured interviews were taken. This means that on beforehand
several questions are formulated and depending on the answers, additional questions can be
asked. The advantage of this, is the possibility to continue questioning on answers of the
interviewees. In this way, more and detailed information can be obtained (van Thiel, 2010;
Mortelmans, 2013). Due to the focus on three ports, a lot of interviews have been taken and for
every interview the questions were adapted. Thereby, I had to move around to take the
interviews which made this strategy also very time-consuming.
The government bodies were contacted via mail and some interviews were taken over the phone
of via mail. In Annexe A, an overview of all the contacted instances is given. This does not mean
that all these interviews have been taken. Unfortunately, regardless of the multiple attempts on
contacting certain instances, I was not able to take an interview with all of them. For this missing
information, the literature that could be found has been used.

28
During the interviews notes were taken and, when permission was given by the interviewee, the
conversations were also recorded on my phone. Recording the interviews gives the possibility to
listen to it again at home in order to transcribe it word by word. In this way I was sure that all
relevant information was collected. Another advantage is that I could focus myself on the
interviewee and I did not had to worry if everything was written down. This is very important for
semi-structured interviews because then you have time to form new questions (King & Horrocks,
2010). Eventually, I asked the interviewees if they wanted to proofread the transcription of their
interview.
The next step is analysing the data that I collected. The interviews have to be coded in order to
bring structure in the data. Processing data can be done by a software program such as NVIVO or
can be done by yourself. In this research I preferred to code it myself as the software program is
too complicated for me and thus it would take much more time. For processing, I have chosen to
use colour-codes. I gave each sub-question a colour and in every interview I coloured the
information that I could use for each question.
Example:
S2. What is the policy goal of each level concerning intermodal transport or the port and what do they provide for it?
When finding something in the interviews policy of the federal government, I coloured it in red.
In this way I got a good view on which data to use for each part of the research. The same was
also done for the literature study. By means of color-codes there was a clear overview of the
information per chapter.
29
PART 3. Results
3.1 EU level
The European Commission states that it strives for “an efficient, safe, secure and sustainable
transport” (2011). As mentioned before, the EU has the goal to reduce the GHG emissions by 2050
with 60%. In order to achieve this, the European Commission published in 2011 the whitepaper
‘Roadmap to a single European Transport Area 2050’. In this whitepaper the Commission
developed a long-term vision until 2050. Therefore, they determined ten objectives, followed by
40 measures that will help to achieve these ten objectives.
The ten objectives are:
1. “Halve the use of ‘conventionally-fuelled’ cars in urban transport by 2030; phase them out in cities
by 2050; achieve essentially CO2-free city logistics in major urban centres by 203010.
2. Low-carbon sustainable fuels in aviation to reach 40% by 2050; also by 2050 reduce
EU CO2 emissions from maritime bunker fuels by 40% (if feasible 50%11).
3. 30% of road freight over 300 km should shift to other modes such as rail or waterborne transport
by 2030, and more than 50% by 2050, facilitated by efficient and green freight corridors. To meet
this goal will also require appropriate infrastructure to be developed.
4. By 2050, complete a European high-speed rail network. Triple the length of the existing high-speed
rail network by 2030 and maintain a dense railway network in all Member States. By 2050 the
majority of medium-distance passenger transport should go by rail.
5. A fully functional and EU-wide multimodal TEN-T ‘core network’ by 2030, with a high quality and
capacity network by 2050 and a corresponding set of information services.
6. By 2050, connect all core network airports to the rail network, preferably high-speed; ensure that
all core seaports are sufficiently connected to the rail freight and, where possible, inland
waterway system.
7. Deployment of the modernised air traffic management infrastructure (SESAR12) in Europe by 2020
and completion of the European Common Aviation Area. Deployment of equivalent land and
waterborne transport management systems (ERTMS13, ITS14, SSN and LRIT15, RIS16).
Deployment of the European Global Navigation Satellite System (Galileo).

30
8. By 2020, establish the framework for a European multimodal transport information,
management and payment system.
9. By 2050, move close to zero fatalities in road transport. In line with this goal, the EU aims at halving
road casualties by 2020. Make sure that the EU is a world leader in safety and security of transport
in all modes of transport.
10. Move towards full application of “user pays” and “polluter pays” principles and private sector
engagement to eliminate distortions, including harmful subsidies, generate revenues and ensure
financing for future transport investments.”
(European Commission, 2011)
A first example of an initiative that should be taken is optimizing the internal market for IWW
transport and making it more attractive by removing barriers. Also, a framework should be
created to ensure intermodal liability. Supporting multimodal transport and the integration of
IWW is also mentioned as an important initiative that has to be taken. The last example, and very
important example, is to further develop the European TEN-T mobility network and also to
develop an infrastructure funding framework (Europese Commissie, 2011).
The goal of the TEN-T Network is actually to develop a full-scale network by 2030 of railway lines,
roads, IWW, ports, airport,… . Thus, it includes all modes of transport with the purpose to build
one European transport network by focusing on infrastructure. For this, hundreds of projects are
set up and it is estimated that 500 billion euro will be needed to finance the TEN-T projects for
the current period, namely from 2014 till 2020. The Member States must finance the majority of
the amount. This network is very important because it is believed to create a 1.8% increase of the
GDP and will lead to growing employment (European Commission, sd).
In other words, by improving the infrastructure with the TEN-T network, the EU strives for
interconnection and interoperability of the transport networks of the member states. For
example, in rail transport, there are various signaling zones which makes it very complicated.
Therefore, the EU wants to develop one single signaling standard and this is for example done by
means of the European Rail Traffic Management system (European Commission, sd).

31
The maritime aspect of the TEN-T network is realized by the Motorways of the Sea (MoS). As said
before, waterborne transport is very important as it is very environmental-friendly. That is why
the goal of the maritime pillar is to make waterborne transport an attractive alternative for road
transport. Therefore, intermodal links must be improved and developed, and also critical port
infrastructure must be available (European Commission, sd).
The network is to connect the most important nodes within the EU by tackling bottlenecks and
eliminating gaps and barriers between transport networks of member states. Therefore, nine
Core Network Corridors were identified. The figure below (15) gives an overview of these nine
Corridors. To realize each corridor, several projects must be set up and the funding of all these
projects is done by the Connecting Europe Facility (CEF). For this, the CEF has provided over 24.05
billion euro from 2014 to 2020 to fund the projects in the member states. Furthermore, the
member states must invest in infrastructures that are in line with the European priorities
(European Commission, sd).

32
Figure 15: The Core Network Corridors (Source: (European Commission, sd))
Belgium plays an important role in the development of the TEN-T network as three of the nine
corridors are situated in Belgium. These are the North Sea-Baltic, the Rhine-Alpine and the North
Sea – Mediterranean Corridors. But also, the Netherlands has responsibilities concerning these
three Core Network Corridors.

33
3.2 National level
When comparing the modal split of Belgium with the Netherlands, the overall view indicates that
road transport is in both countries the most used transport mode. In rail and IWW transport a big
difference can be noticed. In the Netherlands, IWW transport also accounts for a big piece in the
cake with 44,6%. This is much more compared to Belgium. But when looking at rail transport,
Belgium reaches a higher percentage than the Netherlands.
Figure 16: Modal split Belgium (2016, in %)
Figure 17: Modal split Netherlands (2016, in %)
Source: (Eurostat, 2017)
Thus, in the Netherlands the share of road transport is significantly lower than in Belgium but still
has the major share in the split. Compared to the Netherlands, Belgium still has a long way to go
in order to improve the share of IWW transport but performs better in fields of rail transport.
Both countries still have some effort to make in order to really realize a modal shift towards
sustainable transport modes. In the next section, focus will be laid on specific ports in both
countries in order to create a view on the approach of the governments to tackle this problem.
6
49,4
44,6Rails
Road
IWW
11,6
73,1
15,3Rails
Road
IWW

34
3.2.1 Belgium
Belgium knows a very complex three-level government structure. The top level consists of the
Federal State and since the reform of the state also the Communities and the Regions. Each have
their own competences but are all equal concerning power. The middle level are the provinces
and at the bottom there are communes. Both are under the supervision of the authorities of the
first level. At first, the policy goals of each governmental level will be given. When focusing on
each port, the specific government bodies that are involved in order to meet the policy goals will
be discussed.
3.2.1.1 Federal government
When looking at the competences, the development of rail transport falls under the
responsibilities of the federal government. In the federal government agreement of 2014 it is said
that infrastructure projects for freight transport will get high attention in the long-term
investment plan. It also endorsed that stimulating freight transport by means of rail is very
important and so is decreasing the amount of trucks on the road. The federal government also
declares to work together with the regions in order to stimulate a modal shift by for example
revaluing inland waterway in order to reduce the greenhouse gasses and the congestions
(Federale Overheid, 2014).
The Minister responsible for mobility, François Bellot, states in his policy document that relieving
the transport infrastructure is very important in order to have a fluent traffic flow. Therefore, one
of his approaches is to improve the supply of the rail transport (Bellot, 2017).
As rail transport is a federal competence, the same regulations and actions are made for the
Flemish and Walloon regions and thus for the port of Antwerp and port of Liège. In order to
stimulate rail transport, a subsidy is provided for combined transport and diffuse transport.
Diffuse transport is also called Single Wagon Load and these are trains that consist of different
loads while combined is a train with e.g. containers. Both transport requires a lot of investment
due to the transshipment that is needed in order to reach the destination and all these costs are
making rail transport less attractive.

35
Thus, in order to tackle this problem, the Belgian federal government provides subsidies. For
combined transport there is a fixed component and a component depending on the distance. For
diffuse transport, every kilometer that is done by one wagon is multiplied with a certain amount
(personal communication, P. Hegge, 10 April 2018).
Although rail transport is a competence of the federal government, the Flemish government also
drafts a Flemish rail strategy which has to be taken into account by Infrabel when developing the
investment plan. The Flemish government and the other regional governments, have the
possibility to state rail priorities but a part of their budget must also be invested in these projects.
E.g. saying that a rail connection is necessary between place X and Y or that it should be improved
or extended. For the regional rail priorities, the Flemish region provides a budget of 100 million
euro and the Walloon government 32,5 million euro (Infrabel, 2017).
A. Infrabel
For the management of the Belgian railway network Infrabel has been established. Infrabel is an
autonomous public company and manages and operates the Belgian railway infrastructure. An
autonomous public company means that it belongs to the public sector, more specific to the
federal government, but it has own decision-making powers on management of personnel,
finances, policy and so on. It is responsible for building and maintaining the railway network and
they also coordinate the trains. Infrabel aims at developing itself into “a strong link in a
sustainable transport system”. It focuses on five major priorities namely safety, punctuality,
capacity, finance and corporate social responsibility. Infrabel employs 11.000 people and
manages this with a structure of three directorates and four supporting departments (Infrabel,
sd).
J. Decelle of Infrabel (personal communication, 11 April 2018) believes that there are two
important aspects that must be considered when talking about intermodal transport. The first
one is having the financial means to develop such networks. According to him, Infrabel does not
receive enough financial means to focus on intermodal transport. Infrabel sets up its own policy
and goals but receives grants from the government in order to fulfil its responsibilities.

36
In 2017 the dotation amounted 827,6 million euro. With this capital, it also has the responsibility
to help develop the intermodal transport network. As they are responsible for the rail
infrastructure, they should invest in certain regions to improve or to build railway networks.
Recent years, the federal government has reduced the dotation for Infrabel with a fifth of the
normal amount. The growing expectation of improving intermodal transport network in order to
promote rail freight transport does not come along with more grants. This leads to making
considerations. Infrabel is not only responsible for the rail infrastructure of freight transport, but
also passenger transport. Thus, considerations have to be made on which projects are priority
and which can be postponed (personal communication, J. Decelle, 11 April 2018).
Thereby, there are a lot of rail connections; rails on private domain leading to a company. But a
lot of rail connections are not used anymore and maintaining it requires money. Due to the
restricted budget, Infrabel is considering on closing and breaking out these connections. “Though,
a lot of comments are made as ‘If you break it out, it is gone..’. But in this fiscal context we do not
think ‘Oh, maybe we can keep it, maybe it will be used in the future….’.” (Personal communication,
J. Decelle, 11 April 2018).
Beside available financial means, also available infrastructure is necessary for an intermodal
transport network. Only when there is available infrastructure, transshipment can be realized.
Thus, as mentioned earlier, Infrabel has the responsibility to build and maintain the rail
infrastructure. A big issue in the Belgian railway network is the enormous passenger transport. In
Belgium there is no railway line specific for freight transport. This means that trains for passenger
transport and freight transport use the same rails. “In 15 years, the SNCB has seen its passenger
volume increase with 65%...but the railway network has not grown with 65% which almost leads
to saturation due to the frequency of the rail traffic…” (Personal communication, J. Decelle, 11
April 2018). Both sectors are obliged to ask Infrabel a train path and Infrabel has the duty to treat
these requests in an objective way. This results in freight transport being the victim of the
successes of the passenger transport. A big challenge is developing a railway line solely for freight
transport like the Betuwe-line from the Netherlands going to Germany.

37
This rail line is specifically for rail freight transport which gives the port of Rotterdam an advantage
compared to Antwerp. For years, there is in Belgium a discussion concerning the reopening of a
similar line, the Iron Rhine. The Iron Rhine is a railway line also solely used for freight transport
going to the Ruhr district. But due to the complex governmental structure of Belgium, until now
it has not been possible to settle this matter (Personal communication, J. Decelle, 11 April 2018).
Besides these hindrances, Infrabel is doing its best on improving the rail network for freight
transport as well as passenger transport. Concerning freight transport, Infrabel realizes that the
ports are important areas to invest in. One of the priorities is building new rail infrastructure and
expanding capacity. For this, it provides a budget of 0.5 billion euro plus some extra financial
means of the federal government (Infrabel, 2017).
Infrabel considers the port of Antwerp as one of the important areas to invest in. It wants to
support the growth of the increasing port activities, especially concerning container transport,
and this by providing a fluent rail connection in the port area. Infrabel has set a goal to realize a
modal split in the port of Antwerp of 15% for rail transport by 2030. Therefore, several projects
have been planned or even already realized. A first example of an important project that has been
realized in the port is the Liefkenshoek rail link. Since December 2014, it directly links the Left
Bank and the Right Bank. The funding for this project was by means of a public-private partnership
and the Flemish Region even contributed 107 million euro in this project. As mentioned before,
reactivating the Iron Rhine is also a project that Infrabel would like to start with providing a freight
rail line from Antwerp towards the German Ruhr area. Furthermore, the capacity of the Antwerp-
North – Mortsel line has reached its limits. Providing a new freight line, a second rail access, is
considered to be a possible solution for the problem in order to improve the access of the port
(Infrabel, sd).
For the port of Liège not much projects can be found. One example of a project is the expansion
of the marshalling yard Kinkempois in Liège. This will also be financed with the provided 0.5 billion
euro (Infrabel, 2017).

38
When talking about improving the railway network, safety is an important element. The
(expected) growing rail transport requires additional measures to ensure a safe and fluent traffic
management. In this context, Infrabel wants to invest 1.3 billion euro in improving the safety by
further developing the European Train Control System (ETCS). ETCS is part of the European project
ERTMS which was mentioned before. The ETC system is about the signaling and controlling rail
transport and it should ensure a proper monitoring of train movements (Infrabel, 2017).
3.2.1.2 Regional government
Since the sixth reform in 2014 a lot of competences were transferred from the federal
government to the communities and regions. Competences concerning IWW is an example of a
competence that was transferred to the regions. The port of Antwerp falls under the Flemish
region and the port of Liège is in the area of the Walloon region.
Antwerp is the second-largest port in Europe and the 15th container port in the world. It is known
as the gateway to Europe due to its central location towards the European hinterland. The total
port area accounts for 12.068 hectares with 1.047 kilometers of rails and 169 kilometers of useful
quays. In 2016, 10.037.341 TEU was handled in the port of Antwerp. Antwerp is also very known
for the high productivity in handling containers because per crane 40 moves are done per hour
(Antwerp port authority, sd). Although the port of Antwerp offers good rail and IWW connections
towards the rest of Europe, the most containers are still transported via road. The figure below
(18) indicates this large part of the road transport and it also shows that rail transport only has a
very small share in the container transport. Thus, this again proves that the shift from road
towards more sustainable transport modes has not been realized yet.

39
Figure 18: modal split port of Antwerp (Source: (Port authority Antwerp, sd))
The port of Liège is the largest inland port of Belgium and even the third inland port of Europe.
The port area extends over 382 hectares and 26 kilometres of quay. The port counts 32 port zones
that are spread along the Meuse and the Albert Canal. In 2016, 61.837 TEU was handled in the
port of Liège. The port of Liège is ideally situated in the hinterland of big seaports including
Antwerp and Rotterdam at the cross-section of important railway networks. The port of Liège is
as an inland terminal an important actor for the further distribution in Europe (Port authority
Liège, sd). The figure below indicates the modal split of the port. This shows that IWW transport
is very popular in the port of Liège and is the major transport mode. Though, in fields of rail
transport a bigger share is desirable. Thus, stimulating intermodal transport is mostly a matter of
environmental considerations. But also, the Walloon government believes that it is a facilitator of
economic development as it can be a source of competitiveness between industries (personal
communication, P. Moens, 27 April 2018).

40
Figure 19: modal split port of Liège (Source: personal communication, H. Thiébaut, 13
July 2018)
3.2.1.3 Flemish government
The Flemish minister of mobility, Ben Weyts, states in the policy document of 2014-2019 that
building and improving the waterways network is very important to stimulate and innovate the
IWW. One of the goals stated is the development of a multimodal Flemish transport policy. The
purpose is to obtain a fluent traffic flow and a transport system as environmental-friendly as
possible. Also the use of each transport mode with their strengths in order to reduce costs is
important. Thereby, the goal is to situate distribution centers and business areas nearby the
multimodal transshipment points. In order to achieve a multimodal system, IWW is considered
to be an important element. Though, as mentioned before, the IWW does not offer a big network
and also the Flemish minister realizes this and states that improving the quality of the IWW
network is necessary. Therefore, investments in infrastructure are needed and also the
accessibility of the Flemish ports is very important (Weyts, 2014). The Department of Mobility
and Public Works has a budget of 3,67 billion euro of which 664 million euro is provided for the
maintenance of the waterways and ports. Significant is that more budget, specifically 808 million
euro, is provided for road infrastructure (Vlaamse overheid, 2014).
17%
76%
7%
Road IWW Rail

41
What must be taken into account is that the competences of the Flemish government is restricted
in the Flemish Port Decree. This decree settles the division of powers between the Flemish
government and the Flemish port authorities in order to make the port authorities more
autonomous. An example of a competence of the port authority is the management and
exploitation of the public and private port area. The competences of the port authority will be
discussed later on (Vlaamse Havencommissie, sd).
The Flemish government is divided into several departments and agencies. Also in order to
execute its competences concerning the IWW, the tasks are divided among various autonomous
government bodies.
B. De Vlaamse Waterweg
In the beginning of this year two governmental organizations, ‘Waterwegen en Zeekanaal nv’ and
‘nv De Scheepvaart’, were merged into one autonomous organization ‘De Vlaamse Waterweg nv’.
It is responsible for the management and exploitation of the waterways. With its 1.350
employees, it strives to promote IWW transport by developing industrial area and by developing
the waterways. Thereby, water management is also one of their competences. The latter
concerns actions that need to be taken to avoid floods. It does not solely concern freight transport
but also passenger transport is included. An example is providing pontoons for water taxis.
Though, more than 80% of their actions is focused on freight transport. The Vlaamse Waterweg
(VWW) wants to make IWW an attractive transport mode by developing and optimizing the
Flemish waterways. The territorial scope of their competences extends over all navigable Flemish
canals and waterways and also the territories next to it. This latter makes it possible to also be a
landlord and thus business areas can be given in concession along the waterways (Personal
communication, Lynn Eyckmans, 22 June 2018).

42
When discussing the benefits and disadvantages of each transport mode, it was clear that IWW
transport requires high investment and especially for infrastructure. In order to tackle this
financial problem, De Vlaamse Waterweg provides the possibility of a public-private partnership.
Companies seeking for a location are most likely obliged to install installations for loading and
unloading. When this occurs, VWW will finance 80% of the infrastructure and so the company
itself only has to invest 20%. The company is then engaged to transport, over a period of 10 years,
a certain amount of goods via waterways (Personal communication, Lynn Eyckmans, 22 June
2018).
In terms of traffic management De Vlaamse Waterweg plays an important role as they are
responsible for building waterway infrastructure such as bridges and locks. In order to have a
fluent traffic flow, a lot of bridges have been automated. This means that nobody is present but
from a distance it gets monitored. This is also in view of the upcoming automated ships. To make
IWW transport more attractive, they also decided to provide a Sunday operation. Before, on
Sundays the locks and bridges were not operated. Now, when a company requests passage, they
will make sure that the locks will be operated. The waterways are broadened but bridges are also
elevated. In order to make IWW more attractive, De Vlaamse Waterweg wants to make bridges
higher in order to be able to transport four containers high. Currently, three containers can be
stacked on each other but if four containers could be stacked, a lot of extra volume can be added
(Personal communication, Lynn Eyckmans, 22 June 2018).
“More and more, we are also focusing on time management. For example, on each ship there is
an Automatic Identification System (AIS) and by means of this, it is possible to know where a ship
is situated, if they pass locks or bridges, …. If all information could be shared, it would be possible
to perfectly estimate when a ship will arrive. It is just like the GPS system of a car that can estimate
when you will arrive”. (Personal communication, Lynn Eyckmans, 22 June 2018).

43
De Vlaamse Waterweg has also transport experts who visit companies in order to provide them
information on their possibilities to transport via the waterway. Giving information is also a very
important role of the government, especially because some companies are resistant because they
do not know how to manage it and so on. Also when a company does not have enough volume
to transport, the experts will seek for solutions. For example, if the neighboring company also has
limited volume to transport, the expert will propose on transporting both volumes on one ship.
At last, in 2004 the VWW also had a support programme for companies focusing on intermodal
transport but this ended (Personal communication, Lynn Eyckmans, 22 June 2018). .
Thus, VWW is taking a lot of actions in order to promote the inland waterways. The question
remains what efforts it is making for the port of Antwerp. A first example of a cooperation
between the port authority and VWW is the Central Booking Platform. The idea was to avoid
empty container transport by building a platform. Thus, when connecting all depots in order to
know where empty containers are situated, they can be used to transport goods to the port of
Antwerp, where they can be filled up again for transport. The problem was that companies had
to share their data and of course this is very difficult to do with your competitors (Personal
communication, Lynn Eyckmans, 22 June 2018).
Upgrading the Albert Canal is also a project wherein the VWW plays a role. The port authority of
Antwerp, VWW and the port authority of Liège have made an engagement to invest in the Albert
Canal. The Canal is crucial for the port of Antwerp as it forms the connection with the inland
terminals. As it also leads to the port of Liège it is very good for its economic development. This
project that will be realized by several smaller projects is essential for the promotion of IWW
transport. The VWW wants to adapt all 64 bridges over the Canal by 2020 (Port authority Liège,
2014).

44
D. Maritieme Toegang
The Flemish Maritime Access is responsible for dredging, managing and maintaining the accesses
towards and in the Flemish ports and also does this autonomous. It builds and improves the
infrastructures that are necessary for the accessibility of the ports such as locks. Furthermore it
dredges the waterways to ensure a sufficient depth or width but it also removes obstacles that
hinder the accessibility. Furthermore, it also provides subsidies for certain infrastructures in the
ports such as quay walls (Personal communication, F. Aerts, 19 April 2018).
Maritiem Toegang does not have a mission statement concerning the stimulation of intermodal
transport. The department does strive for a sustainable development of transport but they are
solely responsible for the access towards ports according to the Port Decree. Accessibility is of
course also an important element to make waterborne transport more attractive so indirectly it
also helps in promoting IWW transport.
Maritiem Toegang was part of some very important projects for the port of Antwerp. An example
is the Kieldrecht lock that offers access towards the docks in the left bank. The lock is the biggest
in the world and assures fluent access in the port of Antwerp. The lock before was much smaller
which eventually lead to waiting times and so this new lock provides a fast traffic flow (Port
authority Antwerp, 2016).
Another example of improving the traffic flow of the waterway is the renovation of the Royers
lock. This year the port authority of Antwerp decided on renovating this lock and this will be
realized in cooperation with Maritiem Toegang. The purpose is to open this lock exclusively for
IWW transport to stimulate a modal shift. It is believed that IWW will help to expand the container
handling capacity (Port authority Antwerp, sd).

45
3.2.1.4 Walloon government
The structure of the Walloon government is somehow different. The Walloon public service
(Service Public de Wallonie) is divided in several operational directorate-generals (ODG). The
competence of the waterways is in hands of the ODG mobility and waterways. Within the ODG,
the tasks are then again divided among several departments. The Walloon minister Carlo Di
Antonio advocates for an accessible, fluent, environmental-friendly and safe mobility system. The
Walloon government has made an infrastructure plan wherein the improvement of 450
kilometers of waterways is included. They also understand the impact of IWW on the
environment and want to make an effort to stimulate sustainable transport (Antonio, sd).
The implementation of the policy of the minister of mobility is done by the ODG of mobility and
waterways (Direction générale opérationnelle de la Mobilité et des Voies hydrauliques) and for
this it receives 6,4% of the Walloon budget which is approximately 870.000 euro (Service Public
de Wallonie, 2017). The ODG manages 300 kilometres of waterways and various bridges. “The
mission consists of participation in the development of the ports and participation in the
development of transport policy of the various government levels. But also the improvement,
maintenance and control of the waterway network. A difference with the Flemish government is
that the dredging is done by a private company.” (Personal communication, P. Moens, 27 April
2018).
E. Direction de la Promotion des voies navigables et de l’intermodalité (DPVNI)
Subordinate to the ODG there is a department for the promotion and facilitation of IWW and
intermodality. “The department provides financial means for projects of companies that concern
intermodal transport. That money goes to equipment, specialized equipment like cranes or other
system to charge or discharge ships or trains” (Personal communication, P. Moens, 27 April 2018).
There is a subsidy provided for companies who invest in the development of freight transport by
IWW or rail. This is 30% for smaller and average companies and 20% for big companies with a
maximum of 500.000 euro per year. Also, for container transport by IWW a subsidy of 12 euro
per 20-foot container and 36 euro per 40-foot container is provided. This is for the operator of a
46
regular container line departing from a terminal in Wallonia (SPW, 2017).
“We also have a role of information and communication and stimulation. We give information to
the sector and organize one big event a year for the private sector to meet each other and develop
their projects. We also participate in several logistic business places like the logistic week in Paris
where we meet people who are interested in intermodality and IWW” (Personal communication,
P. Moens, 27 April 2018).
3.2.1.5 Provincial and local government
The provinces are responsible for everything that is in interest of the province. This means that
they also deal with the environment, waterways, transport etc. in their territory. This is the same
for the communes. Both have autonomy but they are still under supervision of the higher
government bodies. Based on the literature study and the interviews that were taken, it can be
concluded that the province of Antwerp and Liège are not taking initiatives to stimulate
intermodal transport or to further develop the ports. The same can be concluded for the City of
Antwerp and the City of Liège.
F. Antwerp port authority
“The port authority actually belongs to the City of Antwerp, we are part of the City.” (personal
communication, I. Nuytemans, 19 April 2018). Before 1997, the port was managed by the City
council but then a Communal port authority was established. Eventually, in 2016 it became an
autonomous port authority. The port of Antwerp only has one shareholder namely the City of
Antwerp (Port authority Antwerp).
Nowadays, with its 1584 employees the port authority stands in for the functioning of the port in
order to keep its world position. In its business plan for 2018-2020, the management and
development of areas and infrastructure is stated to be a core task of the port authority. The
vision is to expand its capacities. A second priority is to ensure a fluent traffic flow towards the
port, by stimulating a modal shift (Port authority Antwerp, 2018).

47
The port authority is pursuing an expansion of the container capacity. Together with the Flemish
government it is decided to start the project Extra Containercapacity Antwerp (ECA). It is not sure
yet what will be done in order to achieve this extra capacity. Several solutions have been
examined and discussed but until now, no ‘perfect’ alternative has been found. As the container
traffic is growing, it is very important to create space to receive and handle the containers.
Thereby, the port authority is taking into account sustainable transport and wants to assure that
there is interconnection between the transport modes (Port authority Antwerp, sd).
The ambition of the port authority is to achieve the modal shift given in figure 20 below. As
already discussed, rail transport is a federal competence but the Flemish government has chosen
to invest in projects in order to assure the realisation of the projects and this in a shorter period.
Concerning IWW, a problem that the port was facing, was the waiting times for barges. “Barges
nowadays have to fight for a place at the quay but when there is a seagoing vessel they have to
wait. So, at the end of the Antwerp Gateway the water is less deep due to sand and we have
established a dedicated quay for barges in order to tackle this problem” (Personal communication,
I. Nuytemans, 19 April 2018). Now, the port authority is trying to create more of these dedicated
quays for barges and pays the quays but the hardening of the ground must be paid by the
company.
Figure 20: modal split ambition 2030 Antwerp (Source: (Port authority Antwerp, sd))

48
Another example of what the port authority undertakes to stimulate intermodal transport, is
financing certain projects of companies. Last year, they have made a call for companies with ideas
for new or improved mobility solutions for freight transport. A couple projects were then selected
who were given a financial support for starting up the project. This was only given for three years
and then the project should be developed enough in order to keep running without the support
of the port authority. After this, the Flemish government also made a call to finance projects
(personal communication, I. Nuytemans, 19 April 2018).
Also the bundling of volumes for rail and IWW is one of the things that the port authority
considers to be a priority. The purpose is that big volumes come together at one terminal.
Nowadays, every ship stops in every terminal to unload 10 containers. “But every time, cranes
have to be operated just to handle a small ship with 10 containers and five minutes later again…”
(personal communication, I. Nuytemans, 19 April 2018). This leads to waiting times and thus the
port authority wants a more efficient handling of the containers.
G. Liège port authority
The port authority of Liège is already since 1937 an autonomous governmental body. “The mission
of Liège Port Authority is to develop, maintain and promote commercial activity in the ports of
Liège province” and tries to do this with 35 employees (Personal communication, H. Thiébaut, 13
July 2018).
The main initiative of the port authority is establishing a multimodal platform. With this, the port
authority aims at handling 200.000 TEU per year. A zone of 120 hectares will be dedicated to
logistics and also a container terminal of 15 hectares will be provided. This project is called ‘Liège
Trilogiport’ because rail, road and IWW transport will be provided in this zone. Thus, the port
authority wants to stimulate intermodal transport by actually building an intermodal logistics
platform (Personal communication, H. Thiébaut, 13 July 2018).

49
In order to finance their actions, the port of Liège depends on its own revenues from renting land
and fees. The ODG does give a subsidy for building works in the port. All infrastructure works in
the port are financed for 80% by the Walloon government (Personal communication, H. Thiébaut,
13 July 2018).
3.2.2 The Netherlands
In the Netherlands, the government structure also consists of provinces and communes but the
upper level only consists of the central state government. The latter can be compared to the
federal government of Belgium. The competences are also divided among several ministers who
are responsible for a certain ministry. Each ministry consists of several agencies and independent
administrative bodies (Overheid, sd).
Rotterdam is the largest port in Europe and the 12th container port in the world. The total port
area is 12.643 hectares and 74,5 kilometers of quay walls. In 2017, the port of Rotterdam handled
14.260.000 TEU. The port infrastructure has been declared to be the best in the world and this
already six times (Porth authority Rotterdam, sd). When looking at the modal split, road transport
is also the major transport mode as in Antwerp. The goal is to reduce the share of road transport
to 35% by 2030. In order to achieve that goal, the port of Rotterdam still has to undertake actions
to promote IWW and rail transport.
Figure 21: Modal split port of Rotterdam (Source: (Port authority Rotterdam, 2017))
53%36%
11%
Road IWW Rail
50
3.2.2.1 Central government
Unlike in Belgium, the competences of rail, road and IWW transport fall all under one ministry
and thus one minister, namely Cora van Nieuwenhuizen who is responsible for infrastructure and
the environment. The mission of the ministry is to create powerful connections via road, rail and
water and to assure a fluent flow and a good accessibility while taking the environment into
account. In order to fulfill this, the ministry is planning on spending approximately 8,5 billion euro.
H. Rijkswaterstaat
The Rijkswaterstaat is the implementing body of the ministry. It is authorized to manage and
develop the roads and waterways. Building bridges and maintaining the existing infrastructure
are a few of the tasks of the Rijkswaterstaat. It is comparable to the VWW of the Flemish
government who also manages and maintains the waterways and the infrastructure
(Rijkswaterstaat, sd).
As the port of Antwerp likes to establish a project concerning the bundling of goods, the
government of the Netherlands already provided a subsidy for projects for the bundling of goods.
Eight projects were chosen who received a financial support in order to deal with the existing
barriers (TRAIMCO, 2016).
The Rijkswaterstaat finances various projects for developing the port of Rotterdam. Some
examples of projects are given in the section on the port authority.
I. ProRail
ProRail is responsible for the management and maintenance of the railway network. It is
comparable to Infrabel of Belgium as it is also an autonomous body. ProRail has stated three goals
namely to develop capacity for the future mobility, making transport by rail more reliable and
making the rail mobility as sustainable as possible. In order to realize its goals, ProRail receives
financial means of the ministry.

51
In cooperation with Rijkswaterstaat, ProRail wants to realize a new rail line for freight over the
Botlekbridge. This is not only to improve the rail network, also for inland waterways this project
is important as the low bridge formed a barrier (ProRail, 2018).
ProRail is also busy realizing the Programme Highfrequent Railtransport. As the name of the
programme says, the goal is to make the railway network suitable for the upcoming railtransport.
The core idea is putting more passenger transport on busy routes and giving freight transport
more space. But, ProRail does not build completely new infrastructure for it. The purpose is to
use the existing infrastructure. Freight transport will usually use the Betuweroute and
freightroutes East-Netherlands and South-Netherlands but the latter will be adapted due to the
limited capacity (ProRail, 2018).
Also safety is considered to be important. ProRail wants to provide the ERTMS on as much
infrastructure as possible. For this, ProRail organized the programme ERTMS together with the
ministry of Infrastructure and Waterway. Also strengthening the competitive position of rail
transport is a priority of ProRail. It wants to realize this by shortening the leadtime and by
preparing the rail for trains of 740 meters long. The latter is with the view on the European goal
(ProRail, 2018).
For the port of Rotterdam, the Theemswegtracé is a very important project. This project is
explained later on.
3.2.2.2 Provincial and local government
The provinces in the Netherlands have broad competences. The province is an autonomous
government body and can decide on various things. Some examples of competences are deciding
where to build business areas, where rails or waterway connections should come and it also
monitors the communes. The communes implement tasks that are of direct interest of the
inhabitants. In order to complete tasks, the provinces and communes receive partly financial
means of the central government. Based on the interview with the port authority and the
literature, it can be said that the City of Rotterdam is not involved in developing the intermodal
transport network. It solely provides financial means (Overheid, sd).

52
J. Province North Brabant
North Brabant is situated in between the ports of Antwerp and Rotterdam and forms the
hinterland connection to the Ruhr area. Due to its position, the province considers its
infrastructure network to have an important role in the freight transport e.g. from Rotterdam to
Antwerp. Therefore, it would like to improve its accessibility and infrastructure connection
(Provincie Noord-Brabant, 2014).
Also concerning IWW transport, the province realizes the benefits of its strong position. The
waterway network of Brabant consists of several waterways and canals. The waterway network
of Brabant connects the province with for example the port of Rotterdam. That is why the
province aims at stimulating freight transport via IWW. Broadening the capacity of certain parts
is one of the actions that will be taken (Provincie Noord-Brabant, 2014)..
Though the port of Rotterdam is situated in the province of South Holland, M. van Schuylenburg
of the port authority of Rotterdam claims to work a lot together with the province North Brabant.
(personal communication, 27 July 2018). Nevertheless, no examples of efforts concerning the port
of Rotterdam has been found.
K. Province of South Holland
The province of South Holland aims at making waterway transport an attractive alternative for
road transport. Investing in the maintenance of the waterways and providing sufficient berths are
the actions that the province wants to take. Furthermore, the province helps on realizing the Port
Vision by means of finances and in the next part some examples of projects will be given
(Provincie Zuid Holland, 2015).

53
L. Rotterdam port authority
The port authority of Rotterdam is responsible for the management and development of the port
area. Thereby, it is also responsible for a safe and smooth handling of the shipping. It is an
autonomous government body and the shareholders are for 70% the City of Rotterdam and 30%
by the State. Before 2004, the port authority of Rotterdam was a communal port authority “but
now the City of Rotterdam is at a further distance from us”. (Personal communication, M. van
Schuylenburg, 27 July 2018). The port authority employs for its functioning 1150 people.
The port authority has made a vision until 2030 containing some objectives. Providing
infrastructure is again a crucial element in stimulating a modal shift. Together with the
Rijkswaterstaat, the port authority wants to give attention to projects that improve the quality
and accessibility of the port. Several projects are chosen and some are already being realized (Port
authority Rotterdam, 2011). An example of a big project is the Theemswegtracé. The first part of
the Betuweroute will be replaced by the new Theemswegtracé. This will be four kilometres long
and at the same time it forms a solution for two bridges that form a problem for IWW transport
(Port authority Antwerp, sd).
The port authority invests also in places where barges can wait and is trying to improve the
handling process. “In the IWW there sometimes is a congestion problem and we try to bring
parties together to solve it and to invest in solutions” (Personal communication, M. van
Schuylenburg, 27 July 2018). By means of the Container Exchange Route (CER), a possible solution
is provided. The idea of the CER is bundling containers. This means that trains and barges do not
have to go to the different terminals anymore. In this way the port authorities strives for a smooth
traffic flow (Port authority Rotterdam, sd). Also the deepening of the Nieuwe Waterweg and the
Botlek is done to allow the bigger ships of today and the renovation of the Suurhoffbrug (Port
authority Rotterdam, 2011). At last, another way of trying to achieve a modal shift is including
obligations when giving business areas in concession. When a contract is made with a company,
the limit of 35% road transport by 2035 is obliged. If they exceed this maximum, the companies
will receive fines (Personal communication, M. van Schuylenburg, 27 July 2018).

54
CONCLUSION
When looking at the policies of the governments we can actually conclude that they are focused
on the disadvantages of each transport mode. At first, for both rail and inland waterway
transport, the limited network was a disadvantage of using these transport modes. Therefore, all
governments are making an effort to expand the networks and to improve the existing networks.
A few examples for rail transport: Infrabel building the Liefkenshoek rail link, Infrabel expanding
the marshalling yard in Liège and ProRail with its Programme concerning Highfrequent
Railtransport. For the inland waterway network the port authority of Rotterdam is renovating the
Suurhoffbrug and deepening the Nieuwe Waterweg. The VWW, port of Liège and port of Antwerp
are working together on the upgrade of the Albert Canal and Antwerp is even working on the
expansion of the container capacity. Maritieme Toegang from the Flemish government is also
involved in the expansion of the network by for example renovating the Royers Lock in order to
dedicate it to IWW transport. All government instances are doing what is possible in order to
create these broad networks of rail and waterways. Though, Infrabel would like to open a
dedicated rail line for freight but this discussion is already going on for years while the
Netherlands already have such dedicated Betuwe-line. The big amount of passenger transport is
occupying the rails that also must be used for freight transport.
The cost of the transport modes is also a very important factor on which decisions are made.
Although rail transport and inland waterway transport are financially more attractive for long
distances, the investment price forms a barrier. The governments, both in Belgium and the
Netherlands, have taken some measures to get rid of this hurdle. At first the cost for
infrastructure is important. Concerning infrastructure, the VWW provides a public private
partnership whereby companies only have to pay 20% of the infrastructure. The DPVNI of
Wallonia provides a subsidy for companies investing in the development of freight transport by
IWW or rail. Concerning the Netherlands, no specific initiatives concerning infrastructure cost has
been found.

55
Another cost is the cost for operation. More specific, using a train to transport containers is only
profitable when there is a large volume that needs to be transported. Not every company has
large volumes to be transported and thus will chose for the much cheaper road transport. For
this, initiatives are being taken to create a system of bundling in the port of Antwerp. Now, at
several quays there are container volumes that are not sufficient to fill a complete train by itself
but when putting all the containers of all quays a train could be filled. Though, bundling all these
containers is a very big cost.
Therefore, there is a proposal at the European Commission so that in the port of Antwerp big
projects can be set up to realize this. But not only for rail transport, also for IWW they want to
apply the system of bundling. The Netherlands has taken initiatives for bundling already years
ago. Rijkswaterstaat already provided a subsidy programme wherein companies could send in
their project ideas for bundling. Currently, the port authority of Rotterdam is also working on a
Container Exchange Route for bundling the containers. Also, the Belgian federal government
provides subsidies for specific rail transport and DPVNI provides subsidies for container transport
via IWW.
At last, the smooth and safe traffic flow is also a point of focus. Concerning the rail, both Infrabel
and ProRail are making the European Rail Traffic Management System as a priority. In context of
IWW, both ports have known congestion problems. Barges are confronted with waiting times.
The port of Antwerp is trying to solve this problem by means of dedicated terminals and the port
of Rotterdam is trying to solve this partly by the Container Exchange Route. The VWW is also busy
with building automatic bridges for a smooth traffic flow, the operation of locks on Sundays has
been made possible and so on.
All the efforts that are made for transport and mobility just shows how important the transport
sector is. The sector is key for economic development which makes constant improvement of it a
crucial thing. In the world we live today, due to technology for instance, everything is changing
rapidly. Therefore, it is important to be able to catch up with the new and upcoming trends.

56
Overall, the various government bodies are making a lot effort to tackle the obstacles that come
along with intermodal transport. Their actions also show a lot of similarities such as bundling and
dedicated rail line. Of course, there is space for improvement, but Rome was not built in one day
either.
Each research has its restrictions and so does mine. More interviews should be taken in order to
make the overview more specific and detailed. Though, I believe that this overview forms a good
basis for further research. It indicates the differences and similarities between the government
structure of Belgium and the Netherlands and their approach towards intermodal transport. The
goal of this research was solely describing the involvement of the government bodies. Further
explanatory or evaluating research can be done based on this overview. In order to achieve a
modal shift, it could be interesting to do further research to seek for the best practice. This can,
for example, be done by measuring the satisfaction of terminal operators, logistical actors, ….
within the ports.

57
BIBLIOGRAPHY
Allen, R. (2017). The Disadvantages of Intermodal Transportation. Opgeroepen op Juni 2018, van Bizfluent: https://bizfluent.com/info-8420695-disadvantages-intermodal-transportation.html
Antonio, C. D. (sd). Travaux publics. Opgeroepen op July 2018, van Di Antonio: http://diantonio.wallonie.be/home/competences/travaux-publics.html
Antwerp port authority. (sd). Port Area. Opgehaald van Port of Antwerp: https://www.portofantwerp.com/nl/het-havengebied
Bellot, F. (2017). Algemeen beleidsnota mobiliteit. Bickel, P., & Friedrich, R. (2005). ExternE. Externalities of Energy. Luxemburg. Opgeroepen op
Juni 2018 Brundtland Commission. (1987). Our common future: the world commission on environment and
development. Oxford University Press. Opgeroepen op Juli 2018 CD&V. (2017). Economie en de rol van de overheid. Opgeroepen op Juni 2018, van cdenv:
https://www.cdenv.be/standpunten/economie-de-rol-van-de-overheid/ Christiaens, T. (2015). Synchromodaliteit en de rol voor de haven (Paper). Crainic, T. G., & Kim, K. H. (2007). Intermodal transportation. Handbooks in Operations Research
and Management Science, 14, 467-537. D'hoedt, M. (2010). Duurzame Europese intermodale logistieke netwerken met integratie van de
motorways of the sea (Thesis). Opgeroepen op Juni 2018 EEA. (2017). Road traffic remains biggest source of noise pollution in Europe. Opgeroepen op
Juni 2018 EEA. (2017). Share of transport GHG emissions. Opgeroepen op Juni 2018, van European
Environment Agency: https://www.eea.europa.eu/data-and-maps/daviz/share-of-transport-ghg-emissions#tab-chart_1
Europa Nu. (sd). Beleid vervoer. Opgeroepen op Juli 2018, van Europe-nu: https://www.europa-nu.nl/id/vg9pkzu1yryd/beleid_vervoer
European Commission. (2011). White paper: Roadmap to a Single European Transport Area – Towards a competitive and resource efficient transport system. Brussels.
European Commission. (sd). Connecting Europe Facility. Opgeroepen op July 2018, van Mobility and transport: https://ec.europa.eu/transport/themes/infrastructure/ten-t-guidelines/project-funding/cef_en
European Commission. (sd). EU fuding for TEN-T. Opgeroepen op July 2018, van Mobility and transport: https://ec.europa.eu/transport/themes/infrastructure/ten-t-guidelines/project-funding_en
European Commission. (sd). Infrastructure-Ten-T-Connecting Europe. Opgeroepen op July 2018, van Mobility and transport: https://ec.europa.eu/transport/themes/infrastructure_en
European Commission. (sd). Motorways of the Sea. Opgeroepen op July 2018, van mobility and transport: https://ec.europa.eu/transport/themes/infrastructure/motorways-sea_en
European Commission. (sd). Rail. Opgeroepen op July 2018, van Mobility and transport: https://ec.europa.eu/transport/modes/rail_en
58
European Court of Auditors. (2015). Inland Waterway Transport in Europe: No significant improvements in modal share and navigability conditions since 2001. Luxemburg. Opgeroepen op Juni 2018
European Environment Agency. (2016). Noise pollution is a major environmental health concern in Europe. Opgeroepen op Mei 2018
European Shortsea Network. (sd). Definition. Opgeroepen op Juni 2018, van Shortsea: http://www.shortsea.info/definition.html
European Union. (2017). Statistical pocketbook: EU transport figures. Luxemburg. Opgeroepen op Mei 2018
European Union. (sd). Clean transport, Urban transport. Opgeroepen op Mei 2018, van Mobility and transport: https://ec.europa.eu/transport/themes/urban/urban_mobility_en
European Union. (sd). Transport emissions. Opgeroepen op Mei 2018, van European Commission: https://ec.europa.eu/clima/policies/transport_en
Europese Commissie. (2011). Witboek: stappenplan voor een interne Europese vervoersruimte - werken aan een concurrerend en zuinig vervoerssysteem. Opgeroepen op Juli 2018, van https://eur-lex.europa.eu/legal-content/NL/TXT/PDF/?uri=CELEX:52011DC0144&from=EN
Eurostat. (2017). Database transport. Opgeroepen op Mei 2018, van http://ec.europa.eu/eurostat/web/transport/data/database
Federale Overheid. (2014). Regeerakkoord. Flanders Investment & Trade. (2011). Stroomlijn uw logistieke activiteiten... en verleg grenzen.
Brussel: Koen Allaert. Opgeroepen op Juli 2018 Fox, J. (2017, April 25). OK, Maybe Globalization isn't dead. Bloomberg. Opgeroepen op Mei
2018 Hayuth, Y. (1987). Intermodality: concept and practice. Essex: LLoyd's of London press ltd. Hunkar, D. (2011). 2 charts showing the global economy is recovering. Seeking Alpha.
Opgeroepen op Mei 2018 Infrabel. (2017, December). INFRABEL ZAL 4,3 MILJARD EURO INVESTEREN IN DE PERIODE 2017-
2020 EN BIJKOMEND 1,15 MILJARD EURO VAN 2018 TOT 2031. Opgeroepen op July 2018, van https://www.infrabel.be/nl/nieuws/infrabel-4-3-miljard-euro-investeren-periode-2017-2020-bijkomend-1-15-miljard-euro-2018-tot
Infrabel. (sd). De haven van Antwerpen. Opgeroepen op July 2018, van Infrabel: https://www.infrabel.be/nl/de-haven-van-antwerpen
Infrabel. (sd). Who is Infrabel. Opgeroepen op July 2018, van Infrabel: https://www.infrabel.be/en/about/our-company/who-infrabel
Inland Navigation Europe. (2018). Maps and fleet. Opgeroepen op Juni 2018, van INE: http://www.inlandnavigation.eu/what-we-do/maps-fleet/ .
Janic, M. (2007). Modelling the full costs of an intermodal and road freight transport network. Tranportation Research Part D: Transport and Environment, 12(1), 33-44.
King, N., & Horrocks, C. (2010). interviews in qualitative research. London: Sage. Kuipers, B. (2014, Oktober). Ja, de container is de uitvinding van de eeuw. NRC. Opgeroepen op
Mei 2018 Macharis, C., & Bontekoning, Y. (2004). Opportunities for OR in intermodal freight transport
research: a review. European Journal of Operational Research, 153(2), 400-416.
59
Macharis, C., & Verbeke, A. (1999). Intermodaal vervoer: economische en strategische aspecten van het intermodaal vervoer in Vlaanderen. Leuven: Garant.
Majerčák, J., Kudláč, Š., & Panák, M. (2015). Choosing the right mode of transport in freight transport. Opgeroepen op Juni 2018
Meisel, F. (2009). Seaside Operations Planning in Container Terminals. Berlin: Physica-Verlag. doi:10.1007/978-3-7908-2191-8 2
Modes transportation explained best. (2018, Maart). Opgeroepen op Juni 2018 , van Freight Hub: https://freighthub.com/en/blog/modes-transportation-explained-best/
Mortelmans, D. (2013). Handboek kwalitatieve onderzoeksmethoden. Leuven: Acco. Muncrief, R., & Sharpe, B. (2015). Overview of the heavy-duty vehicle market and CO² emissions
in the EU. Neuteleers, Y. (2013). Op zoek naar de optimale locaties van intermodale terminals (Thesis). OECD. (1997). Towards sustainable transport. Opgeroepen op Mei 2018 OECD. (2003). Glossary of statistical terms. Opgeroepen op Juni 2018, van OECD:
https://stats.oecd.org/glossary/detail.asp?ID=4303 Ortiz-Ospina, E., & Roser, M. (2018). International trade. Opgeroepen op juli 2018, van Our
World in Data: https://ourworldindata.org/international-trade#data-sources Ortiz-Ospina, E., & Roser, M. (2018). International Trade. Opgeroepen op mei 2018, van Our
World in Data: https://ourworldindata.org/international-trade#data-sources Overheid. (sd). Wie vormen de overheid? Opgeroepen op August 2018, van Rijksoverheid:
https://www.overheid.nl/zo-werkt-de-overheid/wie-vormen-de-overheid/ Port authority Antwerp. (2016, June). Kieldrechtsluis klaar om meer welvaart naar Vlaanderen
te halen. Opgeroepen op July 2018, van https://www.portofantwerp.com/nl/news/kieldrechtsluis-klaar-om-meer-welvaart-naar-vlaanderen-te-halen
Port authority Antwerp. (2018). Ondernemingsplan 2018-2020. Port authority Antwerp. (sd). Complex Project extra containercapaciteit. Opgeroepen op August
2018, van Port of Antwerp: https://www.portofantwerp.com/nl/extra-containercapaciteit
Port authority Antwerp. (sd). Naar een efficiënter goederenvervoer. Opgehaald van Port of Antwerp: https://www.portofantwerp.com/nl/naar-een-effici%C3%ABnter-goederenvervoer
Port authority Antwerp. (sd). Over het Havenbedrijf Antwerpen. Opgeroepen op July 2018, van https://www.portofantwerp.com/nl/raad-van-bestuur
Port authority Antwerp. (sd). Renovatie Royerssluis. Opgehaald van https://www.portofantwerp.com/nl/renovatie-royerssluis
Port authority Antwerp. (sd). Van Calandbrug naar Theemswegtracé. Opgeroepen op August 2018, van Port of Rotterdam: https://www.portofrotterdam.com/nl/onze-haven/havenontwikkeling/van-calandbrug-naar-theemswegtrace.
Port authority Liège. (2014, April). 75 jaar albertkanaal aanleiding voor toekomstgericht samenwerkingsakkoord. Opgeroepen op July 2018, van http://www.portdeliege.be/nl/news/378_75-jaar-albertkanaal-aanleiding-voor-toekomstgericht-samenwerkingsakkoord
Port authority Liège. (sd). Geographical situation. Opgeroepen op July 2018, van Port of Liège:

60
http://www.portdeliege.be/nl/liege-port-autonome-situation-geographique Port authority Rotterdam. (2011). Havenvisie 2030. Port authority Rotterdam. (2017). Voortgangrapportage 2016 Havenvisie 2030. Port authority Rotterdam. (sd). Container Exchange Route. Opgeroepen op August 2018, van
Port of Rotterdam: https://www.portofrotterdam.com/nl/zakendoen/haven-van-de-toekomst/innovatie/container-exchange-route-cer
Porth authority Rotterdam. (sd). Haveninfrastructuur. Opgeroepen op August 2018, van Port of Rotterdam: https://www.portofrotterdam.com/nl/onze-haven/feiten-en-cijfers/feiten-en-cijfers-over-de-haven/haveninfrastructuur
ProRail. (2018). Beheerplan 2018. Provincie Noord-Brabant. (2014). Structuurvisie 2010 - partiële herziening 2014. Provincie Zuid Holland. (2015). Hoofdlijnenakkoord 2015-2019. Raghav. (sd). Nature of transport costs and pricing: (an overview). Opgeroepen op Juli 2018, van
Geography Notes: http://www.geographynotes.com/articles/nature-of-transport-costs-and-pricing-an-overview/209
Rijkswaterstaat. (sd). Onze missie. Opgeroepen op August 2018, van https://www.rijkswaterstaat.nl/over-ons/onze-organisatie/onze-missie/index.aspx
Sannen, G. (2016). infrastructuur als ruggengraat van onze economie. Opgeroepen op Juni 2018, van https://www.confederationconstruction.be/Portals/0/documenten/VCB/Infrastructuurdag151116/1.%20Goedle%20Sannen%20-%20Infrastructuurdag_Economisch%20belang%20infrastructuur_15nov2016.pdf
Saver, J. (2002). Modale concurrentie in het goederenvervoer (thesis). Opgeroepen op Juni 2018 Service Public de Wallonie. (2017). Budgets des recettes et des dépenses de la Région wallonne
pour l'année budgétaire 2018. Opgeroepen op July 2018, van http://www.wallonie.be/budget/
Somers, G., & Tißen, K. (2015). Synchromodaliteit: literatuuronderzoek. Opgeroepen op Juni 2018
SPW. (2017). Voise nagivable et Intermodalité Les infos. Statista. (2018). Length of railway lines in use in Europe EU28. Opgeroepen op Juni 2018, van
Statista: https://www.statista.com/statistics/451812/length-of-railway-lines-in-use-in-europe-eu-28/
Theunissen, X. (1996). Samenhang detailhandel, transport en groothandel. Opgeroepen op Juni 2018, van http://www.ecn.
TRAIMCO. (2016). Evaluatie: tijdelijke subsidieregeling stimuleren bundgelin van goederenstromen voor vervoer op het spoor.
Transport & Environment. (sd). Truck of Tomorrow. Opgeroepen op Juni 2018, van Inconvenienttruck: https://inconvenienttruck.eu/the-economics-of-trucks-industry/
Van Hoof, S. (2006). Motorways of the Sea,opportuniteiten naar duurzaam Europees goederenvervoer (thesis).
van Thiel, S. (2010). Bestuurskundig onderzoek: een methodologische inleiding. Bussum: Coutinho.
Vlaamse Havencommissie. (sd). Vlaams Havenbeleid. Opgeroepen op July 2018, van http://www.vlaamsehavencommissie.be/vhc/thema/vlaanderen/vlaams-havenbeleid

61
Vlaamse overheid. (2014). De Vlaamse begroting in cijfers. Opgeroepen op July 2018, van https://www.vlaanderen.be/nl/vlaamse-overheid/werking-van-de-vlaamse-overheid/de-vlaamse-begroting-cijfers-2018#187594
Wesselink, J. (2017). Intermodal transport in Europe: trends & drivers (thesis). Weyts, B. (2014). Beleidsnota: mobiliteit en openbare werken 2014-2019. World Shipping Council. (2018). Before container shipping. Opgeroepen op Mei 2018, van
Worlshipping: http://www.worldshipping.org/about-the-industry/history-of-containerization/before-container-shipping
World Shipping Council. (2018). The history of containerization. Opgeroepen op Mei 2018, van Worldshipping: http://www.worldshipping.org/about-the-industry/history-of-containerization

62
ANNEXES
A. Overview interviews
Antwerp
Place + date Organisation Interviewee
21/03, Gent MOW, afdeling beleid Thomas Christiaens
10/04, Brussel Lineas Paul Hegge
11/04, Gent Infrabel Jos Decelle
19/04, Antwerpen Port of Antwerp Inge Nuytemans
19/04, Antwerpen Maritieme toegang Ilse Hoet en Freddy Aerts
22/06, Willebroek Vlaamse Waterweg Lynn Eyckmans
No reply Cabinet of minister Weyts
Liège
Place + date Organisation Interviewee
27/04, via phone SPW, DPVNI Pascal Moens
13/07, via phone + mail Port of Liège Hélène Thiébaut
Rotterdam
Place + date Organisation Interviewee
27/07, via phone Port of Rotterdam Maurits van Schuylenburg
No reply Rijkswaterstaat
No reply ProRail

63
B. Interview questions
Infrabel What are the responsibilities of Infrabel? What is your relation with the governments? Why is, according to you, rail transport not used that much for freight? How would you, Infrabel, define the concept intermodal transport? What is your policy concerning intermodal transport, and why is it important for you? What actions concerning infrastructure do you take, especially in Antwerp and Liège? What measures for safety and traffic management do you take?
Lineas What are the responsibilities of Lineas? What is your relation with the government? Why is, according to you, rail transport not used that much for freight? How would you, Lineas , define the concept intermodal transport? What is your policy concerning intermodal transport? What actions concerning infrastructure do you take, especially in Antwerp and Liège?
Vlaamse Waterweg What are the responsibilities of VWW? What is your relation with the other governments (Flemish, …)? Why is, according to you, IWW transport not used that much for freight? How would you, VWW , define the concept intermodal transport? What is your policy concerning intermodal transport, and why is it important for you? What actions concerning infrastructure do you take, especially in Antwerp? What measures for safety and traffic management do you take, in Antwerp? Who should I contact in Wallonia?
Port authority Antwerp What are the competences of the port authority? What is your connection/relation with the governments? How would you, the port authority , define the concept intermodal transport? What is your policy concerning intermodal transport, and why is it important for you? What actions concerning infrastructure do you take? What measures for safety and traffic management do you take? What other public actors are involved in the development of an intermodal transport network in Antwerp/who should I contact?

64
Maritiem Toegang What are the competences of Maritiem Toegang? What is your relation with the other governments (Flemish, …)? How would you, Maritiem Toegang , define the concept intermodal transport? What is your policy concerning intermodal transport, and why is it important for you? What actions concerning infrastructure do you take? What other public actors are involved in the development of an intermodal transport network in Antwerp/who should I contact?
Port of Liège What are the competences of the port authority? Is it the same as in Flanders? What is your connection/relation with the governments? How would you, the port authority , define the concept intermodal transport? What is your policy concerning intermodal transport, and why is it important for you? What actions concerning infrastructure do you take? What measures for safety and traffic management do you take? What other public actors are involved in the development of an intermodal transport network in Liège/who should I contact?
SPW/DPVNI What are the competences of DPVNI? What is your relation with the other governments (Flemish, …)? How would you, DPVNI , define the concept intermodal transport? What is your policy concerning intermodal transport, and why is it important for you? What actions concerning infrastructure do you take? What measures for safety and traffic management do you take? What other public actors are involved in the development of an intermodal transport network in Liège/who should I contact?
Port authority Rotterdam What are the competences of the port authority? What is your connection/relation with the governments? How would you, port authority , define the concept intermodal transport? What is your policy concerning intermodal transport, and why is it important for you? What actions concerning infrastructure do you take? What measures for safety and traffic management do you take? What other public actors are involved in the development of an intermodal transport network in Rotterdam/who should I contact?