master of technology - welcome to ethesis -...
TRANSCRIPT

COAL HANDLING SYSTEM-ITS
PERFORMANCE MONITORING &
SUGGESTIVE MEASURES FOR
IMPROVEMENTS
A THESIS SUBMITTED IN FULFILMENT OF
THE REQUIREMENT FOR THE AWARD OF THE DEGREE
OF
Master of Technology (by Research)
BY
SOMANATH OJHA
UNDER THE GuiDANCE OF
PRoF. B. K. Pal & PROF. B. B. BISWAL
DEPARTMENT OF MINING ENGINEERING
NATIONAL INSTITUTE OF TECHNOLOGY
ROURKELA, INDIA
AUGUST-2015

CERTIFICATE
This is to certify that the thesis entitled“Coal Handling System- Its Performance
Monitoring & Suggestive Measures for Improvement” being submitted by
Somanath Ojha for the award of the degree of Master of Technology ( Research)
of NIT Rourkela, is a record of bonafide research work carried out by him under
our supervision and guidance. He has worked for two years on the above problem
at National Institute of Technology, Rourkela and this has reached the standard
fulfilling the requirements and the regulation relating to the degree. The contents of
this thesis, in full or part, have not been submitted to any other university or
institution for the award of any degree or diploma.
Dr. B. B. Biswal Dr. B. K. Pal
Professor Professor
Industrial Design Dept. Mining Engineering Dept.
NIT Rourkela NIT Rourkela
NATIONAL INSTITUTE OF TECHNOLOGY
ROURKELA, INDIA

ii
ACKNOWLEDGEMENT
More than at the thought of writing this thesis, I have balked at the thought of writing the acknowledgments. How will I thank and show my gratitude to my professors, mentors, and friends who have held my hand and been more than just supportive throughout this research period? I did not know then that I might be able to complete this work. But now that it has, I need to cast my mind back many days to remember those who helped me in different ways. While one person may actually write a thesis, it is really the product of numerous conscious and unconscious contributions from many other people.
First of all, I would like to express my heartiest gratitude to my supervisor and guide Dr. B. K. Pal, Professor, and former Head, Department of Mining Engineering and Co-Supervisor Dr. B. B. Biswal, Professor and Head, Department of Industrial Design, NIT, Rourkela for their valuable guidance, support and encouragement in the course of the present work. The successful and timely completion of the work is due to his constant inspiration and constructive criticisms.
I am grateful to Dr. H. K. Naik, former Head, Department of Mining Engineering for his kind help time to time. I am also thankful to all the staff and faculty members of Mining Engineering Department, National Institute of Technology, Rourkela for their consistent encouragement.
I want to extend my sincere gratitude to Dr. S. Jayanthu, Dr. H. B. Sahu of Mining Engineering Department and Dr. S. S. Mohapatra, Department of Mechanical Engineering, NIT Rourkela, for their kind co-operation in my Research work.
I am also grateful to Mr. Kumar Behera, DGM, RSP and to the employees of Rourkela Steel Plant, Rourkela, for taking pain & time in giving their response to the questionnaire. I am also grateful to the supervisors & Officers of Executives Cell of RSP for providing me the various information. At last but not the least my gratitude goes to Mr. A. R. Mahananda, Mr. B. Balabantaray, Mr. O. P. Sahu, Mr. B. Panda, Mr. C. Samantra, Mr. D. Panigrahi, and all my co-research fellows at NIT Rourkela and friends who directly or indirectly helped me to complete this dissertation. Finally, I thank the one above all, the omnipresent God for giving me strength during the course of the research work.
Somanath Ojha

iii
Abstract
The coal handling process involves a number of activities from loading and
unloading to stockpile. This procedure can be carried out by coal conveying system
which includes a large number of mechanical equipment. The important activities
under coal handling include loading/unloading, dumping, transporting etc. which
are done with the help of various mechanical equipment. Every organization wants
to profit as much as possible and increases their production rate by using maximum
effort for care and maintain. And it is possible if the equipment is running in good
condition with zero breakdowns, zero accident, and zero wastage. This research
work presents a practical analysis for monitoring the operational performance of
equipment, which shows the two additional objectives: the first one is the
identification of major causes of production losses which are born from
malfunctions, breakdowns, and bad operating programme. And the second one is
the implementation of a suitable and appropriate methodology for improvement of
coal handling systems, which handling the coal from bunker to stockyard within an
industry. The data are analyzed and compared with World class to Obtained OEE.
During the operation, many reasons are there, which affect the production rate
called six big losses. To minimize the six big losses and improve productivity, an
accurate effective estimation of equipment is necessary and offers a suitable
methodology.
For the purpose of the study, a case study methodology is applied in order to
analyze in the depth of maintenance in a real context. The primary focus of this
research work is to monitor the equipment performance in coal handling plants and
its contribution to the company for overall operation. The OEE data are recorded
through tables and compared to world class OEE considering the operational losses
and also performance reports are briefly analyzed through figures in terms of
equipment failures in different locations, idle time for materials, operators and
speed loss time for minor stoppages like sensor blocked, cleaning/checking or
component jamming. For minimizing the downtime and promote productivity, a
suitable methodology is developed through tables for determining the status of coal
handling equipment viz. Tippler, Side arm charger, Reversible apron feeder, Belt
conveyor system, Stacker, Reclaimer.
This research work deals with the quantitative measurement of equipment
performance in coal handling plant, which defines losses for many reasons. As a
result, valuable information is provided concerning the performance monitoring of
production equipment and implementing a suitable methodology for improvement

iv
of coal handling machinery operations viz tippler, side arm charger, reversible
apron feeder, belt conveyor, stacker, reclaimer.
Introduce the estimation and evaluation of OEE procedure which is highly valid
and accurate performance indicator and has become very popular in all the
industries starting from mining area for excavation of material to harbour area for
material handling. OEE shows a right metrics to analyze the ordinary issue and
improving the whole process. There are many formulas, systems and metrics being
used to improve the whole production process, but one and only OEE reduces
complex problem into easy. The biggest advantage of OEE allows companies to
have separate business functions by applying a single easy to understand the
formula. OEE is by far the most effective benchmarking tool in making sound
management and maintenance decisions.
The dissertation concludes with a summary of the contribution and the scope of
further work.

v
Table of Contents
Certificate ....................................................................................................................... i
Acknowledgements ....................................................................................................... ii
Abstract .................................................................................................................... iii-iv
Table of Contents ................................................................................................... v-viii
List of Tables ............................................................................................................ ix-x
List of Figures ......................................................................................................... xi-xii
1 INTRODUCTION .................................................................................................... 1
1.1 Overview .......................................................................................................... 1
1.2 Delivery to the plant ......................................................................................... 1
1.2.1 Transportation ........................................................................................... 2
1.2.2 Scheduling................................................................................................. 3
1.3 Storage .............................................................................................................. 4
1.3.1 Short term ....................................................................................................... 4
1.3.2Long term ........................................................................................................ 4
1.3.2 Devices ........................................................................................................... 4
1.3.1 Bunker ................................................................................................... 5
1.3.2Silos ........................................................................................................ 5
1.3.3Sheds ...................................................................................................... 5
1.3.4 Outside bins ................................................................................................... 5
1.3.5 Piles ................................................................................................................ 6
1.4 Importance of material handling ...................................................................... 6
1.5 Motivation ........................................................................................................ 7
1.6 Broad Objective................................................................................................ 7
1.7 Methodology .................................................................................................... 8
1.8 Expected outcomes ........................................................................................... 8
1.9 Organization of the Thesis ............................................................................... 9
1.10 Summary ........................................................................................................ 10
2 REVIEW OF LITERATURE ............................................................................... 11
2.1 Overview ........................................................................................................ 11
2.2 Literature Survey ............................................................................................ 12
2.3 Summary ........................................................................................................ 21
3 MAJOR EQUIPMENT OF COAL HANDLING PLANT ................................. 22

vi
3.1 Overview ........................................................................................................ 22
3.2 Selection of Equipment .................................................................................. 22
3.3 Tippler for Wagon unloading system ............................................................. 22
3.3.1 Introduction ............................................................................................. 22
3.3.2 Wagon tippling system ........................................................................... 23
3.3.3 Wagon tippler.......................................................................................... 23
3.3.4 Wagon positioning Equipment ............................................................... 26
3.3.5 Unloading Hopper ................................................................................... 26
3.3.6 Feeder below hopper ............................................................................... 26
3.3.7 Rail tracks ............................................................................................... 26
3.3.8 Dust control room ................................................................................... 27
3.3.8 Control Room.......................................................................................... 27
3.4 Side Arm Charger........................................................................................... 27
3.4.1 Working principle ................................................................................... 28
3.4.2 Description of side arm charger .............................................................. 28
3.5 Reversible Apron Feeder ................................................................................ 30
3.5.1 Introduction ............................................................................................. 30
3.5.2 Description of reversible apron feeder .................................................... 30
3.6 Belt Conveyor System .................................................................................... 30
3.6.1 Component of belt conveyor ................................................................... 30
3.6.2 Application .............................................................................................. 31
3.6.3 Limitation ................................................................................................ 32
3.6.4 Idler ......................................................................................................... 32
3.6.5 Pulley ...................................................................................................... 33
3.6.6 Drive ....................................................................................................... 33
3.6.7 Take-up ................................................................................................... 34
3.6.8 Conveyor support .................................................................................... 34
3.7 Stacker ............................................................................................................ 34
3.7.1 Introduction ............................................................................................. 34
3.7.2 Component of stacker ............................................................................. 34
3.8 Reclaimer ....................................................................................................... 36
3.8.1 Introduction ............................................................................................. 36
3.8.2 Modes of control ..................................................................................... 36
3.8.2 Component of reclaimer ......................................................................... 37
3.9 Summary ........................................................................................................ 38
4 OEE & DATA ANALYSIS .................................................................................... 39
4.1 Overview of OEE ........................................................................................... 39

vii
4.2 Sources of business loss ................................................................................. 40
4.3 Defining the six big losses ............................................................................. 42
4.4 Calculating OEE ............................................................................................. 43
4.4.1 OEE calculation for tippler ..................................................................... 44
4.4.2 OEE calculation for side arm charger ..................................................... 46
4.4.3 OEE calculation for reversible apron feeder ........................................... 48
4.4.4 OEE calculation for belt conveyor ......................................................... 50
4.4.5 OEE calculation for stacker .................................................................... 52
4.4.6 OEE calculation for reclaimer ................................................................ 54
4.5 Performance report of coal handling machineries .......................................... 56
4.6 Comparison of world class to obtained OEE for tippler ................................ 59
4.7 Comparison of world class to obtained OEE for side arm charger ................ 61
4.8 Comparison of world class to obtained OEE for reversible apron feeder ...... 64
4.9 Comparison of world class to obtained OEE for belt conveyor ..................... 66
4.10 Comparison of world class to obtained OEE for stacker ............................... 69
4.11 Comparison of world class to obtained OEE for reclaimer ........................... 71
4.12 comparison of calculations in coal handling equipment ................................ 74
4.13 Summary ........................................................................................................ 75
5 SUGGESTION, RESULT & DISCUSSION ........................................................ 76
5.1 Overview ........................................................................................................ 76
5.2 Methodology for determining the status of Tippler ..................................... 77
5.2.1 Result & Discussion of tippler ................................................................ 78
5.3 Methodology for determining the status of Side arm charger ...................... 79
5.3.1 Result & Discussion of Side arm charger ............................................... 80
5.4 Methodology for determining the status of Reversible apron feeder ............ 81
5.4.1 Result & Discussion of Reversible apron feeder .................................... 82
5.5 Methodology for determining the status of Belt conveyor ........................... 83
5.5.1 Result & Discussion of Belt conveyor .................................................... 84
5.6 Methodology for determining the status of Stacker ...................................... 85
5.6.1 Result & Discussion of Stacker .............................................................. 86
5.7 Methodology for determining the status of Reclaimer.................................. 87
5.7.1 Result & Discussion of Reclaimer .......................................................... 88
5.8 Summary ........................................................................................................ 89
6 CASE STUDY APPLICATION ............................................................................ 90
6.1 Overview ........................................................................................................ 90
6.2 Simulation Models ......................................................................................... 90

viii
6.3 Uniformly distribution random number ......................................................... 91
6.4 Normally distribution random number ........................................................... 91
6.5 System simulation on event-to-event analysis ............................................... 92
6.6 Event identification ........................................................................................ 92
6.7 Sub routine skewing of uniformly distributed random number ..................... 93
6.8 Performance appraisal of coal handling machineries ..................................... 93
6.9 Specific example for data analysis ................................................................. 93
6.10 Summary ...................................................................................................... 112
7 CONCLUSIONS AND FUTURE WORK ......................................................... 113
7.1 Overview ...................................................................................................... 113
7.2 Conclusions .................................................................................................. 113
7.3 Contributions ................................................................................................ 114
7.4 Future scope of the work .............................................................................. 115
REFERENCES .......................................................................................................... 116
Appendix .................................................................................................................... 119
Curriculum Vitae ...................................................................................................... 134
Published and Accepted Papers .............................................................................. 135
ix
List of Tables
Table 4.1: Six big losses with an example. ............................................................. 42
Table 4.2: OEE calculation. .................................................................................... 43
Table 4.3: Time loss classification for Tippler....................................................... 44
Table 4.4: Timeline of items for Tippler Operation & Estimation. ........................ 45
Table 4.5: Time loss classification for Side Arm Charger...................................... 46
Table 4.6: Timeline of items for Side Arm Charger Operation & Estimation. ...... 47
Table 4.7: Time loss classification for Reversible Apron Feeder ........................... 48
Table 4.8: Timeline of items for Reversible Apron Feeder Operation & Estimation
......................................................................................................................... 49
Table 4.9: Time loss classification for Belt Conveyor System ............................... 50
Table 4.10: Timeline of items for Belt Conveyor System Operation & Estimation51
Table 4.11: Time loss classification for Stacker. .................................................... 52
Table 4.12: Timeline of items for Stacker Operation & Estimation…………….. 53
Table 4.13: Time loss classification for Reclaimer ................................................ 54
Table 4.14: Timeline of items for Reclaimer Operation & Estimation .................. 55
Table 4.15: Comparison of coal handling equipment for OEE Obtained & World
class. ................................................................................................................ 74
Table 5.1: Methodology for determining the status of Tippler. .............................. 77
Table 5.2: Methodology for determining the status of Side Arm Charger. ............ 79
Table 5.3: Methodology for determining the status of Reversible Apron Feeder .. 81
Table 5.4: Methodology for determining the status of Belt Conveyor .................. 83
Table 5.5: Methodology for determining the status of Stacker .............................. 85
Table 5.6: Methodology for determining the status of Reclaimer.......................... 87
Table 6.1: Frequency and period of existence of breakdown of a tippler. .............. 94
Table 6.2: Conversion of interval between tippler break-downs to cumulative
random numbers.. ............................................................................................ 95
Table 6.3: Conversion of the existence of tippler break-downs to cumulative
random numbers. ............................................................................................. 95
Table 6.4: Frequency and period of existence of breakdown of side arm charger . 96
Table 6.5: Conversion of the interval between side arm charger break-downs to
cumulative random numbers. .......................................................................... 96
Table 6.6: Conversion of existence of side arm charger break-downs to
cumulative random numbers.. ......................................................................... 97

x
Table 6.7: Frequency and period of existence of breakdown of reversible apron
feeder. .............................................................................................................. 97
Table 6.8: Conversion of interval between reversible apron feeder break-downs to
cumulative random numbers.. ......................................................................... 97
Table 6.9: Conversion of the existence of reversible apron feeder break-downs to
cumulative random numbers. .......................................................................... 98
Table 6.10: Frequency and period of existence of breakdown of the belt conveyor.
......................................................................................................................... 98
Table 6.11: Conversion of interval between belt conveyor system break-downs to
cumulative random numbers... ........................................................................ 99
Table 6.12: Conversion of existence of belt conveyor system break-downs to
cumulative random numbers... ........................................................................ 99
Table 6.13: Frequency and period of existence of breakdown of stacker ...........100
Table 6.14: Conversion of the interval between stacker break-downs to
cumulative random numbers. ........................................................................ 100
Table 6.15: Conversion of existence of stacker break-downs to cumulative
random numbers.. .......................................................................................... 101
Table 6.16: Frequency and period of existence of breakdown of reclaimer. ........ 101
Table 6.17: Conversion of the interval between reclaimer break-downs to
cumulative random numbers. ........................................................................ 102
Table 6.18: Conversion of the existence of reclaimer break-downs to cumulative
random numbers. ........................................................................................... 102
Table 6.19: Different events of break-downs, their frequencies, and random-
number distribution. ...................................................................................... 103
Table 6.20: Indicating occurrences of break-down using random number
distribution.. .................................................................................................. 103

xi
List of Figures
Figure 3.1: Tippler process layout. ......................................................................... 23
Figure 3.2: A typical operation in Wagon-Tippler section. .................................... 27
Figure 3.3: A snap shot of Side Arm Charger positioning the wagon. ................... 29
Figure 3.4: Component of Belt Conveyor System .................................................. 33
Figure 4.1: Pie chart for performance appraisal of Tippler. ................................... 56
Figure 4.2: Pie chart for performance appraisal of Side Arm Charger ................... 56
Figure 4.3: Pie chart for performance appraisal of Reversible Apron Feeder. ....... 57
Figure 4.4: Pie chart for performance appraisal of Belt Conveyor. ........................ 57
Figure 4.5: Pie chart for performance appraisal of Stacker .................................... 58
Figure 4.6: Pie chart for performance appraisal of Reclaimer. ............................... 58
Figure 4.7: Comparison of World class to Obtained OEE for Tippler. .................. 59
Figure 4.8: Analysis of Breakdown hour of Tippler ............................................... 60
Figure 4.9: Analysis of Idle hour for Tippler. ......................................................... 60
Figure 4.10: Analysis of Speed loss hour for Tippler ............................................ 61
Figure 4.11: Comparison of World class to Obtained OEE for Side Arm Charger 61
Figure 4.12: Analysis of Breakdown hour of Side Arm Charger. .......................... 62
Figure 4.13: Analysis of Idle hour for Side Arm Charger. ..................................... 63
Figure 4.14: Analysis of Speed loss hour for Side Arm Charger. .......................... 63
Figure 4.15: Comparison of World class to Obtained OEE for RAF .................... 64
Figure 4.16: Analysis of Breakdown hour of Reversible Apron Feeder ................ 64
Figure 4.17: Analysis of Idle hour for Reversible Apron Feeder ........................... 65
Figure 4.18: Analysis of Speed loss hour for Reversible Apron Feeder ................ 65
Figure 4.19: Comparison of World class to Obtained OEE for Belt Conveyor ..... 66
Figure 4.20: Analysis of Breakdown hour of Belt Conveyor ................................. 67
Figure 4.21: Analysis of Idle hour for Belt Conveyor. ........................................... 68
Figure 4.22: Analysis of Speed loss hour for Belt Conveyor ................................ 68
Figure 4.23: Comparison of World class to Obtained OEE for Stacker ................. 69
Figure 4.24: Analysis of Breakdown hour of Stacker............................................. 70
Figure 4.25: Analysis of Idle hour for Stacker. ...................................................... 70
Figure 4.26: Analysis of Speed loss hour for Stacker. ............................................ 71
Figure 4.27: Comparison of World class to Obtained OEE for Reclaimer ............ 71
Figure 4.28: Analysis of Breakdown hour of Reclaimer. ....................................... 72
Figure 4.29: Analysis of Idle hour for Reclaimer ................................................... 73
Figure 4.30: Analysis of Speed loss hour for Reclaimer. ....................................... 73

xii
Figure 5.1: Comparison of OEE its factor Before & After Improvement for Tippler
......................................................................................................................... 78
Figure 5.2: Comparison of Breakdown hours Before & After Improvement for
Tippler. ............................................................................................................ 78
Figure 5.3: Comparison of OEE its factor Before & After Improvement for Side
Arm Charger ................................................................................................... 80
Figure 5.4: Comparison of Breakdown hours Before & After Improvement for Side
Arm Charger. .................................................................................................. 80
Figure 5.5: Comparison of OEE its factor Before & After Improvement for
Reversible Apron Feeder ................................................................... 82
Figure 5.6: Comparison of Breakdown hours Before & After Improvement for
Reversible Apron Feeder ................................................................... 82
Figure 5.7: Comparison of OEE its factor Before & After Improvement for Belt
conveyor ............................................................................................. 84
Figure 5.8: Comparison of Breakdown hours Before & After Improvement for Belt
conveyor ............................................................................................. 84
Figure 5.9: Comparison of OEE its factor Before & After Improvement for Stacker
............................................................................................................ 86
Figure 5.10: Comparison of Breakdown hours Before & After Improvement for
Stacker................................................................................................ 86
Figure 5.11: Comparison of OEE its factor Before & After Improvement for
Reclaimer ........................................................................................... 88
Figure 5.12: Comparison of Breakdown hours Before & After Improvement for
Reclaimer ........................................................................................... 88
Figure 6.1: Flow chart showing sub-routine (i) unrand, (ii) norand ................... 104
Figure 6.2: Flow chart showing sub-routine event ............................................... 105
Figure 6.3: Flow chart show sub-routine tippler breakdown ................................ 106
Figure 6.4: Flow chart show sub-routine side arm charger breakdown. ............... 107
Figure 6.5: Flow chart show sub-routine reversible apron feeder breakdown. .... 108
Figure 6.6: Flow chart show sub-routine belt conveyor breakdown. .................. 109
Figure 6.7: Flow chart show sub-routine satcker breakdown. .............................. 110
Figure 6.8: Flow chart show sub-routine reclaimer breakdown ........................... 111

1
Chapter1
1 INTRODUCTION
1.1 Overview
Coal handling plant is a plant which handles the coal from its receipts from coal
mines to transporting it to the boiler for generating the power, coke oven for
making coke and store in the bunker. Coal handling refers to the movement and
storage of coal from the time it arrives at the plant. As consumption of coal is very
large, the design and layout of coal are in simple but robust with a view to reducing
maintenance and running cost to the lowest possible consistent to reliability.
1.2 Delivery to the Plant
Before methods of coal delivery are discussed, note that all incoming coal should
be weighed. This practice allows the plant to check contractor weigh-bills and may
help personnel in spotting coal quality problems. For example, if a load is heavier
than expected, there may be excess moisture or perhaps a high percentage of fines
in the load.
Coal is delivered to the plant by truck, railroad, or barge. Even though truck and
railroad deliveries are most common, each plant should choose the most
economical method compatible with timely delivery and the plant's unloading
equipment. Only experienced and qualified personnel who are familiar with facility
unloading practices and procedures should be given the responsibility of receiving
coal. All training and certification should be kept up to date, and clear procedures
should be made available to all personnel responsible for unloading coal.

2
1.2.1 Transportation
1.2.1.1 Truck
Truck delivery offers several advantages over other forms of coal transport. For
instance, trucks can use roads whereas railroads and barges are limited to tracks
and waterways. This makes truck transportation faster and more accessible in most
situations. Truck delivery is best suited for delivery ranges of 8 to 640 km for a
plant that consumes between 25 and 200,000 tons of coal per year. A single truck
can hold approximately 30 tons. For this transport range, delivery time varies from
1 to 10 hours including loading and unloading. Because most trucks are equipped
with hydraulic dump beds, it is easy to unload coal onto the ground or into
underground hoppers. Trucks should be unloaded on solid, level ground that is
clear of power lines and overhead equipment.
1.2.1.2 Railroad
Railroad transport is economical for distances of 16 to 3200 km, especially when
rail service is available directly from the mine (or preparation facility) to the plant.
Railroads best serve plants that consume from 50 to 4 million tons of coal per year.
One railcar can hold around 100 tons. Delivery can take anywhere from a day to a
month, including loading and unloading time. When the coal arrives at the plant,
there are several methods for unloading railcars. The most common method is
"gravity discharge." Some plants use a crane, but a crane is undesirable because it
increases breakage and encourages segregation of the coal.
"Gravity discharge" can be done two ways. Coal can flow out the bottom of the
railcar or it can be dumped by overturning the entire railcar. Cars emptied from the
bottom can be discharged at ground level into an underground hopper or from the
top in case of BOXN wagon into a pile, hopper.
A rotary car dumper is valuable for a plant where large quantities of coal must be
unloaded quickly. Rotary car dumpers are economical when significant demurrage
charges (fines paid by the plant for holding a freight car beyond its scheduled
departure time) result from a slow turnaround of railcars.

3
1.2.1.3 Barge
River barge delivery is practical for distances of 16 to 1600 miles, especially when
water transportation is near both the mine (or preparation facility) and the thermal
power plant. Barge transportation is best for plants that consume more than 50,000
tons of coal per year. One barge can carry anywhere from 600 to 3000 tons.
Delivery can take anywhere from a day to a month. At the plant, barges are
unloaded by a bucket elevator system or by crane. Sometimes barges even carry
their own crane.
1.2.1.4 Ropeways
This mode of coal transportation is used where coal mines are located near the
power stations. Coal is brought by hanging bucket/trolleys traveling on track ropes,
which are pulled by a haulage rope with a driving mechanism. The payload of each
bucket varies from 1 to 3 tons. Automatic loading and unloading mechanisms are
provided at loading and unloading stations. The rate of unloading varies from 75 to
275 MT/Hr depending on the type of ropeways used. This type of coal
transportation is very economical compared to road or rail transportation. The only
disadvantage of this system is a long time for maintenance works.
1.2.1.5 Other Methods
Coal can be transported by conveyors to the plant. However, this technique is not
practical unless the plant is within a few miles of the mine (or preparation facility).
Also, coal can be transported by suspending it in water and pumping it through a
pipeline (called a slurry flow pipeline). Once at the plant, this coal must be dried.
The use of such pipelines is rare and primarily experimental.
1.2.2 Scheduling
In most cases, a plant receives coal as it is needed for normal operations. Although
there may be certain situations when the plant must replenish its long-term storage,
a plant should have a routine delivery schedule. Some exceptions arise in areas
where winter delivery is uneconomical or impossible. For these installations, a
plant must receive its annual supply of coal over the summer. By scheduling these

4
deliveries to match a plant's unloading capacity, the installation can reduce the
possibility of demurrage charges.
1.3 Storage
1.3.1 Short-Term
Short-term storage provides coal for day-to-day heating plant operations. A
military plant should carry anywhere from a few days to several weeks’ worth of
coal in short- term storage. Short-term storage is classified as either "active" (live)
or "inactive" (dead). Live storage refers to coal that can be fed directly into the
furnace without being transferred through other storage areas. The coal can be fed
by chute, conveyor, or tractor. Dead storage refers to coal that must pass through
another storage area before it can be fed to the furnace. Dead storage is transferred
to live storage areas by conveyor, tractor, or both. If dead storage is located far
from the plant, it may be necessary to transfer the coal to the plant using train cars
or trucks. For these cases, just-in-time delivery is especially attractive.
1.3.2 Long-Term
Long-term storage is dead storage that holds coal for emergencies or for those rare
instances when the plant has exhausted its short-term supply. A military plant
should carry a 90-day supply of coal in long-term storage.
1.3.3 Devices
There are many ways to store coal; each method has its advantages and drawbacks.
The most expensive methods provide the best coal protection and allow for the
simplest and cheapest recovery while less expensive methods provide much less
protection and require more costly, less convenient recovery. In addition, enclossd
storage reduces air and water pollution while making the plant site look cleaner.
1.3.3.1 Bunkers
Bunkers provide live storage. They are usually situated above the plant floor so that
coal can be fed directly to the furnace by the chute. To accommodate unloading,
bunkers have sloped bottoms to funnel the flow of coal.

5
1.3.3.2 Silos
Silos provide both live and dead storage. Live storage is maintained on a "live shelf
located midway up the silo. This shelf is sloped towards an outlet on the side of the
silo. When the live shelf is filled, excess coal becomes dead storage and spills over
onto a lower shelf. Coal in dead storage can be reclaimed by a conveyor and
returned to the live shelf. The shelves should be inclined at least 55 degrees above
the horizontal to facilitate the flow of coal.
Silos provide excellent protection because they are completely enclossd. They
shield against the weather and limit air circulation through the coal. In addition,
silos are convenient and economical to unload. Unfortunately, these benefits are
frequently offset by their large initial cost.
1.3.3.3 Sheds
A shed is a roofed building that protects live or dead storage from the weather. It
can hold much more coal than a silo and is less expensive to build. However, it
cannot offer the same protection or convenience of a silo. For example, a shed does
not adequately limit air flow through loose coal. Therefore, coal maintained in a
shed as long-term dead storage must be compacted. This compaction is difficult to
achieve near posts and walls where non-compacted coal can act as a chimney for
spontaneous combustion. In addition, compacting becomes difficult when the shed
is nearly full. In terms of convenience, sheds are less efficient to unload because
coal must be carried by tractor to a conveyor or hopper.
1.3.3.4 Outside Bins
An outside bin is a roofless, three-sided structure that can hold live or dead
storage. Besides offering some protection from wind erosion, it serves primarily as
a retainer for a coal pile. Because of its many similarities to the coal pile, handling
and maintenance techniques for both storage methods are the same. However, the
outside bin presents a drawback over the open pile because it is difficult to compact
the coal along the bin walls.

6
1.3.3.5 Piles
A coal pile is generally used for long-term storage. It offers the least protection of
all the storage methods; however, it requires the least capital investment. Due to the
military requirement to keep 90 days of coal on hand, a coal pile is frequently the
most economical means of storing this much coal.
The coal pile should be built on a paved surface. However, if concrete or asphalt is
not available, the base can be constructed of heavily compacted coal. Regardless of
the material, the base must allow for proper drainage of the pile so the pile can be
accessed during all weather conditions. In addition, proper drainage helps maintain
coal quality as it helps the plant control water pollution.
1.4 Importance of Material Handling
The foremost importance of material handling is that it helps the productivity and
them by increases profitability of an industry. A well-designed material handling
system attempts to achieve the following:
Improve efficiency of a production system by ensuring the right quantity of
materials delivered at the right place at the right time most economically.
Cut down indirect labour cost.
Reduce damage of materials during storage and movement.
Maximize space utilization by proper storage of materials and thereby
reduce storage and handling the cost.
Minimize accident during materials handling.
Reduce overall cost by improving material handling.
Improve customer services by supplying materials in a manner convenient
for handling.
Increase efficiency and saleability of plant and equipment with integral
materials handling features.

7
1.5 Motivation
Performance measurement is a key strategy for organizational
improvement. Without monitoring the equipment, a company cannot
increase their production rate. So, OEE is a valid and accurate method for
calculating the efficiency of coal handling equipment.
It analyzes and evaluate the results of plant production rate. It is also
adopted to eliminate the major causes of poor performance.
To improve the efficiency of the material handling process in an industrial
environment and Inspection of industrial equipment to improve plant
productivity.
The primary focus is to design a method for finding out the root causes of
the coal handling equipment.
To track & trend the improvement or decline in equipment effectiveness
over a period of time.
1.6 Broad Objective
The objective of the proposed work is to make study of system of coal handling
and associated equipment explicitly and make suggestive measures for
improvement of coal handling system of machinery like tippler, side arm charger
positioning equipment to tippler, belt conveyor system, reversible apron feeder,
stacker, reclaimer etc. under the backdrop of the aforementioned scenario the
objectives of the present research work consists of the following.
A brief review of equipment and its system of cyclic operation such as
unloading, conveying, stacking, reclaiming.
Collection and collation of field data for the losses of availability,
performance and quality of the equipment yearly basis.
Development and recommendation of appropriate methodology for
monitoring the candidate machinery and suggestive measures for
improvement of their availability and performance.

8
1.7 Methodology
The objectives are proposed to be achieved through well-designed steps. The
methodology consists of following steps:
Literature Review: The depth of literature review is carried out for
investigating the performance monitoring of coal handling system and also
understand the equipment like tippler for wagon unloading, side arm
charger for positioning the wagon into tippler platform, reversible apron
feeder for feeding the material to the belt, belt conveyor for carrying the
material, stacker for stacking the material to the stockyard and reclaimer for
reclaiming the material from stockyard.
Plant visit and data collection: Data is collected from the plant
documenting the losses of the each equipment in their downtime, speed and
quality in terms of filling factor.
Introducing the Overall Equipment Effectiveness (OEE) for
performance monitoring: In this study, OEE is developed for monitoring
the coal handling equipment like tippler, side arm charger, reversible apron
feeder, belt conveyor, stacker, reclaimer and analyzing the losses of
availability, performance, quality with a comparison to World class OEE.
Suggesting the appropriate methodology for improvement: In this
study, an appropriate methodology is investigated for knowing the
parameter, component and sensors/technology of equipment for the
improvement of coal handling equipment.
1.8 Expected outcomes
Increased productivity and OEE.
Cost reduction up to a great extent.
Reduce accident.
A Higher confidence level among the employees.
Keep the workplace level among the employee.
The favorable change in the attitude of the operator.
Working goals by working as a team.
Horizontal deployment of a new concept in all the areas of the organization.

9
The workers get the feeling of owning the machine.
Associate empowerment.
A safer workplace.
An easier workload.
Minimizing the Defects.
Minimizing the Breakdowns.
Minimizing the short stoppage.
Minimizing the waste
1.9 Organization of the Thesis
The present Chapter1 Introduction the subject of the topic its contextual relevance
and the related matters including the objectives of the work and the methodology to
be adopted are presented.
Chapter2 provides reviews on several diverse streams of literature on different
issues of the topic such as LED indicating device for level and volume of coal in
bunker, PLC Microcontroller for temperature monitoring, PLC and SCADA for
fault detecting and monitoring, wire brush system for removing the sticky material,
failure reduction, diagnosis the cause of damage and implementation of six sigma,
QC tools and TPM with their technique and also many more are presented in this
chapter.
Chapter 3 discusses the coal handling equipment like tippler for wagon unloading,
side arm charger for positioning the wagon into tippler platform, reversible apron
feeder for feeding the material to the belt, belt conveyor for carrying the material,
stacker for stacking the material to the stockyard and reclaimer for reclaiming the
material from stockyard are explained.
Chapter 4 derives briefly about the OEE & six big losses with practical examples
and its data analysis for performance monitoring of coal handling system are
discussed. It is also compared with World class to Obtained OEE.
Chapter 5 Suggests a suitable appropriate methodology for monitoring the plant
equipment. It also includes the result and discussion of coal handling equipment for
comparison of OEE its factor and breakdown hour before & after improvement are
discussed.

10
Chapter 6 presents the case study application of coal handling machinery for
simulation of breakdown data analysis. This chapter concludes the different
equipment falls under definite random number distribution range.
Chapter 7 presents the summary of the results, recommendations and scope for
future work in the direction of studies on organizational improvement performance.
This chapter concludes the work covered in the thesis with implications of the
findings and general discussions on the area of research.
1.10 Summary
In this chapter, the general overview of coal handling plant is presented. The
delivery of coal to the plant via truck, railroads, barges, ropeways and other
methods are also discussed. It also emphasizes the storage of coal in terms of long
term basis and short-term basis by bunkers, silos, sheds and piles. It indicates the
important of material handling while handling the material within the plant.

11
Chapter2
2 REVIEW OF LITERATURE
2.1 Overview
The objective of coal handling plant (CHP) is to supply the processed coal to coal
yard and to stack the coal to coal stockpile area. Coal is a hard black or dark brown
sedimentary rock formed by the decomposition of plant material, widely used for
production of metallurgical coke, tar, chemicals such as ammonia and urea used in
fertilizer plant, coal gasification can be used to produce syngas for transportation
fuel such as gasoline and diesel, as a fuel for generating electricity by thermal
power plant. The importance and magnitude of the business of coal handling are
emphasized by the fact that raw material transporting from the collieries by the
various methods by rail, road, and aerial ropeway or conveyor belt. After
transporting the coal from coal mines to the power station, coal is required to be
stored in the storage yard or to be fed to the boilers and this is accomplished with
the help of a system of equipment called coal handling plant. When coal
transportation system fails it is essential that coal should be made available in the
stock yard so that there may not be a stoppage of power generator plant. To meet
such situation, it is necessary that sufficient stock of coal is made at the power
station so that there may not be an interruption in coal supply at the end-user
location. It is expected to keep a minimum ground stock of coal to cater to the
requirement of the station such period. Thus besides unloading the coal received by
various mode of transportation, coal handling plant has to perform two main

12
functions (i) stacking and reclaiming of coal to respective uses in case direct supply
from mines fails (ii) to store the bunker with the coal directly received from mines.
The continuity of production is possible only when the availability and utilization
of equipment are exercised. Although the coal handling equipment is enough
rugged, the conditions under which this equipment are used are quite difficult to
keep them workable. Failure of the equipment become quite frequent as the age of
the equipment grows. Therefore, it is essential to monitor the performance of the
coal handling equipment and take appropriate measures to improve the availability
as well as the utilization of such machinery.
2.2 Literature Survey
Bob, B. et al. (1988) proposed a reliable electrical heater in the winter season to
avoid the shut down in CHP. The proposed electric heating module is used for
melting the ice bond efficiently and eliminates plugging caused by freeze-ups.[3]
Mukhopadhyay, A. K. et al. (1996) proposed for research in Condition
Monitoring and Performance Analysis of a Vibrating Screen. In this paper, authors
are presented sensors and monitors are being used for monitoring vibrating screens
in condition based approach and Performance Analysis.[2]
Maiti, J. et al. (2004) proposed Lean Maintenance – Concept, Procedure, and
Usefulness. In this paper, authors are presented a systematic approach for
eliminating the waste which are excess production, excess processing, delays,
transportation, inventory and defect through continuous improvement. The authors
also enclossd the benefit of lean maintenance are reduce work in progress,
increased capacity, improved customer satisfaction, increased inventory turns and
reduction of cycle time.[22]
L, Simmon.et al. (2008) proposed an algorithm enabling the conveyor belt to
dynamically adjust its speed for RIFD reader to reliably identify tags without prior
knowledge. Operational scheduling of the coal handling is an NP-hard in
nature.[15]

13
Ozdeniz, A. H. et al. (2008) proposed effective parameters in the coal stockpile are
time, weather, temperature, atmospheric pressure, air humidity, velocity and
direction of wind are measured by means of a computer-aided measurement system
to obtain input data for Artificial Neural Network (ANN) which is used here to
estimate the coal stockpile behaviour under the above parameters.[20]
Laha, D. et al. (2009) Proposed the permutation flow shop scheduling problem
with the objective of minimizing the makespan. In this paper, authors are presented
a new hybrid heuristic, based on simulated annealing and an improvement
heuristic. The heuristic is designed by combining elements from simulated
annealing, NEH, and composite heuristics. It has shown the empirical results on
multiple instances of problems of various sizes.[16]
Sinha, S. et al. (2009) proposed for Prediction of Failures at Surface Miners using
Artificial Neural Network Modelling Approach. In order to define an optimum
model, a series of analyzes are conducted to determine the optimum architecture of
ANN using the trial and error method. In this paper, authors are presented ANN
model for prediction of failures of surface miners. According to the adequate
consistency observed between the predicted results obtained from the presented
model and measured data, it is concluded that this approach is applicable to predict
the failure of Surface Miners.[28]
Sokovic, M. et al. (2009) proposed basic quality tools for continuous improvement
of an organization. In this paper authors are presented for systematic use of 7QC
tools for all processes phase starting from beginning of product development to
delivery of production management process and also describing the 7QC tools
methods and techniques for involving in different phases for continuous
improvement process like (PDCA-cycle consists of four consecutive steps; “In plan
step- decision are taken for changing and improved process through some of the
quality tools”, “In do step- implementation is going on for changing and
improved”, “In check step- control and measurement process is carried on for
checking the system is ok or not” “In act step- adaption or reaction of changes in
PDCA cycle for Keeping improvement on-going”), Six Sigma (DMAIC- defining
the problem, measures the problem in current status, analysis the problem through

14
data to find out the causes, improving the solution through brainstorming in
piloting basis, controlling the improved process with standardization and on-going
monitoring) and Lean Six Sigma for eliminating waste and non-value adding
action; lean means speed and quick action (reducing unneeded waiting time) in
short-term change and six sigma means identifying the defects and eliminating
them in long term change. In view of this, it is evident that continuous
improvement can be possible with the help of quality tools, techniques and
methods which are helpful the quality engineers for doing their own job in site.[30]
Zimroz, R. et al. (2009) proposed to improve the reliability of conveyor belt
system by analyzing their failures, root causes and some minimal parameter for
condition monitoring techniques. In this paper authors focuses the most frequent
failures, types and the location of failures (damaged of belts due to pulley or idler
faults, crack of shaft in gearboxes, pulleys, couplings is results of overloading due
to increased turning resistance of idlers and pulleys) and their importance in the
context of maintenance by condition monitoring techniques for different
parameters in CBS i.e. vibration is monitored For gearboxes (geared wheel and
bearings) and pulleys (bearings), speed is measured for rotating shaft and moving
belt, some magnetic field sources are placed in joint area for detection of belt
joints, electromagnetic field transmitter is used, if belt is cut, temperature measures
for bearing condition and for pulley coating a shell damage detection,
thermography measurements may be used for idlers condition, non-destructive
techniques may be applied (measurement of magnetic field of steel cords belt) etc
of a conveyor belt transportation system.[34]
Craig, B. et al. (2010) stated two case studies in this paper-
Case study 1 describes the Australian-developed modeling software to enhance the
control scheme that increase coal yield and reduce water usages in coal handling
preparations plant.
Case study 2 describes the cause of operator graphics techniques and alarm
rationalization system on operator effectiveness in coal handling preparations plant.
[5]

15
Jhosi, M. M. et al. (2010) proposed a performance monitoring system for
electromagnetic vibrating feeder of coal handling plant by formulating a
mathematical relation of flow rate to operating current. [11]
Gupta, S. et al. (2011) proposed some aspects of Reliability and Maintainability in
Bulk Material Handling System Design and Factors of Performance Measure, In
Design and selection of bulk Material Handling Equipment and Systems. In this
paper, authors discuss some areas of Belt and pneumatic conveying design,
excavator stacker and reclaimer surface miners design selection and application,
testing and examination of the causes of equipment damages, high pressure
grinding roll technology, equipment related injuries, reliability and maintainability
of equipment aspects of ore degradation during handling and modeling.[7]
Pal, S. K. et al. (2011) proposed repairing techniques for trailing cables of mobile
underground mining equipment. In this paper, authors described an overview of
cable construction and its components, methods for reliably locating faults in
damaged cables with minimum risk to the cable, methods for repairing trailing
cables, and testing procedures for evaluating the quality of constructed splice. The
authors are also searched the reasons of damaged cables in underground mines due
to highly mobile equipment, poor lighting, restricted operating room and machine
operator. So that, immediate repair or replacement of damaged cable is necessary
to prevent fires or methane gas ignitions in underground coal mines and to
minimize production delays. Repairing usually means splicing, which is the
mechanical joining of one or more severed conductors, and replacing the
insulation, shield, and jacket. Production is delayed by approximately 1-2 hours
while the splice is completed underground or the damaged cable is replaced and
sent for repair. Since attempts to repair the original cable decreases the mechanical
and electrical properties.[31]
Jayaswal, P. et al. (2012) proposed to implement Jishu Hozen and Kobastu Kaizen
application for enhancing the overall equipment effectiveness. In this paper, author
focuses improvement and autonomous maintenance is two important activities to
enhance equipment performance. And also taken a case study from a leaves spring
manufacturing company, an attempt is made to identify the areas of improvement

16
in equipment through Kaizen and Jishu Hozen application. Lastly also used why-
why application for root cause analysis. It is concluded that OEE of the equipment
is increased from 43% to 68% and labour cost decreases up to 43%, resulting an
increase in availability, better utilization of resources, reduction in defects and the
cost of labour and increased morale and confidence of employees.[10]
Sankhla, V. S. et al. (2012) proposed to investigate how a small Industry could
implement the lean philosophy in own concerned. In this paper, author tries to give
some recommendation to a small company in what they should think about if they
choose to implement Lean Production. [25]
Tigga, A. M. et al. (2012) addressed a set of NC programs which is prepared to
drive the CNC machining process of tool path motion trajectory of the cutter
center. In this paper, authors have generated the geometry to design a tool
trajectory through MATLAB program and introduce to IGES READER for its
parametric data extraction. Then after the extracted control point is the raw material
for MATLAB program to generate required cutter contact point for tool motion in
the complicated spline trajectory. IGES READER software is prepared through
DEV C++ platform.[24]
Amardeep, R. et al. (2013) proposed line balancing as an effective tool for
improving the overall efficiency of the single model assembly line by reducing the
nonvalue-added activities, cycle time, and distribution of workload at each
workstation. In this paper, author includes calculation of cycle time of the process,
identifying the nonvalue-added activities, calculating total workload on station and
distribution of workload on each workstation.[1]
Boban, B. et al. (2013) implemented TPM technique in industries for enhancing
the overall equipment effectiveness. As a result availability, reliability,
maintainability and safety (RAMS) can be increased. In this paper author plans for
implementing TPM which are 5S, Jishu Hozen, Kaizen and abnormality
classification leads to more equipment effectiveness in the company.[4]
Hanoun, S. et al. (2013) presented an effective heuristic for planning stockpiles
and coal age in the stock yard. A model of stockyard operation within the coal

17
mine is described and the problem is formulated as a Bi-Objective-Optimization
problem (BOOP). Both the model and heuristic acts as a decision support system
for the stock yard planner. [8]
Kajal, S. et al. (2013) proposed a steady state availability optimization of the Coal
handling system by using Matlab Genetic Algorithm tool. In this paper author
presents the values of failure and repair rates taken from maintenance history sheet
and optimize it from 96.20% to 98.87% i.e. the increase of 2.67% through
mathematical formulation and is carried out using probabilistic approach and
Markov birth – death process is used to develop the Chapman-Kolmogorov
difference differential. In order to achieve the optimum availability level, the
corresponding repair and failure rates of the subsystems should be maintained. The
failure rates can be maintained through good design, reliable machines, proper
preventive maintenance schedule and providing standby components etc. The
corresponding repair rates can be achieved by employing more trained workers and
utilizing better repair facilities. [13]
Kuttalakkani, M. et al. (2013) proposed a radar-based sensor system on PIC
Microcontroller (microchip) for effective handling of the Thermal power plant. In
this paper, a real-time temperature monitoring system is developed to collect the
range and temperature information of coal. The range information is used to start
the conveyor belt to draw the coal from coal yard. Temperature data is used to
protect it from combustion. A fire sensor is also used to extinguish the fire by
initiating the water spraying system. All the sensors are interfaced with a PLC
microcontroller. [14]
Lodhi, G. (2013) proposed an operation and maintenance of crusher house to keep
equipment running in good working condition, extend equipment life, improve the
quality of operation and reduce operating costs for plant efficiency improvement.
In this paper, author presents a suitable approach in inspection methodologies to
the identify the critical areas where failures are likely to occur and select suitable
techniques for detection of such failures based on design criticality, past
experience, and previous failure information. [17]

18
Mishra, S. et al. (2013) emphasized the use of GPS in DCS for a prevalent and
indispensable optimized control and monitoring system in coal handling plant. In
this paper location and position information at the dynamic machinery in coal
handling plant (CHP) is gathered by the wireless network. This information is used
to construct the global view of the monitoring phenomenon or objects. [18]
Pal, A. (2013) proposed to enhance the productivity and to lower the running cost
of gear shaft in tippler section. In this paper, author investigates the failure of gear
shaft in theoretical basis and also suggesting the remedial measures. So that life of
the shaft is increasing near about three years i.e. 25000 hrs which also depends
upon mechanical maintenance like lubrication and oiling. [21]
Sharma, S. (2013) proposed for reduction of failure in stacker cum reclaimer for
thermal power plant. In this paper author installs safety devices such as impact
idlers for reducing the impact wear of the belt due to force produced on the belt at
the time of loading, programmed interlocking for protection of damage to the
belt,Electro Hydraulic Thruster Brake for smooth stopping of the bucket,
Electronic speed switch for overloading, Rotary cam limit switch for protection of
boom to over yard conveyor, Travel Limit Switch for stopping travel at either end
of pile or reverse when it strikes, Automatic Rail Clamp for drifting of the machine
in storm condition. It maintains the stacker cum reclaimer for reducing the
breakdown in all operating conditions. [27]
Sardan, M. B. et al. (2013) diagnosed the cause of the damage of the bucket wheel
excavator crawler chain link. In order to identify the causes, the author performed
stress state calculation as well as experimental investigation such as nature of
failures like visual detection, metallographic examination, chemical composition
analysis and various test of mechanical properties. Lastly, it concludes that the
chain link breakdowns are caused by manufacturing defect. [29]
Shaout, A. et al. (2013) proposed stage-wise fuzzy reasoning model for a
performance rating of employees in an organization. In this paper, author presents
performance appraisal system for identifying and correcting disparities in
employee’s performance on two fuzzy approaches. The first approach that is

19
traditional fuzzy approach consists of five linguistic fuzzy input variables. The
second approach classifies the critical elements with their relevance and uses fuzzy
logic in multistage approach. Lastly, it is shown that from simulation data, the
stage wise fuzzy reasoning has a more logical approach for performance analysis
and also give important factor to the different critical element as per organizational
goal. [26]
Ibrahim, O. (2013) addressed to implement TQM approaches for continued
improvement in an organization. And it is possible if all employees, all functions
participate (the importance of teamwork and continuous improvement…etc). In
this paper, author presents a comparative analysis of some of the researcher’s
approaches concerning Total quality Management Applications, Models,
principles, and aims. [9]
Zaman, M. et al. (2013) implemented Six-sigma methodology for reducing
rejection in a welding electrode manufacturing industry. In this paper, author gives
an overall idea about DMAIC (define– measure – analyze –improve – control)
technique for problem-solving of rejection of welding electrodes and analyzing
the statistical tools like normality testing, process capability analysis using process
capability tools and studying the process capability ratios and fish-bone diagram. In
define phase-identifying the key problem area and defining the quality
characteristics like the diameter of the welding electrode for upper and lower
specification limit with process mapping by SIPCO diagram (Supply-Input-Process
Output-Customer). In measure phase-selecting appropriate product characteristics
by probability plot show diameter values do not follow normal distribution pattern
and marked to measure the process capability analysis for overall improving the
quality program. In analyzes phase- to identify the root causes for rejection of
welding electrodes with the help of fishbone diagram and Pareto analysis concludes
diameter variation is the root cause among the probable causes of defective coating,
eccentricity and moisture content. In improving phase- brainstorming is carried out
for a feasible solution to the problem. In control phase- process control charts and
Pareto charts are regularly monitored the diameter readings with quantity and

20
quality of silicate has to be maintained to produce proper quality coating material.
[33]
Deniz, V. et al. (2014) studied the influence of coal feed size and coal type on
crushing performances through Jaw crusher in CHP. The expressed the variation of
performance with coal size fraction and coal type. The work concluded for a given
coal, as coal fed size decreases strength increases which are due to the distribution
of cracks within the coal. [6]
Jyotsna, P. et al. (2014) proposed to minimize the weight of assembly of belt
conveyor system and optimized the critical parts like a roller, L-channel support by
the geometrical and finite element modeling of existing design. In this paper
author tells about Geometrical modeling is done using Catia V5R20 and finite
modeling done in ANSYS14.0. Lastly, it is found that Existing design calculation
shows the factor of safety is very greater than a requirement and there is a scope for
weight reduction of critical parts like roller outer diameter and roller thickness. [12]
M, Kanmani. et al. (2014) proposed a fault detecting and monitoring sensors that
give better accuracy, reliable operation in real-time in order to protect the belt
conveyor and also reducing the human errors by using delta series PLC and
SCADA. In this paper author mainly tells about the identification of belt conveyor
faults by sensing the conveyor by means of providing three types of sensors for (i)
identifying the tear up of belt conveyor which can be occurred during overload
condition and any other causes, (ii) identifying the oil level reduction which can be
occurred when there is a decrease in oil level in the tank which is placed in low
tension motor, (iii) sensing the temperature level which can occur during
overheating of conveyor motor, sudden fire occurrence in the conveyor. [19]
Rana, Y. et al. (2014) proposed an ultrasonic sensor on PLC to drive the motor
which helps to maintain the sufficient level of powered coal in the silos & prevents
damage. In this paper, an automatic LED indicating the device is used that
indicates the level and volume of coal in the silos or bunker. In this work two DC
motor are used for two conveyor belt and a stepper motor for the ultrasonic circuit.
The output of LED display is connected to PLC for controlling action. [23]

21
Velmurugan, G. et al. (2014) presents the troubleshooting of belt conveyor system
while handling the bulk material. Due to sticking of material, many problems are
occurring, for example, damages in belt conveyor system due to chemical reaction
and also causes failures due to carry back of the product. The author proposed a
permanent maintenance in strategic basis which is saved the cost of future
maintenance and also implemented for regular maintenance, proper lubrication is
kept maintain alignment of idlers, greasing and painting reduces corrosion in
frames and drum for solution in belt conveyor system for avoiding failures and
problems, which causes a huge loss to company. The removal of sticking materials
is done by two methods. First one is by using a wire brush which is placing under
the conveyor belt; it will remove the sticking materials when the conveyor rotates.
The second one method is to use a water spray under the belt conveyor. An
additional suggestion has also given to using of dual scrap system on the head
pulley and plows in front of the tail pulley for effective running of the conveyor
belt, thereby profiting the companies. [32]
2.3 Summary
An extensive study of the literature from all available sources and related directly
or indirectly with the present piece of work is presented. The literature survey
provides a reviews on several diverse streams of literature on different issues of the
topic such as LED indicating device for level and volume of coal in bunker, PLC
Microcontroller for temperature monitoring, PLC and SCADA for fault detecting
and monitoring, wire brush system for removing the sticky material, failure
reduction, investigating the cause of damage and implementation of six sigma, QC
tools and TPM with their technique. But these methods fail in maintaining the good
efficiency as well as to increase the plant productivity of coal handling equipment.
In the research, I have solved the problem by (increase the efficiency & plant
productivity) of coal handling equipment. The above statements help us to
understand the extent and direction of research which are carried out in this present
work. Literature of the past dating back to the present time are explored. A
comprehensive presentation is attempted through the present work for the benefit
of the readers.

22
Chapter3
3 MAJOR EQUIPMENT OF COAL
HANDLING PLANT
3.1 Overview
This chapter presents the details and sequential steps of equipment for unloading of
coal by wagon tippler to stack yard for storing. It describes the details of equipment
and its component for handling the coal.
3.2 Selection of Equipment
There are many equipment and methods for handling the coal in destination plant.
This research work consists of six equipment in cyclic order such as tippler, side
arm charger, reversible apron feeder, belt conveyor system, stacker, and reclaimer.
3.3 Tippler for Wagon Unloading System
3.3.1 Introduction
The material is received at the process plant by two different types of wagons as
indicated above viz. BOXN wagons and BOBRN wagons. Different types of
wagon unloading systems are adopted for unloading the material from these
wagons. Generally, the material is discharged from the top from the BOXN
wagons, while in the case of BOBRN wagons, it is discharged from the bottom.
The hopper is provided below the ground for receiving the unloaded material from
these wagons. Hence, the BOXN wagons need to be tilted for unloading the

23
material into the hopper while the BOBRN wagons are provided with
pneumatically operated gates at the bottom for unloading the material.
3.3.2 Wagon Tippling System
The wagon tippling system consists of wagon tippler, the wagon positioning
equipment, underground hopper, and feeder below the hopper for evacuating the
material unloaded into the hopper.
3.3.3 Wagon Tippler
Wagon-Tippler is a mechanism used for unloading certain cars such as a wagon,
hopper cars etc. it holds the rail car to a section of track and rotates track and car
together to dump out the contents such as coal, iron ore etc.
The tippler structure consists of two drum-like cages resting on the eight support
roller assemblies in which the coal wagons are rolled over and tipped to offload the
coal. The coal falls onto a conveyor system which transports it to the grading plant.
Figure 3.1: Tippler process layout.
The wagon tippler consists of a table for positioning the wagon, wagon holding
mechanism, gears and pinions for rotation, drive unit, hydraulic power pack etc.
The unloading cycle starts when the wagon is positioned over the wagon tippler
table and the wagon along with the table rotates and discharges the material into
the underground hopper. The time taken for the unloading operation is about 90
seconds. There are two types of wagon tipplers viz. rotaside which rotates about
135º and another rotary type which rotates by 180º. The rotaside wagon tipplers are

24
provided in most of the plants in India. The drive for the rotation is the hydraulic
type for smoother operation.
The main components of wagon tippler are as follows
I. Cradle
II. Tippler platform
III. End rings
IV. Side support beam
V. Top clamp assembly
VI. Drive unit
I. Cradle
The cradle is a frame of the table, comprising two main girders, braced together.
Both the rails are fitted on the two main girders. When tippler is in the down
position the cradle rest on the two cup & cones and two rollers connecting two
stools located on the concrete pedestals or two beams located on the top of the
weighing machine(if supplied) and it is isolated from any other form of support in
order to ensure correct weighting.
The cradle is pivoted in the slotted bearing, attached to toes by hinge pivot. These
pivots are positioned off center to the rail track to ensure the tilting tendency in
order to bring the wagon against the side bolster during the initial part of the
operating cycle. The cradle has an adequate walkway on it. Sections of check rails
are provided inside the rail gauge to restrict the wagon wheels in the tipped
positions.
II. Tippler platform
The platform is a bridge-shaped structure. It has a length sufficient to accommodate
one 8-wheeler (or two 4-wheeler) bogie type broad gauge open wagon which is to
be tipped. The table is constructed of rolled steel joints with standard steel rails (60
kg/meter) mounted on it. The table is pivoted from arms extended from the sectors.
The table is covered with chequered plates between the rails.
III. End rings
A pair of end rings with gear sectors mounted on the periphery will be driven by
two pinions fixed on the line shaft driven through a suitable drive unit. Each of end

25
rings is trunnion mounted for the purpose of rotation. These end rings are built in
the form of semicircle by a suitably designed plate structure.
The center of the end rings is reinforced to carry the trunnion shafts; each of these
shafts, in turn, is supported on pivot bearing resting on foundations. On each ring is
attached an arm known as “toe” that carries the slotted bearing and support the
cradle and bearing during operation. Part of end ring is filled with concrete to
provide the counterweight. This counterweight reduces the amount of work
required during the tipping on the wagon.
IV. Side support beam
Full face contact between the side support beam and the side stanchions is ensured.
The side support extends from a height of 1000 mm up to 2950 mm, from rail
level, i.e. contact the side of the wagon over a width of not less than 1950 mm.
There is metal to metal contact between the side support beam and the side
stanchions of the wagon i.e., no rubber pad or any other alternative are provided on
the contact face of the side support beam. The side support beam is the movable
type, the movement being done by hydraulic arrangement (No external or movable
counterweights should be used with the side support beam). Facility of
forward/backward movement should exist, such that it should be move & touch the
wagon without applying any pressure on the wagon side wall. Movement of the
side support should be controlled and the speed should be crawling just before
making contact with the wagon side wall.
Behind this beam assembly are the spill plates designed to facilitate the discharge
of the contents of the wagons without spillage.
V. Top clamp assembly
The wagon tippler is equipped with four hydraulically operated steel clamping
arms moving through the hydraulic cylinder. All the clamps are designed to more
into position as the wagon tippler begins to rotate, and they clamp on the top of the
wagon at a pre-determined angle and hold the wagon firmly until it returns to its
normal resting position, when the clamps release the wagon. The clamping system
is designed so that it can clamp both the maximum and the minimum height of the
wagon being tipped. The clamping system is capable of holding a fully loaded
wagon at any position during the operation.
VII. Drive unit

26
The drive unit is either electromechanical or hydraulic. The electromechanical
drive consists of an electric motor coupled with a speed reduction gear box and
brake mounted on the input shaft of the gearbox. A hydraulic drive consists of a
power pack with an electric motor and a hydraulic motor coupled with a helical
gear box. The brake is built into the hydraulic motor, and an external hydraulic
thrusters brake is mounted on the input shaft of the gearbox.
3.3.4 Wagon Positioning Equipment
There are different types of wagon positioning equipment like hydraulically
operated side arm charger, beetle charger and shunting locos. The hydraulically
operated side arm chargers are being used in most of the plants in India as this
equipment is much faster compared to the others. The tractive force of the side arm
charger is suitable for hauling one fully loaded rake.
3.3.5 Unloading Hopper
The hopper provided below the wagon tippler could be either RCC type or
structural steel fabricated type. In most of the plants, this will be of RCC
construction. The suitable liner is provided for this hopper depending on the
abrasiveness of the material handled. Generally, steel grids of 250 mm square are
provided above the hopper to avoid higher size of material going through. The
higher size material is removed and broken separately and then passed through the
grid. The grid is sloping outwards for easy removal of such larger size material.
3.3.6 Feeder below Hopper
The feeder below the hopper could be either vibrating type feeder or apron feeder.
The apron feeder is more suitable for heavy duty application for taking the impact
of the falling material. The apron feeder is driven by the hydraulic motor for
smoother operation.
3.3.7 Rail Tracks
The layout of the rail tracks is such that the track will be straight and horizontal for
one rake length on the inhaul side and also on the outhaul side. This is preferable
for achieving faster unloading rate and the effort required by the side arm charger
would also be minimum. In case it is not possible to have the straight length to
accommodate one full rake on either side, then shunting operation is required using
the plant loco and hence, it takes the turnaround time more.

27
3.3.8 Dust Control System
Plain water spray type dust suppression system is provided for suppressing the dust
generated during the unloading operation. Spray nozzles are provided at the top of
the wagon tippler and also around the hopper for spraying the water and settling the
dust. An enclosed shed is provided for the wagon tippler so that the dust is
contained within and not spread to the other parts of the plant.
3.3.9 Control Room
A control room is provided adjacent to the wagon tippler at an elevated position for
operation and control of the wagon tippling system. The complete view of the
unloading system is available from this control room. Generally, the time taken for
unloading the rake is about 4 hours with one wagon tippler in operation.
Figure 3.2: A typical operation in Wagon-Tippler section.
3.4 Side Arm Charger
The Side Arm Charger (SAC) is used for wagon positioning at the wagon tippler
for unloading of materials. It is used for pushing / pulling a rake of 59 wagons one
by one on tippler.

28
3.4.1 Working principle
A train of 59 loaded wagons is brought in by a locomotive pushing/ pulling and
stopped with the leading wagon within the range of the Side Arm Charger using
trackside marker boards (under bidder's scope). Bidder is known as contractor,
supplier or vendor who responds to an invitation to bid the tender. The work in the
range or scope of bidder’s is known as bidder scope. The loco is decoupled and
despatched and the charger is driven to the leading wagon. Its arm can be lowered
and it can be coupled to the first wagon of the train. The train is hauled forward by
the charger until the front of the first wagon is about 4 meters away from the
tippler. The charger is stopped and the first wagon is uncoupled from the train.
Then, the charger is forwarded onto the leading wagon, which forward onto the
tippler. This automatically decouples the charger & its arm is raised before it
travels back to the train. The tippler is rotated for tippling the wagon. On reaching
near the standing train, the charger arm is lowered and coupled to the train ready
for repeating the cycle. In the next cycle, the train is drawn up by one wagon
length, the front wagon is decoupled & the next cycle is repeated. When the next
wagon is located on the tippler table the previously tippled wagon is ejected
simultaneously. On the outhaul side, the empty wagon forms a new train ready for
collection by a locomotive.
3.4.2 Description of side arms charger
The Side Arm Charger consists of hydraulic power pack, power supply system,
supports, electrics, buffer stop, rack & pinion, control cabin, automatic
coupler/decoupler etc.
The main component of side arm charger is as follows
I. Structural components
II. Charger frame
III. Drive unit
IV. Lubrication system
I. Structural components
The Side Arm Charger runs on its own track parallel to the main track. It has a
stroke of suitable length from a point on the inhaul side of tippler to a point on the
outhaul side. It is fitted with an arm pivoted at right angles and operated through a
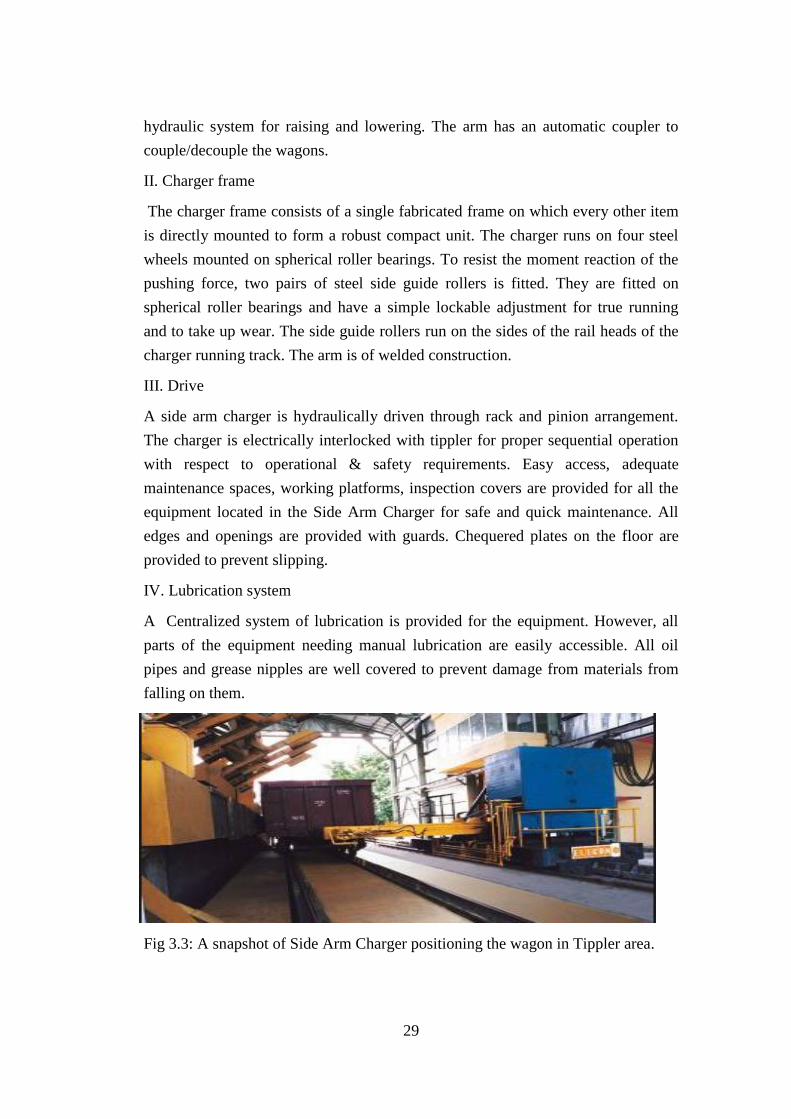
29
hydraulic system for raising and lowering. The arm has an automatic coupler to
couple/decouple the wagons.
II. Charger frame
The charger frame consists of a single fabricated frame on which every other item
is directly mounted to form a robust compact unit. The charger runs on four steel
wheels mounted on spherical roller bearings. To resist the moment reaction of the
pushing force, two pairs of steel side guide rollers is fitted. They are fitted on
spherical roller bearings and have a simple lockable adjustment for true running
and to take up wear. The side guide rollers run on the sides of the rail heads of the
charger running track. The arm is of welded construction.
III. Drive
A side arm charger is hydraulically driven through rack and pinion arrangement.
The charger is electrically interlocked with tippler for proper sequential operation
with respect to operational & safety requirements. Easy access, adequate
maintenance spaces, working platforms, inspection covers are provided for all the
equipment located in the Side Arm Charger for safe and quick maintenance. All
edges and openings are provided with guards. Chequered plates on the floor are
provided to prevent slipping.
IV. Lubrication system
A Centralized system of lubrication is provided for the equipment. However, all
parts of the equipment needing manual lubrication are easily accessible. All oil
pipes and grease nipples are well covered to prevent damage from materials from
falling on them.
Fig 3.3: A snapshot of Side Arm Charger positioning the wagon in Tippler area.

30
3.5 Reversible Apron Feeder
3.5.1 Introduction
A Reversible Apron Feeder is a mechanical device which transmits the coal to the
belt conveyor received from the bunker.
3.5.2 Description of RAF
The main components of Reversible Apron Feeder are as follows
Frame: The frame is manufactured from rolled steel section welded and bolted
together to form a rigid structure.
Roller: The roller is lifetime lubricated and is manufactured from alloy steel.
Chain link: The chain Link is forged steel. Pins and rollers are of hardened
steel.The chain link is bolted to the pans.
Apron/Pan: Apron/pan is of suitable thickness which is constructed out of
fabricated MS with wear resistant liner plate or special alloy steel without any liner
plate for the duty requirement. The pan is fitted directly to the chain attachment.
Sprocket: The head and tail end are of sturdy steel construction suitably stiffened.
The sprocket is made of cast alloy steel with case hardened teeth or forged steel.
Traction wheel: The traction wheel is made of cast steel with case hardened
surface.
Dribble belt system: Complete dribble belt system consisting of the head pulley,
tail pulley, drive, motor, stringers, deck plates etc. is provided.
3.6 Belt Conveyor
The belt conveyor is an endless belt moving over two end pulleys at fixed positions
and used for transporting material horizontally or at an incline up or down.
3.6.1 Component of belt conveyor
The main components of a belt conveyor are:
I. The belt that forms the moving and supporting surface on which the
conveyed material rides. It is the tractive element. The belt should be
selected considering the material to be transported.

31
II. The idlers, which form the supports for the carrying and return stands of the
belt.
III. The pulleys that support and move the belt and controls its tension.The
drive that imparts power to one or more pulleys to move the belt and its
loads.
IV. The structure that supports and maintains the alignments of the idlers and
pulleys and support the driving machinery.
Other components include:
V. Loading chute or feeder chute that organizes the flow of material and
directs it on the belt conveyor.
VI. Take-up-device which is used to maintain the proper tension of the belt for
effective power transmission.
VII. Belt cleaner that keeps the belt free from materials sticking to the belt.
VIII. Tramp removal device, which is optionally used in case the conveyed
material bears the chance of having tramp iron mixed with it and
subsequent handling of the material, demands its removal.
IX. Discharge chutes to guide the discharged projectile to a subsequent
conveyor or another receiving point.
X. Surge hopper and feeder, which is essential for supplying material to the
conveyor at the uniform rate when the supply of material is intermittent.
XI. Tripper arrangement to discharge material at a different point or to another
device.
3.6.2 Application
I. Conveyor belts are widely used in mineral industry. Underground mine
transport, opencast mine transport, and processing plants deploy conveyor
belts of different kinds to adopt the specific job requirements. The main
advantages of conveyor belt system are:
II. A wider range of material can be handled which cause problems in other
transportation means. Belt conveyor can be used for abrasive, wet, dry,
sticky or dirty material. The lump size of the transported material is limited
by the width of the belt. Belts up to 2500 mm wide are used in mining
industry.
III. Higher capacity can be handled than any other form of the conveyor at a
considerably lower cost per ton kilometer. Conveyor belts with a capacity

32
of 11000 t/h and even higher can be deployed to match with higher capacity
mining machinery.
IV. Longer distances can be covered more economically than any other
transportation system. A single belt conveyor or a series of belt conveyors
can do this. Belt conveyors can be adapted for cross-country laying.
V. By the use of many forms of ancillary equipment such as mobile trippers or
spreaders, bulk material can be distributed and deposited whenever
required.
VI. Many other functions can be performed with the basic conveying like
weighing, sorting, picking, sampling, blending, spraying, cooling, drying
etc.
VII. Structurally it is one of the lightest forms of the conveying machine. It is
comparatively cheaper and supporting structures can be used for many
otherwise impossible structures such as crossing rivers, streets, and valleys.
VIII. The belt conveyor can be adopted for special purposes (fire resistant, wear
resistant, corrosion resistant, high angle negotiation etc.) and can be
integrated with other equipment.
IX. It can be horizontal, incline or decline or a combination of all.
X. Minimum labour is required for the operation and maintenance of belt
conveyor system.
XI. In underground mine transport, belt conveyor can be used in thin seams as
it eliminates the rock works that might otherwise be required to gain
haulage height. Moreover, belt conveyor can provide continuous haulage
service from pit bottom to the surface.
3.6.3 Limitations of conveyor belt
The limitations of conveyor belt are:
I. The loading and transfer points need to be properly designed.
II. Numbers of protective devices have to be incorporated to save the belt from
getting damaged by operational problems.
III. The belt needs higher initial tension (40-200% of useful pull).
IV. Causing poor productivity.
3.6.4 Idlers
Idlers are mounted on a support frame, which can be shiftable or permanent. The
carrying side of the belt is supported on the carrier rollers sets. A set of three rollers

33
is arranged to form a trough for the troughed belt conveyor. The return side of the
belt is supported on straight return idlers. The spacing of the idlers is determined
based on the belt sag between the idlers. The sag depends on the belt tension, belt
width, belt properties and the payload per meter of the belt. The idlers are specified
by its length and diameter. These parameters are selected based on the required belt
speed for the particular width of the belt.
Figure 3.4: Components of the belt conveyor.
3.6.5 Pulley
A conveyor belt system uses different types of pulleys like end pulley, snub pulley,
bend pulley etc. The end pulleys are used for driving and sometimes for making
tensioning arrangements. Snub pulleys increase the angle of wrap thereby
increasing the effective tension in the belt. The pulley diameter depends on the belt
width and belt speed.
Pulleys are used for providing the drive to the belt as well as for maintaining the
proper tension to the belt.
3.6.6 Drive
Belt drive is provided normally at the discharge ends, however, it may be provided
through the head end or through intermediate pulley by coupling the pulley shaft to
the reducing gear’s output shaft. The coupling is selected based on the load
characteristics and applications. Flexible coupling or fluid couplings are often used.

34
3.6.7 Take-up
The purposes of take-up are:
I. To allow for stretch and shrinkage of the belt.
II. To ensure that the minimum tension in the belt is sufficient to prevent
undue sag between idlers.
III. To ensure that the tension in the belt in the rear of the drive pulley is
sufficient to permit such pulley to transmit the load.
3.6.8 Conveyor Support
The support of conveyor is normally a structural frame. Depending on the situation
the structure can be mounted on the floor or on a skid. The main job of the support
is to let the belt run without getting skewed. Depending on situations the support
can be made moving type. In such cases idler, a wheel mounted or crawler
mounted platform keeps the necessary provision to support the idlers on which the
conveyor runs.
3.7 Stacker
3.7.1 Introduction
A stacker is a large machine used in bulk material handling. Its function is to pile
bulk material such as coal, limestone, and ores onto a stockpile. Stackers are
nominally rated for capacity in tons per hour (mph). They normally travel on a rail
between stockpiles in the stockyard. A stacker can usually move in at least two
directions: horizontally along the rail and vertically by luffing (raising and
lowering) its boom. Luffing of the boom minimizes dust by reducing the distance
that material such as coal needs to fall to the top of the stockpile. The boom is
luffed upwards as the height of the stockpile increases. Some stackers can rotate
the boom. This allows a single stacker to form two stockpiles, one on either side of
the conveyor.
3.7.2 Component of Stacker
I. Structural Steel Work
II. Boom Conveyor

35
III. Boom Luffing Arrangement
IV. Slewing Arrangement
V. Hydraulic system
VI. Chute and skirt board
I. Structural Steel Work
All parts are conveniently arranged for ease of access with special attention being
paid to the requirements for maintenance of machinery. To facilitate the
maintenance of the various parts, it is full of web construction and adequate
walkways, ladders etc are provided for convenient operation.
II. Boom Conveyor
The reversible boom conveyor drive is mounted on a drive frame and is supported
on the revolving frame by a torque arm with plain spherical rod ends. The bearing
housings supporting the discharge pulley assembly on either side are supported on
sliding blocks at boom head. The movement of the bearing blocks for the purpose
of adjustment of belt tension and belt changing is achieved through screwed
spindles. Belt sway, pull cord and belt clip monitor switches are included for
protection of the conveyor.
III. Boom Luffing Arrangement
The raising and lowering of the hinged bascule system and controlling it in
operation is achieved by a hydraulic system with two hydraulic cylinders. The
cabin is also maintained level automatically by a hydraulic cylinder fed
simultaneously from this system. The power pack also includes an independent
system for actuation of the chutes etc. and is mounted on at the rear of the
revolving platform.
IV. Slewing Arrangement
The revolving superstructure of the machine is supported on a large diameter
slewing bearing. An external ring gear, bolted to the revolving frame, is driven by
two meshing pinions powered by two independent drive units each comprising a
squirrel cage motor, slip clutch, brake, and planetary with bevel helical gear
reducer. The slew angles are monitored by limit switches. Additional contacts in

36
the limit switch ensure that the boom can only be slewed over the yard conveyor
after it has been raised clear of it.
V. Hydraulic system
A hydraulic system basically consists of a hydraulic tank with capacity of 360
litres. It is mounted with a pump which in use the pressure of the flow of oil and
power from a motor. The output line from the pump is constructed with a non-
return valve which functions and called Direct control valve. After D/C valve, one
line is connected with tank and another end is connected to the output.
VI. Chute and skirt board
A conical chute load with stacker and under this chute receiving the end of the
boom is situated. There are the three numbers of skirt board at the receiving end
and also controlled the spillage generation.
3.8 Reclaimer
3.8.1 Introduction
A reclaimer is a rail-mounted machine used in bulk material handling applications.
A reclaimer's function is to recover bulk material such as ores and coals from a
stockpile through the scraper shuttle which is taken up the material by endless
mounting scraper chains and the blade fastened to them and is feeding onto a belt
conveyor that runs laterally along the piles.
3.8.2 Modes of control
Three modes of controls are provided
Scraper chain: The chain drive switches on through a push button which causes the
power contactor for the drive motor to pick up. During operation, the chain is
supervised by a proximity type speed monitoring device. In case, after a present
time delay, the contact of the speed monitoring device in the control circuit has not
changed over, the machine is to be stopped automatically, and the failure is
indicated in the enunciator in the operator’s cabin. If with the chain running, a
drive failure such as missing blades etc., cause the pulses of the speed monitoring
device not to be transmitted, then after a present short delay, the chain is switched
off. Travel drive: Through a selector switch for ‘fast-slow’ speed selection and
another selector switch for ‘forward-reverse’ the travel gear is started in the desired

37
direction. Variable frequency drive (v/f control) has been provided for the travel
drive, to which the PLC provides the fast-slow speed command after the necessary
speed mode is selected by the operator. However, travel on high (fast) speed is
used in ‘manual mode’ of control with lifted up scraper chain for changing the pile
(or zero of operation) and the slow speed is for spotting at a stockpile. End position
limit switches at the extreme ends of the yard are switch off the drive when
actuated.
Hoist drive: The hoisting gear is operated in either fast or slow speed through a
selector switch. The drive can be switched on by a selector switch for raise & lower
of the boom. In the manual mode, fast speed is used for raising/ lowering of the
boom during pile change over. However, slow speed is used in all the three modes.
During reclaiming operation, in auto mode, raising/ lowering of the boom is done
only in the slow speed. During changing of the pile, both the chains (Booms) are
lifted up.
Cable reels: Cable reels are manually ready for operation interlocked with the
travel drive. Though thermal releases, the cable reels and scarper are disconnected
in case of an overload and simultaneously give audio-visual annunciation in the
operator’s cabin.
3.8.3 Component of Reclaimer
I. Main Structure
The main structure is constructed by I-beam and consists of two numbers of boom
gear box with motor and another part of the main structure are the electrical cabin
and two numbers of slope chute and one no of delivery chute.
II. Boom assembly
The boom is consists of two numbers of the drive sprocket. These drive sprocket is
mounted with drive shaft of gear box and two numbers of chain is mounted with
two sprocket which supported guide disc and moves clockwise direction with
supporting channel. Generally, each boom consists of 72 numbers of buckets.
III. Boom support and luff superstructure
Boom support with rope steel wire rope which is completing grounded with 3 no’s
of the pulley in each end and one end rope is fixed with reclaimer body and another
end is fixed with movable hoist dream.
IV. Operator cabin

38
The machine is operated from a driver’s cabin (operator’s cabin) which has a clear
view over the working range of both the booms on the A and B side during
reclaiming. All controls and signal devices are centrally installed in the cabin.
Signal panel informs the operator continuously the operating condition of the
machine. As inter-communication system between driver’s cabin and central
control room ensures fast exchanges of information and an economic use of the
machine.
3.9 Summary
A brief description of coal handling plant equipment is presented in this chapter
viz. Tippler, Side arm charger, Reversible apron feeder, Belt conveyor system,
Stacker, Reclaimer. It also emphasizes the component of above equipment and how
its role in the industries while handling the material being used in coal handling
plant for coal transportation. This chapter presents the chronological order of
equipment starting from wagon unloading in tippler equipment to reclaimer for
reclaiming the material.

39
Chapter 4
4 OEE AND DATA ANALYSIS
4.1 Overview of OEE
Overall Equipment Effectiveness (OEE) shows the effectiveness (in percentage) of
actual versus ideal performance of the operation in the coal handling equipment.
The OEE metric starts with the idea of Theoretical Operating Time. That is the
maximum amount of time that, a facility could be open and available for the
production process to produce. Scheduled Shutdown time is calculated by
subtracting the category of the time from the Theoretical Operating Time. The
scheduled shutdown time, includes all the events that should be excluded from
efficiency analysis because there is no intention of running production. The
leftover available time is the Loading Time and the OEE calculation begins with it.
Availability –Availability takes into account Downtime Loss, which includes any
events that stop planned production for a relevant length of time (several minutes
or long enough to be defined as an Event). Examples include equipment failures,
material shortages, and change over time. Changeover time is included in OEE
analysis since it is a form of downtime. Although it is not currently possible to
eliminate changeover time, it can be minimized. The remaining available time is
called Operating Time. Availability is a percentage and is calculated by dividing
the Operating Time by the Loading Time.
Performance – Performance is a percentage and is calculated by the number of
actual products (Actual Output) processed divided by the theoretical maximum

40
products (Theoretical Output) that could be processed in the Operating Time. The
performance takes into account Speed Loss, which includes any factors that cause
the process to operate at less than the theoretical maximum rate. Examples include
machine wear, sub-standard materials, operator inefficiency, etc. The remaining
available time is called Net Operating Time.
Quality – Quality is a percentage and is calculated by a number of good products
processed (Good Output) that pass manufacturing quality standards divided by the
total number of products processed, or the Actual Output. Less than 100% Quality
Rate indicates Quality Loss. Quality takes into account Quality Loss, which
accounts for produced units that do not meet quality standards, including units that
require rework. The remaining time is called Full Productive Time. The goal of all
operations is to maximize Full Productive Time.
OEE quantifies areas of loss to provide a gauge for measuring the performance of
the current operational environment and where to focus the efforts of the operations
team for improvements that contribute directly to operating income. OEE is
frequently used as a key metric in Lean Manufacturing programs. It provides a
consistent way to measure the effectiveness of Lean and other initiatives by
providing an overall framework for measuring operational performance.
The following main areas are covered:
OEE: Sources of Business Loss – The primary drivers of business loss within the
three OEE components.
Six Big Losses – Production processes have six common types of waste, better
known as the Six Big Losses. The Six Big Losses distinguish the most common
causes of business loss in a manufacturing operation.
Calculating OEE – The calculation of OEE is defined.
4.2 OEE: Sources of Business Loss
The three primary components of loss within OEE are Availability, Performance,
and Quality which were already defined. The primary drivers of business loss
within these three OEE components are:

41
Downtime Loss – Downtime loss is defined as the time during which automation
equipment is not operated, but necessary to be produced. It refers to two sources of
loss:
Equipment Breakdowns/Failure – A sudden and unexpected equipment breakdown
or failure results in loss of production time. The cause of the malfunction may be
technical as well as organizational (i.e. operational error, poor maintenance, etc.).
OEE measures the way the breakdown manifests itself.
Equipment Idle Time – Setup and adjustment time where the equipment is idle. The
equipment can be idle for many reasons (i.e. changeover, maintenance or work
breaks). In the case of a changeover, the equipment usually has to be shut down for
some time in order to change tools, dies, or other parts. SMED (Single Minute
Exchange of Die) defines the change over time as the time between the last good
product of the previous series and the first good product of the new series. For the
OEE, the changeover time is the time when the machine does not generate any
products.
Speed Loss – Speed loss implies that the equipment is operating, but not at its
maximum theoretical speed. There are two types of speed losses:
Reduced Equipment Speed – Reduced speed is the difference between the actual set
speed and the theoretical or design speed. There is often a considerable difference
between what an operator believes is the equipment’s maximum speed versus the
theoretical maximum speed. In many cases, the production speed has been
optimized in order to prevent other losses such as quality rejects and breakdowns.
Losses due to reduced speed are, therefore, often ignored or underestimated.
Minor Equipment Stops – When equipment has short interruptions and does not
deliver constant speed then a smooth flow of production does not occur. These
minor stops manifest subsequent losses of speed and are generally caused by small
problems, such as product units blocking sensors or getting stuck in conveyor belts.
These frequent slowdowns can drastically diminish the effectiveness of equipment.
Quality Loss – Loss of quality occurs when equipment performance contributes to
products that do not satisfy the company’s defined quality criteria. Two types of
quality losses are distinguished:
Scrap – Scrap is those product units that do not meet the quality specifications
even if they can be sold as “sub-specification”. The objective of every company
has “zero defects”. A specific type of quality loss is the start-up and end up loss.

42
Rework – Reworked product units do not meet the quality specifications the first
time through the process, but can be reprocessed into good products. Reworking
products may not seem to be a loss because the product unit can still be sold at the
normal price. However, the product unit was not right the first time and is,
therefore, a registered as a quality loss just like scrap.
4.3 Defining Six big Losses
One of the major goals of OEE programs is to reduce and/or eliminate the Six Big
Losses – the most common causes of efficiency loss in operation. The following
table lists the Six Big Losses and shows how they relate to the OEE Loss
categories.
Table 4.1: Six big losses with examples.
Six Big Loss
Category
OEE Loss
Category
Event Examples
Breakdowns Down Time
Loss
• Tooling Failures
• Unplanned Maintenance
• General Breakdowns
• Equipment Failure
Setup and
Adjustments
Down Time
Loss
• Setup/Changeover
• Material Shortages
• Operator Shortages
• Major Adjustments
• Warm-Up Time
Small Stops Speed Loss • Obstructed Product Flow
• Component Jams
• Mis-feeds
• Sensor Blocked
• Delivery Blocked
• Cleaning/Checking
Reduced Speed Speed Loss • Rough Running
• Under Nameplate Capacity
• Under Design Capacity
• Equipment Wear
• Operator Inefficiency
Startup
Rejects
Quality Loss • Scrap
• Rework
• In-Process Damage
• In-Process Expiration
• Incorrect Assembly
Production Rejects Quality Loss • Scrap
• Rework
• In-Process Damage
• In-Process Expiration
• Incorrect Assembly

43
4.4 Calculating OEE
OEE calculation is based on the three OEE Factors, Availability, Performance, and
Quality. Here's how each of these factors is calculated.
Table 4.2: OEE calculation.
Availability takes into account “lost time” which includes any events that stop
planned production for an appreciable length of time. This is usually because of
equipment failures, waiting times, and etc. Then, availability is determined as
follows:
Availability =Net Available Time - Downtime Losses×100
Net Available Time The performance takes into account “speed loss”, which includes any factors that
cause the equipment to operate at less than the maximum possible speed when
running. Reasons for that can be substandard materials, operator inefficiency, and
job conditions. Then performance is determined as follows:
Performance =Operating Time- Speed Losses ×100
Operating Time Quality takes into account “product loss or filling factor loss”, which is determined
as follows:
Total Time
Net Available Time Scheduled Downtime
Operating Time Downtime Losses
𝐴 = 𝑂𝑝𝑒𝑟𝑎𝑡𝑖𝑛𝑔 𝑇𝑖𝑚𝑒
𝑁𝑒𝑡 𝑎𝑣𝑎𝑖𝑙𝑎𝑏𝑙𝑒 𝑇𝑖𝑚𝑒
Net Operating Time Speed Losses
𝑃 = 𝑁𝑒𝑡 𝑂𝑝𝑒𝑟𝑎𝑡𝑖𝑛𝑔 𝑇𝑖𝑚𝑒
𝑂𝑝𝑒𝑟𝑎𝑡𝑖𝑛𝑔 𝑇𝑖𝑚𝑒
𝑃 =𝐴𝑐𝑡𝑢𝑎𝑙 𝑂𝑢𝑡𝑝𝑢𝑡
𝑇𝑎𝑟𝑔𝑒𝑡 𝑂𝑢𝑡𝑝𝑢𝑡
Fully Productive
Time
Defect
Losses
𝑄
= 𝐹𝑢𝑙𝑙𝑦 𝑃𝑟𝑜𝑑𝑢𝑐𝑡𝑖𝑣𝑒 𝑇𝑖𝑚𝑒
𝑁𝑒𝑡 𝑂𝑝𝑒𝑟𝑎𝑡𝑖𝑛𝑔 𝑇𝑖𝑚𝑒
𝑄 = 𝐺𝑜𝑜𝑑 𝑂𝑢𝑡𝑝𝑢𝑡
𝐴𝑐𝑡𝑢𝑎𝑙 𝑂𝑢𝑡𝑝𝑢𝑡
Quality = Net Operating Time - Defect Losses ×100
Net Operating Time

44
OEE takes into account all three OEE Factors, and is calculated as:
OEE = Availability x Performance x Quality
4.4.1 OEE calculation for Tippler
Wagon-Tippler is a mechanism used for unloading certain cars such as a wagon,
hopper cars etc. It holds the rail car to a section of track and rotates track and car
together to dump out the contents such as coal, iron ore etc. Their performance and
production control the total output of the operation. Therefore, any production loss
in tippler section causes an increase in total production cost as well as demurrage
charges. Therefore, the possible time losses causes are defined as follows:
Table 4.3: Time loss classification of Tippler.
No Loss Classification Description
1. Nonscheduled time The time duration for which equipment is not
scheduled to operate.
2. Scheduled maintenance time Time spent for periodic maintenance of tippler.
3. Unscheduled maintenance
time
Time spent for the breakdown.
4. Setup and adjustment time Time spent for setup and adjustment.
5. Idle time without operator Equipment is ready but no operator (such as
lunch break).
6. Wagon waiting time The time duration for which tippler waits to get
position to be loaded.
7. Tippling delay The time duration for which tippler is stuck up.
8. Time losses due to job
conditions:
Time loss due to management, supervision,
climate and job conditions.
9. Speed loss Time loss due to the equipment that is operating
under the standard speed.
10. Quality loss That is equivalent to unqualified products and
depends on the fill factor of a tippler.

45
Table 4.4: Timeline of items for a Tippler Operation & Estimation.
Item Description Calculation
Total Time 24 hours/day * 365
days/year
8760 hrs.
Non-Scheduled Time i.e. No Production,
Breaks, Holidays, Shift Changes….
15 Days Off 360 hrs.
Scheduled Maintenance 3 Hours/ Day * 350
Days
1050 hrs.
Scheduled Time based Approach Total Time –
Scheduled Shut
Down
7350 hrs.
Downtime Losses
A. Breakdowns (Un-Scheduled
Maintenance)
Failure of
equipment
635 hrs.
B. Idle Time
Set-up & Adjustment 0.4 Hours/Shift 420 hrs.
Standby Time 0.7 Hours/Shift 735 hrs.
Wagon Waiting Time 0.2 Hours/Shift 210 hrs.
Sub Total Availability Losses (A+B) hrs. 2000 Hour 7350 – 2000 = 5350
5350 ÷ 7350 * 100 =72%
Speed Losses
C. Tippling Delay 0.3 Hours/Shift 315 hrs.
D. Speed Loss 0.2 Hours/Shift 210 hrs.
Job Condition Equipment did not
work due to rain,
snow, fog and
others
188 hrs.
Sub Total Performance Losses 713 Hours 5350 – 713 = 4637
4637 ÷ 5350 * 100 = 87%
Defect Losses
Sub Total Quality Losses Filling Factor 89%
Overall Equipment Effectiveness OEE 0.72*0.87*0.89 =56 %
Tippler Capacity 700 Ton
Ideal Production 220 Ton/hrs.
Total Production Total Time ÷ Ideal
Production *
Tippler Capacity *
OEE
93652363 Ton

46
4.4.2 OEE calculation for Side Arm Charger
The Side Arm Charger (SAC) is used for wagon positioning at the wagon tippler
for unloading of materials. It is used for pushing / pulling a rake of 59 wagons one
by one on tippler. Their performance and production control the total output of the
operation. Therefore, any production loss inside arm charger causes an increase in
total production cost as well as demurrage charges. As it is said before that the time
losses classification for side arm charger is also different. Therefore, the possible
time losses causes are defined as follows:
Table 4.5: Time loss classification of Side arm charger.
No Loss Classification Description
1. Nonscheduled time The time duration for which equipment is not
scheduled to operate.
2. Scheduled maintenance time Time spent for periodic maintenance of SAC.
3. Unscheduled maintenance
time
Time spent for the breakdown.
4. Setup and adjustment time Time spent for setup and adjustment.
5. Idle time without operator Equipment is ready but no operator (such as
lunch break).
6. Wagon waiting time The time duration for which SAC waits to get
position to be coupled.
7. Minor stoppage Time loss due to cleaning/checking of SAC.
8. Time losses due to job
conditions:
Time loss due to management, supervision,
climate and job conditions.
9. Speed loss Time loss due to the equipment that is operating
under the standard speed.
10. Quality loss That is equivalent to unqualified products and
depends on the fill factor of side arm charger.

47
Table 4.6: Time line of items for a Side Arm Charger Operation & Estimation.
Item Description Calculation
Total Time 24 hours/day * 365
days/year
8760 hrs.
Non Scheduled Time i.e No Production,
Breaks, Holidays, Shift Changes….
15 Days Off 360 hrs.
Scheduled Maintenance 3 Hours/ Day * 350
Days
1050 hrs.
Scheduled Time based Approach Total Time –
Scheduled Shut
Down
7350 hrs.
Downtime Losses
A. Breakdowns (Un-Scheduled
Maintenance)
Failure of equipment 490 hrs.
B. Idle Time
Set-up & Adjustment 0.2 Hours/Shift 210 hrs.
Stand by Time 0.6 Hours/Shift 630 hrs.
Wagon Waiting Time 0.2 Hours/Shift 210 hrs.
Sub Total Availability Losses (A+B) hrs. 1540 Hour 7350 – 1540 = 5810
5810 ÷ 7350 * 100 =
79%
Speed Losses
C. Reduced SAC Speed 0.1 Hours/Shift 105 hrs.
D. Minor Stoppage 0.2 Hours/Shift 210 hrs.
Job Condition Equipment did not
work due to rain,
snow, fog and others
188 hrs.
Sub Total Performance Losses 503 Hours 5810 – 503 = 5307
5307 ÷ 5810 * 100 =
91%
Defect Losses
Sub Total Quality Losses Filling Factor 89%
Overall Equipment Effectiveness OEE 0.79*0.91*0.89 =64 %
Side Arm Charger Capacity 700 Ton
Ideal Production 27.5nos Wagon/hrs.
Total Production Total Time ÷ Ideal
Production * SAC
Capacity * OEE
107031272.73 Ton

48
4.4.3 OEE calculation for Reversible Apron Feeder
A Reversible Apron Feeder is a mechanical device which transmits the coal to the
belt conveyor received from the bunker. Their performance and production control
the total output of the operation. Therefore, any production loss in reversible apron
feeder causes an increase in total production cost as well as demurrage charges. As
it is said before that the time losses classification for reversible apron feeder is also
different. Therefore, the possible time losses causes are defined as follows:
Table 4.7: Time loss classification of Reversible apron feeder.
No Loss Classification Description
1. Nonscheduled time The time duration for which equipment is not
scheduled to operate.
2. Scheduled maintenance time Time spent for periodic maintenance of RAF.
3. Unscheduled maintenance
time
Time spent for the breakdown.
4. Setup and adjustment time Time spent for setup and adjustment.
5. Idle time without operator Equipment is ready but no operator (such as
lunch break).
6. Material waiting time The time duration for which RAF waits to
receive the material.
7. Minor stoppage Time loss due to cleaning/checking of RAF.
8. Time losses due to job
conditions:
Time loss due to management, supervision,
climate and job conditions.
9. Speed loss Time loss due to the equipment that is operating
under the standard speed.
10. Quality loss That is equivalent to unqualified products and
depends on the fill factor of reversible apron
feeder.

49
Table 4.8: Timeline of items for a Reversible Apron Feeder Operation &
Estimation.
Item Description Calculation
Total Time 24 hours/day * 365
days/year
8760 hrs.
Non-Scheduled Time i.e No Production,
Breaks, Holidays, Shift Changes….
15 Days Off 360 hrs.
Scheduled Maintenance 3 Hours/ Day * 350
Days
1050 hrs.
Scheduled Time based Approach Total Time –
Scheduled Shut
Down
7350 hrs.
Downtime Losses
A. Breakdowns (Un-Scheduled
Maintenance)
Failure of equipment 218 hrs.
B. Idle Time
Set-up & Adjustment 0.2 Hours/Shift 210 hrs.
Standby Time 0.7 Hours/Shift 735 hrs.
Material Waiting Time 0.3 Hours/Shift 315 hrs.
Sub Total Availability Losses (A+B) hrs 1478 Hour 7350 – 1478 = 5872
5872 ÷ 7350 * 100 =
80%
Speed Losses
C. Reduced RAF Speed 0.1 Hours/Shift 105 hrs.
D. Minor Stoppage 0.2 Hours/Shift 210 hrs.
Job Condition Equipment did not
work due to rain,
snow, fog and others
188 hrs.
Sub Total Performance Losses 503 Hours 5872 - 503= 5369
5369 ÷ 5872 * 100 =
91%
Defect Losses
Sub Total Quality Losses Filling Factor 86%
Overall Equipment Effectiveness OEE 0.79*0.91*0.86 =61 %
Reversible Apron Feeder Capacity 750Ton
Ideal Production 550Ton/hrs.
Total Production Total Time ÷ Ideal
Production * RAF
Capacity * OEE
43720363.637 Ton

50
4.4.4 OEE calculation for Belt conveyor
Belt conveyors are a mechanical device which transmit the material from one
location to another location by the help of pulley, idler, structure, driving unit etc.
Their performance and production control the total output of the operation.
Therefore, any production loss in belt conveyor causes an increase in total
production cost as well as demurrage charges. As it is said before that the time
losses classification for belt conveyor is also different. Therefore, the possible time
losses causes are defined as follows:
Table 4.9: Time loss classification of Belt conveyor system.
No Loss Classification Description
1. Nonscheduled time The time duration for which equipment is not
scheduled to operate.
2. Scheduled maintenance time Time spent for periodic maintenance of belt
conveyor.
3. Unscheduled maintenance
time
Time spent for the breakdown.
4. Setup and adjustment time Time spent for setup and adjustment.
5. Idle time without operator Equipment is ready but no operator (such as
lunch break).
6. Material waiting time The time duration for which belt conveyor
waits to receive the material.
7. Minor stoppage Time loss due to cleaning/blocking of sensors
in belt conveyor.
8. Time losses due to job
conditions:
Time loss due to management, supervision,
climate and job conditions.
9. Speed loss Time loss due to the equipment that is
operating under the standard speed.
10. Quality loss Due to fragmentation size and operator ability,
the width of the belt conveyor cannot be
loaded to its full capacity.

51
Table 4.10: Timeline of items for a Belt Conveyor Operation & Estimation.
Item Description Calculation
Total Time 24 hours/day *
365 days/year
8760 hrs.
Non-Scheduled Time i.e. No Production,
Breaks, Holidays, Shift Changes….
15 Days Off 360 hrs.
Scheduled Maintenance 3 Hours/ Day *
355 Days
1050 hrs.
Scheduled Time based Approach Total Time –
Scheduled Shut
Down
7350 hrs.
Downtime Losses
A. Breakdowns (Un-Scheduled
Maintenance)
Failure of
equipment
835 hrs.
B. Idle Time
Set-up & Adjustment 0.4 Hours/Shift 420 hrs.
Standby Time 0.6 Hours/Shift 630 hrs.
RAF Waiting Time 0.3 Hours/Shift 315 hrs.
Sub Total Availability Losses (A+B) hrs. 2200 Hour 7350 – 2200 = 5150
5150 ÷ 7350 * 100 = 70%
Speed Losses
C. Reduced Belt Speed 0.2 Hours/Shift 210 hrs.
D. Conveyor belt Minor Stoppage Speed
Loss
0.3 Hours/Shift 315 hrs.
Job Condition Equipment did not
work due to rain,
snow, fog and
others
188 hrs.
Sub Total Performance Losses 713 Hours 5150 – 713 = 4437
4437÷ 5150 * 100 = 86%
Defect Losses
Sub Total Quality Losses Filling Factor 84%
Overall Equipment Effectiveness OEE 0.70*0.86*0.84 = 51%
Conveyor belt Capacity 700Ton
Ideal Production 500Ton/hrs.
Total Production Total Time ÷ Ideal
Production * Belt
conveyor Capacity
* OEE
37527840Ton

52
4.4.5 OEE calculation for Stacker
Stacker receives the material from belt conveyor and stacking into the stock yard
with the help of boom conveyor. Their performance and production control the
total output of the operation. Therefore, any production loss in stacker causes an
increase in total production cost. As it is said before that the time losses
classification for stacker is also different. Therefore, the possible time losses causes
are defined as follows:
Table 4.11: Time loss classification of Stacker.
No Loss Classification Description
1. Nonscheduled time The time duration for which equipment is not
scheduled to operate.
2. Scheduled maintenance time Time spent for periodic maintenance of stacker.
3. Unscheduled maintenance time Time spent for the breakdown.
4. Setup and adjustment time Time spent for setup and adjustment.
5. Idle time without operator Equipment is ready but no operator (such as lunch
break).
6. Material waiting time The time duration for which stacker waits to
receive the material.
7. Minor stoppage Time loss due to cleaning/blocking of sensors in
the stacker.
8. Time losses due to job
conditions:
Time loss due to management, supervision,
climate and job conditions.
9. Speed loss Time loss due to the equipment that is operating
under the standard speed.
10. Quality loss Due to fragmentation size and operator ability, the
width of the belt stacker cannot be loaded to its
full capacity.

53
Table 4.12: Timeline of items for a Stacker Operation & Estimation.
Item Description Calculation
Total Time 24 hours/day * 365
days/year
8760 hrs.
Non-Scheduled Time i.e No Production,
Breaks, Holidays, Shift Changes….
15 Days Off 360 hrs.
Scheduled Maintenance 3 Hours/ Day * 355
Days
1050 hrs.
Scheduled Time based Approach Total Time –
Scheduled Shut
Down
7350 hrs.
Downtime Losses
A. Breakdown (Un-Scheduled Maintenance) Failure of equipment 468 hrs.
B. Idle Time
Set-up & Adjustment 0.3 Hours/Shift 315 hrs.
Standby Time 0.5 Hours/Shift 525 hrs.
Material Waiting Time 0.4 Hours/Shift 420 hrs.
Sub Total Availability Losses (A+B) hrs. 1748 Hour 7350 – 1748 = 5602
5602 ÷ 7350 * 100 = 76%
Speed Losses
C. Reduced Stacking Speed 0.2 Hours/Shift 210 hrs.
D. Stacker Minor Stoppage (Speed Loss) 0.3 Hours/Shift 315 hrs.
Job Condition Equipment did not
work due to rain,
snow, fog and others
188 hrs.
Sub Total Performance Losses 713 Hours 5602 - 713 = 4889
5889 ÷ 5602 * 100 = 87%
Defect Losses
Sub Total Quality Losses Filling Factor 79%
Overall Equipment Effectiveness OEE 0.76*0.87*0.79 = 52%
Stacker Capacity 300 Ton
Ideal Production 220 Ton/hrs.
Total Production Total Time ÷ Ideal
Production * Stacker
Capacity * OEE
37269804 Ton

54
4.4.6 OEE calculation for Reclaimer
Reclaimer reclaims the material through a series of chain mounted on it and is
dispatched to belt conveyor for next operation. Their performance and production
control the total output of the operation. Therefore, any production loss in stacker
causes an increase in total production cost. As it is said before that the time losses
classification for reclaimer is also different. Therefore, the possible time losses
causes are defined as follows:
Table 4.13: Time loss classification of Reclaimer.
No Loss Classification Description
1. Nonscheduled time The time duration for which equipment is not
scheduled to operate.
2. Scheduled maintenance time Time spent for periodic maintenance of reclaimer.
3. Unscheduled maintenance time Time spent for the breakdown.
4. Setup and adjustment time Time spent for setup and adjustment.
5. Idle time without operator Equipment is ready but no operator (such as lunch
break).
6. Material waiting time The time duration for which reclaimer waits to
receive the material.
7. Minor stoppage Time loss due to cleaning/blocking of sensors in
reclaimer.
8. Time losses due to job
conditions:
Time loss due to management, supervision, climate
and job conditions.
9. Speed loss Time loss due to the equipment that is operating
under the standard speed.
10. Quality loss Due to fragmentation size and operator ability, the
width of the belt reclaimer cannot be loaded to its
full capacity.

55
Table 4.14: Timeline of items for a Reclaimer Operation & Estimation.
Item Description Calculation
Total Time 24 hours/day * 365
days/year
8760 hrs.
Non-Scheduled Time i.e. No Production,
Breaks, Holidays, Shift Changes….
( Scheduled Shut Downtime)
15 Days Off 360 hrs.
Scheduled Maintenance 3 Hours/ Day * 355
Days
1050 hrs.
Scheduled Time based Approach Total Time –
Scheduled Shut
Down
7350 hrs.
Downtime Losses
A. Breakdown (Un-Scheduled Maintenance) Failure of equipment 382 hrs.
B. Idle Time
Set-up & Adjustment 0.1 Hours/Shift 105 hrs.
Standby Time 0.5 Hours/Shift 525 hrs.
Material Waiting Time 0.4 Hours/Shift 420 hrs.
Sub Total Availability Losses (A+B) hrs. 1432 Hour 7350 - 1432 = 5918
5918 ÷ 7350 * 100 = 80%
Speed Losses
C. Reduced Reclaiming Speed 0.1 Hours/Shift 105 hrs.
D. Reclaimer Minor Stoppage (Speed Loss) 0.2 Hours/Shift 210 hrs.
Job Condition Equipment did not
work due to rain,
snow, fog and others
188 hrs.
Sub Total Performance Losses 503 Hours 5918 - 503 = 5415
5415 ÷ 5918 * 100 = 91%
Defect Losses
Sub Total Quality Losses Filling Factor 78%
Overall Equipment Effectiveness OEE 0.80*0.91*0.78 = 56%
Reclaimer Capacity 350 Ton
Ideal Production 300 Ton/hrs.
Total Production Total Time ÷ Ideal
Production *
Reclaimer Capacity
* OEE
34339200 Ton

56
4.5 Performance report of coal handling machineries
Fig 4.1: Performance appraisal of Tippler.
Fig 4.2: Performance appraisal of Side arm charger.
Non Scheduled Time Scheduled
Maintenance Time
Scheduled Time
based Approach
Breakdown Time
Stand by Time
Wagon waiting Time
Set up & Adjustment
Time
Operating Time
Minor Stoppage
Reduced SAC Speed Net Operating Time
Job condition Losses
Pie Chart for Performance Appraisal of Side Arm Charger
Non Scheduled Time Scheduled
Maintenance Time
Scheduled Time
based Approach
Breakdown Time
Stand by Time
Wagon waiting Time
Set up & Adjustment
Time
Operating Time
Tippling Delay
Speed Losses
Net Operating
Time
Job condition Losses
Pie chart for Performance Appraisal of Tippler

57
Fig 4.3: Performance appraisal of Reversible apron feeder
Fig 4.4: Performance appraisal of Belt conveyor system.
Non Scheduled Time
Scheduled
Maintenance Time
Scheduled Time
based Approach
Breakdown Time Stand by Time Material waiting Time
Set up & Adjustment
Time
Operating Time
Minor Stoppage
Reduced Belt Speed Net Operating Time
Job condition Losses
Pie chart for Performance Appraisal of Belt Conveyor System

58
Fig 4.5: Performance appraisal of Stacker.
Fig 4.6: Performance appraisal of Reclaimer.
Non Scheduled Time
Scheduled
Maintenance
Time
Scheduled Time
based Approach
Breakdown Time
Stand by Time
Material waiting Time
Set up &
Adjustment Time
Operating Time
Minor Stoppage
Reduced Stacking
Speed
Net Operating
Time
Job condition Losses
Pie chart for Performance Appraisal of Stacker

59
4.6 Comparison of World Class OEE to Obtained OEE for
Tippler equipment
Fig 4.7: Comparison of OEE.
As per figure 4.7, it is clearly indicated that the Obtained OEE lies below the
World Class OEE. According to world class OEE norms, the %Availability,
%Performance, %Quality and %OEE are in 90%, 95%, 99.90%, and 85%
respectively. As per the figure, it is observed that 72% Obtained Availability is not
satisfying the World Class Availability is due to equipment breakdowns or failures
and time for idle in terms of operators, materials, etc. Whereas 87% Performance is
less than the required world-class norms for because of minor stoppage in terms of
sensor blocked, misfeeds, jamming, rough running and reduced speed as compared
desired speed. 89% quality losses are taken as filling factor or capacity losses as
compared to world class quality norms. The Obtained OEE is much less than the
benchmarking point of world class OEE as it occurs due to losses in down time,
speed, filling factor.

60
Fig 4.8: Analysis of Breakdown hour of Tippler equipment.
As per the proper analysis of Pie chart 4.1, it is investigated that the potential areas
which lead to the unexpected breakdown of the machine. Figure 4.8 disclosss the
loss of available hours for the breakdown of tippler is due to failure of upper clamp
hood welding, gear box, derailment, hydraulic cylinder, side clamp beam and rake
mounting circle. Among them, the highest breakdown hours occurs in wagon
derailed inside tippler area.
Fig 4.9: Analysis of Idle hour for Tippler equipment.
As per the proper analysis of Pie chart 4.1, it is investigated that the potential areas
which lead to an unexpected idle time of the machine. Figure 4.9 disclosss the loss
of available hours for idle of tippler is due to waiting for an operator, material, set
up & adjust, etc.

61
Fig 4.10: Analysis of Speed loss hour for Tippler equipment.
As per the proper analysis of Pie chart 4.1, it is investigated that the potential areas
which lead to unexpected speed losses of the machine. Figure 4.10 discloses the
loss of tippler speed is due to minor stoppage of equipment which is considered as
less than five minutes for OEE calculation, for example, chute/component
jamming, sensor blocked, misfeed, rough running, reduced equipment speed as
compared to desired speed, cleaning/checking. Among them, the highest speed loss
hours occur in reduced equipment speed as compared to theoretical maximum
speed.
4.7 Comparison of World Class to Obtained OEE for Side Arm
Charger
Fig 4.11: Comparison of OEE.

62
As per figure 4.11, it is clearly indicated that the obtained OEE lies below the
world Class OEE. According to world class OEE norms, the %Availability,
%Performance, %Quality and %OEE are in 90%, 95%, 99.90%, and 85%
respectively. As per the figure, it is observed that 79% Obtained Availability is not
satisfying the World Class Availability is due to equipment breakdowns or failures
and time for idle in terms of operators, materials, etc. Whereas 91% Performance is
less than the required world-class norms for because of minor stoppage in terms of
sensor blocked, misfeeds, jamming, rough running and reduced speed as compared
desired speed. 89% quality losses are taken as filling factor or capacity losses as
compared to world class quality norms. The obtained OEE is much less than the
benchmarking point of world class OEE as it occurs due to losses in down time,
speed, filling factor.
Fig 4.12: Analysis of Breakdown hour of Side Arm Charger equipment.
As per the proper analysis of Pie chart 4.2, it is investigated that the potential areas
which lead to the unexpected breakdown of the machine. Figure 4.12 discloses the
loss of available hours for breakdown of side arm charger is due to failure of the
hydraulic cylinder, gearbox, rail track, hydraulic oil leakage, operator cabin, and
wheel. Among them, the highest breakdown hours occurs in operator cabin
whereas lowest in hydraulic oil leakage.

63
Fig 4.13: Analysis of Idle hour for Side Arm Charger equipment.
As per the proper analysis of Pie chart 4.2, it is investigated that the potential areas
which lead to an unexpected idle time of the machine. Figure 4.13 discloses the
loss of available hours for idle of side arm charger is due to waiting for an
operator, material, set up & adjust, etc.
Fig 4.14: Analysis of Speed loss hour for Side arm charger equipment.
As per the proper analysis of Pie chart 4.2, it is investigated that the potential areas
which lead to unexpected speed losses of the machine. Figure 4.14 discloses the
loss of side arm charger speed is due to minor stoppage of equipment which is
considered as less than five minutes for OEE calculation, for example,
chute/component jamming, sensor blocked, misfeed, rough running, reduced
equipment speed as compared desired speed, cleaning/checking. Among them, the
highest speed loss hours occur in reduced equipment speed as compared to
theoretical maximum speed.

64
4.8 Comparison of World Class to Obtained OEE for Reversible
Apron Feeder
Fig 4.15: Comparison of OEE.
As per figure 4.15, it is clearly indicated that the obtained OEE lies below the
world Class OEE. According to world class OEE norms, the %Availability,
%Performance, %Quality and %OEE are in 90%, 95%, 99.90%, and 85%
respectively. As per the figure, it is observed that 80% Obtained Availability is not
satisfying the World Class Availability is due to equipment breakdowns or failures
and time for idle in terms of operators, materials, etc. Whereas 91% Performance is
less than the required world-class norms for because of minor stoppage in terms of
sensor blocked, misfeeds, jamming, rough running and reduced speed as compared
desired speed. 86% quality losses are taken as filling factor or capacity losses as
compared to world class quality norms. The obtained OEE is much less than the
benchmarking point of world class OEE as it occurs due to losses in down time,
speed, filling factor.
Fig 4.16: Analysis of Breakdown hour of Reversible Apron Feeder equipment.

65
As per the proper analysis of Pie chart 4.3, it is investigated that the potential areas
which lead to the unexpected breakdown of the machine. Figure 4.16 discloses the
loss of available hours for the breakdown of reversible apron feeder is due to
failure gear box, apron plate. Among them, the highest breakdown hours occur in
apron plate whereas lowest in gearbox.
Fig 4.17: Analysis of Idle hour for Reversible Apron Feeder equipment.
As per the proper analysis of Pie chart 4.3, it is investigated that the potential areas
which lead to an unexpected idle time of the machine. Figure 4.17 discloses the
loss of available hours for idle of reversible apron feeder is due to waiting for an
operator, material, set up & adjust, etc.
Fig 4.18: Analysis of Speed loss hour for Reversible Apron Feeder equipment.
As per the proper analysis of Pie chart 4.3, it is investigated that the potential areas
which lead to unexpected speed losses of the machine. Figure 4.18 discloses the
loss of reversible apron feeder speed is due to minor stoppage of equipment which
is considered as less than five minutes for OEE calculation, for example,
chute/component jamming, sensor blocked, misfeed, rough running, reduced
equipment speed as compared desired speed, cleaning/checking. Among them, the
highest speed loss hours occur in reduced equipment speed as compared to
theoretical maximum speed.

66
4.9 Comparison of World Class to Obtained OEE for Belt
Conveyor System
Fig 4.19: Comparison of OEE.
As per figure 4.19, it is clearly indicated that the Obtained OEE lies below the
World Class OEE. According to world class OEE norms, the %Availability,
%Performance, %Quality and %OEE are in 90%, 95%, 99.90%, and 85%
respectively. As per the figure, it is observed that 70% Obtained Availability is not
satisfying the World Class Availability is due to equipment breakdowns or failures
and time for idle in terms of operators, materials, etc. Whereas 86% Performance is
less than the required world-class norms for because of minor stoppage in terms of
sensor blocked, misfeeds, jamming, rough running and reduced speed as compared
desired speed. 84% quality losses are taken as filling factor or capacity losses as
compared to world class quality norms. The Obtained OEE is much less than the
benchmarking point of world class OEE as it occurs due to losses in down time,
speed, filling factor.

67
Fig 4.20: Analysis of Breakdown hour of Belt Conveyor System equipment.
As per the proper analysis of Pie chart 4.4, it is investigated that the potential areas
which lead to the unexpected breakdown of the machine. Figure 4.20 shows the
loss of available hours for the breakdown of belt conveyor system is due to failure
of belt snapping, gear box, belt through cut, pulley bearing, belt structure and
driving system, v-joint opening, turbo coupling, return idler, H/end pulley. Among
them, the highest breakdown hours occur in a driving system where as lowest in
return idler.

68
Fig 4.21: Analysis of Idle hour for Belt Conveyor System equipment.
As per the proper analysis of Pie chart 4.4, it is investigated that the potential areas
which lead to an unexpected idle time of the machine. Figure 4.21 discloses the
loss of available hours for idle of belt conveyor system is due to waiting for an
operator, material, set up & adjust, etc.
Fig 4.22: Analysis of Speed loss hour for Belt Conveyor System equipment.
As per the proper analysis of Pie chart 4.4, it is investigated that the potential areas
which lead to unexpected speed losses of the machine. Figure 4.22 discloses the
loss of belt conveyor speed is due to minor stoppage of equipment which is
considered as less than five minutes for OEE calculation, for example,
chute/component jamming, sensor blocked, misfeed, rough running, reduced
equipment speed as compared desired speed, cleaning/checking. Among them, the
highest speed loss hours occur in reduced equipment speed as compared to
theoretical maximum speed.

69
4.10 Comparison of World Class to Obtained OEE for Stacker
Fig 4.23: Comparison of OEE.
As per figure 4.23, it is clearly indicated that the Obtained OEE lies below the
World Class OEE. According to world class OEE norms, the %Availability,
%Performance, %Quality and %OEE are in 90%, 95%, 99.90%, and 85%
respectively. As per the figure, it is observed that 76% Obtained Availability is not
satisfying the World Class Availability is due to equipment breakdowns or failures
and time for idle in terms of operators, materials, etc. Whereas 87% Performance is
less than the required world class norms for because of minor stoppage in terms of
sensor blocked, misfeeds, jamming, rough running and reduced speed as compared
desired speed. 79% quality losses are taken as filling factor or capacity losses as
compared to world class quality norms. The Obtained OEE is much less than the
benchmarking point of world class OEE as it occurs due to losses in down time,
speed, filling factor.

70
Fig 4.24: Analysis of Breakdown hour of Stacker equipment.
As per the proper analysis of Pie chart 4.5, it is investigated that the potential areas
which lead to the unexpected breakdown of the machine. Figure 4.24 discloses the
loss of available hours for the breakdown of the stacker is due to failure of boom
conveyor, boom conveyor gear box, hydraulic oil leakage, hydraulic cylinder, slew
gear box. Among them, the highest breakdown hours occur in slew gearbox
whereas lowest in oil leakage in the hydraulic cylinder.
Fig 4.25: Analysis of Idle hour for Stacker equipment.
As per the proper analysis of Pie chart 4.5, it is investigated that the potential areas
which lead to an unexpected idle time of the machine. Figure 4.25 discloses the
loss of available hours for idle of the stacker is due to waiting for operators,
material, set up & adjust, etc.

71
Fig 4.26: Analysis of Speed loss hour for Stacker equipment.
As per the proper analysis of Pie chart 4.5, it is investigated that the potential areas
which lead to unexpected speed losses of the machine. Figure 4.26 discloses that
the loss of stacker is due to minor stoppage of equipment which is considered as
less than five minutes for OEE calculation, for example, chute/component
jamming, sensor blocked, misfeed, rough running, reduced equipment speed as
compared desired speed, cleaning/checking. Among them, the highest speed loss
hours occur in reduced equipment speed as compared to theoretical maximum
speed.
4.11 Comparison of World Class to Obtained OEE for Reclaimer
Fig 4.27: Comparison of OEE.

72
As per figure 4.27, it is clearly indicated that the Obtained OEE lies below the
World Class OEE. According to world class OEE norms, the %Availability,
%Performance, %Quality and %OEE are in 90%, 95%, 99.90%, and 85%
respectively. As per the figure, it is observed that 80% Obtained Availability is not
satisfying the World Class Availability is due to equipment breakdowns or failures
and time for idle in terms of operators, materials, etc. Whereas 91% Performance is
less than the required world-class norms for because of minor stoppage in terms of
sensor blocked, misfeeds, jamming, rough running and reduced speed as compared
desired speed. 78% quality losses are taken as filling factor or capacity losses as
compared to world class quality norms. The Obtained OEE is much less than the
benchmarking point of world class OEE as it occurs due to losses in down time,
speed, filling factor.
Fig 4.28: Analysis of Breakdown hour of Reclaimer equipment.
As per the proper analysis of Pie chart 4.6, it is investigated that the potential areas
which lead to the unexpected breakdown of the machine. Figure 4.28 discloses the
loss of available hours for the breakdown of reclaimer is due to failure of boom
conveyor, boom conveyor gear box, hydraulic oil leakage, hydraulic cylinder, slew
gear box. Among them, the highest breakdown hours occurs in boom bent whereas
lowest in cable failure.

73
Fig 4.29: Analysis of Idle hour for Reclaimer equipment.
As per the proper analysis of Pie chart 4.6, it is investigated that the potential areas
which lead to an unexpected idle time of the machine. Figure 4.29 discloses the
loss of available hours for idle of reclaimer is due to waiting for operators,
material, set up & adjust, etc.
Fig 4.30: Analysis of Speed loss hour for Reclaimer equipment.
As per the proper analysis of Pie chart 4.6, it is investigated that the potential areas
which lead to unexpected speed losses of the machine. Figure 4.30 discloses the
loss of reclaimer is due to minor stoppage of equipment which is considered as less
than five minutes for OEE calculation, for example, chute/component jamming,
sensor blocked, misfeed, rough running, reduced equipment speed as compared
desired speed, cleaning/checking. Among them, the highest speed loss hours occur
in reduced equipment speed as compared to theoretical maximum speed.

74
4.12 Comparison of parameters with their calculations of different
equipment in Coal Handling Plant for OEE obtained &
world class.
Table 4.15: Comparison of a parameter of coal handling equipment.
Calculation
Parameter
Tippler SAC RAF BCS Stacker Reclaimer Avg.
Obtained
World
class
Availability 72% 79% 80% 70% 76% 80% 76% 90%
Performance 87% 91% 91% 86% 87% 91% 89% 95%
Quality 89% 89% 86% 84% 79% 78% 84% 99.9%
OEE 54% 64% 61% 51% 52% 56% 57% 85%
The above table shows the different equipment are Tippler, SAC- Side arm
charger, RAF- Reversible apron feeder, BCS- Belt conveyor system, Stacker,
Reclaimer with its availability in 72%, 79%, 80%, 70%, 76%, 80% respectively.
The average availability is 76% which is less than world class availability where as
89% average performance obtained which is also less than required norms and 84%
for Quality lies below the world class quality.
The OEE obtained for the above equipment in systematic order in 54%, 64%, 61%,
51%, 52%, 56% respectively. The average obtained OEE 57% in coal handling
plant is much less than the world-class norms.
Therefore, it is necessary for the improvement of coal handling plant that some
suitable methodology as an outcome of OEE be adopted for output maximization
and labour cost decrease.
4.13 Summery
This chapter broadly divided into three parts. The first part fully describes the
theory of OEE and Six big losses with event examples. The second part calculates
OEE with their time losses of coal handling equipment. The third part provides the
comparison chart of World class to Obtained OEE. The purpose of this chapter is to
provide a brief idea about time loss classifications for performance measurement of
equipment by OEE. The calculation of OEE is presented through table considering

75
the operational losses in coal handling equipment viz. Tippler, Side arm charger,
Reversible apron feeder, Belt conveyor, Stacker, Reclaimer. This chapter also
presents the performance report of coal handling equipment through pie chart and
analyzes briefly about their data for production losses. This chapter also compares
the World class OEE to Obtained OEE and their parameters with calculations of
different equipment in coal handling plant.

76
Chapter 5
5 SUGGESTION, RESULT & DISCUSSION
5.1 Overview
In the last few decades, industries were forced to shift their business models from
closed system-orientations to more open system-orientations. This shift was
brought about by drastic competitive forces, which made the customer the focus of
the organizational, operational & strategic practices. Today’s industries are
required to operate as operational systems with the increasing complexity, scope
and organizational role of operationally advanced industry technologies the
maintenance of these technologies is becoming very critical to the ability of the
organization to complete.
Every company wants to achieve high targets and long term profits. Organisations
with successful quality improvement program can enjoy significant competitive
advantages. In coal handling industries, availability of equipment is the vital role
for production gain. More and more techniques are developed for inspection of
plant equipment. Increasing automation and mechanization production processes
are shifting from workers to machine dependent. Consequently, the plant
production depends on the operational maintenance in controlling quantity, quality
and cost is more evident and important than ever. To succeed in this new
environment, equipment must be maintained in ideal operating conditions & must
run effectively. The inspections of equipment in right method results in operational
gain and promote productivity. The thought behind the implementation of this
methodology in coal handling companies is to get everyone more involved and all
companies answered that they are succeeded with that. The implementation has
also gained a positive process progress in both economical and quality aspect, and

77
also work environment has been better as improvements from the employees and
the new layout of the factories have been implemented.
5.2 Methodology for determining the status of Tippler:
Parameters, aspects, and technology.
Table 5.1: Methodology for determining the status of Tippler.
Parameter Component Sensor/Technology
Vibration Motor
Gear Box
Vibration analyzer
Instrument
Power Motor Watt meter
Torque Sensor
Speed Motor
Tippler Rotating Drive/
Brake system component
Optical/ Magnetic encoder
Magnetic RPM picks up
sensor
Temperature Motor
Material
Hydraulic Oil
Thermocouple
Infrared temperature
sensor
Pressure Hydraulic Oil Pressure gauge
Shock Gear Box
Coupling
(Revolving element like
ball & roller bearing)
Shock pulse meter
Minor Crack All accessories in Tippler Ultrasonic flaw detector
Foundation
Columns
All accessories in Tippler Mechanical or electrical
strain gauge
Hotspot Bearing
Other parts of machinery
Infra-red thermometer
Remote sensing
Thickness of paint,
coating
Hood
Channel
Ultrasonic/ Eddy Current
thickness meter
Corrosion Tippler equipment like
hood, beam, structure
etc...
Corrosion meter
Leakage
Oil at high pressure
Ultrasonic Leak Detector

78
5.2.1 Result & Discussion of Tippler
After implementing this methodology in coal handling plant of tippler section, it is
found that the overall equipment effectiveness is maximized by 10% (Refer Fig.
5.1). This methodology helps to increase their availability, quality and performance
of coal handling plant by controlling the losses that affected the production and the
number of breakdown hours (Refer Fig. 5.2) was also minimized as a result, in
turn, decrease of throughput time. On the basis of proper study and analysis of the
OEE before and after implementation, it has been shown that a remarkable growth,
which is an indication of an increase in equipment availability, performance, and
quality.
Fig 5.1: Comparison of OEE its factor Before & After Improvement.
Fig 5.2: Comparison of Breakdown Hours Before & After Improvement.

79
5.3 Methodology for determining the status of Side Arm
Charger: Parameters, aspects, and technology
Table 5.2: Methodology for determining the status of Side arm charger.
Parameter Component Sensor/Technology
Vibration Hydraulic Motor
Vibration analyzer
Instrument
Power Hydraulic Motor
Watt meter
Torque Sensor
Speed Hydraulic Motor/ SAC
Drive
Optical/ Magnetic encoder
Magnetic RPM pickup
sensor
Temperature Hydraulic Motor
Material
Hydraulic Oil
Thermocouple
Infrared temperature
sensor
Pressure Hydraulic Oil Pressure switch (sensor)
Shock Gear Box
Coupling
(Revolving element like
ball & roller bearing)
Shock pulse meter
Minor Crack All accessories in SAC Ultrasonic flaw detector
Foundation Side arm charger Mechanical or electrical
strain gauge
Hotspot Bearing
Other parts of machinery
Infra-red thermometer
Remote sensing
Corrosion SAC equipment like arm,
coupler, structure etc...
Corrosion meter
Leakage
Hyd. Oil at high pressure
Ultrasonic Leak Detector
Position Side Arm Charger Proximity switch
Over travel Side Arm Charger End limit switch

80
5.3.1 Result & Discussion of Side Arm Charger
After implementing this methodology in coal handling plant of side arm charger, it
is found that the overall equipment effectiveness is maximized by 4% (Refer Fig.
5.3). This methodology helps to increase their availability, quality and performance
of coal handling plant by controlling the losses that affected the production and the
number of breakdown hours (Refer Fig. 5.4) was also minimized as a result, in
turn, decrease of throughput time. On the basis of proper study and analysis of the
OEE before and after implementation, it has been shown that a remarkable growth,
which is an indication of an increase in equipment availability, performance, and
quality.
Fig 5.3: Comparison of OEE its factor Before & After Improvement.
Fig 5.4: Comparison of Breakdown Hours Before & After Improvement.
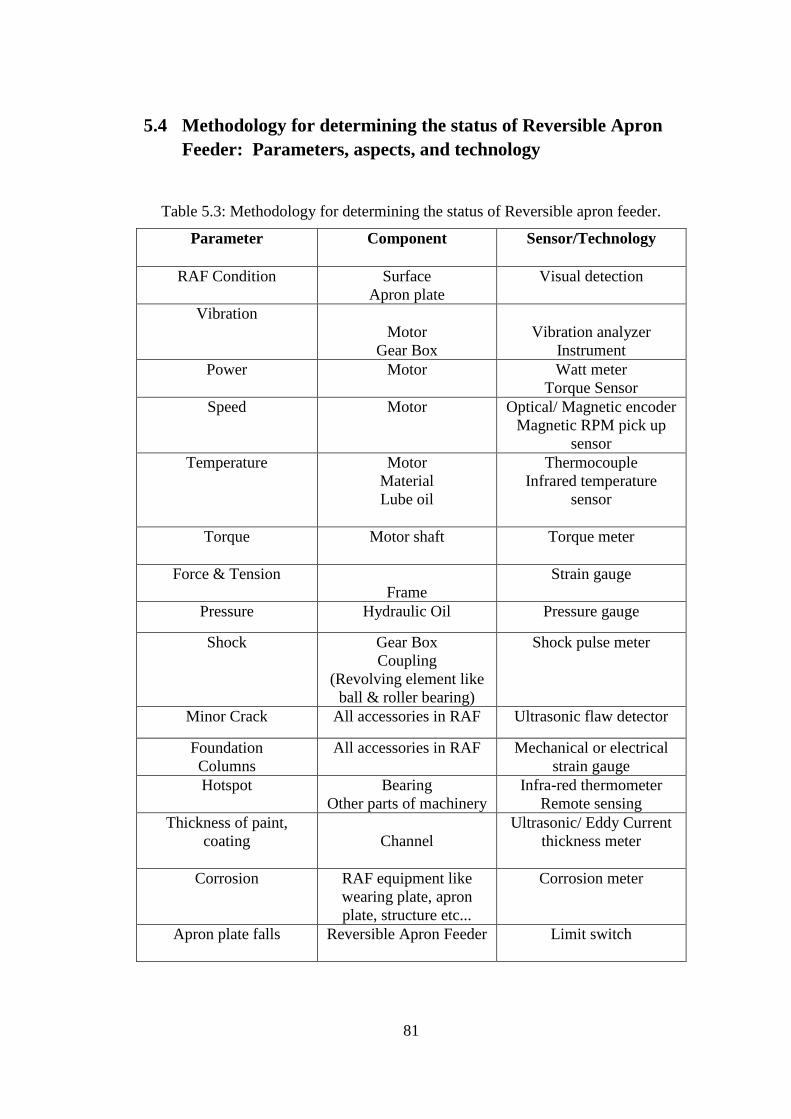
81
5.4 Methodology for determining the status of Reversible Apron
Feeder: Parameters, aspects, and technology
Table 5.3: Methodology for determining the status of Reversible apron feeder.
Parameter Component Sensor/Technology
RAF Condition Surface
Apron plate
Visual detection
Vibration
Motor
Gear Box
Vibration analyzer
Instrument
Power Motor Watt meter
Torque Sensor
Speed Motor
Optical/ Magnetic encoder
Magnetic RPM pick up
sensor
Temperature Motor
Material
Lube oil
Thermocouple
Infrared temperature
sensor
Torque Motor shaft
Torque meter
Force & Tension
Frame
Strain gauge
Pressure Hydraulic Oil Pressure gauge
Shock Gear Box
Coupling
(Revolving element like
ball & roller bearing)
Shock pulse meter
Minor Crack All accessories in RAF Ultrasonic flaw detector
Foundation
Columns
All accessories in RAF Mechanical or electrical
strain gauge
Hotspot Bearing
Other parts of machinery
Infra-red thermometer
Remote sensing
Thickness of paint,
coating
Channel
Ultrasonic/ Eddy Current
thickness meter
Corrosion RAF equipment like
wearing plate, apron
plate, structure etc...
Corrosion meter
Apron plate falls Reversible Apron Feeder Limit switch

82
5.4.1 Result & Discussion of Reversible Apron Feeder
After implementing this methodology in coal handling plant of reversible apron
feeder equipment, it is found that the overall equipment effectiveness is maximized
by 7% (Refer Fig. 5.5). This methodology helps to increase their availability,
quality and performance of coal handling plant by controlling the losses that
affected the production and the number of breakdown hours (Refer Fig. 5.6) was
also minimized as a result, in turn, decrease of throughput time. On the basis of
proper study and analysis of the OEE before and after implementation, it has been
shown that a remarkable growth, which is an indication of an increase in equipment
availability, performance, and quality.
Fig 5.5: Comparison of OEE its factor Before & After Improvement.
Fig 5.6: Comparison of Breakdown Hours Before & After Improvement.

83
5.5 Methodology for determining the status of Belt conveyor
system: Parameters, aspects, and technology.
Table 5.4: Methodology for determining the status of Belt conveyor system.
Parameter Component Sensor/Technology
Belt Condition Surface
Steel cables
Visual detection
Conductive detection
Vibration Pulley
Idler roller
Motor
Gear Box
Acoustic vibration sensor
Accelerometer
Vibration analyzer
Instrument
Power Motor Watt meter
Torque Sensor
Speed Motor
Brake disk
Belt
Optical/ Magnetic encoder
Magnetic RPM picks up
sensor
Temperature Ambient
Material
Brake disk
Belt cover
Pulley shaft
Motor
Thermocouple
Infrared temperature sensor
Torque Motor shaft
Brake shaft
Pulley shaft
Torque meter
Position Belt misalignment
Take-up displacement
Alignment switch
Optical encoder
Shock Gear Box
Coupling
(Revolving element like
ball & roller bearing)
Shock pulse meter
Minor Crack All accessories in BCS Ultrasonic flaw detector
Foundation
Columns
All accessories in BCS Mechanical or electrical
strain gauge
Hotspot Bearing
Other parts of machinery
Infra-red thermometer
Remote sensing
Thickness of paint, coating Structure
Channel
Belt conveyor
Ultrasonic/ Eddy Current
thickness meter
Corrosion BCS equipment like
structure, idler stand,
channel etc...
Corrosion meter

84
5.5.1 Result & Discussion of Belt Conveyor System
After implementing this methodology in coal handling plant of belt conveyor
system, it is found that the overall equipment effectiveness is maximized by 10%
(Refer Fig. 5.7). This methodology helps to increase their availability, quality and
performance of coal handling plant by controlling the losses that affected the
production and the number of breakdown hours (Refer Fig. 5.8) was also
minimized as a result, in turn, decrease of throughput time. On the basis of proper
study and analysis of the OEE before and after implementation, it has been shown
that a remarkable growth, which is an indication of an increase in equipment
availability, performance, and quality.
Fig 5.7: Comparison of OEE its factor Before & After Improvement.
Fig 5.8: Comparison of Breakdown Hours Before & After Improvement.

85
5.6 Methodology for determining the status of Stacker:
Parameters, aspects, and technology.
Table 5.5: Methodology for determining the status of Stacker.
Parameter Component Sensor/Technology
Vibration Pulley
Motor
Gear Box
Acoustic vibration sensor
Accelerometer
Vibration analyzer
Instrument
Power Motor Watt meter
Torque Sensor
Speed Motor
Boom conveyor
Main travel gearbox
Optical/ Magnetic encoder
Magnetic RPM pick up
sensor
Temperature
Material
Gear Box
Boom conveyor cover
Pulley shaft
Motor
Hydraulic oil
Thermocouple
Infrared temperature
sensor
Torque Motor shaft
Brake shaft
Pulley shaft
Torque meter
Force & Tension Pulley
Boom conveyor
Frame
Strain gauge
Position Belt misalignment
Take-up displacement
Alignment switch
Optical encoder
Pressure Hydraulic oil
Lubrication oil
Pressure gauge
Shock Gear Box
Coupling
(Revolving element like
ball & roller bearing)
Shock pulse meter
Minor Crack All accessories in Stacker Ultrasonic flaw detector
Hotspot Bearing
Other parts of machinery
Infra-red thermometer
Remote sensing
Thickness of paint,
coating
Structure and its
component
Ultrasonic/ Eddy Current
thickness meter
Corrosion Stacker equipment like,
beam, structure etc.
Corrosion meter
Leakage
Oil at high pressure
Ultrasonic Leak Detector

86
5.6.1 Result & Discussion of Stacker
After implementing this methodology in coal handling plant of stacker section, it is
found that the overall equipment effectiveness is maximized by 10% (Refer Fig.
5.9). This methodology helps to increase their availability, quality and performance
of coal handling plant by controlling the losses that affected the production and the
number of breakdown hours (Refer Fig. 5.10) was also minimized as a result in
turn decrease of throughput time. On the basis of proper study and analysis of the
OEE before and after implementation, it has been shown that a remarkable growth,
which is an indication of an increase in equipment availability, performance, and
quality.
Fig 5.9: Comparison of OEE its factor Before & After Improvement.
Fig 5.10: Comparison of Breakdown Hours Before & After Improvement.

87
5.7 Methodology for determining the status of Reclaimer:
Parameters, aspects, and technology.
Table 5.6: Methodology for determining the status of Reclaimer.
Parameter Component Sensor/Technology
Vibration
Motor
Gear Box
Acoustic vibration sensor
Accelerometer
Vibration analyzer
Instrument
Power Motor Watt meter
Torque Sensor
Speed Motor
Main travel gearbox
Optical/ Magnetic encoder
Magnetic RPM picks up
sensor
Temperature
Material
Gear Box
Motor
Hydraulic oil
Thermocouple
Infrared temperature
sensor
Torque Motor shaft
Brake shaft
Torque meter
Force & Tension
Chain the main beam
Strain gauge
Pressure Hydraulic oil
Lubrication oil
Pressure gauge
Shock Gear Box
Coupling
(Revolving element like
ball & roller bearing)
Shock pulse meter
Minor Crack All accessories in
Reclaimer
Ultrasonic flaw detector
Hotspot Bearing
Other parts of machinery
Infra-red thermometer
Remote sensing
Thickness of paint,
coating
Structure and its
component
Ultrasonic/ Eddy Current
thickness meter
Corrosion Reclaimer equipment
like, chain main beam,
structure etc...
Corrosion meter
Leakage
Oil at high pressure
Ultrasonic Leak Detector

88
5.7.1 Result & Discussion of Reclaimer
After implementing this methodology in coal handling plant of reclaimer section, it
is found that the overall equipment effectiveness is maximized by 8% (Refer Fig.
5.11). This methodology helps to increase their availability, quality and
performance of coal handling plant by controlling the losses that affected the
production and the number of breakdown hours (Refer Fig. 5.12) was also
minimized as a result, in turn, decrease of throughput time. On the basis of proper
study and analysis of the OEE before and after implementation, it has been shown
that a remarkable growth, which is an indication of an increase in equipment
availability, performance, and quality.
Fig 5.11: Comparison of OEE its factor Before & After Improvement.
Fig 5.12: Comparison of Breakdown Hours Before & After Improvement.

89
5.8 Summary
This chapter equally divides into two parts. The first part presents the suggestion of
appropriate methodology through tables for determining the status of coal handling
equipment viz. Tippler, Side arm charger, Reversible apron feeder, Belt conveyor
system, Stacker, Reclaimer. The second part emphasizes the result and discussion
of above coal handling equipment through figures and it is found that the overall
equipment effectiveness is maximized after implementation of this methodology
which is helped to increase their availability, quality and performance of coal
handling plant by controlling the losses that affected the production and the number
of breakdown hours are also minimised.

90
Chapter 6
6 CASE STUDY APPLICATION
6.1 Overview
In the coal handling industries, it is observed that sudden breakdown of any
equipment may stop the entire system, resulting in drastic production loss and
enhancing the cost of production. In this chapter, the probabilities of a sudden
breakdown of each equipment are individually analyzed from their previous
performance where the frequency of occurrences, duration, and time interval of
each breakdown has given additional stress and non-availability of that equipment.
Computerized best fit matching is found out for preventive maintenance of these
equipment by developing different sub-routines and simulation models.
6.2 Simulation Models
To minimize breakdown period it was badly needed to analyze them
statistically by the simulation model, viz.
(i) Generation of uniformly distributed random numbers,
(ii) Generation of normally distributed random numbers,
(iii) System simulation on event to event types analysis,
(iv) Identification of event by statistical distribution,
(v) Preparing sub-routine skewing of uniformly distributed random
numbers to a histogram.
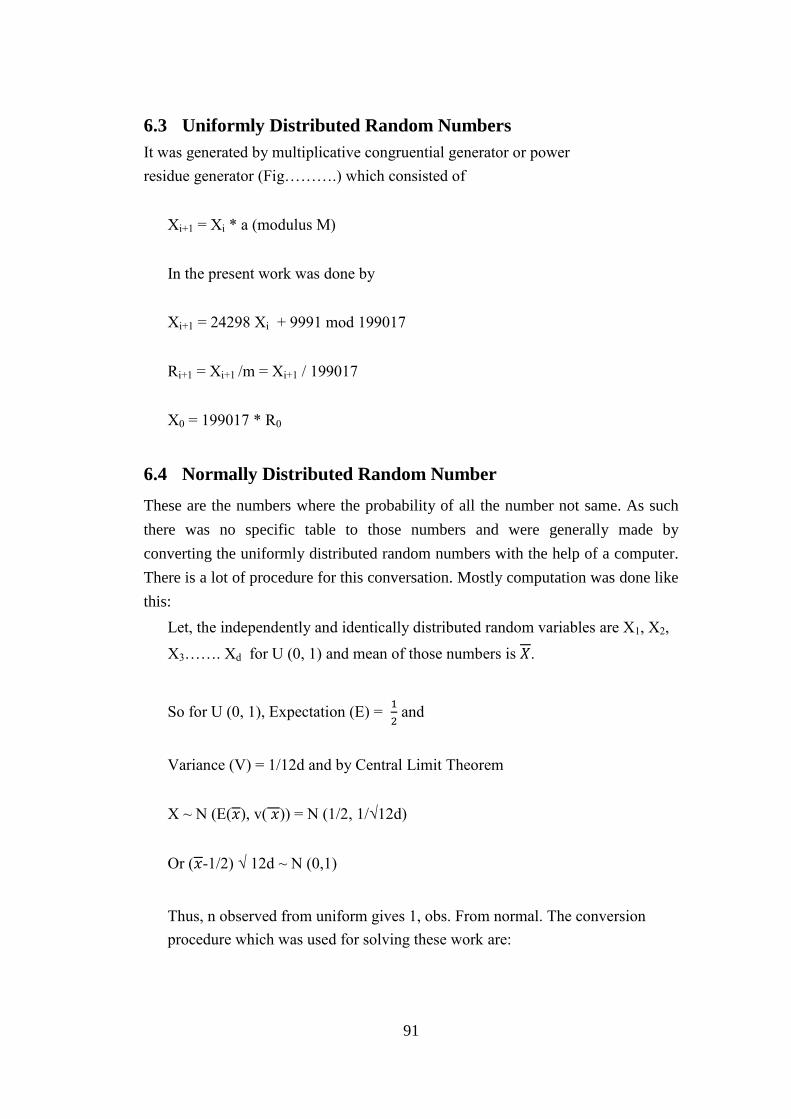
91
6.3 Uniformly Distributed Random Numbers
It was generated by multiplicative congruential generator or power
residue generator (Fig……….) which consisted of
Xi+1 = Xi * a (modulus M)
In the present work was done by
Xi+1 = 24298 Xi + 9991 mod 199017
Ri+1 = Xi+1 /m = Xi+1 / 199017
X0 = 199017 * R0
6.4 Normally Distributed Random Number
These are the numbers where the probability of all the number not same. As such
there was no specific table to those numbers and were generally made by
converting the uniformly distributed random numbers with the help of a computer.
There is a lot of procedure for this conversation. Mostly computation was done like
this:
Let, the independently and identically distributed random variables are X1, X2,
X3……. Xd for U (0, 1) and mean of those numbers is 𝑋.
So for U (0, 1), Expectation (E) = 1
2 and
Variance (V) = 1/12d and by Central Limit Theorem
X ~ N (E(𝑥), v( 𝑥)) = N (1/2, 1/√12d)
Or (𝑥-1/2) √ 12d ~ N (0,1)
Thus, n observed from uniform gives 1, obs. From normal. The conversion
procedure which was used for solving these work are:

92
If R4 was a normally distributed random number (RN) with mean (µ) =
0 and standard deviation (σ) = 1 then the conversation was done [Fig.
6.1] by RN = R4.σ + µ
where R4 = [-2.In.R2]1/2
* cos [2π R3]
6.5 System Simulation on Event to- Event Analysis
Different subroutines for different events were prepared in this simulation
model and the sub-routines were design based on the frequency distribution of
different breakdown which occurred in the coal handling system. The duration
of each breakdown was analyzed. From the cumulative frequency distribution,
the random numbers were generated from random number distribution table.
These randomizing cases were stochastically distributed because the
breakdown of different equipment could not follow a particular path. So, by
generating the uniformly distributed random numbers and then converting them
to a normally distributed one, it was possible to identify which event could
come first and so on. Though cases may arose also a particular event occurred
twice at a time. As a result, event analyzes were needed for this present
simulation [Table 6.1-6.20].
6.6 Event Identification
This means to determine event which would come first, second and so on. In
the present work 6 events were considered demarcating by 1, 2, 3…. 6 when
the breakdown of any equipment took place in the coal handling system and
rectifying this breakdown another one went out-of-order. By statistical
distribution, it was identified the sequential occurrence of different events, i.e
which event will occur first and so on. A clock schedule of the activity was
maintained and a stimulatory list was prepared from the distribution function. If
more than one event was scheduled to be executed, the tie-breaking rules
specified by the SELECT function was determined to identify the event
actually executed. For the identification of this events, a special; event sub-
routines was prepared which followed the different event sub-routine and the
frequency distribution helps to prepare this identification.

93
6.7 Sub Routine Skewing of Uniformly Distributed Random
Number
Coal handling equipment data were analyzed and from the data histogram were
prepared [Table 6.1- 6.20]. It was seen that for 6 different events breakdown in
the plant production was hampered. These breakdown events were not
uniformly distributed, their frequency distributions were also different. Once
the first event was broken down, did not mean that in the ninth term it could be
broken down. These irregularities were following the normal distribution
curves and their histograms were not showing smooth curves. The mean of the
frequency curves was right to the mode and just reverse was also not
impossible. These 6 events subroutine skewing of was replaced to the
uniformly distributed random numbers to the histogram, the solution of the
problem was much easier than the problems which were dealt in this thesis.
6.8 Performance Appraisal of Coal Handling Machineries
The 6 events which were identified from the coal handling data analyzed were:
Event 1: Breakdown of Tippler
Event 2: Breakdown of Side Arm Charger
Event 3: Breakdown of Reversible Apron Feeder
Event 4: Breakdown of Belt Conveyor System
Event 5: Breakdown of Stacker
Event 6: Breakdown of Reclaimer
The breakdown data of all the 6 events were analyzed for a period of one year.
6.9 Specific Example for Data Analysis
The list of following tables shows the break-down data analysis of different types
of machinery.

94
Table 6.1 : Frequency and period of existancy of the breakdown of tippler
equipment for the year of 1st April 2013 to 31st March 2014.
Sl
no.
Types of
breakdown
Period of b/d Duration(hrs) Frequency Total
b/d
(hrs)
1 Empty side
winch rope
snapped
10.4.13
(9am-16.15pm)
16.12.13
(9.30am-13pm)
7.15 & 3.30 2 10.45
2 Upper clamp
hood beam
came out
3.4.13
(1.00am-16.30pm)
15.3
1 15.3
3 Cylinder oil
leakage
21.5.13
(5.00am-10.45am)
1.5.13
(9am-16pm)
5.45 & 7.00 2 12.45
4 Rake mounting
circle was
broken
1.5.13
(4.15am-18pm)
61.75 1 61.75
5 Upper clamp
channel broken
9.6.13
(1.00am-21.30pm)
20.3 1 20.3
6 Empty side
track damaged
8.10.13
(16.00pm-6.00am)
14 1 14
7 Upper clam
hood welding
detached
3.10.13
(10.45am-16pm)
5.15 1 5.15
8 Side clamp arm
broken
9.12.13
(7.05am-12.45pm)
5.4 1 5.4
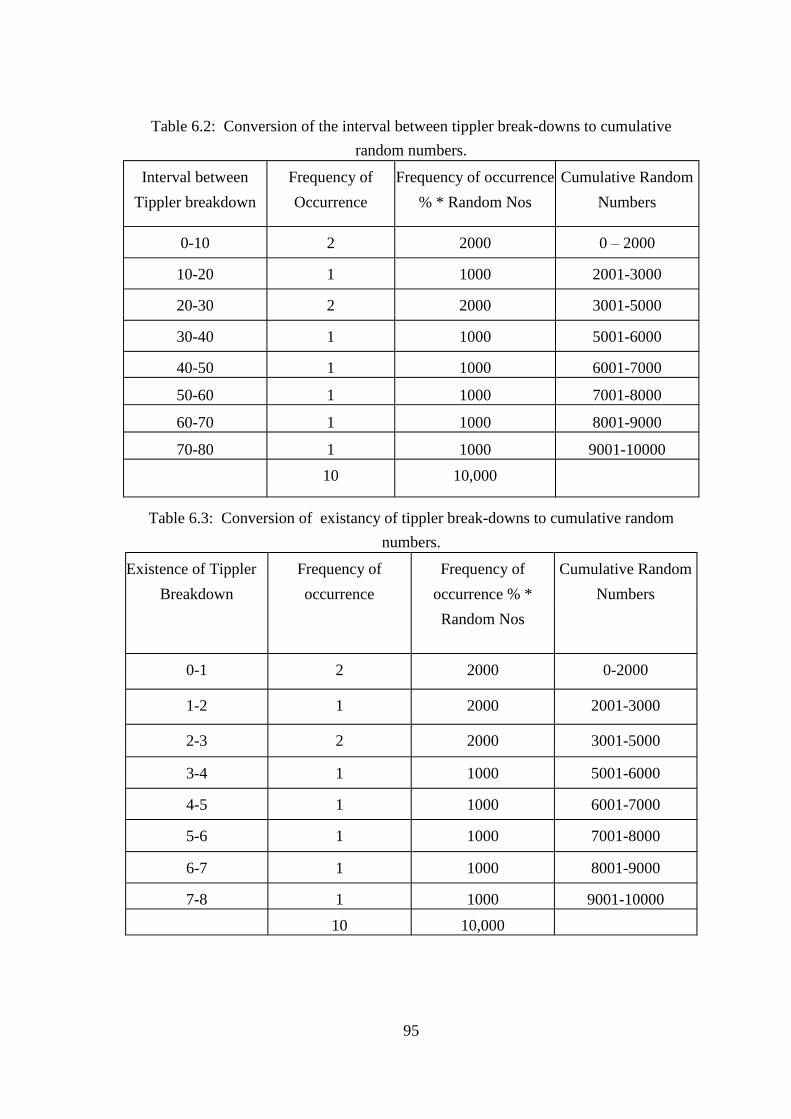
95
Table 6.2: Conversion of the interval between tippler break-downs to cumulative
random numbers.
Interval between Frequency of Frequency of occurrence Cumulative Random
Tippler breakdown Occurrence % * Random Nos Numbers
0-10 2 2000 0 – 2000
10-20 1 1000 2001-3000
20-30 2 2000 3001-5000
30-40 1 1000 5001-6000
40-50 1 1000 6001-7000
50-60 1 1000 7001-8000
60-70 1 1000 8001-9000
70-80 1 1000 9001-10000
10 10,000
Table 6.3: Conversion of existancy of tippler break-downs to cumulative random
numbers.
Existence of Tippler Frequency of Frequency of Cumulative Random
Breakdown occurrence occurrence % * Numbers
Random Nos
0-1 2 2000 0-2000
1-2 1 2000 2001-3000
2-3 2 2000 3001-5000
3-4 1 1000 5001-6000
4-5 1 1000 6001-7000
5-6 1 1000 7001-8000
6-7 1 1000 8001-9000
7-8 1 1000 9001-10000
10 10,000

96
Table6.4: Frequency and period of existancy of the breakdown of side arm charger
equipment for the year of 1st April 2013 to 31st March 2014.
Table 6.5: Conversion of the interval between side arm charger break-downs to
cumulative random numbers.
Interval between Frequency of
Frequency of
occurrence Cumulative Random
SAC Breakdown Occurrence % * Random Nos Numbers
0-10 1 1000 0 – 1000
10-20 1 1000 1001-2000
20-30 2 2000 2001-4000
30-40 1 1000 4001-5000
40-50 1 1000 5001-6000
50-60 1 1000 6001-7000
60-70 1 1000 7001-8000
8 8000
Sl
no.
Types of
breakdown
Period of
breakdown
Duration
(hrs)
Frequency Total
b/d
(hrs)
1 Side arm coupler
broken
8.4.13
(1.30am-21pm)
19.3 1 19.3
2 Hydraulic oil
leakage
25.5.13(9-21.45) 3.45 1 3.45
3 Pinion position
shifted
27.6.13
(5.10-9am)/
15.6.13
(8am-12.23pm)
3.50 & 4.23 2 8.13
4 Coupler cylinder
piston broken
1.5.13
(4.15am-18pm)
4 1 4
5 Coupler limit
switch rod
broken
8.11.13
(17.20pm-19.45pm)
2.25 1 2.25
6 Rack bolt loss &
broken
3.12-4.12.13
(22pm-1.55am)
3.55 1 3.55
7 Sac guide wheel
fallen
26.10.13
(6.36am-16pm)
9.24 1 9.24

97
Table 6.6: Conversion of existancy of side arm charger break-downs to
cumulative random numbers.
Existence of SAC Frequency of Frequency of Cumulative Random
Breakdown Occurrence occurrence % * Numbers
Random Nos
0-1 1 1000 0-1000
1-2 1 2000 1001-2000
2-3 2 2000 2001-4000
3-4 1 1000 4001-5000
4-5 1 1000 5001-6000
5-6 1 1000 6001-7000
6-7 1 1000 7001-8000
8 8000
Table 6.7 :Frequency and period of existancy of the breakdown of reversible apron
feeder equipment for the year of 1st April 2013 to 31
st March 2014.
Table 6.8: Conversion of the interval between reversible apron feeder break-downs
to cumulative random numbers.
Interval between Frequency of
Frequency of
occurrence Cumulative Random
RAF Breakdown Occurrence % * Random Nos Numbers
0-10 2 2000 0 – 2000
10-20 1 1000 2001-3000
20-30 1 1000 3001-4000
4 4000
Sl.
No.
Types of
breakdown
Period of
breakdown
Duration(hrs) Frequency Total b/d
hrs
1 Wearing plate
damaged
13.8.13
(11.30am-16.10pm)
18.9.13 (1pm-5pm)
4.40 & 4.00 2 8.40
2 G/B damaged 21.12.13(7am-
15pm)
5.20 1 5.20
3 Apron plate
damaged
16.2.14(16pm-
23pm)
4 1 4
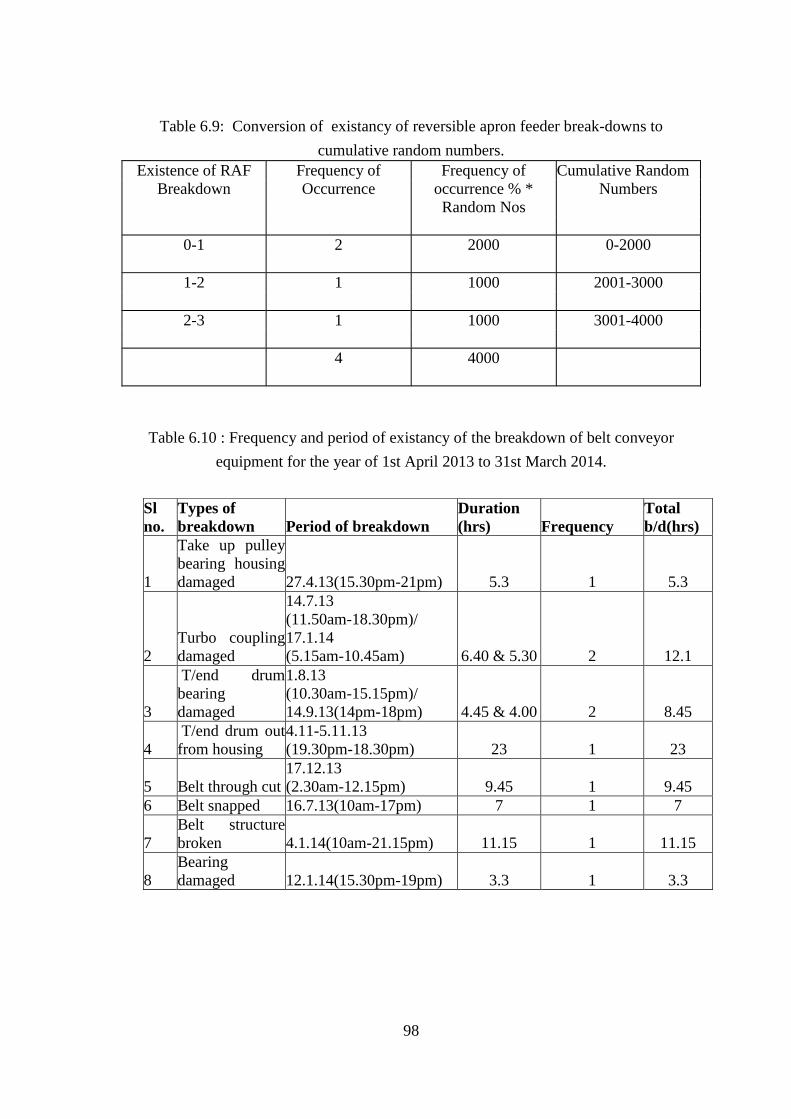
98
Table 6.9: Conversion of existancy of reversible apron feeder break-downs to
cumulative random numbers.
Existence of RAF Frequency of Frequency of Cumulative Random
Breakdown Occurrence occurrence % * Numbers
Random Nos
0-1 2 2000 0-2000
1-2 1 1000 2001-3000
2-3 1 1000 3001-4000
4 4000
Table 6.10 : Frequency and period of existancy of the breakdown of belt conveyor
equipment for the year of 1st April 2013 to 31st March 2014.
Sl
no.
Types of
breakdown Period of breakdown
Duration
(hrs) Frequency
Total
b/d(hrs)
1
Take up pulley
bearing housing
damaged 27.4.13(15.30pm-21pm) 5.3 1 5.3
2
Turbo coupling
damaged
14.7.13
(11.50am-18.30pm)/
17.1.14
(5.15am-10.45am) 6.40 & 5.30 2 12.1
3
T/end drum
bearing
damaged
1.8.13
(10.30am-15.15pm)/
14.9.13(14pm-18pm) 4.45 & 4.00 2 8.45
4
T/end drum out
from housing
4.11-5.11.13
(19.30pm-18.30pm) 23 1 23
5 Belt through cut
17.12.13
(2.30am-12.15pm) 9.45 1 9.45
6 Belt snapped 16.7.13(10am-17pm) 7 1 7
7
Belt structure
broken 4.1.14(10am-21.15pm) 11.15 1 11.15
8
Bearing
damaged 12.1.14(15.30pm-19pm) 3.3 1 3.3

99
Table 6.11: Conversion of the interval between belt conveyor system break-downs
to cumulative random numbers.
Interval between Frequency of Frequency of occurrence Cumulative Random
BCS breakdown occurrence % * Random Nos Numbers
0-10 1 1000 0 – 1000
10-20 2 2000 1001-3000
20-30 2 2000 3001-5000
30-40 1 1000 5001-6000
40-50 1 1000 6001-7000
50-60 1 1000 7001-8000
60-70 1 1000 8001-9000
70-80 1 1000 9001-10000
10 10,000
Table 6.12: Conversion of existancy of belt conveyor system break-downs to
cumulative random numbers.
Existence of BCS Frequency of Frequency of Cumulative Random
Breakdown Occurrence occurrence % * Numbers
Random Nos
0-1 1 1000 0-2000
1-2 2 2000 1001-3000
2-3 2 2000 3001-5000
3-4 1 1000 5001-6000
4-5 1 1000 6001-7000
5-6 1 1000 7001-8000
6-7 1 1000 8001-9000
7-8 11 1000 9001-10000
10 10,000

100
Table 6.13 : Frequency and period of existancy of the breakdown of stacker
equipment for the year of 1st April 2013 to 31st March 2014.
Table 6.14: Conversion of the interval between stacker break-downs to
cumulative random numbers.
Sl.
No
Types of
breakdown
Period of b/d Duration(hrs) Frequency Total
b/d(hrs)
1 Slew gear box
damaged
22.5.13(9am-
18pm)
9
1
9
2 Slew gear pinion
damaged
27.7.13(10.30am-
12.30pm) 2
1
2
3 Failure of boom
luffing system
5.9.13-
6.9.13(3am-4am) 25
1 25
4 Main travel g/b
damaged
11.11.13(15pm-
11am) 20
1 20
5 Boom conveyor
snapping
2.2.14(10am-
22pm) 12
1 12
Interval between Frequency of Frequency of occurrence Cumulative Random
stacker breakdown occurrence % * Random Nos Numbers
0-10 1 1000 0 – 1000
10-20 1 1000 1001-2000
20-30 1 1000 2001-3000
40-50 1 1000 3001-4000
50-60 1 1000 4000-5000
5 5000

101
Table 6.15: Conversion of existancy of stacker break-downs to cumulative
random numbers.
Table 6.16 : Frequency and period of existancy of the breakdown of reclaimer
equipment for the year of 1st April 2013 to 31st March 2014.
Existence of stacker Frequency of Frequency of Cumulative Random
Breakdown Occurrence occurrence % * Nos
Random Nos
0-1 1 1000 0-1000
2-3 1 1000 1001-2000
3-4 1 1000 2001-3000
4-5 1 1000 3001-4000
5-6 1 1000 4001-5000
5 5000
Sl.
No
Types of
breakdown
Period of b/d Duration(hrs) Frequency Total
b/d(hrs)
1 Chaine main
beam got
damaged
8.11.13(11.15am-
20.15pm)
9 1 9
2 Derailment 2.12.13-
3.12.13(10am-
13pm)
26 1 26
3 Snapping of
chaine
12.1.14(9am-
17pm)
8 1 8
4 G/b damaged
17.2.14(10.30am-
15.30pm)
5 1 5
5 Driving system
failed
28.3.14(13.10-
17.10)
4 1 4

102
Table 6.17: Conversion of the interval between reclaimer break-downs to
cumulative random numbers.
Table 6.18: Conversion of existancy of reclaimer break-downs to cumulative
random numbers.
Interval between Frequency of Frequency of occurrence Cumulative Random
reclaimer breakdown occurrence % * Random Nos Numbers
0-10 1 1000 0 – 1000
10-20 1 1000 1001-2000
20-30 1 1000 2001-3000
40-50 1 1000 3001-4000
50-60 1 1000 4000-5000
5 5000
Existence of
reclaimer Frequency of Frequency of Cumulative Random
Breakdown Occurrence occurrence % * Nos
Random Nos
0-1 1 1000 0-1000
2-3 1 1000 1001-2000
3-4 1 1000 2001-3000
4-5 1 1000 3001-4000
5-6 1 1000 4001-5000
5 5000

103
Table 6.19: Different events of break-downs, their frequencies, and random-
number distribution.
Sl
No
Different Events of
Breakdown
Total
frequency of
Breakdown
Frequency of
Breakdown in
Random
Number
Distribution
1 Breakdown of Tippler 10 0.2381 2381
2 Breakdown of SAC 8 0.1904 1904
3 Breakdown of RAF 4 0.0952 952
4 Breakdown of Belt
conveyor
10 0.2381 2381
5 Breakdown of Stacker 5 0.1191 1191
6 Breakdown of
Reclaimer
5 0.1191 1191
42 1 10000
From the above-mentioned analysis it is observed that the random number
distribution can give some indication about the occurrences of the break-down of
different events like;
Table 6.20: Indicating occurrences of break-down using random number
distribution.
Sl No
Events
Distribution of random number
1 Breakdown of Tippler 1-2381
2 Breakdown of SAC 2382-4285
3 Breakdown of RAF 4286-5237
4 Breakdown of Belt conveyor 5238-7618
5 Breakdown of Stacker 7619-8890
6 Breakdown of Reclaimer 8890-10000
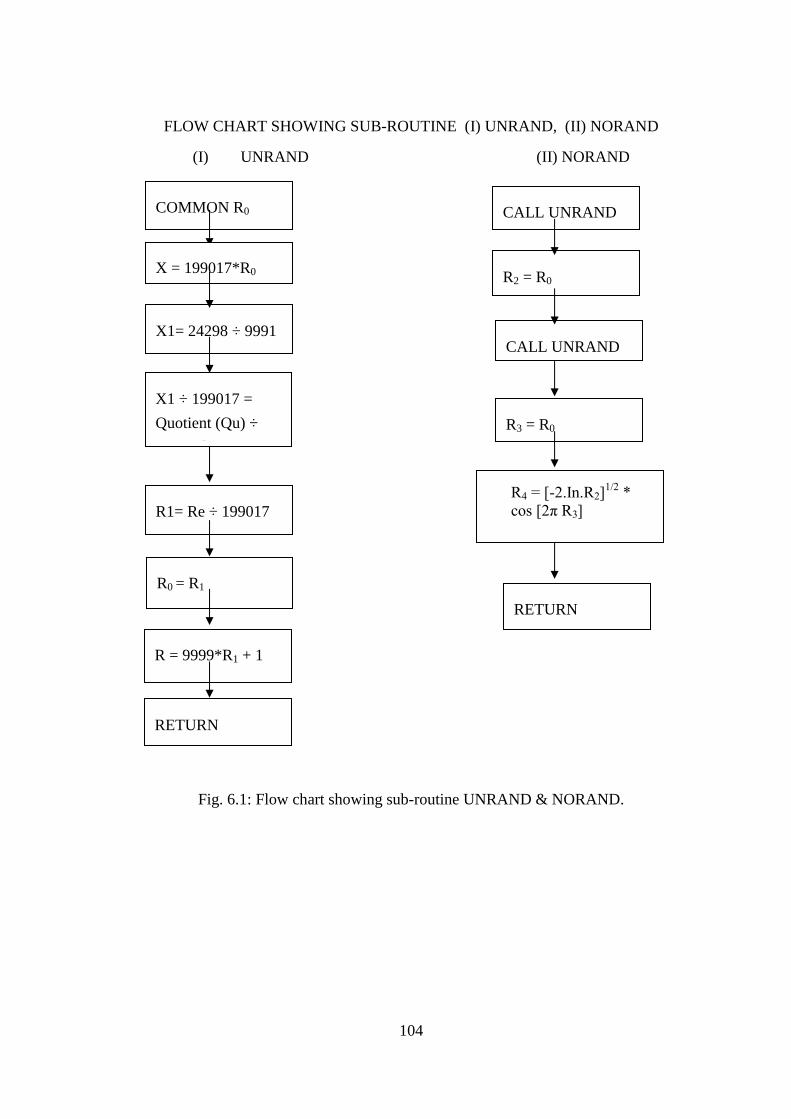
104
FLOW CHART SHOWING SUB-ROUTINE (I) UNRAND, (II) NORAND
(I) UNRAND (II) NORAND
Fig. 6.1: Flow chart showing sub-routine UNRAND & NORAND.
COMMON R0
X = 199017*R0
X1= 24298 ÷ 9991
X1 ÷ 199017 =
Quotient (Qu) ÷
Reminder(R)
R1= Re ÷ 199017
R0 = R1
R = 9999*R1 + 1
RETURN
CALL UNRAND
R2 = R0
R4 = [-2.In.R2]1/2
*
cos [2π R3]
CALL UNRAND
RETURN
R3 = R0

105
FLOW CHART SHOWING SUB-ROUTINE EVENT
Fig. 6.2: Flow chart showing sub-routine event.

106
FLOW CHART SHOW SUB-ROUTINE TIPPLER BREAKDOWN
Fig. 6.3: Flow chart show sub-routine tippler breakdown.

107
FLOW CHART SHOW SUB-ROUTINE SIDE ARM CHARGER BREAKDOWN
Fig. 6.4: Flow chart show sub-routine side arm charger breakdown.

108
FLOW CHART SHOW SUB-ROUTINE REVERSIBLE APRON FEEDER
BREAKDOWN
Fig. 6.5: Flow chart show sub-routine reversible apron feeder breakdown.

109
FLOW CHART SHOW SUB-ROUTINE BELT CONVEYOR BREAKDOWN
Fig. 6.6: Flow chart show sub-routine belt conveyor breakdown.

110
FLOW CHART SHOW SUB-ROUTINE STACKER BREAKDOWN
Fig. 6.7: Flow chart show sub-routine satcker breakdown.
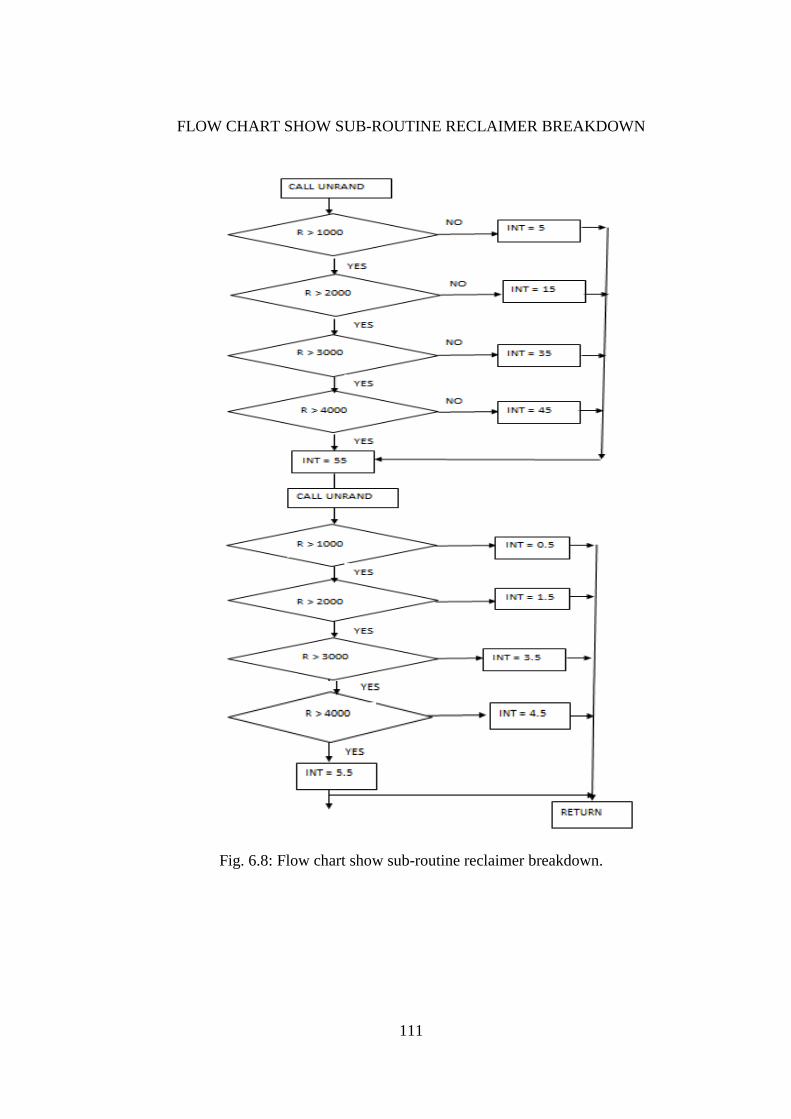
111
FLOW CHART SHOW SUB-ROUTINE RECLAIMER BREAKDOWN
Fig. 6.8: Flow chart show sub-routine reclaimer breakdown.

112
6.10 Summary
In this study, modeling and simulation algorithm is used based on breakdown data
of the different types of machinery generating uniformly distributed random
numbers. The breakdown of different types of machinery was analyzed with
random number distribution. The different equipment fall under definite random
number distribution range. Such as if the random number comes as 1 - 2381
indicates the tippler breakdown and if it comes 2382- 4285 it is considered as side
arm charger break-down, etc.

113
Chapter 7
7 CONCLUSION AND FUTURE SCOPE
7.1 Overview
The performance of equipment can be improved and controlled, successfully. An
appropriate methodology for preventive measurement system can be used. OEE is
a known method to measure the performance of production equipment in coal
handling plant which aims to identify the unproductive loss within the system &
these time losses affect availability, performance, and quality.
7.2 Conclusion
This research work concludes in 2 broad areas.
Firstly, OEE is an indicator of process improvement. The role and contribution of
OEE within the context of performance measurement with a specific observation
regarding the implementation OEE within the case are presented which shows that
the six big time losses for coal handling machinery can be minimized.
Secondly, different types of sensors are used for knowing the status of the
parameters of the equipment which also maximizes their production rate to help the
management for smooth operation.
So, it is concluded that if OEE is implemented in coal handling plant equipment,
the company can improve their availability, performance rate, and quality rate. As a
result, the overall equipment effectiveness can be improved. Thereby the company
can enhance the annual earning and profit. To achieve or may reach the target

114
(world class OEE) efficient measurement is necessary in order to establish the
autonomous maintenance teams, better communication, and teamwork. It is
essential that the company devices an efficient data recording systems so that at
any time up to date and accurate information will be available to the management.
It also gives an opportunity to the operators to raise their skills and know-how to
foster improvement suggestions.
7.3 Contribution
Based on the field studies and analysis of data of availability, performance and
quality of coal handling machinery following conclusions are arrived at:
The OEE of the tippler equipment is increased from 56% to 64% and
breakdown hour reduces from 635 to 268.
The OEE of the side arm charger equipment is increased from 64% to 68%
and breakdown hour reduces from 490 to 250.
The OEE of the reversible apron feeder equipment is increased from 61% to
68% and breakdown hour reduces from 229 to 125.
The OEE of the belt conveyor equipment is increased from 51% to 61% and
breakdown hour reduces from 820 to 424.
The OEE of the stacker equipment is increased from 52% to 62% and
breakdown hour reduces from 468 to 268.
The OEE of the reclaimer equipment is increased from 56% to 64% and
breakdown hour reduces from 380 to 235.
The above results show much more improvement of the coal handling equipment
and reach the world class OEE by continuing with measurement and team effort.
Hence, it increased in availability, better utilization of resources, reduction in the
defect, wastage, minor stoppage, downtime, labour cost and promote safety and
increase morale and confidence of employee and thereby achieving goals by
working as a team.

115
7.4 Future scope of work
The research work can be put forward towards the following area of
research:
Overall Equipment Effectiveness(OEE) is the one of the best tools not only
applied for coal handling plant but also applicable in all the industries such
as mining, manufacturing, automobile, cement, power, steel, construction,
petroleum, food, marine, aeronautical etc.
Further research can be conducted to evaluate the efficiency losses in terms
of cost.
Overall line efficiency can be determined as a function of the on-line
equipment’s OEE metrics.
With the application of OEE, inadequate parameters, which are barriers to
performance can be identified, modified and implemented.
A variety of sensors can be used with the help of different sensors
technology for fault finding automatically in terms of alarms, indications
and hence reducing human errors.

116
8 REFERENCES
[1] Amardeep, R., Rangaswamy, T.M., Gautham j. (2013): Line Balancing Of
Single Model Assembly Line, International Journal of Innovative Research
in Science, Engineering, and Technology (ISSN: 2319-8753). Vol. 2, Issue
5, pp. 1678-1680.
[2] Bhattacharya S., Chikhale, M., and Mukhopadhyay, A. K. (1996):
Condition Monitoring and Performance Analysis of a Vibrating Screen,
Nat. Conf. of Ind. Inst. of Mineral Engineers, pp. 21-29.
[3] Bob, B. (1988): Reliable Electrical Heaters Can Prevent Coal Handling
Equipment Freeze-Ups. IEEE Transactions on Energy Conversion, Vol. 3,
Issue 2, pp. 261-266.
[4] Boban, B. and Joseph, J. (2013): Enhancing Overall Equipment
Effectiveness for a Manufacturing Firm through Total Productive
Maintenance, International Journal of Emerging Technology and Advanced
Engineering, Vol. 3, Issue 8, pp 425-429.
[5] Craig, B. (2010): Enhanced Process Control– Maximizing Coal Handling
Preparation Plant Productivity, pp. 239–251.
[6] Deniz. V., (2014): A Study on the Effects of Coal Feed Size and Coal Type
on the Performance of a Laboratory Jaw Crusher, pp. 1249–1255.
[7] Gupta, S., and Bhattacharya, J. (2011): Aspects of Reliability and
Maintainability in Bulk Material Handling System Design and Factors of
Performance Measure in Design and Selection of Bulk Material Handling
Equipment and Systems Vol. – I, edited by Bhattacharya, Jayanta, Wide
Publishing, Kolkata, pp 153-188.
[8] Hanoun, S., Khan, B., Johnstone, M., Nahavandi, S. and Creighton, D.
(2013): An Effective Heuristic for Stockyard Planning and Machinery
Scheduling at a Coal Handling Facility, Centre for Intelligent Systems
Research (CISR), pp. 206-211.
[9] Ibrahim, Ola. (2013): Total Quality management (TQM) and Continuous
Improvement as Addressed by Researchers, International Journal of
Scientific and Research Publications, Vol. 3, Issue 10, pp 1-4.
[10] Jayaswal, P.and Singh, R. H. (2012): Implementation of kaizen and
jishuhozen to enhance overall equipment performance in a manufacturing
industry, International Journal of Research in IT & Management, Vol. 2,
Issue 8, pp 51-64.
[11] Jhosi, M. M. (2010): Performance Monitoring System for Electromagnetic
Vibrating Feeders of Coal Handling Plant.

117
[12] Jyotsna, P., Date, D.D., Satav, P. (2014): Design and optimization of the
roller in belt conveyor system for weight reduction, Proceedings of 10th
IRF International Conference, Pune, India.
[13] Kajal. S, Tiwari, P. C. and Saini, P. (2012): Availability Optimization for
Coal Handling System using Genetic Algorithm, International Journal of
Per formability Engineering, Vol. 9, Issue 1, pp. 109- 116.
[14] Kuttalakkani. M., Natarajan.R, Singh. A. K., Vijayakumar. J., Arunan. S.,
Sarojini. L. (2013). Sensor Based Effective Monitoring of Coal Handling
System (CHS), International Journal of Engineering and Technology, Vol
5, Issue 3, pp. 2432-2435.
[15] L. Simmon., Poompat, S. and Urachada, K. (2008): Speed Adjustment
Algorithm for an RFID Reader and Conveyor Belt System Performing
Dynamic Framed Slotted Aloha, IEEE International Conference on RFID
The Venetian, Las Vegas, Nevada, USA.
[16] Laha, D., Chakraborty, U. K. (2009): An Efficient Hybrid Heuristic for
make Span Minimization in Permutation Flow Shop Scheduling, The
International Journal of Advanced Manufacturing Technology, Vol. 44, pp.
559-569.
[17] Lodhi, G. (2013): Operation and maintenance of crusher house in for coal
handling in thermal power plant. International Journal of Mechanical
Engineering and Robotics Research, Vol. 2, Issue 4, pp. 449-455.
[18] Mishra. S., Mishra, A. (2013): Enhancing the Efficiency of Coal Handling
Plant by Introducing GPS Technique, International Journal of Emerging
Technology and Advanced Engineering, Vol. 3, Issue 11, pp. 568-572.
[19] M, Kanmani., J, Nivedha., G, Sundar. (2014): Belt conveyor monitoring
and fault detecting using PLC and SCADA, International Journal of
Advanced Research in Electrical, Electronics and Instrumentation
Engineering, Vol. 3, Issue 4. pp 243-248.
[20] Ozdeniz, A. H., Ozbay, Y., Yilmaz, N. (2008): Monitoring and ANN
Modelling of Coal Stockpile Behaviour under Different Atmospheric
Conditions, pp. 494-507.
[21] Pal, Abhilekh. (2013): Failure analysis of gear shaft of rotary wagon tippler
in a thermal power plant- a theoretical review, International Journal of
Mechanical and Production Engineering Research and Development. Vol.
3, Issue 2, pp 99-104.
[22] Pal, B. K and Maiti, J. Lean Maintenance – Concept, Procedure and
Usefulness (2004): Journal of Mines, Metals, and Fuels, Vol. 54, Issue 11,
pp. 317-321.
[23] Rana, Y. & Chitre, A. (2014): PLC based power plant coal level sensing
system using ultrasonic sensor, International Journal of Innovative
Technology & Adaptive Management, Vol. 1, Issue 6, pp 456-462.

118
[24] Rath, K. C., Kumar, A., Tigga, A. M. and Mohapatra, S. S. (2012): Design
of Complicated Spline Trajectory with the help of Matlab Program by the
Extracted Data through the IGES Reader for CNC Tool Motion. American
Journal of Sustainable Cities and Society, Vol. 1, pp. 25-35.
[25] Sankhla, V. S., Chandrawat, S. S. Y. (2012): ImplemetationOf Lean
Manufacturing In Small Company, International Journal of Engineering
Research and Applications, Vol. 2, Issue 5, pp. 2172-2176.
[26] Shaout, A. and Trivedi, J. (2013): Performance Appraisal System – Using a
Multistage Fuzzy Architecture, International Journal of Computer and
Information Technology, Vol. 2, Issue 03, pp 405-411.
[27] Sharm, S. (2013): Safety Features for Reduction of Failure in Stacker cum
Reclaimer for Thermal Power Plant, International Journal of Science and
Research, Vol. 2, Issue 9, pp 261-263.
[28] Sinha, S., Dutta, S. and Ganguly S. (2009): Prediction of Failures at Surface
Miners using Artificial Neural Network Modeling Approach, Journal of
Mines, Metals & Fuels, Vol. 57, Page - 28-32.
[29] Srdan, M. B., Dejan, B. M. I., Zoran, D. P., Milord, P. P., Neboj, B. G.
(2013): Failure investigation of the bucket wheel excavator crawler chain
link, Engineering Failure Analysis Vol. 35, pp 462–469.
[30] Sokovic, M., Jovanovich, J., Krivokapic, Z., Vinovich, A. (2009). Basic
Quality Tools in Continuous Improvement Process, Journal of Mechanical
Engineering. Vol. 5, Issue 55, pp. 1-9.
[31] Tripathi, A. K., Pal, S. K. and Kar, P. K. (2011): Repairing Techniques for
Trailing Cables of Mobile Underground Mining Equipment, Journal of
Mines, Metal & Fuels, Vol. 59, No. 3&4, pp. 123-133.
[32] Velmurugan G., Vijayakumar, R., Sakthimuruga, T.M. (2014): Conveyor
Belt Troubles, International Journal of Emerging Engineering Research and
Technology, Vol. 2, Issue 3, PP 21-30.
[33] Zaman, M., Pattanayak, S. K., Paul, A. C. (2013): Study Of Feasibility Of
Six Sigma Implementation In A Manufacturing Industry: A Case Study,
International Journal of Mechanical and Industrial Engineering, Vol. 3,
Issue 1, pp. 96-100.
[34] Zimroz, R. and Król, R. (2009): Failure Analysis Of Belt Conveyor
Systems For Condition Monitoring Purposes, pp 255-270.

119
Appendix

120
Visual detection by man on the surface of the conveyor belt.
Steel cord monitoring of conveyor belt by conductive detection.
Belt speed monitoring by tachometer installing on carrying side of belt

121
Torque monitoring of shaft installed in belt conveyor system by sensor
A typical strain-gauge measurement set up in conveyor belt system
Vibration monitoring by Vibration analyser instrument

122
Power monitoring of motor
Belt alignment control monitoring the belt misalignment
Two encoder mounted on pulley to measure the position
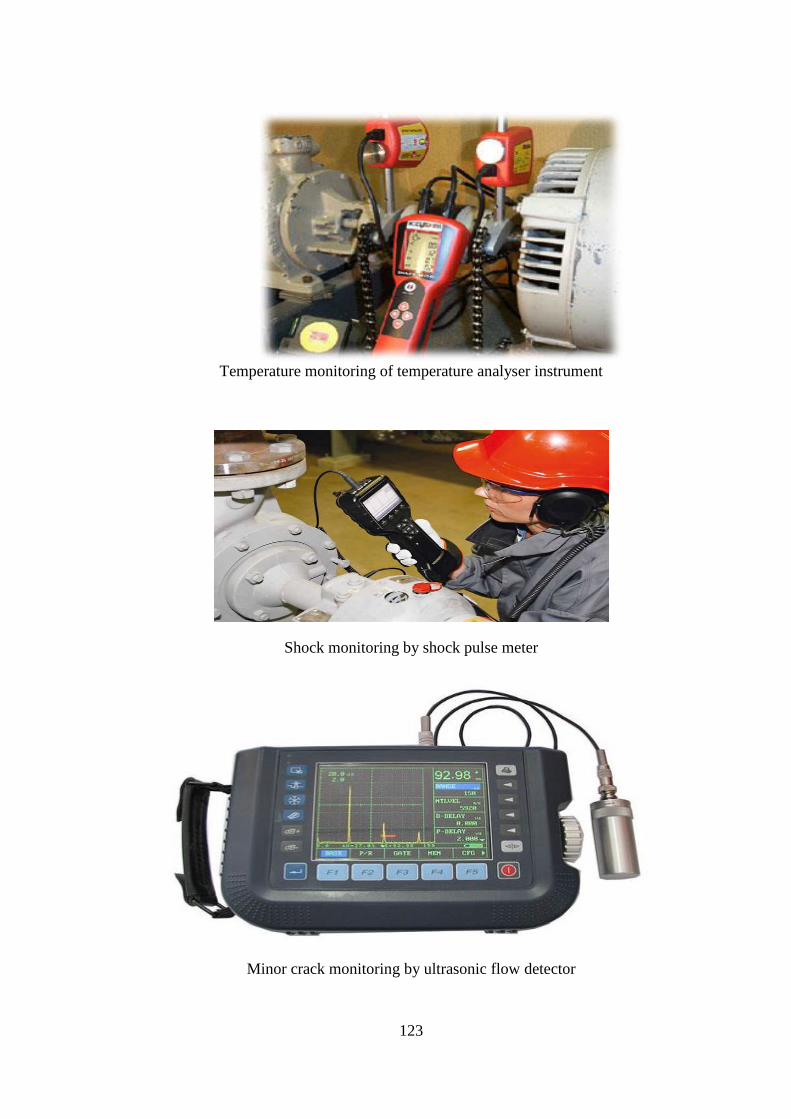
123
Temperature monitoring of temperature analyser instrument
Shock monitoring by shock pulse meter
Minor crack monitoring by ultrasonic flow detector

124
Safety instrument for spot monitoring hot material
conveyor belt rupture detector
Thickness testing of conveyor belt

125
Hot spot detecting by infra-red thermometer
Ultrasonic thickness meter monitoring the thickness of paint and coating
Corrosion monitoring by corrosion meter

126
Laser Alignment is a highly accurate system to align framework and conveyor
components
Idler tracking system in BCS
Belt misalignment switch

127
Grilling system for protection of spillage of coal
Online coal quality measurement by electric sensor
Metal detector for online monitoring of mild steel
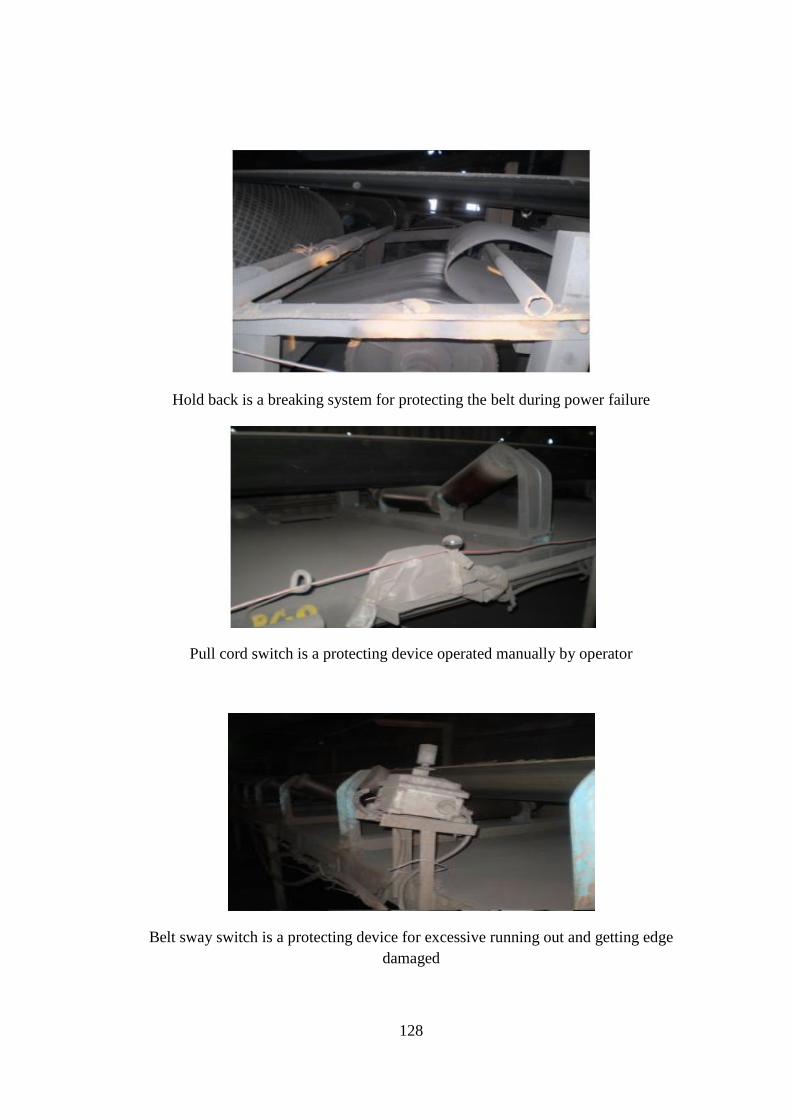
128
Hold back is a breaking system for protecting the belt during power failure
Pull cord switch is a protecting device operated manually by operator
Belt sway switch is a protecting device for excessive running out and getting edge
damaged

129
Hydraulic pressure gauge monitoring
Hydraulic oil leakage monitoring by ultrasonic leak detector
Wheel speed monitoring by sensor

130
Laser distance meter to measure the length
Controlling the long travel speed of stacker/reclaimer by VFD Panel
OneproD MVX Multi channel online monitoring system is used for remote
monitoring of distance machines (oil platforms, remote plants, etc.)

131
Introducing the sensors for chute jamming
Introducing gladiator microwave switch, for protecting the boom of
stacker/reclaimer on contact with stockpiles
MMI measures the fast moving coal on stacker-reclaimers

132
Stacker-reclaimer’s distance from the stockpile monitoring by using Echomax
XPS-30 ultrasonic transducer instruments
Machine long travel monitoring by sensor (Hengstler AC61 SSI multi-turn
encoder)

133
Monitoring the speed of diesel locomotive by sensor
Stacker-Reclaimer position monitoring of luff, slew and long travel by using
Hengstler AC61 series encoder

134
CURRICULUM VITAE
National Institute of Technology
Rourkela, Odisha, India
Personal Details:
Name : SOMANATH OJHA
Address : AT/PO- Balipal, PS- Ghasipura, Dist- Keonjhar, Odisha
Date of Birth : 12th
, April 1992
Fields of Interest : Material Handling, OEE, TPM, FMEA, Fault diagnosis
Phone :+91 9040438442, E-mail : [email protected]
Academic Qualification:
2015 M. Tech (Res) Dissertation submitted at NIT, Rourkela.
2013 B. Tech (Mechanical. Engineering), B. P. U. T, Odisha.
2009 +2 Science, CHSE, Odisha
2007 Matriculation, BSE, Odisha
Date-
Somanath Ojha

135
LIST OF PUBLICATIONS
International Journals:
1. Ojha, S., Pal, B. K., Biswal, B. B. and Sarangi, D. (2014): Performance
Monitoring of Vibration in Belt Conveyor System, International Journal of
Engineering Research and Applications, Vol. 4, No. 7, pp. 22-31.
2. Ojha, S., Pal, B. K., Biswal, B. B. (2015): OEE as an Indicator for
Performance Measurement in Coal Handling Plant, International Journal of
Innovative Science Engineering Technology, Vol. 2, Issue 9, pp. 103-110.
3. Ojha, S., Pal, B. K., Biswal, B. B. (2015): Minimizing the Breakdown in
Belt Conveyor System of Coal Handling Plant, SSRG International Journal
of Mechanical Engineering, Vol. 2, Issue 9, pp. 1-4.
4. Ojha, S., Pal, B. K., Biswal, B. B. (2015): Methodology for Operational
Improvement in Side Arm Charger of Coal Handling Plant – A Theoretical
Review, Journal of Quality Technology (Communicated & under Review).
Conference:
1. Ojha, S., Pal, B. K., Biswal, B. B. (2014): Failure analysis of belt structure
in Coal Handling Plant- A Case study” 1st National conference on Mining-
Recent Advance, Challenges and Scenario Beyond 2015 (MRACSB- 2015)
at Institute of Engineers, Rourkela chapter, Nov 8-9, held at Rourkela.