master plan for planned development area no. 115
TRANSCRIPT

HARVARDuniversity
Submitted Pursuant to Article 80 of the Boston Zoning Code
Submi ed to:
Boston Redevelopment Authority
d/b/a the Boston Planning & Development Agency
Submi ed by:
A L L S T O N C A M P U SDecember 2017
Master Plan for Planned Development Area No. 115
HarvardEnterprise Research Campus
Harvard University With Technical Assistance From:DLA PiperReed HilderbrandVHBWSP

Master Plan for Planned Development Area No. 115
Submitted Pursuant to Article 80 of the Boston Zoning Code
Harvard Enterprise Research Campus
Submitted to:
Boston Redevelopment Authority d/b/a the Boston Planning and Development Agency
Submitted by:
Harvard University
With Technical Assistance From: DLA Piper Reed Hilderbrand VHB WSP
December 2017

PDA Master Plan i Enterprise Research Campus
Table of Contents
Page
1.0 Introduction ........................................................................................................................................ 1
2.0 Relationship to Framework Plan .................................................................................................... 2
3.0 PDA Area Description ........................................................................................................................ 2
4.0 The Proposed Project ........................................................................................................................ 2
5.0 Planning Objectives and Character of Development .................................................................... 4
6.0 Project Benefits ................................................................................................................................ 7
7.0 Technical Studies Performed in Support of Development of the PDA ....................................... 8
8.0 Effect of PDA Master Plan ........................................................................................................... 12
List of Exhibits
A. Figure Depicting Framework Plan Area and PDA Area
B. Legal Description and Survey Plan of PDA Area
C. Site Plan Showing Proposed Project
D. Illustrative Plan of PDA Area
E. Table of Allowed Uses
F. Transportation Impact Study
Attachment
Framework Plan Document

PDA Master Plan 1 Enterprise Research Campus
MASTER PLAN
For
PLANNED DEVELOPMENT AREA NO. 115
Harvard Enterprise Research Campus
Western Avenue, Boston
Dated: December 2017
1.0 Introduction
In accordance with Sections 3-1A and 80C-3 of the Boston Zoning Code (the “Zoning Code”), this plan constitutes a Master Plan for Planned Development Area No. 115 (the “PDA Master Plan”) for development of the Enterprise Research Campus (“ERC”) on Western Avenue in the Allston neighborhood of Boston. As more particularly described below, the PDA Master Plan contemplates the construction of multiple buildings (the “Proposed Project”), which may be built simultaneously or in phases. The PDA Master Plan covers an approximately 14.1 acre (approximately 613,305 square-foot) parcel of land referred to as the “PDA Area.” A figure depicting the location of the PDA Area in the context of the Framework Plan (described below) is included as Exhibit A. The legal description and survey plan of the PDA Area are included as Exhibit B.
The PDA Area is comprised entirely of land owned by Harvard University (the “University,” or “Harvard”).
This PDA Master Plan:
(i) sets forth a statement of the development concept for the PDA Area, including the planning objectives and character of the development, the proposed uses of the area, the range of dimensional requirements for each of the proposed structures, and the proposed phasing of construction, and
(ii) provides for one or more Planned Development Area Development Plans (as defined in the Zoning Code; each such plan, a “PDA Development Plan”) to be submitted providing more specific information about the elements of the Proposed Project (as defined in the Zoning Code) and components thereof.
The PDA Master Plan consists of 13 pages of text plus attachments designated Exhibits A through F. All references to this PDA Master Plan contained herein will pertain only to these 13 pages and Exhibits. This PDA Master Plan shall be governed by the Zoning Code in effect as of the date hereof and unless otherwise set forth herein, all references to terms defined by the Zoning Code will have the meanings set forth in Section 2A of the Zoning Code, as amended to the effective date hereof, and not as amended hereafter.

PDA Master Plan 2 Enterprise Research Campus
2.0 Relationship to Framework Plan
This PDA Master Plan is submitted within the context of a broader planning framework for the geographic area around the PDA Area (the “Framework Plan”). A figure depicting the Framework Plan is included as Exhibit A. The Framework Plan document – which is also attached in its entirety to this PDA Master Plan - takes into consideration the ongoing planning and development of Allston to the north of the PDA Area (the University’s Institutional Master Plan (“IMP”) Area) and to the south (the Massachusetts Department of Transportation (“MassDOT”) I-90 project). The Framework Plan guides near-term thinking while also providing a framework and guidelines for development beyond the initial phase addressed in this PDA Master Plan. Each element of the PDA Master Plan will contribute to the completeness of the vision presented in the Framework Plan.
The depiction of the Framework Plan is provided for informational purposes only and is largely beyond the time frame and geography of this PDA Master Plan. The University is not seeking regulatory approval of the Framework Plan.
3.0 PDA Area Description
The PDA Area is an approximately 14.1 acre parcel of land, bounded generally by Western Avenue on the north, the Harvard property which is ground-leased to Sanofi Genzyme on the east, the Harvard University District Energy Facility (“DEF”) on the southeast, and Harvard property west of Hague Street on the west.
The legal description and survey plan of the PDA Area are attached as Exhibit B.
4.0 The Proposed Project
Building Program
The PDA Master Plan proposes the construction of multiple buildings that comprise the Proposed Project, described conceptually below:
• 400,000 square feet of office/lab space;
• 250,000 square feet of hotel/conference center space1;
• 250,000 square feet of residential space; and
• A total of between 800 and 900 parking spaces in a combination of below-grade and at-grade, surface spaces.
The PDA Master Plan also includes two public spaces currently envisioned to be located on the south side of the office/lab buildings. These spaces will connect to the west to the network of open spaces beginning behind the Honan-Allston Branch Library at Ray Mellone Park and
1 Harvard University’s 2013 Institutional Master Plan for its Campus in Allston included a hotel/conference center of approximately 250,000 square feet as a Proposed Institutional Project. The location of the hotel/conference center in the IMP was generally the same location as is being presented in this PDA Master Plan. The IMP noted that the hotel/conference center might be developed by a non-institutional, third party developer and in such a scenario, a mechanism other than the IMP process would be required to get zoning approvals for such a use.

PDA Master Plan 3 Enterprise Research Campus
extending eastward through Rena Park to the green courtyard spaces of Harvard’s Science and Engineering Complex (“SEC”).
In addition, the PDA Master Plan includes new roadways and access driveways. The most significant of these is Cattle Drive, a new north-south roadway which will provide access into and through the PDA Area. As depicted in the Framework Plan, in the long-term Cattle Drive will provide a through connection from Western Avenue to Cambridge Street and on to the future West Station commuter rail stop.
A schematic site plan showing the elements of the Proposed Project and the accompanying open space and roadways is included as Exhibit C, and an illustrative site plan is included as Exhibit D.
Proposed Uses of the Area and Structures
Allowed uses for the PDA Area and Project Sites are set forth in Exhibit E and include, among others, office, laboratory, residential, hotel, and retail and/or restaurant. In addition, a limited amount of Institutional Use will be allowed in the Proposed Project. Uses will also include below-grade and at-grade accessory parking for all types of uses as set forth in the "Parking" section of this PDA Master Plan. Roadways constructed within the PDA Area are expected to serve the PDA uses and adjacent uses, including institutional uses. There will also be below-grade utility lines running from the District Energy Facility to institutional and non-institutional buildings in the vicinity. Other than as specified in this PDA Master Plan or an approved PDA Development Plan the only use regulations applicable to the PDA Area are those set forth in this paragraph.
It is anticipated that construction of the Proposed Project will be phased. Prior to its development, land within the PDA Area may be used for temporary and interim uses, as well as infrastructure uses such as stormwater management areas.
Parking and Loading
The elements of the Proposed Project in the PDA Master Plan include a total of between 800 and 900 parking spaces in a combination of below-grade and at-grade, surface spaces. As presented in the Framework Plan, in future phases of development, it is anticipated that the surface parking spaces will be relocated and that these surface lots will be used for development of buildings and open spaces.
Range of Dimensional Requirements
The specific height (as defined in the Zoning Code) of each building will be presented in the PDA Development Plan or Plans for the components of the Proposed Project. The information presented below represents the maximum height that would be built on any of the individual parcels recognizing that the total development program for this Master Plan PDA will remain at a maximum of approximately 900,000 square feet of gross floor area.
The height of the proposed office/lab buildings fronting on Western Avenue will be limited to a maximum of 140 feet. The height of the proposed hotel/conference center building will be limited to a maximum of 190 feet (as indicated in the University’s 2013 IMP). The height of the proposed residential building will be limited to a maximum of 190 feet.

PDA Master Plan 4 Enterprise Research Campus
Under existing zoning, a PDA within the Allston Landing North Economic Development Area (“EDA”) has an allowable Floor Area Ratio (“FAR”) of 2.0. The Proposed Project that makes up the PDA Master Plan has a total FAR of below 2.0. Coincident with the filing of this PDA Master Plan, and in the context of the Framework Plan, Harvard has requested a Text Amendment to permit future PDAs in the Allston Landing North EDA to contain a higher FAR but not to exceed a maximum FAR of 4.0.
A PDA Development Plan may provide for shared parking among parcels in the plan area, and individual buildings may exceed the FAR limit, provided that the overall parking within the PDA Area is sufficient to meet the aggregate parking requirements and that the overall FAR within the PDA Area does not exceed 2.0.
Other than as specified in this PDA Master Plan or an approved PDA Development Plan, the sole dimensional regulations applicable to the PDA Area are those of building height, Gross Floor Area, and Floor Area Ratio set forth in this PDA Master Plan.
Proposed Phasing of Construction
As mentioned previously, it is anticipated that construction of the Proposed Project will be phased. As more precise construction sequencing plans are developed, they shall be submitted to the Boston Planning and Development Agency (“BPDA”) and the Boston Zoning Commission for confirmation and approval as part of the PDA Development Plan and Large Project Review filings for the applicable building or buildings.
5.0 Planning Objectives and Character of Development
As noted, the PDA Master Plan fits into the context of a broader Framework Plan for the proposed Enterprise Research Campus. The following planning principles present a summary of the principles guiding the development of the overall Framework Plan which also are central in the development of this PDA Master Plan. The University is not seeking regulatory approval of the Framework Plan.
Land Use
The planning for the Framework Plan focuses on establishing a programmatic relationship between the future commercial and other research entity tenants of the ERC and the teaching and research mission of the University. The nature of this programmatic relationship will comprise an important aspect of how the ERC meets the goals of the University. Simultaneously, the success of the ERC as an urban district will also be contingent on the establishment of a robust mixed-use development program, including office, lab, research space, residential, retail, as well as a range of publicly accessible open spaces. This type of mix will ensure that the area is vibrant, with activity extending through the course of the day and evening.
Along primary ERC main streets, a high degree of porosity and public interface is desired. Ground floor uses may be commercial or institutional. Examples include (but are not limited to) retail stores, office, service establishments, common spaces, and cultural and institutional uses involving public programming. Institutional use may animate ground floors, particularly in early phases prior to achieving critical mass sufficient to support active retail storefronts. Generally speaking, service areas or parking and loading entrances should not be located in this zone. Significant ground floor glass is recommended for building entrance locations.

PDA Master Plan 5 Enterprise Research Campus
Urban Design
The blocks of the Framework Plan are organized by streets, paths, and open spaces which break down existing impenetrable areas into a system of development blocks that guide future incremental growth. The blocks identify sites within which one or more buildings can be developed in the future. Each site can accommodate a variety of building footprints, perimeter open space, courtyards and quadrangles. The block plan allows for a mix of building types and scales to coexist in the ERC. As planning and tenancy evolve, the block plan may need to be adjusted. For example, some laboratory buildings may require larger footprints.
In regards to height and massing, buildings should:
• Use recess lines and set-backs to define the enclosure of public space and create transitions to adjacent low-scale buildings;
• Optimize daylight and consider impact of shadows;
• Minimize monolithic massing and break down the scale of large buildings; and
• As appropriate, express the base, middle, and top for tall buildings.
ERC development within the Framework Plan should clearly establish gateway treatments at key intersections, particularly those that intersect with Western Avenue such as at Cattle Drive. This may involve setback conditions or other physical or programmatic treatments that signal entrance to an important urban and research district different from (although related to) the Harvard academic campus directly to the north.
Public Realm
Streets
Street planning guidelines for the Framework Plan prescribe elements which are necessary to create a cohesive and sustainable public realm. Principles follow those of Boston’s Complete Streets Guidelines, which state that streets should be sensitive to their context, recognized as an essential component of public spaces, supportive of multiple functions, and encouraging of non-motorized uses. Publicly accessible streets will shape the ERC physical setting and public realm. Plans should enhance the quality of the public realm to create great streets and memorable places.
A hierarchy of street typologies is the organizing element of the public realm guidelines of the Framework Plan. These guidelines prescribe typical roadway and sidewalk dimensions. Guidance is provided for components of the pedestrian realm, networks (pedestrian, bicycle, and transit), landscape function, and establishment of an urban tree canopy.
One of the primary objectives in establishing the ERC street grid is coordination with the MassDOT planning for the reconstruction of the Massachusetts Turnpike and ramps, and the creation of a new multi-modal transit station in Allston. Harvard has worked closely with MassDOT and the I-90 Task Force to facilitate consistency between the planning for streets south of Cambridge Street with the street network planning for the ERC, north of Cambridge Street.
Current coordination with MassDOT planning indicates the following roles for key north/south ERC streets:

PDA Master Plan 6 Enterprise Research Campus
• Establish Cattle Drive as the ERC’s commercial main street;
• Plan East Drive capacity to carry the district’s biggest traffic load, including commuter traffic; and
• Plan for Stadium Way to evolve into a transit priority street.
Following guidance from Boston’s Complete Streets, the Framework Plan promotes a street and sidewalk configuration that will ensure high performance and longevity for the investment in new street trees. Pervious paving and structural soil volumes in the planted areas provide horticultural support for the trees, but they also significantly increase infiltration and reduce the outflow of stormwater in rain events through below-grade detention. Over time, this system should ensure a notable increase in canopy coverage throughout the area and will contribute to the evolution of a unified network of streets throughout.
A coherent pedestrian realm that comprises a diverse urban landscape will be achieved over time. Critical ingredients include the organization of buildings, land uses, and memorable spaces that contribute to a unique urban quality; activation of the street with extensive programs of public accommodation; and the efficient and systematic design of vehicle, bicycle, and pedestrian ways. Boston’s Complete Streets Guidelines offer guidance on programmatic issues, dimensions, materials and techniques, performance and function, and the achievement of comprehensive environmental benefits. In order to provide the best pedestrian realm, curb cuts on main streets will be minimized.
• Pedestrian Zone: Sidewalks will have continuous and unobstructed pathways and sight lines. Uniform, consistent surfaces are recommended and will be made with poured concrete surface or smooth pavers that utilize large dimensions to minimize vibration. The pedestrian zone will line up legibly and logically with intersection crosswalks. This system achieves optimal navigation and ease of travel for persons with varying disabilities.
• Furnishing Zone: Between the pedestrian zone and the curb of the roadbed, a furnishing zone is contemplated to accommodate tree planting and soil infiltration zones, pedestrian and street lighting, street furniture, and any fixtures and appurtenances required for transit. Dimensions will vary according to specific conditions and roadway configuration, but throughout the ERC area, this zone is envisioned to remain 4 to 6 feet in width, plus curb extensions where they exist. By using unit pavers, the furnishing zones will have permeability for stormwater infiltration.
• Frontage Zone: The frontage zone will frame the inside edge of the pedestrian zone, extend the sidewalk as dimensions allow, and may accommodate sidewalk cafes, store entries, retail displays, and landscape elements. The frontage zone can be widened to create plazas and gathering spaces at periodic breaks in the street wall. Dimensions and materials in the frontage will vary according to building use and building type.
Open Space
Landscape is an important element which helps to define the character of the ERC. Early planning should frame courtyards and other open spaces that will in time form the ERC development. The PDA Master Plan starts to establish a network of open spaces and increased landscape areas along Cattle Drive which will help to make Cattle Drive an important pedestrian destination. It should also enhance landscape function to minimize the impact on ecosystems and

PDA Master Plan 7 Enterprise Research Campus
water resources, reduce drainage impacts of projects, and improve the quality of stormwater management as it impacts the Charles River.
Sustainability
The Proposed Project will demonstrate practices that promote sustainability, including measures to increase efficiency and use of renewable resources. In addition to complying with the requirements of Article 37 (Green Buildings) of the Zoning Code, the Proposed Project will be based on a series of sustainability principles, including:
• Reduce vulnerability to climate change impacts including natural hazards by integrating climate change adaptation into planning and project design;
• Promote health, productivity, and safety of the ERC community through design and maintenance of the built environment;
• Enhance the health of ERC ecosystems and increase the diversity of native species;
• Establish indicators for sustainability that will enable monitoring, reporting and continuous improvement;
• Minimize the impact on ecosystems and water resources, and reduce drainage impacts of the projects;
• Promote smart use of water, inside and out, to reduce potable water consumption;
• Promote better building energy performance through innovative strategies;
• Use sustainable building materials and reduce waste;
• Promote better indoor air quality and access to daylight and views;
• Promote walkability with efficient transportation options and open space;
• Emphasize compact, walkable mixed-use neighborhoods with good connections to nearby communities; and
• Reduce the environmental consequences of the construction and operation of buildings and infrastructure.
6.0 Project Benefits
The development of the Proposed Project contemplated by this PDA Master Plan will provide a range of public benefits, including:
• Increased and improved public space which connects to a broader network of open spaces;
• New affordable housing units in connection with any residential development that comply with the City’s requirements;
• Housing and job linkage payments from qualifying uses;

PDA Master Plan 8 Enterprise Research Campus
• New construction and permanent jobs;
• Increased tax revenues for the City;
• Area-wide stormwater improvements through the extension of a major new stormwater line through the ERC to a new outfall to the north of the River Street Bridge,
• Environmental benefits, including additional tree canopy and decreased urban heat island effect; and
• Transportation improvements.
The specific project benefits associated with each component of the Proposed Project shall be included in the PDA Development Plan for such project.
7.0 Technical Studies Performed in Support of Development of the PDA
Transportation
Following is a summary of the transportation impacts of the Proposed Project presented in this PDA Master Plan. A more detailed analysis is included in the Transportation Impact Study (“TIS”) that is included as Exhibit F.
As described previously, the ERC PDA will include 900,000 square feet of phased development and between 800-900 parking spaces. In addition, the ERC will include the construction of new transportation facilities including:
• Construction of two new roadways, Cattle Drive and East Drive, which will provide access from Western Avenue to the surface parking lots and the DEF, respectively;
• On a temporary basis, an extension of Cattle Drive via Dedham Parrish Road to provide an additional vehicular access/egress point to Cambridge Street and to direct through-traffic away from Windom Street;
• Discontinuance of Hague Street and, potentially, a section of Rotterdam Street to the east of Stadium Road;
• A new bicycle path connecting the ERC with the planned Rena Path extension and providing a new bicycle facilities from Western Avenue to Cambridge Street;
• Improvements to Western Avenue including new and enhanced pedestrian and bicycle facilities on the southern side of the street, adjacent to the ERC PDA site;
• Approximately 800-900 parking spaces in a mix of below ground garages and surface parking lots; and
• Nearly 600 new bicycle parking spaces.
The transportation impacts of the ERC development program and its transportation improvements were evaluated for a 2022 “Build Conditions” scenario that included 2013 IMP projects, the SEC

PDA Master Plan 9 Enterprise Research Campus
and other non-Harvard projects as described in the TIS that is included as Exhibit F. The scope of work for this study was reviewed and approved by the Boston Transportation Department (“BTD”) and the BPDA. The TIS examined existing and future traffic operations at ten existing and one new intersection; evaluated existing and future transit operations; described existing and proposed pedestrian and bicycle networks; and analyzed the most recent MassDOT crash data. The analysis assumes that the proposed MassDOT I-90 Allston Interchange Improvement Project has not been completed before the ERC PDA program. Key findings from the TIS indicate the following:
• A new traffic signal is warranted at the intersection of Cattle Drive and Western Avenue. Signal phasing and accommodations for all modes at the intersection should be furthered evaluated in consultation with BTD.
• The proposed Cattle Drive Extension will divert nearly 700 vehicles from Windom Street during the morning peak hour and nearly 500 vehicles during the evening peak hour.
• Based on the most recent MassDOT crash data from 2010 to 2014, two Study Area intersections have crash rates that exceed the average crash rates for District 6: North Harvard Street/Anderson Bridge at Soldiers Field Road and Cambridge Street at I-90 Ramps/Soldiers Field Road. MassDOT has upgraded the first location as part of the recently completed Anderson Bridge project and has an on-going construction project to improve the second location, which will be further improved as part of the I-90 Allston Interchange Improvement Project.
• Four signalized Study Area intersections are projected to operate at Level of Service (LOS) E/F under the No-Build conditions and will operate with increased delay with the addition of ERC PDA program trips during peak AM and/or PM hours. Traffic operations can be mitigated through signal timing adjustments at these intersections.
• The northbound East Drive approach to the unsignalized intersection of Western Avenue and Kresge Way is projected to operate at LOS F during both the weekday morning and evening peak hours for the 2022 Build Conditions. The provision of a second lane for the East Drive northbound approach to Western Avenue will improve conditions for vehicles making right turns. Traffic volumes will be monitored under future conditions to determine if the intersection meets signal warrants. It is anticipated that accommodations for a future traffic signal would be considered at this location as part of streetscape improvements to Western Avenue.
• The 2022 Build conditions analysis assumes the existing signal at Batten Way and Western Avenue is maintained with the discontinuation of Hague Street. Further review and discussion with BTD is necessary to determine potential modifications to pedestrian crossing locations, stop bar locations, and signal equipment. In addition, vehicle and pedestrian traffic volumes will be monitored to determine if the intersection continues to meet signal warrants in the future.
• Transit operational analysis included five MBTA bus routes that operate through or near the Project Study Area. Under the 2022 No-Build Conditions, estimated transit ridership can be accommodated by the existing scheduled capacity for all bus routes with the exception of the Route 66 outbound and Route 86 outbound. Under the 2022 Build Conditions, the trips generated by the ERC PDA program have a slight impact on bus capacities: in addition to the Route 66 outbound and Route 86 outbound, the Route 70 outbound and the Route 70A

PDA Master Plan 10 Enterprise Research Campus
inbound are expected to exceed the MBTA policy capacity during the weekday morning and weekday evening peak hours, respectively.
Traffic control and progression along the Western Avenue corridor will be monitored and further evaluated from Barry’s Corner to Soldiers Field Road as new developments are completed and traffic volumes increase. The evaluation will consider signal progression, bicycle and pedestrian accommodations at signals, and gaps at unsignalized intersections.
To mitigate the impacts to the MBTA Bus Routes 66 and 86, Harvard will provide tenants and residents of the ERC PDA developments with access to its shuttle services in Allston. Harvard University will work with the MBTA and BTD to review and potentially consolidate stop locations to best serve both its Allston Campus and the ERC PDA. In addition, Harvard will monitor proposals to improve service on the Route 70/70A and coordinate with the MBTA to improve service including the provision of new bus stops on Western Avenue at Cattle Drive.
A Transportation Demand Management (“TDM”) program will also be implemented as part of the Proposed Project. The TDM program is an important tool to help manage vehicular trips and support alternative modes of transportation. The TDM program will be refined in consultation with BTD and the BPDA as part of the Article 80 process, but could potentially include the following elements:
• Join the Allston/Brighton Transportation Management Association (“TMA”);
• Designate a TDM coordinator to facilitate and assist with various TDM measures;
• Encourage use of carpools and vanpools;
• Designate preferential parking spaces for carpool only, vanpool only, and/or low emissions vehicles;
• Provide electric vehicle charging stations;
• Provide Zipcars;
• Provide secure bike parking;
• Provide a Hubway station; and
• Subsidize transit passes for ERC residents and employees
Infrastructure
The ERC will include new public and private utility systems. As described below, Harvard proposes to connect the new ERC utilities to existing systems that are primarily located along the periphery of the district. The location and elevations of the systems are largely dictated by the need to create topography in an otherwise flat landscape for stormwater drainage purposes; the location of Massachusetts Water Resources Authority (“MWRA”) sewer line that bisects the ERC; the requirements of the gravity-based stormwater system and its large diameter conveyance pipes; and the requirements of the thermal utilities serving the District Energy Facility.

PDA Master Plan 11 Enterprise Research Campus
Harvard has used a “Smart Utilities” approach to plan and design these systems in an integrated fashion that also respects the streetscape requirements of creating a desirable urban district. In addition to the use of 3-D modeling, Harvard has worked to co-locate its telecommunications systems in a common duct bank and will coordinate with private utilities to ensure that the City’s Smart Utility guidelines are implemented to the greatest extent feasible. Harvard will continue to coordinate with the City of Boston to address the creation of utility easements in the ERC and their relationship to the emerging roadway network.
Water
Harvard has worked with the Boston Water and Sewer Commission (“BWSC”) to evaluate connections to the existing water main along the southern side of Western Avenue. Harvard proposes to construct a water loop from this line into the ERC PDA development program. Early elements will be constructed as part of the DEF and SEC projects and then expanded as the ERC is built out. These systems will eventually tie into the water main in Cambridge Street to create an expanded redundant loop system.
Sanitary Sewer
The MWRA has a large 72-inch by 112-inch sanitary sewer line that runs through the ERC. The sewer line is approximately 15 feet below the surface and influences the horizontal and vertical locations of new utility systems. Harvard will coordinate with BWSC and MWRA to create connection to this line as required for the ERC generated wastewater.
Stormwater
Because of its past uses, the ERC PDA lacks an adequate stormwater management system. In addition, the area is generally flat with little elevation change across its entire acreage. Harvard proposes to create a slight elevation change within the ERC to facilitate stormwater run-off and address vertical constraints related to utility crossings in the area around the proposed Cattle Drive and Science Drive intersection. The new elevations will be set below the elevation of the first floor of the DEF, which was established to address resiliency needs for this facility as described in Harvard’s 2016 IMP Amendment.
Harvard had previously installed a 72-inch storm drain trunk line for BWSC along the general alignment of Rena Path and then along the southern and eastern perimeter of the SEC foundation. This line currently connects to the existing 36-inch stormwater line that runs through the Harvard Business School (“HBS”) campus to an existing outfall at the Charles River.
As part of the Proposed Project, on behalf of BWSC, Harvard will extend this trunk line through the ERC to a new outfall to the north of the River Street Bridge. This system will convey stormwater flows from a 100 +/- acre contributing area of Allston upstream of the PDA Area, as well as all of the flows from the ERC. It is anticipated that sections of the stormwater line will be required on an interim basis until MassDOT’s I-90 Allston Interchange Project is completed and the permanent alignment becomes available. This system will be built in phases to support the buildout of the ERC and to facilitate coordination with MassDOT’s I-90 Allston Interchange Project. Upon its completion, Harvard will disconnect the 72-inch line from the system that runs through the HBS campus.
In addition to the proposed infrastructure improvements, Harvard will utilize Best Management Practices (“BMPs”) for water quality and stormwater management on the parcels and the new

PDA Master Plan 12 Enterprise Research Campus
roadways. Consistent with Boston’s Complete Streets Guidelines, the Greenway along Science Drive and the Cattle Drive Promenade will be designed with landscaped elements to control stormwater flow into the system, to maximize the use of stormwater for irrigation and to reduce phosphorous run-off.
Private Utilities
The ERC will also be served by private telecommunications, gas and electrical utilities. Harvard has identified corridors for these utilities and will coordinate with the utility companies for the installation of these systems.
DEF Utility Systems
In addition to the BWSC systems, Harvard has begun construction of a set of thermal utilities to support the SEC project. These utilities will run on an east-west alignment through the ERC and will constitute the first part of a loop that will eventually extend from the DEF on East Drive into and through the Harvard IMP area to the north of Western Avenue. This project will also include new university-owned electric and telecommunications systems, as well as sanitary, water, and gas connections to the DEF. The PDA Master Plan includes below-grade utility lines running from the DEF to institutional and non-institutional buildings in the vicinity.
8.0 Effect of PDA Master Plan
Zoning
The PDA Area is located within the Allston Landing North Economic Development Area, which is governed by Article 51 of the Zoning Code. There is an Institutional Master Plan overlay district applicable to a portion of the PDA Area. As shown on the Survey, Exhibit B, the PDA Area contains more than five acres of land, and since it is not located in a residential zoning district, treating this submission as a Master Plan is authorized by Article 3-1A.a of the Zoning Code.
This PDA Master Plan sets forth the zoning for all elements of the Proposed Project for the PDA Area. Upon approval by the Boston Planning and Development Agency and the Boston Zoning Commission, any PDA Development Plan for a Proposed Project within the PDA Area that is consistent with this PDA Master Plan will be presumed to be consistent with underlying zoning and all other provisions of the Zoning Code to the extent that such requirements are made applicable and have been addressed in this PDA Master Plan or a subsequent PDA Development Plan.
Parcels
The PDA Area is an assembly of various legal lots which were acquired by Harvard over a period of time. In order to implement the Project, it is contemplated that new legal lots will be created and one or more may be leased or conveyed to third parties.
Notwithstanding that lots may be in separate legal ownership and separated by streets, the dimensional requirements and Floor Area Ratio set forth in this PDA Master Plan shall apply to the PDA Area as a whole and not to each individual lot and a Certification of Consistency may be issued for each separate building; provided that non-compliance by a particular building shall not

PDA Master Plan 13 Enterprise Research Campus
affect compliance by any other currently existing building or a building for which a Certification of Consistency has been issued.
Development Review
Each building component of the Proposed Project within the PDA Area will undergo review as required by Article 80 of the Zoning Code, as well as design review subsequent to the submission of one or more PDA Development Plans for the Proposed Project. Review of environmental impacts will be studied during the Article 80-B Large Project Review process, taking into account the technical studies already performed. Among other matters, transportation impacts will be updated as needed if the proposed building on a Project Site is not consistent with the building envelope and program uses studied in Exhibit F, the Transportation Impact Study.
The Proposed Project will also be subject to review under Articles 28 (Boston Civic Design Commission review) and 37 (Green Buildings) of the Zoning Code.

PDA Master Plan Enterprise Research Campus Fact Sheet
FACT SHEET FOR
MASTERPLAN For
PLANNED DEVELOPMENT AREA NO. 115
HARVARD ENTERPRISE RESEARCH CAMPUS Western Avenue, Boston
Dated: December 6, 2017
I. Proponent President and Fellows of Harvard College
II. Project Location The PDA Area is an approximately 14.1 acre parcel of land, bounded generally by Western Avenue on the north, the Harvard property which is ground-leased to Sanofi Genzyme on the east, the Harvard University District Energy Facility (“DEF”) on the southeast, and Harvard property west of Hague Street on the west.
III. Development Concept The PDA Master Plan proposes the construction of multiple buildings that comprise the Proposed Project, described conceptually below:
• 400,000 square feet of office/lab space;
• 250,000 square feet of hotel/conference center space;
• 250,000 square feet of residential space; and
• A total of between 800 and 900 parking spaces in a combination of below-grade and at-grade, surface spaces.
The PDA Master Plan also includes two public spaces currently envisioned to be located on the south side of the office/lab buildings. These spaces will connect to the west to the network of open spaces beginning behind the Honan-Allston Branch Library at Ray Mellone Park and extending eastward through Rena Park to the green courtyard spaces of Harvard’s Science and Engineering Complex (“SEC”).
In addition, the PDA Master Plan includes new roadways and access driveways. The most significant of these is Cattle Drive, a new north-south roadway which will provide access into and through the PDA Area. As depicted in the Framework Plan, in the long-term Cattle Drive will provide a through connection from Western Avenue to Cambridge Street and on to the future West Station commuter rail stop.

PDA Master Plan Enterprise Research Campus Fact Sheet
IV. Project Uses Allowed uses for the PDA Area and Project Sites include, among others, office, laboratory, residential, hotel, and retail and/or restaurant. In addition, a limited amount of Institutional Use will be allowed in the Proposed Project. Uses will also include below-grade and at-grade accessory parking for all types of uses as set forth in the "Parking" section of this PDA Master Plan. Roadways constructed within the PDA Area are expected to serve the PDA uses and adjacent uses, including institutional uses. There will also be below-grade utility lines running from the District Energy Facility to institutional and non-institutional buildings in the vicinity.
V. Public Benefits The development of the Proposed Project contemplated by this PDA Master Plan will provide a range of public benefits, including:
• Increased and improved public space which connects to a broader network of open spaces;
• New affordable housing units in connection with any residential development that comply with the City’s requirements;
• Housing and job linkage payments from qualifying uses;
• New construction and permanent jobs;
• Increased tax revenues for the City;
• Area-wide stormwater improvements through the extension of a major new stormwater line through the ERC to a new outfall to the north of the River Street Bridge;
• Environmental benefits, including additional tree canopy and decreased urban heat island effect; and
• Transportation improvements.
The specific project benefits associated with each component of the Proposed Project shall be included in the PDA Development Plan for such project.

Exhibit A
Figure Depicting Framework Plan Area and PDA Area

ENTERPRISE RESEARCH CAMPUS Planned Development Area Master Plan Exhibits
Figure Depicting Framework Plan Area and PDA Area
0 250' 500' 1000'
PDA PLAN FRAMEWORK PLAN BLOCKS Framework Plan blocks illustrate potential development envelopes.Buildings and site landscape will be designed within blocks.

Exhibit B
Legal Description and Survey Plan of PDA Area

LEGAL DESCRIPTION OF PROPOSED PLANNED DEVELOPMENT AREA (PDA)
A parcel of land in the Allston district of the City of Boston, County of Suffolk, Commonwealth of Massachusetts, being shown as Proposed Planned Development Area on a plan titled “Proposed PDA Parcel, 100 Western Avenue, Boston (Allston), Massachusetts, Prepared for Harvard Planning Office”, dated October 9, 2017 by WSP and recorded with Suffolk County Registry of Deeds in Plan Book 2017 Plan No.____ further bounded and described as follows: Commencing from a concrete bound on the southerly sideline of Western Avenue, said concrete bound being 119± feet west of Soldiers Field Road; thence, S 83°29’59” W, a distance of 329.02 feet along the southerly sideline of Western Avenue to the point of beginning, said point being the northeast corner of the parcel herein described; thence, S 02º30’04” E a distance of six hundred twenty-eight and seventy-six hundredths feet
(628.76’) to a point; thence, S 87º29’56” W a distance of three hundred twenty-two and nighty-eight hundredths feet
(322.90’) to a point; thence, S 06º29’33” E a distance of two hundred seventy-one and sixty-five hundredths feet
(271.65’) to point; thence,
S 87º29’56” W a distance of four hundred sixty-six and sixty-five hundredths feet (466.65’) to a point; thence,
N 06º39’10” W a distance of eight hundred forty-two and seventy-four hundredths feet (842.74’) to a point on the southerly sideline of Western Avenue; thence,
N 83º20’50” E a distance of four hundred seven and thirty-six hundredths feet (407.36’)
along the southerly sideline of Western Avenue to a point; thence, N 83º29’59” E a distance of four hundred twenty-six and forty hundredths feet (426.40’)
along the southerly sideline of Western Avenue to the point of beginning. Containing an area of 613,305± square feet or 14.08± acres.


Exhibit C
Site Plan Showing Proposed Project

ENTERPRISE RESEARCH CAMPUS Planned Development Area Master Plan Exhibits
Site Plan Showing Proposed Projects
PDA AREA (~14 ACRES)
DEVELOPMENT PADS
Office/Lab
Residential
Hotel&ConferenceCenter
ActiveGroundFloor
PUBLIC SPACE
SURFACE PARKING
0 100' 200' 300' 400'

Exhibit D
Illustrative Site Plan of PDA Area

ENTERPRISE RESEARCH CAMPUS Planned Development Area Master Plan Exhibits
Illustrative Plan of PDA Area
Reed Hilderbrand
WESTERN AVE
CATTLE D
R
EA
ST D
R
0 100' 200' 300' 400'

Exhibit E
Table of Allowed Uses

Table of Allowed Uses
Use Category Uses
Hotel and Conference Center Conference Center; Executive Suites; Hotel
Office Agency or professional office; General office; Office of wholesale business
Open space Open space
Research and Development Research laboratory; Product development; prototype development
Residential Multi-family dwelling
Restaurant Restaurant; Take-out restaurant (small or large)
Retail Bakery; General retail; Local retail business
Service Barber or beauty shop; Caterer’s establishment; Dry-cleaning shop; Shoe repair; Tailor shop

Exhibit F
Transportation Impact Study

Harvard ERC PDA – Transportation Impact Study
Transportation Impact Study Harvard Enterprise Research Campus Planned Development Area
PREPARED FOR Harvard Planning Office Smith Campus Center, 5th Floor 1350 Massachusetts Avenue Cambridge, MA 02138 617.496.1999
PREPARED BY
101 Walnut Street PO Box 9151 Watertown, MA 02471 617.924.1770
DECEMBER 2017

Harvard ERC PDA – Transportation Impact Study
i Table of Contents
Table of Contents
Introduction .................................................................................................................................................... 1
1.1 Project Description .......................................................................................................................................................... 1 1.2 Study Area ........................................................................................................................................................................... 3 1.3 Study Methodology ........................................................................................................................................................ 3 1.4 Summary of Key Findings ............................................................................................................................................. 4 1.5 MassDOT I-90 Allston Interchange Improvement Project Compatibility .................................................. 5
2017 Existing Conditions ............................................................................................................................... 7
2.1 Vehicle Conditions ........................................................................................................................................................... 7 2.1.1 Roadway Network .......................................................................................................................................... 7 2.1.2 Study Area Intersections .............................................................................................................................. 9 2.1.3 Existing Traffic Volumes ............................................................................................................................ 13 2.1.4 Parking ............................................................................................................................................................. 16 2.1.5 Truck Routes/Freight Network ............................................................................................................... 18
2.2 Transit Conditions ......................................................................................................................................................... 18 2.3 Bicycle Conditions ......................................................................................................................................................... 21 2.4 Pedestrian Conditions ................................................................................................................................................. 25 2.5 Crash Analysis ................................................................................................................................................................. 29
2022 Future Conditions ............................................................................................................................... 32
3.1 2022 No-Build Conditions ......................................................................................................................................... 32 3.1.1 Regional Traffic Growth ............................................................................................................................. 33 3.1.2 Planned Developments .............................................................................................................................. 33 3.1.3 2022 No-Build Conditions Traffic Volumes ....................................................................................... 36 3.1.4 Future Roadway Conditions..................................................................................................................... 39
3.2 2022 Build Conditions ................................................................................................................................................. 39 3.2.1 Project Infrastructure .................................................................................................................................. 40 3.2.2 Unadjusted ITE Vehicle Trips ................................................................................................................... 43 3.2.3 Person Trips .................................................................................................................................................... 43 3.2.4 Internal Capture Trips ................................................................................................................................. 44 3.2.5 Mode Share .................................................................................................................................................... 44 3.2.6 Adjusted Project Trips ................................................................................................................................ 45 3.2.7 Project-Generated Trips ............................................................................................................................ 45 3.2.8 Project-Generated Trip Comparison .................................................................................................... 46 3.2.9 Vehicular Trips ............................................................................................................................................... 47 3.2.10 Transit Trips .................................................................................................................................................... 52 3.2.11 Parking ............................................................................................................................................................. 53

Harvard ERC PDA – Transportation Impact Study
ii Table of Contents
Operations Analysis ..................................................................................................................................... 54
4.1 Vehicular Operations Analysis ................................................................................................................................. 54 4.2 Transit Operations Analysis ....................................................................................................................................... 64
Transportation Mitigation .......................................................................................................................... 68
5.1 Transportation Demand Management ................................................................................................................. 68 5.2 Roadway and Intersection Improvements .......................................................................................................... 69
5.2.1 Signal Timing Optimization ..................................................................................................................... 69 5.2.2 Western Avenue Corridor ......................................................................................................................... 70 5.2.3 Neighborhood Roadways ......................................................................................................................... 72
5.3 Transit ................................................................................................................................................................................ 73

Harvard ERC PDA – Transportation Impact Study
iii Table of Contents
List of Tables
Table No. Description Page
Table 1 Project Program .......................................................................................................... 3
Table 2 Transit Service Summary .......................................................................................... 20
Table 3 Intersection Crash Summary (2010‐2014) ................................................................ 31
Table 4 Signal Warrant Analysis Summary ............................................................................ 41
Table 5 Unadjusted ITE Vehicle Trips .................................................................................... 43
Table 6 Person Trips .............................................................................................................. 44
Table 7 Mode Share .............................................................................................................. 45
Table 8 Project‐Generated Trips by Mode ............................................................................ 45
Table 9 Project‐Generated Vehicle Trips by Use ................................................................... 46
Table 10 Project‐Generated Vehicular Trip Comparison ........................................................ 47
Table 11 Vehicular Trip Distribution ........................................................................................ 48
Table 12 Transit Trip Distribution ............................................................................................ 52
Table 13 Project‐Generated Transit Trips ............................................................................... 52
Table 14 Required Vehicle Parking .......................................................................................... 53
Table 15 Required Bicycle Parking .......................................................................................... 53
Table 16 Level of Service Criteria ............................................................................................ 55
Table 17 Signalized Intersection Capacity Analysis ................................................................. 57
Table 18 Unsignalized Intersection Capacity Analysis ............................................................. 63
Table 19 MBTA Bus Frequency and Capacity .......................................................................... 65
Table 20 MBTA Bus Policy Capacity Analysis ........................................................................... 66
Table 21 Signalized Intersection Capacity Analysis with Mitigation ....................................... 70
Table 22 Unsignalized Intersection Capacity Analysis with Mitigation ................................... 72

Harvard ERC PDA – Transportation Impact Study
iv Table of Contents
List of Figures
Figure No. Description Page
Figure 1 Project Site Context .................................................................................................... 2
Figure 2 Study Area Intersections ........................................................................................... 11
Figure 3 Intersection Geometry and Traffic Control .............................................................. 12
Figure 4a 2017 Existing Conditions Weekday AM Vehicle Peak Hour Traffic Volumes ........... 14
Figure 4b 2017 Existing Conditions Weekday PM Vehicle Peak Hour Traffic Volumes ............ 15
Figure 5 Existing On‐Street Parking and Curb Use Inventory ................................................. 17
Figure 6 Public Transportation ............................................................................................... 19
Figure 7 Existing Bicycle Facilities ........................................................................................... 22
Figure 8a 2017 Existing Conditions Weekday AM Bicycle Peak Hour Traffic Volumes ............ 23
Figure 8b 2017 Existing Conditions Weekday PM Bicycle Peak Hour Traffic Volumes ............ 24
Figure 9 Existing Pedestrian Facilities ..................................................................................... 26
Figure10a 2017 Existing Conditions Weekday AM Pedestrian Peak Hour Traffic Volumes ...... 27
Figure 10b 2017 Existing Conditions Weekday PM Pedestrian Peak Hour Traffic Volumes ...... 28
Figure 11 Background Development Projects .......................................................................... 35
Figure 12a 2022 No‐Build Conditions Weekday Am Vehicle Peak Hour Traffic Volumes .......... 37
Figure 12b 2022 No‐Build Conditions Weekday PM Vehicle Peak Hour Traffic Volumes .......... 38
Figure 13 Conceptual Site Plan ................................................................................................. 42
Figure 14 Trip Distribution ........................................................................................................ 49
Figure 15a 2022 Build Conditions Weekday AM Vehicle Peak Hour Traffic Volumes ................ 50
Figure 15b 2022 Build Conditions Weekday PM Vehicle Peak Hour Traffic Volumes ................ 51

Harvard ERC PDA – Transportation Impact Study
1 Introduction
1 Introduction Vanasse Hangen Brustlin, Inc. (VHB), on behalf of Harvard Planning Office (HPO), has conducted a transportation impact study for the proposed mixed-use development to be located within Harvard’s planned Enterprise Research Campus (ERC) in Allston. This study supports a Planned Development Area (PDA) Master Plan filing for approximately 14 acres within the ERC. The PDA within the ERC is located south of Western Avenue between Hague Street and the existing Genzyme driveway. This study quantifies existing and projected future transportation conditions, and identifies potential improvements within the Project Study Area.
The PDA Master Plan filing discusses both the ERC PDA and a longer-term ERC Framework Plan that considers a broader context and includes a timeframe and a geography beyond that of the PDA. The Framework Plan is presented for context only and not for regulatory approval. The ERC PDA projects discussed in this study are consistent with the longer-term vision presented in the Framework Plan.
1.1 Project Description The Project Site is located within the parcel known as Allston Landing North (also known as the Romar Parcel). Figure 1 shows the Project Site and surrounding context.

Project Site Context
Harvard ERC PDA Allston, Massachusetts
Figure 1
Source: Google Earth Pro Aerial
0 300 600 Feet
\\vhb\proj\Wat-TS\13581.04 WO4 - ERC Ph-1 Trans Sup\graphics\FIGURES\Harvard ERC Figures.indd p1 09/18/17
90INTERSTATE
Charles River
Charles R
iver
Soldiers Field Rd
Sold
iers
Fie
ld R
d
Mem
orial Dr
Memorial Dr
N. Harv
ard St
N. Harvard St
Western Ave Hague St
Windom
St
Seattle St
Hopedale St
Hooker St
Bayard St
Easton St
Coolidge Rd
Batten Way
Kresge Way
Harvard Way
Gordon Rd
Bertram St
Spurr St
Cambridge St
Kingsley St
Rena St
Genzym
e Dw
y
Travis St
3
3
ERC PDA

Harvard ERC PDA – Transportation Impact Study
3 Introduction
The Project involves the construction of approximately 900,000 square feet (sf) of mixed-use development within the ERC PDA. The development would be supported by 800 to 900 parking spaces, provided in structured and surface parking areas. Table 1 summarizes the proposed development program.
Table 1 Project Program
Land Use Size Office/Lab 400,000 sf Residential 250,000 sf (250 units) Hotel a 250,000 sf (200 rooms)
a The hotel portion of the development was included in Harvard University’s 2013 Institutional Master Plan.
Under the proposed Project, roadway improvements would be implemented to support the ERC PDA and limit reliance on neighborhood streets, particularly Windom Street. Access to the Project Site would be provided to Western Avenue by two new north-south roadways, Cattle Drive and East Drive, and to Cambridge Street by a temporary extension of Cattle Drive to Cambridge Street that would be achieved by reconfiguring Dedham Parrish Road and a short section of Windom Street. Future connections to Cambridge Street would be coordinated with the Massachusetts Department of Transportation’s (MassDOT) I-90 Allston Interchange Improvement Project.
1.2 Study Area The Project Study Area is bound by North Harvard Street to the west and northwest, Soldiers Field Road to the east and northeast, and Cambridge Street to the south. Prior to beginning the study, the Project Study Area was discussed with Boston Transportation Department (BTD) and Boston Planning and Development Agency (BPDA).
1.3 Study Methodology This transportation assessment has been conducted in three stages. The first stage involved an assessment of existing transportation conditions within the Project Study Area, including an inventory of existing roadway geometry, observations of traffic flow, daily and peak period traffic counts, a review of multimodal conditions and a review of safety in the Project Study Area.
The second stage of the study established the framework for evaluating the transportation impacts of the proposed Project. Future traffic demands on the Project Study Area roadways due to projected background traffic growth and other proposed area development that may occur independent of the proposed development were assessed. The year 2022, a five-year time horizon, was selected as the future analysis year for the preparation of this transportation impact assessment in consultation with BTD and BPDA to reflect a condition prior to the completion of the MassDOT I-90 Allston Interchange Improvement Project.

Harvard ERC PDA – Transportation Impact Study
4 Introduction
The third stage involved conducting transportation analyses to identify both existing and projected future roadway and transit capacities and demands. These analyses were used as the basis for determining potential Project impacts and to identify mitigation measures that could be implemented.
1.4 Summary of Key Findings The transportation assessment examined existing and future traffic operations at ten existing and one new intersection; evaluated existing and future transit operations; described existing and proposed bicycle and pedestrian networks; and analyzed the most recent MassDOT crash data. The analysis assumes that the proposed MassDOT I-90 Allston Interchange Improvement Project has not been completed before the ERC PDA program. Key findings indicate the following:
› Based on the most recent MassDOT crash data from 2010 to 2014, two Study Area intersections have crash rates that exceed the average crash rates for District 6: North Harvard Street/Anderson Bridge at Soldiers Field Road and Cambridge Street at I-90 Ramps/Soldiers Field Road. MassDOT has ungraded the first location as part of the recently completed Anderson Bridge project and has an on-going construction project to improve the second location, which will be further improved as part of the I-90 Allston Interchange Improvement Project.
› Four signalized Project Study Area intersections are projected to operate at LOS E/F under the 2022 No-Build Conditions and will operate with increased delay with the addition of the ERC PDA program trips during weekday morning and/or evening peak hours. Traffic operations can be mitigated through signal timing adjustments at these intersections.
› The unsignalized intersection of Western Avenue at Kresge Way/Genzyme Driveway/East Drive’s northbound approach is projected to operate at LOS F under the 2022 No-Build Conditions and will operate with increased delay with the addition of the ERC PDA program trips during both the weekday morning and evening peak hours. The provision of a second lane for the East Drive northbound approach to Western Avenue will improve conditions for vehicles making right-turns. Traffic volumes will be monitored under future conditions to determine if the intersection meets signal warrants. It is anticipated that accommodations for a future traffic signal would be considered at this location as part of streetscape improvements to Western Avenue.
› Transit operational analysis included five MBTA bus routes that operate through or near the Project Study Area. Under the 2022 No-Build Conditions, estimated transit ridership demand can be accommodated by the existing scheduled capacity for all bus routes with the exception of the Route 66 outbound and Route 86 outbound. Under the 2022 Build Conditions, the trips generated by the ERC PDA program have a slight impact on bus capacities: in addition to the Route 66 outbound and Route 86 outbound, the Route 70 outbound and the Route 70A inbound are expected to exceed the MBTA policy capacity during the weekday morning and weekday evening peak hours, respectively. These impacts

Harvard ERC PDA – Transportation Impact Study
5 Introduction
can be mitigated by providing ERC PDA tenants and residents access to Harvard University shuttle service in Allston and coordination with the MBTA to improve service.
› A new traffic signal is warranted at the intersection of Cattle Drive and Western Avenue. Signal progression and phasing and accommodations for all modes at the intersection should be furthered evaluated in consultation with BTD.
› As compared to existing conditions, the proposed Cattle Drive Extension will divert approximately 700 vehicles from Windom Street during the weekday morning peak hour and over 500 vehicles during the weekday evening peak hour.
› The 2022 Build Conditions analysis assumes the existing signal at Western Avenue and Batten Way is maintained with the discontinuation of Hague Street. Further review and discussion with BTD is necessary to determine potential modifications to pedestrian crossing locations, stop bar locations, and signal equipment. In addition, vehicle and pedestrian traffic volumes will be monitored to determine if the intersection continues to meet signal warrants in the future.
› In addition to the previously noted mitigation, a Transportation Demand Management (TDM) program will be implemented as part of the Project.
1.5 MassDOT I-90 Allston Interchange Improvement Project Compatibility MassDOT’s I-90 Allston Interchange Improvement Project will replace the Allston Viaduct and reduce the footprint of the existing Allston Interchange that is located on Harvard University-owned property. The project limits extend from Harvard University’s property line in the south to Cambridge Street and the existing I-90 Allston interchange ramps in the north. The current interchange concept is included in the Appendix and includes1:
› Complete streets improvements to Cambridge Street, which will be brought to surface level east of Windom Street, potentially eliminating the need to connect the Cattle Drive Extension to Windom Street.
› Enhanced bicycle and pedestrian connectivity on the new streets and paths along the Charles River.
› A significant transit enhancement in the form of West Station which will create a new intermodal focal point for rail and bus service.
› A realigned I-90 mainline, straightened to take full advantage of the safety enhancements made possible by All-Electronic Tolling (AET).
› A replaced I-90 Allston Viaduct to ensure that this section of a critical regional highway can continue to safely and efficiently carry traffic to and from Boston.
1 http://www.massdot.state.ma.us/highway/HighlightedProjects/AllstonI90InterchangeImprovementProject.aspx, accessed
September 2017.

Harvard ERC PDA – Transportation Impact Study
6 Introduction
› Connecting roadways between Cambridge Street and I-90 built, to the fullest extent practical and safe, on complete streets principles to clearly signal to motorists leaving the highway that they are entering a community.
Harvard University has been working collaboratively with the MassDOT I-90 Allston Interchange Improvement Project design team, its Task Force, and the City of Boston throughout the planning process to refine the roadway network and multimodal accommodations in the 2040 Design Year conceptual plan. The roadway alignments of Cattle Drive and East Drive within the ERC PDA are consistent with the future alignment of these roadways under MassDOT’s current 2040 Design Year plan. As Harvard University continues to refine multimodal accommodations within the ERC, they are committed to working in concert with MassDOT to ensure compatibility with longer-term interchange improvement plans.

Harvard ERC PDA – Transportation Impact Study
7 2017 Existing Conditions
2 2017 Existing Conditions Evaluation of the transportation impacts associated with the proposed Project requires a thorough understanding of the existing transportation system in the Project Study Area. A complete inventory and evaluation of the existing transportation system in the Project Study Area was conducted. The analysis of existing transportation conditions is based on the existing roadway network, roadway/intersection geometry, traffic control, peak hour traffic volumes, parking, public transportation, bicycle and pedestrian accommodations, and traffic safety conditions.
2.1 Vehicle Conditions The Project Site is in the Allston neighborhood of Boston with direct access to the major roadway arterials, public transit alternatives and a vast system of sidewalks and bike accommodations to connect the Site with the surrounding community and adjacent neighborhoods. The following sections provide details on the existing transportation infrastructure supporting the Project Site.
2.1.1 Roadway Network The Project Study Area is bounded by North Harvard Street to the west and northwest, Soldiers Field Road to the east and northeast, and Cambridge Street to the south. Western Avenue bisects the Project Study Area, intersecting with North Harvard Street in the west and Soldiers Field Road in the east.
› North Harvard Street – North Harvard Street is generally oriented in the north/south direction extending from Cambridge Street to Soldiers Field Road

Harvard ERC PDA – Transportation Impact Study
8 2017 Existing Conditions
within the Project Study Area. The roadway accommodates two-way traffic with one lane in each direction. North Harvard Street transitions from a Neighborhood Main Street to a Neighborhood Connector at Barry’s Corner (Western Avenue at North Harvard Street). South of Barry’s Corner the abutting land uses are primarily residential with a mix of commercial/retail and community centers (e.g., Honan-Allston Library) and north of Barry’s Corner the abutting land uses are primarily Harvard University related uses. Sidewalks are provided along both sides of the roadway and crosswalks are provided at all signalized intersections. Bike lanes are provided along both directions of the street between Cambridge Street and Soldiers Field Road, except for the use of shared lane markings (“sharrows”) on the northbound approach to Western Avenue intersection. On-street parking south of Barry’s Corner is generally restricted to residential permitted parking with the exception of a few short sections along the roadway that are dedicated to handicap and two-hour parking. On-street parking north of Barry’s Corner consists of a few sections of two-hour parking. The posted speed limit along North Harvard Street is 25 miles per hour (mph).
› Western Avenue - Western Avenue is an east/west roadway extending from North Harvard Street to Soldiers Field Road within the Project Study Area. The roadway accommodates two-way traffic with one lane in each direction. Western Avenue transitions from a Neighborhood Main Street to a Neighborhood Connector at Barry’s Corner. East of Barry’s Corner, the abutting land uses are primarily Harvard University related uses to the north. Land uses to the south of Western Avenue include Harvard University’s Science and Engineering Complex (SEC) (currently under construction), the Project Site, and Genzyme. Sidewalks are provided along both sides of the roadway and crosswalks are provided at all signalized intersections. Bike lanes and buffered bike lanes are provided along the street as it passes through the Study Area. It should be noted that there is on-going construction on Western Avenue from east of Travis Street to west of Batten Way related to enabling roadway work for the SEC. Two-way traffic is maintained along the roadway; however, the roadway, sidewalks, and bicycle lanes are being reconstructed. Additionally, parking is restricted along both sides of the roadway from North Harvard Street to Soldiers Field Road. The posted speed limit within the construction area is 25 mph, and there is no posted speed limit outside of the construction area within the Project Study Area.
› Cambridge Street – Cambridge Street is an east/west roadway extending from North Harvard Street to Soldiers Field Road within the Project Study Area. The roadway accommodates two-way traffic with two lanes in each direction. Cambridge Street is an urban principal arterial that has the characteristics of a Neighborhood Connector. The street is abutted by a mix of residential, commercial/retail, industrial and transportation infrastructure uses. Cambridge Street provides regional access to and from I-90 via a major highway interchange at Soldiers Field Road. Sidewalks are provided along both sides of the roadway. Crosswalks are provided at the signalized intersections of North Harvard Street, Windom Street, Soldiers Field Road, and the I-90 on/off ramps. Bike lanes and buffered bike lanes are provided along the street as it passes through the Study

Harvard ERC PDA – Transportation Impact Study
9 2017 Existing Conditions
Area. On-street parking is generally prohibited on either side of Cambridge Street, within the Project Study Area, with the exception of an unregulated section of parking west of Seattle Street. It should be noted that the section of Cambridge Street from the I-90 Ramps to Soldiers Field Road is currently under construction and there is no lane striping on this section. This construction project is discussed in a subsequent section.
› Charles River Crossings Anderson Memorial Bridge – North Harvard Street transitions to the
Anderson Bridge at its intersection with Soldiers Field Road. The Anderson Bridge accommodates two-way traffic with one lane in the southbound direction and two lanes in the northbound direction. Bicycle lanes are provided in both the northbound and southbound directions. Sidewalks are also provided along both sides of the roadway. The Anderson Bridge provides access to and from Cambridge and Harvard Square to the north.
Western Avenue Bridge – Western Avenue transitions to the Western Avenue Bridge at its intersection with Soldiers Field Road. The Western Avenue Bridge accommodates one-way traffic with three lanes in the westbound direction. The Western Avenue Bridge and River Street Bridge function as a one-way pair. Sidewalks are provided along both sides of the roadway. The Western Avenue Bridge provides access from Cambridge and Central Square from the east.
River Street Bridge – Cambridge Street transitions to the River Street Bridge at its intersection with Soldiers Field Road. The River Street Bridge accommodates one-way traffic with three lanes in the eastbound direction. The Western Avenue Bridge and River Street Bridge function as a one-way pair. Sidewalks are provided along both sides of the roadway. The River Street provides access to Cambridge and Central Square to the east.
2.1.2 Study Area Intersections The Project Study Area includes ten key existing intersections, as illustrated in Figure 2:
1. North Harvard Street at Soldiers Field Road (signalized) 2. North Harvard Street at Western Avenue (signalized) 3. North Harvard Street at Spurr Street/Bertram Street (unsignalized) 4. Cambridge Street at North Harvard Street (signalized) 5. Cambridge Street at Windom Street (signalized) 6. Cambridge Street at I-90 Ramps/Double Tree Hotel (signalized) 7. Cambridge Street at Soldiers Field Road (signalized) 8. Western Avenue at Soldiers Field Road (signalized) 9. Western Avenue at Kresge Way/Genzyme Driveway (unsignalized) 10. Western Avenue at Batten Way/Hague Street (signalized) 11. Western Avenue at Cattle Drive (2022 Build Conditions only)

Harvard ERC PDA – Transportation Impact Study
10 2017 Existing Conditions
The intersection geometry and traffic control for the Project Study Area intersections are shown in Figure 3.

Study Area Intersections
Harvard ERC PDA Allston, Massachusetts
Figure 2
Source: Google Earth Pro Aerial
0 300 600 Feet
\\vhb\proj\Wat-TS\13581.04 WO4 - ERC Ph-1 Trans Sup\graphics\FIGURES\Harvard ERC Figures.indd p2 09/18/17
10
1
2
8
76
5
4
3
90INTERSTATE
Charles River
Charles R
iver
Soldiers Field Rd
Sold
iers
Fie
ld R
d
Mem
orial Dr
Memorial Dr
N. Harv
ard St
N. Harvard St
Western Ave Hague St
Windom
St
Seattle St
Hopedale St
Hooker St
Bayard St
Easton St
Coolidge Rd
Batten Way
Kresge Way
Harvard Way
Gordon Rd
Bertram St
Spurr St
Cambridge St
Kingsley St
Rena St
Genzym
e Dw
y
Travis St
North Harvard Street at Soldiers Field RoadNorth Harvard Street at Western AvenueNorth Harvard Street at Spurr Street/Bertram StreetCambridge Street at North Harvard StreetCambridge Street at Windom StreetCambridge Street at I-90 Ramps/Double Tree HotelCambridge Street at Soldiers Field RoadWestern Avenue at Soldiers Field RoadWestern Avenue at Kresge Way/Genzyme DrivewayWestern Avenue at Batten Way/Hague Street
Signalized Intersection
Unsignalized Intersection
#
3
10
7
8
9
#
2
65
1
4
9
3
3
ERC PDA

Stop Controlled Approach
Cambridge St.
N
.
H
a
r
v
a
r
d
S
t
.
I-9
0 O
n-R
am
p
I
-
9
0
O
f
f
-
R
a
m
p
I
-
9
0
O
f
f
-
R
a
m
p
Do
ub
le
tre
e H
ote
l D
wy
.
Cambridge St.
So
ld
ie
rs
F
ie
ld
R
oa
d
Western Ave.
Win
do
m S
t.
Spurr St. Bertram St.
Western Ave.
Ba
tte
n W
ay
Kre
sg
e W
ay
Ha
gu
e S
t.
S
o
l
d
i
e
r
s
F
i
e
l
d
R
o
a
d
N. H
arv
ard
S
t.
Ge
nzy
me
D
wy
.
S
S S
S S SS
S
Signalized Intersection
S
\\vhb\proj\Wat-TS\13581.04 WO4 - ERC Ph-1 Trans Sup\graphics\FIGURES\Networks.dwg
Figure 3Study Area IntersectionLane Geometry and Traffic Control Harvard ERC PDA Allston, Massachusetts
Not to Scale

Harvard ERC PDA – Transportation Impact Study
13 2017 Existing Conditions
2.1.3 Existing Traffic Volumes Traffic data was collected for all the Project Study Area intersections for the weekday morning and weekday evening peak hours on Wednesday, April 12, 2017, which represents a typical day for traffic count purposes (non-holiday) while schools were in session. Based on the compiled vehicular traffic data from the Project Study Area intersections, the existing weekday morning peak hour occurs between 7:30 AM and 8:30 AM, while the existing weekday evening peak hour occurs between 4:45 PM and 5:45 PM. The traffic data is included in the Appendix.
2.1.3.1 Seasonal Variation
MassDOT historical traffic counts were reviewed to understand the seasonality of traffic count data collected in the month of April. The statewide data for seasonal variation of traffic volumes indicate that traffic counts in April are generally higher (by as much as eight percent) than the average month. Since the April count data were found to be higher than annual average conditions, no seasonal adjustment factors were applied to the data. The MassDOT seasonal factors are included in the Appendix.
Figures 4a and 4b represent the 2017 Existing Conditions vehicular weekday morning and weekday evening peak hour traffic volumes, respectively.

Cambridge St.
N
.
H
a
r
v
a
r
d
S
t
.
I-90 O
n-R
am
p
I
-
9
0
O
f
f
-
R
a
m
p
160
190
40
115
135
25
130
255
5
80
270
60
14
0
33
0
130
1485
305
865
15
23
0
15
540
465
1315
8
3
5
1
5
8
5
195
190
5
n
e
g
15
755
I
-
9
0
O
f
f
-
R
a
m
p
Do
ub
letree H
otel D
wy.
Cambridge St.
So
ld
iers F
ield
R
oad
Western Ave.
Win
do
m S
t.
Spurr St. Bertram St.
Western Ave.
Batten
W
ay
Kresg
e W
ay
Hag
ue S
t.
S
o
l
d
i
e
r
s
F
i
e
l
d
R
o
a
d
N. H
arvard
S
t.
385
Gen
zym
e D
wy.
S
S S
SSSS
S
45
70
5
10
5
15
0
20
5 20
60
110
130
45
70
300
60
285
35
10
neg
15
85
370
25
120
325
35
210
340
890
4
5
3
4
5
6
5
1
5
1
4
0
3
5
0
2
9
0
1
0
5
5
2
0
5
5
7
0
335
65
100
50
205
330
185
1080
385
5
10
60
25
10
180
19
5
5
5
neg
36
0
10
neg = Negligible
S
Signalized Intersection
5
5
10
5
\\vhb\proj\Wat-TS\13581.04 WO4 - ERC Ph-1 Trans Sup\graphics\FIGURES\Networks.dwg
Figure 4a2017 Existing ConditionsWeekday AM Peak Hour Vehicle Traffic Volumes Harvard ERC PDAAllston, Massachusetts
Not to Scale

Cambridge St.
N
.
H
a
r
v
a
r
d
S
t
.
I-90 O
n-R
am
p
I
-
9
0
O
f
f
-
R
a
m
p
13
5
19
5
30
20
0
22
5
25
90
160
5
70
460
110
225
255
185
1135
290
1125
50
105
15
610
385
1435
9
8
5
1
5
4
5
180
245
n
e
g
5
10
715
I
-
9
0
O
f
f
-
R
a
m
p
Do
ub
letree H
otel D
wy.
Cambridge St.
So
ld
iers F
ield
R
oad
Western Ave.
Win
do
m S
t.
Spurr St. Bertram St.
Western Ave.
Batten
W
ay
Kresg
e W
ay
Hag
ue S
t.
S
o
l
d
i
e
r
s
F
i
e
l
d
R
o
a
d
N. H
arvard
S
t.
470
Gen
zym
e D
wy.
S
S S
SSSS
S
30
610
75
280
50
ne
g
50
20
140
10
11
0
25
17
5
30
500
35
15
ne
g
40
30
430
15
55
475
20
430
445
965
1
0
0
3
2
5
4
0
2
0
2
3
5
2
6
5
2
9
0
2
0
7
5
2
9
0
1
5
1
2
0
27
0
55
11
0
155
255
355
295
1060
385
10
10
50
15
5
225
340
neg
20
10
325 5
neg = Negligible
S
Signalized Intersection
5
5
10
10
10
5
\\vhb\proj\Wat-TS\13581.04 WO4 - ERC Ph-1 Trans Sup\graphics\FIGURES\Networks.dwg
Figure 4b2017 Existing ConditionsWeekday PM Peak Hour Vehicle Traffic Volumes Harvard ERC PDAAllston, Massachusetts
Not to Scale

Harvard ERC PDA – Transportation Impact Study
16 2017 Existing Conditions
2.1.4 Parking A limited amount of on-street parking is available along North Harvard Street and Cambridge Street within the Project Study Area. Along North Harvard Street, two-hour parking is provided on sections north of Barry’s Corner, along a short section near Easton Street, and along a short section north of Gordon Road. Handicap parking along North Harvard Street is provided in front of the Honan-Allston Library and to the north of Gordon Road. Along Cambridge Street, unregulated parking can be found along a short section in the westbound direction west of Seattle Street. Due to construction activities related to enabling roadway work for the SEC, the parking lane along Western Avenue in the eastbound direction is currently restricted.
A more detailed depiction of the existing on-street parking and curb use inventory within the Project Study Area is provided in Figure 5.

Study Area Intersections
Existing On-Street Parking and Curb Use Inventory
Figure 5
Source: Google Earth Pro Aerial
0 300 600 Feet
\\vhb\proj\Wat-TS\13581.04 WO4 - ERC Ph-1 Trans Sup\graphics\FIGURES\Harvard ERC Figures.indd p3 09/18/17
90INTERSTATE
Charles River
Charles R
iver
Soldiers Field Rd
Sold
iers
Fie
ld R
d
Mem
orial Dr
Memorial Dr
N. Harv
ard St
N. Harvard St
Western Ave Hague St
Windom
St
Seattle St
Hopedale St
Hooker St
Bayard St
Easton St
Coolidge Rd
Batten Way
Kresge Way
Harvard Way
Gordon Rd
Bertram St
Spurr St
Cambridge St
Kingsley St
Rena St
Genzym
e Dw
y
Travis St
No StoppingUnregulated2-Hour Parking2-Hour Parking M-F 8am-6pmResident Permit Parking M-F 8am-6pmBus StopHandicapped Parking
3
3
ERC PDA
Harvard ERC PDAAllston, Massachusetts

Harvard ERC PDA – Transportation Impact Study
18 2017 Existing Conditions
2.1.5 Truck Routes/Freight Network According to an interactive map2 of the trucking network within Massachusetts (per MassDOT website), there is a 24-hour freight restriction for all vehicles 2.5 tons and over on Windom Street from Dedham Parrish Road to north of Hopedale Street. There are also 24-hour freight restriction for all vehicles 2.5 tons and over for several residential streets within the Project Study Area including Kingsley Street, Rena Street, and Hopedale Street. In addition, trucks and buses are restricted from all Department of Conservation (DCR) roadways, including Soldiers Field Road but excluding the frontage roads between the Western Avenue and River Street Bridges. No other roadways within the Project Study Area have exclusions.
2.2 Transit Conditions The MBTA operates five bus routes through or near the Project Study Area:
› Route 64 (Oak Square - Central Square)› Route 66 (Harvard Square - Dudley Station)› Route 70 (Cedarwood/Waltham - Central Square)› Route 70A (North Waltham - Central Square)› Route 86 (Sullivan - Cleveland Circle)
The MBTA bus routes are shown in Figure 6 and are described in more detail in Table 2. The schedules are provided in the Appendix.
The nearest train stations are in Harvard Square and Central Square, which are both approximately one mile (20-minute walk) from the Project Site. Both stations provide access to the MBTA Red Line and other local bus services. The nearest MBTA Commuter Rail station is at Boston Landing, approximately 1.5 miles (30-minute walk) from the Project Site. The Boston Landing station provides access to the Framingham/Worcester line. Access from these stations to the Project Site is provided by transferring to one of the above identified bus lines, walking, or biking.
2 MassDOT Trucking Network (http://gis.massdot.state.ma.us/maptemplate/truckingnetwork), accessed July 2017.

Public Transportation
Harvard ERC PDA Allston, Massachusetts
Figure 6
Source: Google Earth Pro Aerial
0 300 600 Feet
\\vhb\proj\Wat-TS\13581.04 WO4 - ERC Ph-1 Trans Sup\graphics\FIGURES\Harvard ERC Figures.indd p4 09/18/17
90INTERSTATE
Charles River
Charles R
iver
Soldiers Field Rd
Sold
iers
Fie
ld R
d
Mem
orial Dr
Memorial Dr
N. Harv
ard St
N. Harvard St
Western Ave Hague St
Windom
St
Seattle St
Hopedale St
Hooker St
Bayard St
Easton St
Coolidge Rd
Batten Way
Kresge Way
Harvard Way
Gordon Rd
Bertram St
Spurr St
Cambridge St
Kingsley St
Rena St
Genzym
e Dw
y
Travis St
66
66
86
86
70
70
70A
70A
64
64
7070A 64
7070A
XX
Bus Stop
Bus Shelter
MBTA Bus Route
3
3
ERC PDA

Harvard ERC PDA – Transportation Impact Study
20 2017 Existing Conditions
Table 2 Transit Service Summary
MBTA Service Origin/Destination Major Stops Stop Closest to Project Site
Peak Hour Frequency (minutes)
Hours of Service
Weekday Daily Ridership1
Bus Route 64 Oak Square – University Park/Kendall Square
Kendall Square Central Square
Cambridge Street at Seattle Street
12-30 Weekdays: 5:31 AM – 12:53 AM
Saturday: 5:50 AM – 12:58 AM
Sunday: 8:42 AM –
6:59 PM
1,760
Bus Route 66 Harvard Square – Dudley Station
Allston Village Brookline Village Barry’s Corner
Barry’s Corner 9-10 Weekdays: 5:00 AM – 1:31 AM
Saturday: 4:40 AM – 1:29 AM
Sunday: 6:25 AM – 1:33 AM
12,157
Bus Route 70 Cedarwood – University Park
Central Square Arsenal Mall Waltham Commuter Rail Station
Western Avenue at Travis Street
25-30 Weekdays: 5:30 AM – 1:04 AM
Saturday: 5:40 AM – 1:09 AM
Sunday: 6:45 AM – 1:03 AM
5,016
Bus Route 70A Cedarwood – University Park
Central Square Arsenal Mall Waltham Commuter Rail Station
Western Avenue at Travis Street
25-32 Weekdays: 6:10 AM – 8:20 PM
Saturday: 7:55 AM – 8:39 PM
No Sunday Schedule
1,846
Bus Route 86 Sullivan Station – Reservoir (Cleveland Circle)
Harvard Square Barry’s Corner Chestnut Hill
Barry’s Corner 12-15 Weekdays: 5:00 AM – 12:34 AM
Saturday: 5:00 AM – 12:28 AM
Sunday: 7:30 AM – 9:27 PM
5,558
Source: MBTA 2017 Schedules (https://t.mbta.com/schedules/bus), accessed July 2017. 1 Based on weekday boarding totals for 2016 provided by MBTA. 2 Includes Route 70A

Harvard ERC PDA – Transportation Impact Study
21 2017 Existing Conditions
In addition, Harvard University provides shuttle services to enhance connectivity between Allston and Cambridge. Service on both routes is open to Allston residents.
› Allston Campus Express – Provides service between the Allston and Cambridgecampuses during the academic year with limited service during the summer. Thisservice operates as a one-way clockwise loop around the perimeter of the Allstonand Cambridge campuses with stops at One Western, i lab/Batten Hall, Barry’sCorner Athletics, Harvard Square, and other Cambridge locations. Weekdayheadways are 15 minutes, with more limited service provided on evenings andweekends.
› Barry’s Corner – Provides service on a two-way route between Barry’s Corner (atContinuum) and Harvard Square during the academic year with limited serviceduring the summer. Weekday peak period headways are 20 minutes from 7:00 to10:00 AM and from 4:30 to 7:30 PM, with no weekday midday or weekendservice.
2.3 Bicycle Conditions Bicycles facilities and accommodations in the vicinity of the Project Study Area are illustrated in Figure 7. Bicycle accommodations, in the form of bike lanes, shared bike lanes, or cycle tracks, are provided in both directions along North Harvard Street from Soldiers Field Road to Cambridge Street, along Western Avenue from Barry’s Corner to Soldiers Field Road, and along Cambridge Street from North Harvard Street to the end of the Cambridge Street Bridge. The Paul Dudley White Path along the Charles River also serves bicyclists within the Project Study Area.
Bicycle counts were completed during the data collection effort on Wednesday April 12, 2017, which represents a typical day for traffic count purposes (non-holiday) while schools were in session. During the weekday morning and weekday evening peak hours, modest bicycle activity occurs on the roadways within the Project Study Area. Figures 8a and 8b show the 2017 Existing Conditions bicycle volumes for the weekday morning and weekday evening peak hours, respectively.
Bicycle parking is provided at a select number of bus stops along North Harvard Street and Western Avenue. Harvard University provides over 900 covered and uncovered bicycle parking for its employees, students, and visitors on its Allston Campus. Three Hubway regional bike-share stations are located within the Project Study Area at Soldiers Field Park, the HBS i-lab, and Barry’s Corner.
Improvements to Western Avenue bicycle accommodations and other enhancements in relation to the SEC are discussed in Chapter 3.

Existing Bicycle Facilities, Bicycle Parking, and Hubway Locations
Figure 7
Source: Google Earth Pro Aerial
0 300 600 Feet
\\vhb\proj\Wat-TS\13581.04 WO4 - ERC Ph-1 Trans Sup\graphics\FIGURES\Harvard ERC Figures.indd p5 09/18/17
90INTERSTATE
Charles River
Charles R
iver
Soldiers Field Rd
Sold
iers
Fie
ld R
d
Mem
orial Dr
Memorial Dr
N. Harv
ard St
N. Harvard St
Western Ave Hague St
Windom
St
Seattle St
Hopedale St
Hooker St
Bayard St
Easton St
Coolidge Rd
Batten Way
Kresge Way
Harvard Way
Gordon Rd
Bertram St
Spurr St
Cambridge St
Kingsley St
Rena St
Genzym
e Dw
y
Travis St
Bicycle LaneShared Bike LaneMulti-Use PathCycle Track
Hubway StationBike RackCovered Bike Rack
3
3
ERC PDA
Harvard ERC PDAAllston, Massachusetts

Cambridge St.
N
.
H
a
r
v
a
r
d
S
t
.
I-9
0 O
n-R
am
p
I
-
9
0
O
f
f
-
R
a
m
p
I
-
9
0
O
f
f
-
R
a
m
p
Do
ub
le
tre
e H
ote
l D
wy
.
Cambridge St.
So
ld
ie
rs
F
ie
ld
R
oa
d
Western Ave.
Win
do
m S
t.
Spurr St. Bertram St.
Western Ave.
Ba
tte
n W
ay
Ha
gu
e S
t.
S
o
l
d
i
e
r
s
F
i
e
l
d
R
o
a
d
N. H
arv
ard
S
t.
Ge
nzy
me
D
wy
.
S
Signalized Intersection
S
S S
SSSS
S
Kre
sg
e W
ay
0
7
2
0
1
2
8
0
1
0
0
0
3
0
1
3
2
1
1
4
0
1
0
1
36 7
1 24
5
8
20
0
4
10
1
1
1
1
1
0 0 0
1
34
0
0 0 2
1
10
1
1 0 0
0
33
0
17
11
2
0 0 1
1
0 0
1
14
1
21
0
1
3
77
16
31
2
1
1
0
1
0
23
0
0
0
52 0
11
4 3
4
15
0
1
0 2
0
15
0
1
0
0
0
0
0
0
0
12
0 0 0 0 2 0
0 0 2
0
14
0
2
1
42
9
\\vhb\proj\Wat-TS\13581.04 WO4 - ERC Ph-1 Trans Sup\graphics\FIGURES\Networks.dwg
Figure 8a2017 Existing ConditionsWeekday AM Peak Hour Bicycle Traffic Volumes Harvard ERC PDAAllston, Massachusetts
Not to Scale

Cambridge St.
N
.
H
a
r
v
a
r
d
S
t
.
I-9
0 O
n-R
am
p
I
-
9
0
O
f
f
-
R
a
m
p
0
13 2
8 35
0
6
6
0
0
23
10
9 0
3
1
0
6
0
3
0
4
1
0
3
0
0
0
0
5
I
-
9
0
O
f
f
-
R
a
m
p
Do
ub
le
tre
e H
ote
l D
wy
.
Cambridge St.
So
ld
ie
rs
F
ie
ld
R
oa
d
Western Ave.
Win
do
m S
t.
Spurr St. Bertram St.
Western Ave.
Ba
tte
n W
ay
Ha
gu
e S
t.
S
o
l
d
i
e
r
s
F
i
e
l
d
R
o
a
d
N. H
arv
ard
S
t.
Ge
nzy
me
D
wy
.
S
Signalized Intersection
S
S S
SSSS
S
0 0
0 3
0 0 1
0
15
0
0 0 2
1
42
4
0 1 2
0
15
0
3
38
0
2
32
0
0
3
7
0
0
3
9
1
0
0
0
0
0
1
0 8 7
1 1 0
0
6
0
0 0 0
0
1
2
47
0
0
1
2
17 0
1
0
0
Kre
sg
e W
ay
1
3
2
1
5
1
1
1
11
1
1
1
3 1
1
1
3
10
3
2
15
48
12
6
1
\\vhb\proj\Wat-TS\13581.04 WO4 - ERC Ph-1 Trans Sup\graphics\FIGURES\Networks.dwg
Figure 8b2017 Existing ConditionsWeekday PM Peak Hour Bicycle Traffic Volumes Harvard ERC PDAAllston, Massachusetts
Not to Scale

Harvard ERC PDA – Transportation Impact Study
25 2017 Existing Conditions
2.4 Pedestrian Conditions Pedestrian facilities and accommodations in the vicinity of the Project Study Area are illustrated in Figure 9. The Project Study Area is served by pedestrian facilities including sidewalks along North Harvard Street, Western Avenue, and Cambridge Street. Crosswalks are provided at all Project Study Area intersections. The Paul Dudley White Path along the Charles River also serves pedestrians within the Project Study Area.
Pedestrian counts were conducted at part of the data collection effort on Wednesday, April 12, 2017, which represents a typical day for traffic count purposes (non-holiday) while schools were in session. High levels of pedestrian activity were observed at the North Harvard Street/Anderson Bridge at Soldiers Field Road intersection during the weekday morning and weekday evening peak hours. Moderate levels of pedestrian activity were observed the remaining Project Study Area intersections during the weekday morning and weekday evening peak hours. Figures 10a and 10b show the 2017 Existing Conditions pedestrian volumes for the weekday morning and weekday evening peak hours, respectively.
Improvements to Western Avenue pedestrian accommodations related to the SEC are discussed in Chapter 3.

Existing Pedestrian Facilities
Harvard ERC PDA Allston, Massachusetts
Figure 9
Source: Google Earth Pro Aerial
0 300 600 Feet
\\vhb\proj\Wat-TS\13581.04 WO4 - ERC Ph-1 Trans Sup\graphics\FIGURES\Harvard ERC Figures.indd p6 09/18/17
90INTERSTATE
Charles River
Charles R
iver
Soldiers Field Rd
Sold
iers
Fie
ld R
d
Mem
orial Dr
Memorial Dr
N. Harv
ard St
N. Harvard St
Western Ave Hague St
Windom
St
Seattle St
Hopedale St
Hooker St
Bayard St
Easton St
Coolidge Rd
Batten Way
Kresge Way
Harvard Way
Gordon Rd
Bertram St
Spurr St
Cambridge St
Kingsley St
Rena St
Genzym
e Dw
y
Travis St
CrosswalkSidewalkMulti-Use Path
3
3
ERC PDA
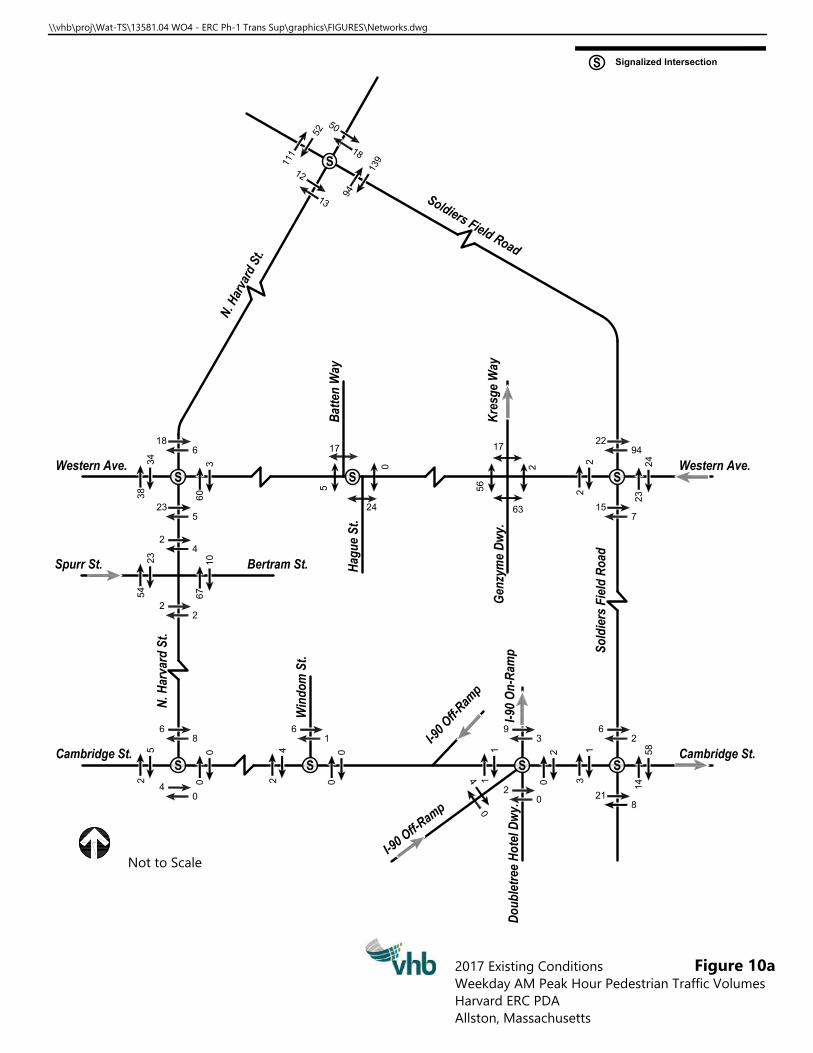
Cambridge St.
N
.
H
a
r
v
a
r
d
S
t
.
I-9
0 O
n-R
am
p
I
-
9
0
O
f
f
-
R
a
m
p
I
-
9
0
O
f
f
-
R
a
m
p
Do
ub
le
tre
e H
ote
l D
wy
.
Cambridge St.
So
ld
ie
rs
F
ie
ld
R
oa
d
Western Ave.
Win
do
m S
t.
Spurr St. Bertram St.
Western Ave.
Ba
tte
n W
ay
Ha
gu
e S
t.
S
o
l
d
i
e
r
s
F
i
e
l
d
R
o
a
d
N. H
arv
ard
S
t.
Ge
nzy
me
D
wy
.
S
Signalized Intersection
S
S S
SSSS
S
1
1
1
1
2
1
3
5
2
5
0
1
8
9
4
1
3
9
18
34
38
6
3
60
23
5
2
23
54
4
10
67
2
2
22
2
2
94
24
23
15
7
0
5
17
24
6
5
2
8
0
0
6
4
2
1
0
0
4
0
6
1
3
2
58
14
21
8
9
1
1
3
2
0
2
0
4
0
Kre
sg
e W
ay
63
2
56
17
\\vhb\proj\Wat-TS\13581.04 WO4 - ERC Ph-1 Trans Sup\graphics\FIGURES\Networks.dwg
Figure 10a2017 Existing ConditionsWeekday AM Peak Hour Pedestrian Traffic Volumes Harvard ERC PDAAllston, Massachusetts
Not to Scale

Cambridge St.
N
.
H
a
r
v
a
r
d
S
t
.
I
-
9
0
O
f
f
-
R
a
m
p
I
-
9
0
O
f
f
-
R
a
m
p
Cambridge St.
So
ld
ie
rs
F
ie
ld
R
oa
d
Western Ave.
Win
do
m S
t.
Spurr St. Bertram St.
Western Ave.
Ba
tte
n W
ay
Ha
gu
e S
t.
S
o
l
d
i
e
r
s
F
i
e
l
d
R
o
a
d
N. H
arv
ard
S
t.
Ge
nzy
me
D
wy
.
S
Signalized Intersection
S
S S
SSSS
S
21
62
38
15
22
23
12
24
8
58
23
8
16
16
1
1
9
4
4
14
0
0
3
2
0
3
0
0
3
5
1
1
12
10
6
8
56
2
0
21
18
13
15
2
1
0
5
1
8
3
8
1
2
3
1
4
1
6
6
1
2
3
1
3
2
9
I-9
0 O
n-R
am
p
Do
ub
le
tre
e H
ote
l D
wy
.
1
0
0
3
0
0
5
4
2
3
Kre
sg
e W
ay
0
2
22
24
71
2
51
15
\\vhb\proj\Wat-TS\13581.04 WO4 - ERC Ph-1 Trans Sup\graphics\FIGURES\Networks.dwg
Figure 10b2017 Existing Conditions Weekday PM Peak Hour Pedestrian Traffic Volumes Harvard ERC PDAAllston, Massachusetts
Not to Scale

Harvard ERC PDA – Transportation Impact Study
29 2017 Existing Conditions
2.5 Crash Analysis A crash analysis was conducted to identify potential vehicle crash trends and/or roadway deficiencies in the Project Study Area. The most current vehicle crash data for the Project Study Area intersections were obtained from the MassDOT Crash Portal for the years 2010 through 20143. A summary of the Project Study Area intersections vehicle crash history is presented in Table 3 and all data is included in the Appendix.
MassDOT has six districts within Massachusetts, and the Project Study Area falls under District 64. The District 6 average crash rate, per million entering vehicles, for signalized intersections is 0.70, and the average crash rate for unsignalized intersections is 0.53 (this means that there were 0.70 motor vehicle crashes at signalized intersections and 0.53 motor vehicle cashes at unsignalized intersections for every million vehicles that pass through the intersection). The calculated crash rate worksheets are included in the Appendix.
As can be seen in Table 3, two Project Study Area intersections have crash rates that exceed the average crash rates for District 6:
› North Harvard Street/Anderson Bridge at Soldiers Field Road › Cambridge Street at I-90 Ramps/Soldiers Field Road
North Harvard Street/Anderson Bridge at Soldiers Field Road has a calculated crash rate of 1.64 and experienced 60 crashes within the five-year period, eight of which involved non-motorists (bicyclists or pedestrians). The majority of these crashes were classified as rear-end and angled crashes. It should be noted that the Anderson Bridge and adjacent intersections were under construction as part of MassDOT’s Accelerated Bridge Program from 2012 through 2016. The project included the rehabilitation of the bridge and improvements to the adjacent intersections.
Cambridge Street at I-90 Ramps/Soldiers Field Road has a crash rate of 1.03 and experienced 95 crashes within the five-year period, two of which involved non-motorists. The majority of these crashes were classified as rear-end and angled crashes. It should be noted that the intersection is currently under construction. The project includes the consolidation of the I-90 on-ramp from Cambridge Street and enhanced pedestrian and bicycle accommodations. In addition, reconstruction of Cambridge Street at this location is planned by MassDOT as part of the I-90 Allston Interchange Improvement Project.
All other Project Study Area locations have crash rates below the average for District 6. No fatal injuries were experienced at any of the Project Study Area locations
3 It should be noted that the MassDOT Crash Portal typically does not include all crashes that occurred within the City of Boston due
to differences in agency filing methodologies and systems. 4 MassDOT District 6 includes the following cities and towns as defined on the MassDOT website: Boston, Braintree, Brookline,
Cambridge, Canton, Chelsea, Dedham, Dover, Milton, Needham, Newton Quincy, Randolph, Watertown, Wellesley, Weston, Westwood, Weymouth, Winthrop.

Harvard ERC PDA – Transportation Impact Study
30 2017 Existing Conditions
within the five-year period. In addition to the locations discussed above, three additional Project Study Area intersections had non-motorized crashes reported:
› North Harvard Street at Western Avenue (three non-motorist crashes) › North Harvard Street at Cambridge Street (two non-motorist crashes) › Western Avenue at Soldiers Field Road (three non-motorist crashes)
It should be noted that intersection improvements were completed at the intersection of North Harvard Street at Western Avenue as part of the Continuum project in 2016.
Intersection improvements to the intersection of North Harvard Street at Cambridge Street were recently completed, including the addition of buffered bike lanes along Cambridge Street.
The Project Study Area intersections were compared to the MassDOT interactive crash cluster map which identifies Highway Safety Improvement Plan (HSIP) clusters. Three Project Study Area intersections were classified as HSIP clusters for 2012-2014:
› North Harvard Street at Soldiers Field Road › Cambridge Street at Soldiers Field Road › Western Avenue at Soldiers Field Road
MassDOT completed reconstruction of the intersection of North Harvard Street and Soldiers Field Road in 2017 as part of the Anderson Bridge project and is currently reconstructing the intersection of Cambridge Street at Soldiers Field Road. Harvard has cooperated with MassDOT’s need to widen the Rights of Way for these intersections into the adjacent property.
It should also be noted that a Road Safety Audit (RSA) was conducted along Cambridge Street from Harvard Avenue/Franklin Street to the I-90 Ramps in December 2014. The RSA identified potential safety enhancements relating to roadway alignment/intersection alignment, traffic control, visibility, and pedestrian/bicycle accommodations.

Harvard ERC PDA – Transportation Impact Study
31 2017 Existing Conditions
Table 3 Intersection Crash Summary (2010-2014)
North Harvard Street/Anderson Bridge at Soldiers
Field Road
North Harvard Street at Western
Avenue
North Harvard Street at Spurr Street/Bertram
Street
North Harvard Street at
Cambridge Street
Cambridge Street at
Windom Street
Cambridge Street/ River Street at I-90 Ramps/SFR
Western Avenue at SFR
Western Avenue at Kresge Way/
Genzyme Driveway
Western Avenue at Batten Way/ Hague Street
District 6 Average Crash Rate 0.70 0.70 0.53 0.70 0.70 0.70 0.70 0.53 0.70 MassDOT Calculated Crash Rate 1.64 0.20 0.05 0.18 0.06 1.03 0.42 0.00 0.09 Year 2010 13 5 0 7 0 12 4 0 0 2011 14 0 0 1 0 17 3 0 0 2012 14 0 1 2 0 25 7 0 0 2013 7 1 0 0 3 14 8 0 1 2014 12 1 0 2 0 27 6 0 1 Total 60 7 1 12 3 95 28 0 2 Collision Type Angle 20 2 1 2 2 37 8 0 1 Head-on 1 1 0 0 0 1 1 0 0 Rear-end 20 2 0 6 0 28 9 0 1 Rear-to-Rear 0 0 0 0 0 0 0 0 0 Sideswipe, opposite direction 0 1 0 0 0 1 1 0 0 Sideswipe, same direction 4 0 0 2 0 16 4 0 0 Single vehicle crash 13 1 0 2 1 10 5 0 0 Not reported 2 0 0 0 0 2 0 0 0 Crash Severity Fatal injury 0 0 0 0 0 0 0 0 0 Non-fatal injury 15 3 0 5 2 26 8 0 2 Property damage only (none injured) 41 3 0 6 1 60 19 0 0 Not Reported 4 1 1 1 0 9 1 0 0 Time of Day Weekday, 7:00 AM - 9:00 AM 6 1 0 0 0 12 2 0 0 Weekday, 4:00 PM - 6:00 PM 7 0 0 0 1 4 4 0 0 Saturday, 11:00 AM - 2:00 PM 1 0 0 1 0 3 0 0 0 Weekday, other time 34 1 1 5 1 51 12 0 1 Weekend, other time 12 5 0 6 1 25 10 0 1 Pavement Conditions Dry 46 5 1 11 3 74 23 0 2 Wet 13 2 0 0 0 18 5 0 0 Snow 1 0 0 1 0 1 0 0 0 Ice 0 0 0 0 0 1 0 0 0 Not reported 0 0 0 0 0 1 0 0 0 Non-Motorist (Bike, Pedestrian) 8 3 0 2 0 2 3 0 0
Source: MassDOT crash portal, accessed July 2017.

Harvard ERC PDA – Transportation Impact Study
32 2022 Future Conditions
3 2022 Future Conditions The 2022 Future Conditions evaluation reflects a five-year planning horizon. Traffic volumes on the roadway network under future conditions without the Project (No-Build) are assumed to include all existing traffic, any new traffic due to regional and area background traffic growth, and traffic related to any specific nearby planned development projects expected to be completed by the 2022 horizon year. Roadway improvements proposed within the boundaries of the Project Study Area were also considered and incorporated where appropriate. The anticipated traffic volumes from the proposed Project were added to the 2022 No-Build Conditions traffic volumes to reflect future conditions with the Project in place (Build). Roadway improvements proposed as part of the Project are incorporated into analysis. This methodology was reviewed with BTD and BPDA.
3.1 2022 No-Build Conditions The 2022 No-Build Conditions analyze the future transportation conditions within the Project Study Area absent the proposed Project. This condition projects five years into the future and adjusts the traffic conditions to estimate the vehicle volumes and infrastructure improvements within the area. The five-year horizon was selected in consultation with BTD and BPDA to reflect a condition prior to the completion of the MassDOT I-90 Allston Interchange Improvement Project. These conditions are described further below.

Harvard ERC PDA – Transportation Impact Study
33 2022 Future Conditions
3.1.1 Regional Traffic Growth A general area-wide traffic growth rate was applied to the 2017 Existing Conditions peak hour traffic volumes to reasonably account for general future traffic growth in the Project Study Area. As confirmed by BTD, an annual growth rate of 0.25 percent per year for five years was applied to the 2017 Existing Conditions vehicle volumes.
3.1.2 Planned Developments In addition, vehicular traffic associated with specific planned Harvard University 2013 IMP and non-IMP projects around the Project Site have been incorporated into the 2022 No-Build Conditions vehicle volumes. These projects are summarized below and in Figure 11. The vehicle trips generated by each project are included in the Appendix.
IMP Projects › Harvard Business School (HBS) Faculty & Administrative Office Building –
The project includes an approximately 110,000 sf faculty and administrative office building to be located in the northeast corner of what is now Ohiri Field and is directly north of the i-lab/Batten Hall on the Harvard Business School Campus in Allston.
› Harvard Gateway Project – The project consists of approximately 300,000 sf of space, including 35,000 sf to 50,000 sf of ground floor retail space and the upper floors consisting of institutional/mixed uses, which may also include administrative or academic office space. The project will be located on the northeast corner of the intersection of Western Avenue and North Harvard Street in Allston.
› Harvard Mixed Use Project – The project consists of an approximately 60,000 sf/3,000 seat basketball venue, between 200,000 sf and 250,000 sf of residential space, and approximately 10,000 sf to 30,000 sf of ground floor retail. The project will be located to the north of the Continuum development on the northwest corner of the intersection of Western Avenue and North Harvard Street in Allston.
› Harvard Hotel/Conference Center – The project consists of an approximately 250,000 hotel and conference center to be located on the south side of Western Avenue within the ERC PDA. This project was included in Harvard University’s 2013 Institutional Master Plan, but is now part of the ERC PDA.
› Harvard University Science and Engineering Complex (SEC)- The project consists of 496,850 sf of primarily academic space, which includes the repurposing of 114 Western Avenue, to be located south of Western Avenue to the west of Hague Street. The project is currently under construction.
› Harvard Business School Klarman Hall/G2 Pavilion – The project consists of the replacement of the existing Burden Hall and with 81,000 sf of auditorium/conference space and 18,000 to 24,000 sf of meeting and classroom

Harvard ERC PDA – Transportation Impact Study
34 2022 Future Conditions
space and is not expected to generate any new peak period trips. This project is under construction.
Non-IMP Projects › Telford 180 – The project consists of approximately 85 residential units to be
located at 180 Telford Street in Allston. The project is currently under construction.
› Continuum– The project consists of approximately 325 residential units and 45,000 sf of retail space located 219 Western Avenue in Allston. The project construction has been completed and the residential units were occupied at the time of the traffic counts. Therefore, only trips associated with the retail/grocery portion of the development were included in the 2022 No-Build Conditions traffic volume networks.
› Western Ave Residential - The project consists of approximately 132 residential units and 5,180 sf of retail space to be located at 530 Western Avenue in Brighton. The project is currently under construction.
› Boston Landing – The project consists of a large mixed-use development located at 38-180 Guest Street and 77 Guest Street in Brighton. The project is currently under construction and was partially occupied at the time of the traffic counts. The unoccupied portion of the development includes approximately 583,000 sf of office space, 126,000 sf of sports facility space, 175 hotel rooms, and 57,000 sf of retail space. Therefore, only trips associated with the unoccupied portion of the development were included in the 2022 No-Build Conditions traffic volume networks.
› 125 Guest Street – The project consists of approximately 295 residential units and 16,000 sf of retail space to be located at 125 Guest Street in Brighton within the Boston Landing Development. The project is currently under construction.
› Allston Yards Phase 1 - The project consists of a Stop & Shop grocery store (replacing the existing store), approximately 360 residential units, and 5,000 sf of retail space to be located at 60 Everett Street in Allston. A Letter of Intent (LOI) for the project was filed with BPDA on February 10, 2017.

Background Development Projects
Harvard ERC PDA Allston, Massachusetts
Figure 11
Source: Google Earth Pro Aerial
0 425 850 Feet
\\vhb\proj\Wat-TS\13581.04 WO4 - ERC Ph-1 Trans Sup\graphics\FIGURES\Harvard ERC Figures.indd p7 10/23/17
Charles R
iver
Charles R
iver
Soldiers Field Rd
Soldiers Field Rd
Mem
orial Dr
N. Harv
ard St
N. Harvard St
Cambridge St
Western Ave
Western Ave
Ever
ett St
Mar
ket S
t 3
90INTERSTATE
90INTERSTATE
ERC PDA
Harvard Mixed Use Project
60,000 sf Basketball Venue200,000-250,00 sf Residential10,000-30,000 sf Retail
HBS Klarmen Hall/G2 Pavilion
81,000 sf Auditorium/Conference Space18,000-24,000 sf Meeting/Classroom Space
HBS Faculty & Administrative Office Building
110,000 sf Faculty and Administrative Office
Harvard Gateway Project
250,000-265,000 sf Institutional/Mixed Use35,000-50,000 sf Retail
IMP Projects
Non-IMP Projects - Unoccupied
Non-IMP Projects - Partially Unoccupied
Continuum
45,000 sf Retail/Grocery
Boston Landing
583,000 sf Office126,000 sf Sports Facilities175 Room Hotel57,000 sf Retail
125 Guest Street
295 Units Residential16,000 sf Retail
Western Avenue Residential
132 Units Residential5,180 sf Retail
Allston Yards Phase 1
360 Units Residential5,000 sf Retail
Telford 180
85 Units Residential
Harvard Hotel/Conference Center
250,000 sf Hotel/Conference Space
Harvard University SEC
496,850 sf Academic Space

Harvard ERC PDA – Transportation Impact Study
36 2022 Future Conditions
3.1.3 2022 No-Build Conditions Traffic Volumes The future 2022 No-Build Conditions traffic volumes were developed by applying the 0.25 percent annual growth rate over the five-year study horizon to the existing traffic volumes and adding the traffic volumes associated with the planned developments described above. Figures 12a and 12b show the resulting 2022 No-Build Conditions peak hour traffic volume networks for the weekday morning and weekday evening peak hours, respectively.

Cambridge St.
N
.
H
a
r
v
a
r
d
S
t
.
I-9
0 O
n-R
am
p
I
-
9
0
O
f
f
-
R
a
m
p
19
0
23
5
50
12
5
15
0
5
145
310
5
5
320
65
150
345
165
1580
355
1085
15
240
20
575
510
1585
9
3
5
1
8
3
0
195
260
5
n
e
g
20
795
I
-
9
0
O
f
f
-
R
a
m
p
Do
ub
le
tre
e H
ote
l D
wy
.
Cambridge St.
So
ld
ie
rs
F
ie
ld
R
oa
d
Western Ave.
Win
do
m S
t.
Spurr St. Bertram St.
Western Ave.
Ba
tte
n W
ay
Kre
sg
e W
ay
Ha
gu
e S
t.
S
o
l
d
i
e
r
s
F
i
e
l
d
R
o
a
d
N. H
arv
ard
S
t.
450
Ge
nzy
me
D
wy
.
S
S S
SSSS
S
50
715
265
150
25
10
25
80
155
140
45
90
31
0
100
420
75
20
ne
g
25
85
435
30
120
545
55
215
405
915
6
0
3
6
5
6
5
1
5
1
7
0
3
5
5
2
9
5
1
0
1
2
0
2
1
0
5
7
0
275
1115
400
5
10
60
25
10
185
215
5
5
neg
445
10
5
39
0
13
5
10
0
65
225
350
10
5
5
neg = Negligible
S
Signalized Intersection
\\vhb\proj\Wat-TS\13581.04 WO4 - ERC Ph-1 Trans Sup\graphics\FIGURES\Networks.dwg
Figure 12a2022 No Build ConditionsWeekday AM Peak Hour Vehicle Traffic Volumes Harvard ERC PDAAllston, Massachusetts
Not to Scale

Cambridge St.
N
.
H
a
r
v
a
r
d
S
t
.
I-9
0 O
n-R
am
p
I
-
9
0
O
f
f
-
R
a
m
p
17
0
22
0
35
24
0
30
5
30
105
220
5
70
535
125
280
310
210
1385
330
1255
60
145
15
730
395
1595
1
0
3
0
1
6
7
5
180
290
n
e
g
5
50
835
I
-
9
0
O
f
f
-
R
a
m
p
Do
ub
le
tre
e H
ote
l D
wy
.
Cambridge St.
So
ld
ie
rs
F
ie
ld
R
oa
d
Western Ave.
Win
do
m S
t.
Spurr St. Bertram St.
Western Ave.
Ba
tte
n W
ay
Kre
sg
e W
ay
Ha
gu
e S
t.
S
o
l
d
i
e
r
s
F
i
e
l
d
R
o
a
d
N. H
arv
ard
S
t.
705
Ge
nzy
me
D
wy
.
S
S S
SSSS
S
35
620
130
285
70
20
90
25
285
10
12
5
30
21
5
40
595
40
25
ne
g
55
30
665
20
55
570
45
435
505
985
1
8
0
3
6
5
4
0
2
0
2
6
0
2
7
0
2
9
5
2
0
9
0
2
9
5
1
5
1
2
0
330
1145
440
10
10
50
15
5
240
435
neg
20
10
390 5
5
10
30
5
80
11
0
165
335
380
10
10
5
5
neg = Negligible
S
Signalized Intersection
\\vhb\proj\Wat-TS\13581.04 WO4 - ERC Ph-1 Trans Sup\graphics\FIGURES\Networks.dwg
Figure 12b2022 No Build ConditionsWeekday PM Peak Hour Vehicle Traffic Volumes Harvard ERC PDAAllston, Massachusetts
Not to Scale

Harvard ERC PDA – Transportation Impact Study
39 2022 Future Conditions
3.1.4 Future Roadway Conditions In assessing future traffic conditions, proposed infrastructure improvements within the Project Study Area were considered.
› Harvard University SEC Project – The SEC project includes modifications to Western Avenue, the construction of three new roadways, and bicycle and pedestrian amenities, including: Western Avenue Streetscape – Includes the reconstruction of the Western
Avenue streetscape from Academic Way to Batten Way/Hague Street. A street-level buffered bike lane will be provided on the northern side (westbound) of Western Avenue from Academic Way to Batten Way. A sidewalk-level separated bike lane will be provided on the southern side (eastbound) from Academic Way to Hague Street, and will transition to a street-level buffered bike lane west of Hague Street. One travel lane, on-street parking for public use, and sidewalks will be provided in each direction along Western Avenue. The existing curb-to-curb width of 47 feet will be maintained.
Academic Way – New roadway extending from North Harvard Street in the north to Science Drive in the south, intersecting with Western Avenue. The intersection of Western Avenue at Academic Way will be unsignalized and include a Rectangular Rapid Flashing Beacon (RRFB) to enhance the safety of pedestrian crossings.
Science Drive – New roadway that will extend from Academic Way in the west to Rotterdam Street in the east.
Stadium Road – New roadway extending from Western Avenue in the north to Rotterdam Street in the south. The intersection of Western Avenue at Stadium Road will be signalized.
Mobility Hub –To be located on southeast corner of the intersection of Western Avenue and Stadium Road and include secured bike parking, a Harvard University shuttle stop, and a MBTA bus stop.
› Cambridge Street at I-90 Ramps/Double Tree Hotel/Soldiers Field Road – MassDOT is currently constructing intersection improvements at these locations which include modifications to I-90 on-ramp access, lane geometry, signal timing improvements, and pedestrian and bicycle accommodations.
These improvements were incorporated into the capacity analysis for 2022 No-Build and Build Conditions.
The analysis does not include MassDOT’s I 90 Allston Interchange Improvement Project. MassDOT has indicated that this project will completed on or before 2025.
3.2 2022 Build Conditions The 2022 Build Conditions analyzes the future transportation conditions within the Project Study Area with the proposed Project. This condition estimates

Harvard ERC PDA – Transportation Impact Study
40 2022 Future Conditions
site-generated traffic volumes and distributes these volumes over the Project Study Area roadways. These conditions are described further below.
3.2.1 Project Infrastructure Figure 13 shows a conceptual site plan including the proposed roadway improvements to support Project, including:
› Cattle Drive – Cattle Drive will be a north-south roadway connecting Western Avenue and Dedham Parrish Road. Cattle Drive will bisect the ERC PDA and provide access to parking. Cattle Drive is currently envisioned to have one travel lane and an on-street parking lane in each direction with a center lane that will accommodate left-turn lanes at intersections. A two-way sidewalk-level cycle track will be provided along the east side of Cattle Drive. Sidewalks will be provided along both sides of the roadway.
› Cattle Drive Extension – In the southern portion of the ERC PDA, Cattle Drive will be extended to Cambridge Street by constructing a temporary/interim connection to Dedham Parrish Road and reconfiguring short sections of Dedham Parrish Road and Windom Street. The intersection of Windom Street at Dedham Parrish Road will be reconfigured to incorporate the extension of Cattle Drive and encourage non-neighborhood traffic to utilize Cattle Drive. In addition, to reduce confusion between the closely spaced Windom Street at Dedham Parrish Road and Cambridge Street at Windom Street intersections, the southbound approach of Windom Street at Cambridge Street will be reduced to one lane. Cattle Drive Extension will have one travel and one on-street bicycle lane in each direction with a sidewalk along the western side of the roadway. Accommodations for pedestrians and bicyclists at internal intersections and driveways will be provided. Based on a review of traffic volumes, it is anticipated that Cattle Drive Extension is needed to support trips associated with the ERC PDA office/lab buildings and reduce impacts on the intersections of Cambridge Street and Western Avenue at Soldiers Field Road. The construction of this connector will be coordinated with MassDOT’s I 90 Allston Interchange Improvement Project, which will replace the Cambridge Street bridge over the I-90 loop ramps with an at-grade (surface) street.
› East Drive – East Drive will be a north-south roadway connecting Western Avenue and the proposed Distributed Energy Facility (DEF) parking lot. East Drive will be located on the eastern boundary of the ERC PDA aligning with Kresge Way to the north and provide access to ERC PDA parking. Access to Genzyme will be reconfigured to be located off East Drive. East Drive is envisioned to have one travel lane and a bike lane in each direction, with sidewalks along both sides of the roadway. Accommodations for pedestrians and bicyclists at internal intersections and driveways will be provided.
› Hague Street – Hague Street will be discontinued under the proposed Project with the majority of existing traffic shifted to Cattle Drive.
› Rotterdam Street – Rotterdam Street will be discontinued between the future Stadium Road and the 114 Western Avenue parking lot entrance. Access to the

Harvard ERC PDA – Transportation Impact Study
41 2022 Future Conditions
114 Western Avenue parking lot will be provided via a connection to/from Cattle Drive. Windom Street neighborhood trips with destinations to the north will be able to use Academic Way/Science Drive or Stadium Road.
The proposed future roadway conditions would modify three existing intersections and create one new intersection along Western Avenue:
› Western Avenue at Kresge Way/East Drive (modified) › Western Avenue at Batten Way (modified) › Western Avenue at Cattle Drive (new)
Traffic signal warrant analyses were performed at these three locations. The Manual on Uniform Traffic Control Devices (MUTCD)5 lists specific criteria, or warrants, for the consideration of installation of a traffic signal at an intersection. The traffic signal warrant analysis provides guidance as to locations where signals would not be appropriate and locations where they could be considered further.
Traffic signal warrant analyses were performed for the volume-based peak hour warrant (Warrant 3). Table 4 summarizes the results of the signal warrant analyses and worksheets are included in the Appendix.
Table 4 Signal Warrant Analysis Summary
Warrant 3 (Peak Hour) Met?
Location Weekday Morning
Weekday Evening
Western Avenue at Kresge Way/East Drive No Yes a Western Avenue at Batten Way (existing signal) No Yes a Western Avenue at Cattle Drive Yes Yes
a Intersection volumes are close to the warrant threshold.
As shown in Table 4, the peak hour signal warrant is met, but close to the threshold, in the weekday evening peak hour only at Western Avenue at Kresge Way/East Drive and Western Avenue at Batten Way, which is currently controlled by a temporary signal. The peak hour signal warrant is met in both the weekday morning and weekday evening peak hour at Western Avenue at Cattle Drive.
Based on the MUTCD, “the [peak hour] signal warrant shall be applied only in unusual cases, such as office complexes, manufacturing plants, industrial complexes, or high-occupancy vehicle facilities that attract or discharge large numbers of vehicles over a short time.” Based on the results of the signal warrant analysis, guidance from the MUTCD, existing traffic operations, and knowledge of the Project Study Area, traffic control under the 2022 Build Conditions is assumed as follows:
› Western Avenue at Kresge Way/East Drive – unsignalized › Western Avenue at Batten Way – signalized › Western Avenue at Cattle Drive – signalized
5 MUTCD, Part 4 – Highway Traffic Signals, USDOT/FHWA, 2009 Edition, Revised May 2012.

\\vhb\proj\Wat-TS\13581.04 WO4 - ERC Ph-1 Trans Sup\graphics\FIGURES\ERC Concept.dwg
Figure 13Conceptual Site Plan
Harvard ERC PDA Allston, Massachusetts0 150 300 Feet
Building with Below Grade Parking
Surface Parking
Discontinued Roadway Segment
ERC PDA Boundary

Harvard ERC PDA – Transportation Impact Study
43 2022 Future Conditions
3.2.2 Unadjusted ITE Vehicle Trips The Project is comprised of office/lab, residential, and hotel land uses. The hotel portion of the development is included in the 2022 No-Build Conditions traffic volumes as it was included as part of Harvard University’s 2013 Institutional Master Plan. However, to show a complete picture of the proposed developments trip generation, estimates for the hotel are included below. The ITE Trip Generation Manual categorizes these land uses and provides daily, morning, and evening peak hour unadjusted vehicle trip generation estimates. The trip generation estimates for the proposed uses were projected using Land Use Code (LUC) 220 (Apartment), 310 (Hotel), 710 (General Office Building), and 760 (Research & Development Center). The unadjusted vehicle trip estimates for the Project and are presented in Table 5 and trip generation worksheets are included in the Appendix.
Table 5 Unadjusted ITE Vehicle Trips
Office/ Lab a Residential b
Total Non-IMP Vehicle Trips Hotel c
Total Vehicle Trips
Weekday Daily
Enter 1,923 819 2,742 817 3,559 Exit 1,923 819 2,742 817 3,559 Total 3,846 1,638 5,484 1,634 7,118 Weekday Morning
Enter 488 25 513 63 576 Exit 72 101 173 43 216 Total 560 126 686 106 792 Weekday Evening
Enter 74 101 175 61 236 Exit 457 54 511 59 570 Total 531 155 686 120 806
a Trip generation estimate based on ITE LUC 710 (General Office Building) and ITE LUC 760 (Research & Development Center), assumes 200,000 sf of office space and 200,000 sf of R&D space with 2.5 employees per 1,000 sf of R&D.
b Trip generation estimate based on ITE LUC 220 (Apartment). c Trip generation estimate based on ITE LUC 310 (Hotel), from Harvard University’s 2013 Institutional
Master Plan.
3.2.3 Person Trips The unadjusted vehicle trips are converted into person trips by applying the national average vehicle occupancy (AVO) of 1.13 for office/lab and residential uses, and 1.67 for hotel uses as presented in the 2009 National Household Travel Survey.

Harvard ERC PDA – Transportation Impact Study
44 2022 Future Conditions
3.2.4 Internal Capture Trips As described in the ITE Trip Generation Handbook “[b]ecause of the complementary nature of these land uses, some trips are made among the on-site uses. This capture of trips internal to the site has the net effect of reducing vehicle trip generation between the overall development site and the external street system (compared to the total number of trips generated by comparable land uses developed individually on stand-alone sites)…an internal capture rate can generally be defined as the percentage of total person trips generated by a site that are made entirely within the site. The trip origin, destination, and travel path are all within the site.”
Based on the methodology outlined in the ITE Trip Generation Handbook, internal capture rates were applied to the gross person trips. The resulting person trip estimates for the Project and are presented in Table 6 and worksheets are included in the Appendix.
Table 6 Person Trips
Office/ Lab a Residential a
Total Non-IMP Person Trips Hotel b
Total Person Trips
Weekday Daily
Enter 2,173 897 3,070 1,435 4,505 Exit 2,110 925 3,035 1,470 4,505 Total 4,283 1,822 6,105 2,905 9,010 Weekday Morning
Enter 532 28 560 115 675 Exit 81 112 193 65 258 Total 613 140 753 180 933 Weekday Evening
Enter 82 109 191 110 301 Exit 512 57 569 105 674 Total 594 166 760 215 975
a Person trip generation estimate with internal capture credits applied. b Person trip generation estimate from Harvard University’s 2013 Institutional Master Plan with
internal capture credits applied. Trips included in the 2022 No-Build Conditions analysis.
3.2.5 Mode Share The mode shares used are based on BTD published mode share data by trip purpose for Area 17 (the zone for Allston). The peak hour/peak direction mode share estimates, by use, are presented in Table 7 and all mode share data is included in the Appendix.

Harvard ERC PDA – Transportation Impact Study
45 2022 Future Conditions
Table 7 Mode Share
Use Vehicle Transit Bike Walk Office/Lab 59% 18% 17% 6% Residential 43% 21% 27% 9% Hotel 47% 7% 35% 11%
Source: Peak hour/peak direction mode share estimates based on BTD’s published mode share data by trip purpose for Area 17: Allston. Assumes a 75 percent/25 percent split between bike/walk trips.
3.2.6 Adjusted Project Trips The mode shares discussed above were applied to the net-new person trips to generate the adjusted Project trips by mode.
A local average vehicle occupancy, based on 2010 Census Data for tracts 1, 8.02, and 8.03, was applied to the vehicle mode to more accurately reflect the number of vehicles generated by the Site. The local AVO for office/lab was 1.19 and for residential was 1.27. Due to limited data and research available for local AVO characteristics for hotel uses, the national AVO of 1.67 was applied.
3.2.7 Project-Generated Trips The mode share and local AVO were applied to the person trips to estimate net new trips by mode. Tables 8 and 9 summarize the net new trips by mode and net new vehicle trips by use, respectively. Detailed trip generation worksheets are provided in the Appendix.
Table 8 Project-Generated Trips by Mode
Vehicle Transit Bike Walk Weekday Daily
Enter 2,007 573 940 326 Exit 1,990 578 948 324 Total 3,997 1,151 1,888 650 Weekday Morning
Enter 297 119 137 49 Exit 98 38 69 20 Total 395 157 206 69 Weekday Evening
Enter 112 43 83 25 Exit 296 120 136 46 Total 408 163 219 71
Note: Hotel trips included in the 2022 No-Build Conditions analysis.

Harvard ERC PDA – Transportation Impact Study
46 2022 Future Conditions
Table 9 Project-Generated Vehicle Trips by Use
Office/ Lab a Residential a
Total Non-IMP Vehicle Trips Hotel b
Total Vehicle Trips
Weekday Daily
Enter 1,260 332 1,592 415 2,007 Exit 1,223 342 1,565 425 1,990 Total 2,483 674 3,157 840 3,997 Weekday Morning
Enter 264 8 272 25 297 Exit 45 38 83 15 98 Total 309 46 355 40 395 Weekday Evening
Enter 45 37 82 30 112 Exit 254 17 271 25 296 Total 299 54 353 55 408
a New vehicle trips with internal capture credits applied. b New vehicle trips based on Harvard University’s 2013 Institutional Master Plan with internal capture
credits applied. Trips included in the 2022 No-Build Conditions analysis.
As shown in Tables 8 and 9, the Project is expected to generate 3,997 weekday daily new vehicle trips (2,007 entering/1,990 exiting), with 395 new vehicle trips (297 entering/98 exiting) during the weekday morning peak hour and 408 new vehicle trips (112 entering/296 exiting) during the weekday evening peak hour. It should be reiterated that the hotel trips are included in the 2022 No-Build Conditions traffic volumes and analysis and therefore only the office/lab and residential trips were added to develop 2022 Build Conditions volumes.
3.2.8 Project-Generated Trip Comparison There is the potential for the Project to include up to approximately 20,000 sf of retail development in place of an equivalent portion of office/lab uses. Trip generation for this potential alternative was estimated and compared to the previously presented Project trip generation. Table 10 summarizes the vehicular trip generation estimates.

Harvard ERC PDA – Transportation Impact Study
47 2022 Future Conditions
Table 10 Project-Generated Vehicular Trip Comparison
Without Retail a
With Retail b
Weekday Daily
Enter 2,007 2,019 Exit 1,990 2,002 Total 3,997 4,021 Weekday Morning
Enter 297 287 Exit 98 92 Total 395 379 Weekday Evening
Enter 112 108 Exit 296 289 Total 408 397
a Trip generation estimate for the Project without a retail component. b Trip generation estimate for the Project with a 20,000 sf retail component
in place of an equivalent portion of office/lab and residential uses.
As shown in Table 10, the trip generation estimates for both development programs are similar. The “without retail” option results in slightly more Project trips during the weekday morning and weekday evening peak hours. Therefore, the 2022 Build Conditions analysis presented herein was conducted using the “without retail” option trip generation estimates.
3.2.9 Vehicular Trips The office/lab and residential adjusted Project vehicle trips are distributed through the Project Study Area based on the Project vehicular trip distribution. The Project vehicular trip distribution is based on BTD’s published distribution data by mode for Area 17 (the zone for Allston). Table 11 and Figure 14 summarize the vehicular trip distribution patterns by use. As noted previously, hotel trips have been included in the 2022 No-Build Conditions as they were permitted as part of the Harvard University’s 2013 Institutional Master Plan.

Harvard ERC PDA – Transportation Impact Study
48 2022 Future Conditions
Table 11 Vehicular Trip Distribution
Roadway (from/to) Office/Lab Residential North Harvard Street (north) 5% 10% Soldiers Field Road (west) 5% 4% Western Avenue (west) 26% 26% Cambridge Street (west) 12% 13% I-90 (east and west) 35% 24% Soldiers Field Road (east) 12% 14% Western Avenue/River Street (east) 5% 9% Total 100% 100%
Source: BTD’s published distribution data for Area 17: Allston.
The future 2022 Build Conditions traffic volumes were developed by assigning the Project-generated vehicle trips, summarized in Table 9, to the Project Study Area based on the distribution summarized above in Table 11 and Figure 14. Figures 15a and 15b show the resulting 2022 Build Conditions peak hour traffic volume networks for the weekday morning and weekday evening peak hours, respectively.
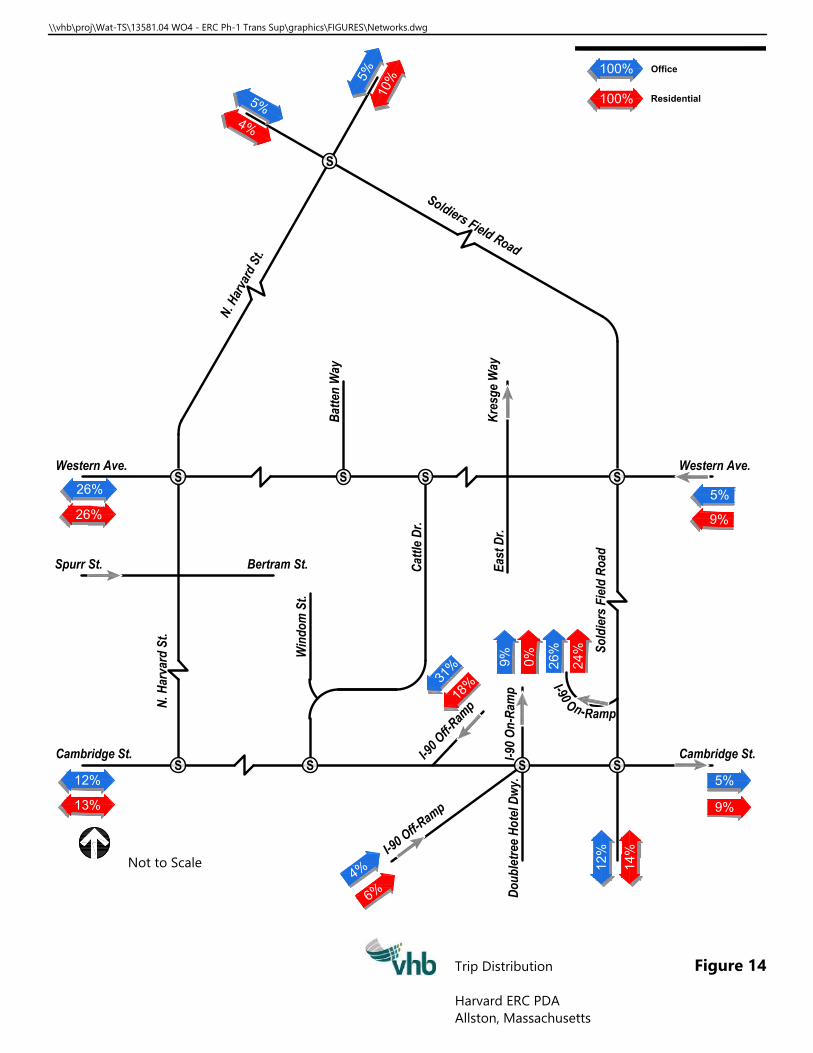
Cambridge St.
N
.
H
a
r
v
a
r
d
S
t
.
I-9
0 O
n-R
am
p
I
-
9
0
O
f
f
-
R
a
m
p
I
-
9
0
O
f
f
-
R
a
m
p
Do
ub
le
tre
e H
ote
l D
wy
.
Cambridge St.
So
ld
ie
rs
F
ie
ld
R
oa
d
Western Ave.
Spurr St. Bertram St.
Western Ave.
Ba
tte
n W
ay
Kre
sg
e W
ay
Ca
ttle
D
r.
S
o
l
d
i
e
r
s
F
i
e
l
d
R
o
a
d
N. H
arv
ard
S
t.
S
S S
SSSS
Ea
st D
r.
S
100%
100%Office
Residential
5
%
5
%
26%
12
%
12%
1
0
%
4
%
26%
13%
14
%
Win
do
m S
t.
S
Ramp
I
-
9
0
O
n
-
6
%
4
%
3
1
%
1
8
%
24
%
26
%
9%
0%
9%
5%
5%
9%
\\vhb\proj\Wat-TS\13581.04 WO4 - ERC Ph-1 Trans Sup\graphics\FIGURES\Networks.dwg
Figure 14Trip Distribution
Harvard ERC PDA Allston, Massachusetts
Not to Scale

neg = Negligible
Cambridge St.
N
.
H
a
r
v
a
r
d
S
t
.
I-9
0 O
n-R
am
p
I
-
9
0
O
f
f
-
R
a
m
p
19
0
23
5
45
12
5
15
0
5
145
380
5
5
340
65
150
345
160
1620
355
1095
25
245
60
575
665
1585
9
1
0
1
9
5
0
195
290
5
n
e
g
20
800
I
-
9
0
O
f
f
-
R
a
m
p
Do
ub
le
tre
e H
ote
l D
wy
.
Cambridge St.
So
ld
ie
rs
F
ie
ld
R
oa
d
Western Ave.
Spurr St. Bertram St.
Western Ave.
Ba
tte
n W
ay
Kre
sg
e W
ay
Ca
ttle
D
r.
S
o
l
d
i
e
r
s
F
i
e
l
d
R
o
a
d
N. H
arv
ard
S
t.
485
S
Signalized Intersection
S
S S
SSSS
65
715
240
150
45
ne
g
45
85
450
90
120
535
70
215
420
915
6
5
3
7
0
6
5
1
5
1
8
5
3
5
5
2
9
5
1
0
1
2
0
2
1
0
5
7
0
42
0
13
5
10
0
65
23
5
35
5
250
1120
400
5
10
60
25
10
185
215
5
5
neg
440
10
Ea
st D
r.
25
35
75
415
195
495
S
175
345
220
230
515
90
5
Win
do
m S
t.
n
e
g
2
6
0
n
e
g
1
0
2
5
7
0
0
5
10
5
S
\\vhb\proj\Wat-TS\13581.04 WO4 - ERC Ph-1 Trans Sup\graphics\FIGURES\Networks.dwg
Figure 15a2022 Build ConditionsWeekday AM Peak Hour Vehicle Traffic Volumes Harvard ERC PDAAllston, Massachusetts
Not to Scale

neg = Negligible
Cambridge St.
N
.
H
a
r
v
a
r
d
S
t
.
I-9
0 O
n-R
am
p
I
-
9
0
O
f
f
-
R
a
m
p
17
0
22
0
35
24
0
30
5
5
105
240
5
5
605
120
275
310
210
1395
330
1290
95
170
25
730
435
1595
1
0
2
0
1
7
1
0
180
295
n
e
g
5
55
855
I
-
9
0
O
f
f
-
R
a
m
p
Do
ub
le
tre
e H
ote
l D
wy
.
Cambridge St.
So
ld
ie
rs
F
ie
ld
R
oa
d
Western Ave.
Spurr St. Bertram St.
Western Ave.
Ba
tte
n W
ay
Kre
sg
e W
ay
Ca
ttle
D
r.
S
o
l
d
i
e
r
s
F
i
e
l
d
R
o
a
d
N. H
arv
ard
S
t.
820
S
Signalized Intersection
S
S S
SSSS
40
620
125
285
65
ne
g
95
30
740
60
55
565
55
435
510
985
1
9
5
3
8
0
4
0
2
0
2
6
5
2
7
0
2
9
5
2
0
9
0
2
9
5
1
5
1
2
0
31
0
85
11
0
16
5
35
0
39
0
320
1150
455
10
10
50
15
5
240
430
neg
20
10
390 5
Ea
st D
r.
65
115
25
335
70
840
S
250
300
410
40
660
50
10
10
Win
do
m S
t.
n
e
g
2
6
0
n
e
g
1
0
2
0
4
4
5
5
5
5
10
S
\\vhb\proj\Wat-TS\13581.04 WO4 - ERC Ph-1 Trans Sup\graphics\FIGURES\Networks.dwg
Figure 15b2022 Build ConditionsWeekday PM Peak Hour Vehicle Traffic Volumes Harvard ERC PDAAllston, Massachusetts
Not to Scale

Harvard ERC PDA – Transportation Impact Study
52 2022 Future Conditions
3.2.10 Transit Trips The office/lab and residential adjusted Project transit trips are distributed through the Project Study Area based on BTD’s published distribution data by mode for Area 17 (the zone for Allston) and assumes no Project transit trips utilize Harvard University Shuttles. Table 12 summarizes the transit distribution patterns.
Table 12 Transit Trip Distribution
Route Direction Residential Office Route 64 Inbound (to University Park) 1% 2% Outbound (to Oak Square) 0% 0% Route 66 Inbound (to Dudley Station) 9% 13% Outbound (to Harvard Station) 22% 17% Route 70 Inbound (to University Park) 12% 15% Outbound (to Cedarwood) 19% 15% Route 70A Inbound (to University Park) 4% 5% Outbound (to Cedarwood) 6% 5% Route 86 Inbound (to Reservoir Station) 22% 21% Outbound (to Sullivan Square Station) 5% 7% Total 100% 100%
Source: BTD’s published distribution data for Area 17: Allston.
The future 2022 Build Conditions transit trips were developed by assigning the Project-generated transit trips, summarized in Table 8, to the transit routes based on the distribution summarized above in Table 12. Table 13 shows the resulting 2022 Build Conditions peak hour transit trips by Route.
Table 13 Project-Generated Transit Trips
Weekday Morning Weekday Evening Route Direction Enter Exit Enter Exit Route 64 Inbound (to University Park) 2 0 0 2 Outbound (to Oak Square) 0 0 0 0 Route 66 Inbound (to Dudley Station) 13 3 3 14 Outbound (to Harvard Station) 18 7 7 20 Route 70 Inbound (to University Park) 15 4 4 16 Outbound (to Cedarwood) 16 6 6 17 Route 70A Inbound (to University Park) 5 1 1 5 Outbound (to Cedarwood) 5 2 2 6 Route 86 Inbound (to Reservoir Station) 22 7 7 23 Outbound (to Sullivan Square Station) 7 2 2 7

Harvard ERC PDA – Transportation Impact Study
53 2022 Future Conditions
3.2.11 Parking
3.2.11.1 Vehicle
The required vehicle parking supply for the Project was calculated using the guidelines provided by BTD. These guidelines identify proposed vehicle parking ratio goals by land use for each district within the City of Boston. Table 14 summarizes the required vehicle parking ranges for the Project based on the guidelines.
Table 14 Required Vehicle Parking
Land Use Size Rate Parking Supply
Office/Lab 400,000 sf 0.75 – 1.25 300 – 500 Residential 250 units 0.75 – 1.25 188 – 313 Hotel 200 rooms 0.40 80 Total 568 – 893
Source: Guidelines by the Boston Transportation Department for use by the Zoning Board of Appeal, based on Access Boston 2000-2010.
As shown in Table 14, BTD guidelines indicate that the Project should include between 568 and 893 vehicle parking spaces, depending on the level of transit service in the area. The proposed Project would include 800 to 900 parking spaces, to be provided in structured and surface parking areas, which would be consistent with BTD’s guidelines and the level of transit in the area.
3.2.11.2 Bicycle
The required bicycle parking supply for the Project was calculated using the off-street bicycle parking guidelines provided by the City of Boston. These guidelines identify minimum parking requirements by building type. Table 15 summarizes the required bicycle parking requirements by use and space type for the Project based on the guidelines.
Table 15 Required Bicycle Parking
Land Use Secure Spaces
Outdoor Spaces Total Spaces
Office/Lab 120 28 148 Residential 250 50 300 Hotel 75 50 125 Total 445 128 573
Source: City of Boston Off-Street Bicycle Parking Guidelines.
As shown in Table 15, the required bicycle parking supply for the Project is 573 total spaces. In addition, a bike share station is also required.

Harvard ERC PDA – Transportation Impact Study
54 Operations Analysis
4 Operations Analysis To assess quality of traffic flow, capacity analyses were conducted with respect to 2017 Existing Conditions and projected 2022 No-Build and 2022 Build Conditions for vehicular and transit modes. Capacity analyses provide an indication of how well the roadway facilities and transit system serve the demands placed on them. Calculated levels of service classify roadway operating conditions and volume to capacity ratios classify transit operating conditions.
More detailed analysis including bicycle and pedestrian analysis would be included as part of future Article 80 filings.
4.1 Vehicular Operations Analysis An intersection capacity analysis was conducted for the 2017 Existing Conditions and projected 2022 No-Build and 2022 Build Conditions weekday morning and weekday evening peak hours to determine how well the roadway facilities serve traffic demand. Intersection operating conditions are classified by a quantified level-of-service (LOS).
LOS is a qualitative measure of control delay at an intersection providing an index to the operational qualities of a roadway or intersection. LOS designations range from A to F, with LOS A representing the best operating conditions and LOS F representing the worst operating conditions. LOS D is typically considered acceptable in a downtown, urban environment, while LOS E indicates that vehicles experience significant delay and queuing. LOS F suggests unacceptable delays for the average vehicle. LOS designation is reported differently for signalized and

Harvard ERC PDA – Transportation Impact Study
55 Operations Analysis
unsignalized intersections. Longer delays at signalized intersections than at unsignalized intersections are perceived as acceptable.
For signalized intersections, the analysis considers the operations of each lane or lane group entering the intersection and the LOS designation is for the overall conditions at the intersection. For unsignalized intersections, however, this analysis assumes the traffic on the mainline is not affected by traffic on the side streets. The LOS is only determined for left turns from the main street and all movements from the minor street. The LOS designation is for the most critical movement, which is most often the left turn out of the side street.
Synchro 9.0 software was used to evaluate the LOS operations at the Project Study Area intersections. This analysis is based on the 2000 Highway Capacity Manual (HCM). Table 16 below presents the LOS delay threshold criteria as defined in the HCM.
Table 16 Level of Service Criteria
Level of Service Unsignalized Intersection Control Delay (sec/veh)
Signalized Intersection Control Delay (sec/veh)
LOS A 0 – 10 0 – 10 LOS B >10 – 15 >10 – 20 LOS C >15 – 25 >20 – 35 LOS D >25 – 35 >35 – 55 LOS E >35 – 50 >55 – 80 LOS F >50 >80
Source: 2000 Highway Capacity Manual.
Adjustments were made to the Synchro model to include the characteristics of each intersection, such as geometry, signal timings, heavy vehicles, bicycle conflicts, and pedestrian crossings. In addition, the 2017 Existing Conditions synchro model was calibrated, within the limitations of the program, to reflect observed queues.
The intersection capacity analysis results are summarized in Tables 17 and 18 for signalized and unsignalized intersections, respectively, and included in the Appendix.
As shown in Table 17, the signalized intersection of Western Avenue at Batten Way/Hague Street is expected to experience improved operations under the 2022 Build Conditions compared to the 2022 No-Build Conditions, with the discontinuation of Hague Street.
The following signalized intersections are projected to operate at LOS E/F in the 2022 No-Build Conditions and are expected to continue to operate at the same LOS in the 2022 Build Conditions:
› North Harvard Street at Western Avenue (weekday evening peak hour): The intersection is projected to operate at overall LOS E during both the 2022 No-Build and 2022 Build Conditions. In addition, the westbound through/right-turn queue is expected to increase by approximately 150 feet between 2022 No-Build and 2022 Build Conditions due to inclusion of Project related trips. The

Harvard ERC PDA – Transportation Impact Study
56 Operations Analysis
intersection was calibrated to existing field observations of queues under 2017 Existing Conditions, however due to limitations of the Synchro model, the analysis results were still slightly worse than observed operations.
› Cambridge Street at I-90 Ramps/Double Tree Driveway (both peak hours): The intersection is projected to operate at overall LOS F during both the 2022 No-Build and 2022 Build Conditions. As previously mentioned, the intersection is currently under construction and the 2017 Existing Conditions analysis reflect the observed conditions. The Future Conditions analysis reflects the proposed conditions with the improvements in place.
› Western Avenue at Soldiers Field Road (west) (weekday evening peak hour): The intersection is projected to operate at overall LOS F during both the 2022 No-Build and 2022 Build Conditions.
› Western Avenue at Soldiers Field Road (east) (weekday morning peak hour): The intersection is projected to operate at overall LOS E during both the 2022 No-Build and 2022 Build Conditions.
As shown in Table 18, the following unsignalized intersections are projected to operate at LOS E/F in the 2022 No-Build Conditions and are expected to continue to operate at the same LOS in the 2022 Build Conditions:
› Western Avenue at Kresge Way/Genzyme Driveway/East Drive (weekday evening peak hour): The northbound approach is projected to operate at LOS F during the 2022 No-Build Conditions and 2022 Build Conditions and the queue or this approach is expected to increase between 2022 No-Build and 2022 Build Conditions.

Harvard ERC PDA – Transportation Impact Study
57 Operations Analysis
Table 17 Signalized Intersection Capacity Analysis Location / Movement
2017 Existing Conditions 2022 No-Build Conditions 2022 Build Conditions v/c a Del b LOS c 50 Q d 95 Q e v/c Del LOS 50 Q 95 Q v/c Del LOS 50 Q 95 Q
North Harvard Street/Anderson Memorial Bridge at Soldiers Field Road (north) Weekday Morning
WB L/T 0.38 36 D 49 93 0.36 36 D 47 93 0.36 36 D 47 93 WB R 0.31 25 C 39 91 0.26 24 C 26 77 0.26 24 C 27 79 NB L/T 0.59 6 A 38 m44 0.57 5 A 28 m43 0.58 5 A 28 m43 SB T/R 0.60 18 B 201 301 0.67 20 B 236 352 0.69 20 C 246 367 Overall 0.63 14 B 0.66 14 B 0.68 14 B
Weekday Evening WB L/T 0.67 43 D 90 #164 0.64 41 D 85 #160 0.64 41 D 85 #160 WB R 0.48 26 C 69 137 0.46 26 C 64 141 0.47 26 C 69 145 NB L/T 0.64 7 A 36 m45 0.78 8 A 28 m47 0.82 9 A 33 m47 SB T/R 0.65 19 B 231 336 0.67 19 B 240 355 0.68 20 B 243 360 Overall 0.74 17 B 0.84 17 B 0.86 17 B
North Harvard Street at Soldiers Field Road (south) Weekday Morning
EB L 1.03 104 F ~156 #248 0.87 66 E 127 #260 0.87 66 E 127 #260 EB L/T/R 0.88 68 E 118 #195 0.99 96 F 128 #292 0.99 96 F 128 #292 NB T/R 0.69 35 D 145 183 0.67 34 C 140 198 0.68 35 C 144 203 SB L 0.86 31 C 54 #245 0.91 38 D 66 #269 0.91 40 D 70 #273 SB T 0.20 2 A 6 9 0.22 2 A 7 9 0.24 2 A 7 10 Overall 0.76 44 D 0.79 43 D 0.79 44 D
Weekday Evening EB L 0.96 86 F 142 #253 0.87 66 E 127 #260 0.87 66 E 127 #260 EB L/T/R 1.00 102 F 132 #252 0.97 91 F 124 #280 0.97 91 F 124 #280 NB T/R 0.60 32 C 133 187 0.75 37 D 175 240 0.79 38 D 187 255 SB L 0.67 15 B 47 102 0.73 21 C 50 #146 0.74 24 C 57 #188 SB T 0.34 2 A 9 12 0.35 2 A 10 13 0.36 2 A 10 13 Overall 0.67 39 D 0.71 36 D 0.73 37 D
Note: Shaded cells denote LOS E/F conditions. a Volume to capacity ratio. b Average total delay, in seconds per vehicle. c Level-of-service. d 50th percentile queue, in feet. e 95th percentile queue, in feet. ~ Volume exceeds capacity, queue is theoretically infinite. # 95th percentile volume exceeds capacity, queue may be longer. m Volume for 95th percentile queue is metered by upstream signal.

Harvard ERC PDA – Transportation Impact Study
58 Operations Analysis
Table 17 Signalized Intersection Capacity Analysis (continued) Location / Movement
2017 Existing Conditions 2022 No-Build Conditions 2022 Build Conditions v/c a Del b LOS c 50 Q d 95 Q e v/c Del LOS 50 Q 95 Q v/c Del LOS 50 Q 95 Q
North Harvard Street at Western Avenue Weekday Morning
EB L 0.52 27 C 81 133 0.50 24 C 80 144 0.52 25 C 80 144 EB T/R 0.51 37 D 213 317 0.58 36 D 236 381 0.71 41 D 307 #538 WB L 0.20 27 C 34 68 0.23 25 C 34 73 0.28 26 C 34 73 WB T/R 0.75 49 D 293 #468 0.66 41 D 254 #419 0.70 43 D 274 #462 NB L 0.84 61 E 137 #184 0.86 65 E 138 #247 0.86 65 E 138 #247 NB T/R 0.63 41 D 209 256 0.73 46 D 222 327 0.72 45 D 217 320 SB L/T 0.87 76 E 172 216 0.75 61 E 130 208 0.75 61 E 130 208 SB R 0.11 36 D 0 27 0.09 37 D 0 48 0.09 37 D 0 48 Overall 0.66 46 D 0.61 43 D 0.66 44 D
Weekday Evening EB L 0.65 40 D 63 #112 0.71 46 D 71 #155 0.74 50 D 71 #166 EB T/R 0.30 35 D 144 211 0.40 39 D 196 280 0.43 40 D 216 308 WB L 0.26 27 C 78 122 0.32 29 C 86 135 0.32 29 C 82 130 WB T/R 0.85 56 E 591 #804 0.84 56 E 573 #789 0.95 70 E ~711 #956 NB L 0.70 49 D 109 #177 0.96 100 F 143 #276 0.96 100 F 143 #276 NB T/R 0.46 42 D 193 280 0.50 42 D 227 322 0.50 42 D 227 322 SB L/T 0.90 83 F 288 #397 0.93 87 F 337 #519 0.93 87 F 337 #519 SB R 0.29 42 D 39 97 0.36 43 D 62 149 0.36 43 D 62 149 Overall 0.72 51 D 0.78 57 E 0.82 61 E
Cambridge Street at North Harvard Street Weekday Morning
EB L 0.67 53 D 92 151 0.78 61 E 122 #198 0.77 59 E 119 191 EB T 0.76 20 B 398 490 0.85 24 C 495 611 0.87 25 C 521 643 WB T 0.66 8 A 156 249 0.90 12 B 294 m#384 0.90 16 B 312 #538 WB R 0.23 15 B 29 m54 0.38 10 B 48 m57 0.38 8 A 36 m46 SB L 0.69 41 D 215 321 0.74 44 D 237 352 0.74 44 D 237 352 SB R 0.18 16 B 43 75 0.21 16 B 56 94 0.21 16 B 57 94 Overall 0.79 20 B 0.87 22 C 0.89 24 C
Weekday Evening EB L 0.83 66 E 143 #253 0.88 72 E 162 #296 0.88 72 E 162 #296 EB T 0.56 13 B 244 301 0.68 15 B 333 408 0.68 15 B 337 413 WB T 0.86 15 B 466 465 0.92 17 B 508 m#620 0.95 21 C 505 #648 WB R 0.31 10 B 56 m56 0.35 10 B 56 m56 0.36 8 A 48 m49 SB L 0.68 45 D 193 267 0.75 49 D 219 #345 0.75 49 D 219 #345 SB R 0.36 19 B 110 157 0.41 19 B 130 201 0.40 19 B 128 198 Overall 0.80 19 B 0.86 22 C 0.87 23 C
Note: Shaded cells denote LOS E/F conditions. a Volume to capacity ratio. b Average total delay, in seconds per vehicle. c Level-of-service. d 50th percentile queue, in feet. e 95th percentile queue, in feet. ~ Volume exceeds capacity, queue is theoretically infinite. # 95th percentile volume exceeds capacity, queue may be longer. m Volume for 95th percentile queue is metered by upstream signal.

Harvard ERC PDA – Transportation Impact Study
59 Operations Analysis
Table 17 Signalized Intersection Capacity Analysis (continued) Location / Movement
2017 Existing Conditions 2022 No-Build Conditions 2022 Build Conditions v/c a Del b LOS c 50 Q d 95 Q e v/c Del LOS 50 Q 95 Q v/c Del LOS 50 Q 95 Q
Cambridge Street at Windom Street Weekday Morning
EB L 0.08 22 C 2 m4 0.11 34 C 3 m6 0.40 31 C 9 m15 EB T 0.27 6 A 53 74 0.29 7 A 57 m96 0.28 6 A 53 m85 WB T 0.80 25 C 421 520 0.94 35 D 574 #767 0.90 28 C 536 662 WB R 0.38 16 B 0 49 0.45 18 B 27 102 0.56 18 B 20 103 SB L 0.58 43 D 169 242 0.57 43 D 164 250 n/a n/a n/a n/a n/a SB R 0.02 33 C 3 21 0.02 33 C 3 21 n/a n/a n/a n/a n/a SB L/R n/a n/a n/a n/a n/a n/a n/a n/a n/a n/a 0.66 47 D 188 282 Overall 0.70 21 C 0.79 27 C 0.80 24 C
Weekday Evening EB L 0.09 23 C 3 m4 0.08 27 C 2 m3 0.16 23 C 4 m5 EB T 0.31 6 A 66 77 0.36 6 A 78 90 0.35 6 A 75 86 WB T 0.85 27 C 486 583 0.91 32 C 559 #697 0.87 26 C 522 640 WB R 0.33 16 B 12 58 0.34 16 B 21 77 0.36 14 B 14 63 SB L 0.27 37 D 73 117 0.34 38 D 94 155 n/a n/a n/a n/a n/a SB R 0.03 33 C 0 29 0.04 33 C 0 35 n/a n/a n/a n/a n/a SB L/R n/a n/a n/a n/a n/a n/a n/a n/a n/a n/a 0.63 46 D 172 265 Overall 0.65 21 C 0.72 23 C 0.78 21 C
Cambridge Street at I-90 Ramps/Double Tree Driveway Weekday Morning
EB L 0.06 52 D 12 34 0.07 49 D 17 43 0.07 49 D 17 43 EB T >1.20 >120 F ~525 #656 >1.20 >120 F ~561 #694 >1.20 >120 F ~567 #700 WB T/R 0.23 14 B 5 7 0.28 0 A 0 0 0.31 0 A 0 0 NB L/T/R 0.24 58 E 24 12 0.38 89 F 15 #100 0.38 89 F 15 #100 NEB L/R 0.46 31 C 200 278 0.52 34 C 226 322 0.50 34 C 218 313 NEB R 0.50 28 C 221 272 0.56 31 C 252 319 0.54 30 C 243 308 Overall 0.64 >120 F 0.71 109 F 0.71 110 F
Weekday Evening EB L 0.03 49 D 8 25 0.19 52 D 43 86 0.21 52 D 48 94 EB T 1.19 >120 F ~421 #550 >1.20 >120 F ~623 #757 >1.20 >120 F ~644 #780 WB T/R 0.23 2 A 0 0 0.29 2 A 13 7 0.29 2 A 15 8 NB L/T/R 0.28 63 E 23 62 0.49 99 F 20 #108 049 99 F 20 #108 NEB L/R 0.48 31 C 216 308 0.55 35 D 259 366 0.55 35 D 256 362 NEB R 0.52 28 C 243 307 0.61 32 C 292 365 0.60 32 C 289 362 Overall 0.63 66 E 0.76 >120 F 0.76 >120 F
Note: Shaded cells denote LOS E/F conditions. a Volume to capacity ratio. b Average total delay, in seconds per vehicle. c Level-of-service. d 50th percentile queue, in feet. e 95th percentile queue, in feet. f Movement for Build Conditions ~ Volume exceeds capacity, queue is theoretically infinite. # 95th percentile volume exceeds capacity, queue may be longer. m Volume for 95th percentile queue is metered by upstream signal. n/a Not applicable, lane group does not exist under this condition.

Harvard ERC PDA – Transportation Impact Study
60 Operations Analysis
Table 17 Signalized Intersection Capacity Analysis (continued) Location / Movement
2017 Existing Conditions 2022 No-Build Conditions 2022 Build Conditions v/c a Del b LOS c 50 Q d 95 Q e v/c Del LOS 50 Q 95 Q v/c Del LOS 50 Q 95 Q
Cambridge Street at Soldiers Field Road (west) Weekday Morning
EB T/R 0.54 18 B 279 m244 0.68 13 B 276 m246 0.67 13 B 266 m236 EB R 0.29 63 E 105 m91 0.34 48 D 120 m96 0.34 51 D 118 m96 WB L/T 0.25 0 A 0 m0 0.63 6 A 13 m12 0.67 7 A 15 m13 SB L 0.94 103 F 215 #384 0.69 58 E 206 310 0.70 59 E 209 315 SB L/T 0.84 70 E 193 #270 0.62 53 D 190 251 0.64 54 D 196 258 SB R 0.04 52 D 0 0 0.05 45 D 0 0 0.05 45 D 0 0 Overall 0.58 37 D 0.73 26 C 0.74 27 C
Weekday Evening EB T/R 0.65 23 C 343 m337 0.74 13 B 308 m263 0.74 13 B 301 m254 EB R 0.32 56 E 129 m143 0.40 35 D 155 m124 0.41 37 D 156 m124 WB L/T 0.19 0 A 0 0 0.45 3 A 2 m12 0.46 3 A 2 m12 SB L 0.96 107 F 225 #408 0.74 62 E 229 #358 0.76 63 E 236 #370 SB L/T 0.92 82 F 221 #329 0.81 61 E 263 336 0.84 63 E 275 #365 SB R 0.11 52 D 0 68 0.11 46 D 0 65 0.11 46 D 0 65 Overall 0.61 42 D 0.75 28 C 0.76 29 C
Cambridge Street/River Street at Soldiers Field Road (east) Weekday Morning
EB L/T 0.51 0 A 1 m1 0.56 0 A 0 3 0.56 0 A 0 3 NB L 0.89 79 E 276 #451 1.10 >120 F ~382 #592 1.18 >120 F ~433 #648 NB L/T/R 0.85 76 E 226 #383 >1.20 >120 F ~397 #606 >1.20 >120 F ~409 617 Overall 0.67 18 B 0.80 43 D 0.80 50 D
Weekday Evening EB L/T 0.58 0 A 0 m0 0.61 0 A 0 3 0.61 0 A 0 3 NB L 0.53 45 D 187 280 0.80 65 E 250 #382 0.81 65 E 256 #394 NB L/T/R 0.55 46 D 178 270 0.87 76 E 251 #409 0.89 78 E 257 #420 Overall 0.65 9 A 0.76 15 B 0.77 16 B
Note: Shaded cells denote LOS E/F conditions. a Volume to capacity ratio. b Average total delay, in seconds per vehicle. c Level-of-service. d 50th percentile queue, in feet. e 95th percentile queue, in feet. ~ Volume exceeds capacity, queue is theoretically infinite. # 95th percentile volume exceeds capacity, queue may be longer. m Volume for 95th percentile queue is metered by upstream signal.

Harvard ERC PDA – Transportation Impact Study
61 Operations Analysis
Table 17 Signalized Intersection Capacity Analysis (continued) Location / Movement
2017 Existing Conditions 2022 No-Build Conditions 2022 Build Conditions v/c a Del b LOS c 50 Q d 95 Q e v/c Del LOS 50 Q 95 Q v/c Del LOS 50 Q 95 Q
Western Avenue at Soldiers Field Road (west) Weekday Morning
EB R 0.71 42 D 110 156 0.73 41 D 131 190 0.77 42 D 144 210 WB L 0.64 8 A 0 62 0.79 13 B 65 m72 0.82 13 B 65 m68 WB T 0.42 1 A 6 m6 0.64 4 A 31 m45 0.64 4 A 48 m28 SB T/R 0.90 48 D 253 #352 0.92 50 D 266 #376 0.93 53 D 273 #390 Overall 0.73 25 C 0.82 26 C 0.84 27 C
Weekday Evening EB R 0.87 51 D 126 #222 >1.20 >120 F ~292 #419 >1.20 >120 F ~379 #511 WB L 0.61 7 A 16 m54 0.66 9 A 53 m60 0.66 8 A 50 m58 WB T 0.45 0 A 3 m5 0.54 0 A 4 m9 0.54 0 A 4 m8 SB T/R 1.12 113 F ~234 #347 1.19 >120 F ~259 #374 1.20 >120 F ~262 #377 Overall 0.77 40 D 0.93 84 F 0.99 119 F
Western Avenue at Soldiers Field Road (east) Weekday Morning
WB T/R 0.83 33 C 313 #468 1.06 74 E ~458 #574 1.10 91 F ~484 #582 NB L/T 0.32 36 D 52 75 0.31 33 C 44 86 0.29 32 C 43 85 Overall 0.46 34 C 0.53 66 E 0.53 79 E
Weekday Evening WB T/R 0.94 33 C 370 #491 1.03 53 D ~471 #567 1.03 54 D ~473 #570 NB L/T 0.54 35 C 84 124 0.59 35 C 96 148 0.58 35 C 94 145 Overall 0.65 33 C 0.71 50 D 0.71 51 D
Western Avenue at Hague Street/Batten Way Weekday Morning
EB L 0.18 14 B 16 69 0.42 21 C 24 #116 0.17 3 A 10 27 EB T/R 0.35 15 B 52 192 0.45 18 B 76 255 0.33 3 A 67 122 WB L 0.09 12 B 8 42 0.22 15 B 20 84 n/a n/a n/a n/a n/a WB T/R 0.49 17 B 98 312 0.80 29 C 192 #644 0.59 4 A 76 59 NB L/T 0.60 36 D 56 140 0.65 39 D 63 161 n/a n/a n/a n/a n/a NB R 0.23 32 C 0 72 0.22 32 C 0 85 n/a n/a n/a n/a n/a SB L/T/R 0.39 38 D 13 53 0.35 37 D 16 67 0.47 56 E 32 77 Overall 0.48 23 C 0.69 27 C 0.61 6 A
Weekday Evening EB L 0.11 14 B 5 29 0.38 33 C 9 #57 0.22 13 B 6 31 EB T/R 0.22 14 B 39 127 0.49 23 C 115 288 0.35 11 B 93 208 WB L 0.08 13 B 9 41 0.14 18 B 13 52 n/a n/a n/a n/a n/a WB T/R 0.80 28 C 197 #618 1.09 89 F ~387 #876 0.98 30 C 95 m#1059 NB L/T 0.65 38 D 63 154 0.72 45 D 83 #213 n/a n/a n/a n/a n/a NB R 0.13 31 C 0 62 0.16 34 C 0 72 n/a n/a n/a n/a n/a SB L/T/R 0.07 36 D 0 19 0.74 47 D 84 #235 0.75 61 E 129 #307 Overall 0.67 28 C 0.89 57 E 0.87 29 C
Note: Shaded cells denote LOS E/F conditions. a Volume to capacity ratio. b Average total delay, in seconds per vehicle. c Level-of-service. d 50th percentile queue, in feet. e 95th percentile queue, in feet. ~ Volume exceeds capacity, queue is theoretically infinite. # 95th percentile volume exceeds capacity, queue may be longer. m Volume for 95th percentile queue is metered by upstream signal. n/a Not applicable, lane group does not exist under this condition.

Harvard ERC PDA – Transportation Impact Study
62 Operations Analysis
Table 17 Signalized Intersection Capacity Analysis (continued) Location / Movement
2017 Existing Conditions 2022 No-Build Conditions 2022 Build Conditions v/c a Del b LOS c 50 Q d 95 Q e v/c Del LOS 50 Q 95 Q v/c Del LOS 50 Q 95 Q
Western Avenue at Cattle Drive Weekday Morning
EB T/R
Intersection does not exist under 2017 Existing Conditions
Intersection does not exist under 2022 No-Build Conditions
0.97 74 E 355 #578 WB L 0.44 29 C 47 84 WB T 0.74 34 C 362 502 NB L 0.51 47 D 143 #254 NB R 0.69 41 D 273 #435 Overall 0.75 48 D
Weekday Evening EB T/R
Intersection does not exist under 2017 Existing Conditions
Intersection does not exist under 2022 No-Build Conditions
0.76 37 D 372 #555 WB L 0.24 23 C 26 54 WB T 0.87 42 D 543 #801 NB L 0.89 75 E 212 #385 NB R 0.77 51 D 240 #390 Overall 0.80 47 D
Note: Shaded cells denote LOS E/F conditions. a Volume to capacity ratio. b Average total delay, in seconds per vehicle. c Level-of-service. d 50th percentile queue, in feet. e 95th percentile queue, in feet. # 95th percentile volume exceeds capacity, queue may be longer.

Harvard ERC PDA – Transportation Impact Study
63 Operations Analysis
Table 18 Unsignalized Intersection Capacity Analysis Location / Movement
2017 Existing Conditions 2022 No-Build Conditions 2022 Build Conditions D a v/c b Del c LOS d 95 Q e D v/c Del LOS 95 Q D v/c Del LOS 95 Q
North Harvard Street at Bertram Street/Spurr Street Weekday Morning
EB L 35 0.13 17 C 11 35 0.12 18 C 10 35 0.12 18 C 10 EB R 180 0.33 13 B 36 185 0.28 12 B 29 185 0.28 12 B 29 WB L/R 7 0.02 14 B 2 7 0.02 14 B 1 7 0.02 14 B 1 SB L 5 0.01 0 A 1 5 0.01 0 A 0 5 0.01 0 A 0
Weekday Evening EB L 20 0.06 15 B 5 20 0.07 18 C 6 20 0.07 18 C 6 EB R 225 0.38 13 B 45 240 0.39 14 B 47 240 0.39 14 B 46 WB L/R 30 0.09 13 B 8 30 0.08 15 B 7 30 0.08 15 B 7 SB L 2 0 0 A 0 2 0 0 A 0 2 0 0 A 0
Western Avenue at Kresge Way/Genzyme Driveway/East Drive Weekday Morning
NB L/T/R 25 0.19 29 D 17 45 0.58 94 F 65 90 >1.20 >120 F 209 EB L 85 0.10 9 A 8 85 0.12 10 B 10 85 0.12 10 B 10 WB L 35 0.04 1 A 3 55 0.07 2 A 5 70 0.09 2 A 7
Weekday Evening NB L/T/R 55 0.24 25 C 23 80 0.61 63 F 79 160 1.17 >120 F 245 EB L 30 0.04 9 A 3 30 0.04 10 A 3 30 0.04 10 A 3 WB L 20 0.02 1 A 2 45 0.07 2 A 6 55 0.10 3 A 8
Windom Street at Cattle Drive Extension/Dedham Parrish Road Weekday Morning
EB L/R Intersection does not exist under 2017 Existing Conditions
Intersection does not exist under 2022 No-Build Conditions
10 0.01 10 A 1 NB L 25 0.02 1 A 2
Weekday Evening EB L/R Intersection does not exist under 2017
Existing Conditions Intersection does not exist under 2022
No-Build Conditions 10 0.01 10 A 1
NB L 20 0.02 1 A 1 Note: Shaded cells denote LOS E/F conditions. a Demand, in vehicles b Volume to capacity ratio. c Average total delay, in seconds per vehicle. d Level-of-service. e 95th percentile queue, in feet.

Harvard ERC PDA – Transportation Impact Study
64 Operations Analysis
4.2 Transit Operations Analysis The transit operational analysis focuses on five MBTA bus routes that operate through or near the Project Study Area, as previously discussed, for the 2017 Existing Conditions and projected 2022 No-Build and 2022 Build Conditions weekday morning and weekday evening peak hours.
Existing MBTA bus capacity is based on vehicle load standards from MBTA’s Service Delivery Policy Capacity and MBTA Blue Book 14th edition data. Policy Capacity refers to the load standards or passengers per car volume defined by the MBTA’s Service Delivery Policy which states the standards “establish the average maximum number of passengers allowed per vehicle to provide a safe and comfortable ride.” Each vehicle type in the MBTA fleet has a defined “policy capacity” and is published in the MBTA Blue Book.
Each bus route operates under different frequencies during the peak hours. The number of buses servicing the Project Study Area was determined by the time stamp information provided with the load profile data. Table 19 summarizes the existing frequency and capacity of each bus during the weekday morning and weekday evening peak hours.

Harvard ERC PDA – Transportation Impact Study
65 Operations Analysis
Table 19 MBTA Bus Frequency and Capacity
Frequency
Policy Capacity per Bus
Peak Hour Policy Capacity
AM Peak Hour Bus 64 Inbound (to University Park) 5 54 270 Bus 64 Outbound (to Oak Square) 4 54 216 Bus 66 Inbound (to Dudley Station) 8 54 432 Bus 66 Outbound (to Harvard Station) 6 54 324 Bus 70 Inbound (to University Park) 6 54 324 Bus 70 Outbound (to Cedarwood) 3 54 162 Bus 70A Inbound (to University Park) 2 54 108 Bus 70A Outbound (to Cedarwood) 2 54 108 Bus 86 Inbound (to Reservoir Station) 5 54 270 Bus 86 Outbound (to Sullivan Square Station) 6 54 324 PM Peak Hour Bus 64 Inbound (to University Park) 2 54 108 Bus 64 Outbound (to Oak Square) 2 54 108 Bus 66 Inbound (to Dudley Station) 7 54 378 Bus 66 Outbound (to Harvard Station) 7 54 378 Bus 70 Inbound (to University Park) 5 54 270 Bus 70 Outbound (to Cedarwood) 4 54 216 Bus 70A Inbound (to University Park) 2 54 108 Bus 70A Outbound (to Cedarwood) 2 54 108 Bus 86 Inbound (to Reservoir Station) 5 54 270 Bus 86 Outbound (to Sullivan Square Station) 4 54 216
Existing ridership was determined from load profiles provided by the MBTA for Fall 2016, the most recent data available. To determine 2022 No-Build Conditions ridership, a growth rate of 1.2 percent per year6 for five years was applied to the existing ridership and transit trips7 associated with planned developments were added on. Project-generated transit trips were then layered on based on the transit trip distribution to calculate 2022 Build Conditions ridership. This data was used to calculate v/c ratios for the closest stop to the Project Site on each of the five bus routes. Table 20 summarizes the MBTA bus conditions.
6 Hub and Spoke, Northeastern University, June 2012. 7 Based on Harvard University’s 2013 Institutional Master Plan and includes transit trips associated with the Ten-Year plan projects,
Continuum, and Science.

Harvard ERC PDA – Transportation Impact Study
66 Operations Analysis
Table 20 MBTA Bus Policy Capacity Analysis
2017 Existing 2022 No-Build 2022 Build
Entering v/c a
Exiting v/c a
Entering v/c
Exiting v/c
Entering v/c
Exiting v/c
AM Peak Hour Bus 64 Inbound (to University Park) 0.78 0.80 0.84 0.84 0.84 0.84 Bus 64 Outbound (to Oak Square) 0.15 0.16 0.16 0.17 0.16 0.17 Bus 66 Inbound (to Dudley Station) 0.18 0.18 0.25 0.22 0.28 0.23 Bus 66 Outbound (to Harvard Station) 0.78 0.79 1.09 0.85 1.15 0.88 Bus 70 Inbound (to University Park) 0.76 0.75 0.84 0.82 0.89 0.84 Bus 70 Outbound (to Cedarwood) 0.57 0.56 0.91 0.60 1.01 0.64 Bus 70A Inbound (to University Park) 0.70 0.69 0.82 0.81 0.87 0.81 Bus 70A Outbound (to Cedarwood) 0.56 0.55 0.90 0.60 0.94 0.62 Bus 86 Inbound (to Reservoir Station) 0.44 0.42 0.68 0.46 0.76 0.49 Bus 86 Outbound (to Sullivan Square Station) 0.89 0.93 1.03 1.02 1.05 1.02 PM Peak Hour Bus 64 Inbound (to University Park) 0.25 0.26 0.28 0.28 0.28 0.30 Bus 64 Outbound (to Oak Square) 0.72 0.71 0.77 0.77 0.77 0.77 Bus 66 Inbound (to Dudley Station) 0.74 0.74 0.80 0.94 0.81 0.98 Bus 66 Outbound (to Harvard Station) 0.39 0.38 0.49 0.47 0.51 0.52 Bus 70 Inbound (to University Park) 0.52 0.53 0.57 0.71 0.58 0.77 Bus 70 Outbound (to Cedarwood) 0.63 0.63 0.74 0.72 0.77 0.80 Bus 70A Inbound (to University Park) 0.68 0.69 0.73 0.98 0.74 1.03 Bus 70A Outbound (to Cedarwood) 0.72 0.72 0.86 0.82 0.88 0.88 Bus 86 Inbound (to Reservoir Station) 0.68 0.69 0.78 0.82 0.81 0.90 Bus 86 Outbound (to Sullivan Square Station) 0.52 0.56 0.59 0.76 0.60 0.79
Note: Shaded cells denote routes where passenger volumes approach or exceed capacity a volume to capacity ratio
The existing peak hour ridership within the Project Study Area is accommodated by the existing capacity of the buses under scheduled conditions. The Route 86 outbound bus is nearly at the policy capacity during the weekday morning peak hour and experiences moderate crowding. All remaining bus routes experience slight to minimal crowding under 2017 Existing Conditions. It should be noted that the analysis is based on scheduled conditions and does not account for traffic congestion, bus bunching, or other factors that may impact passenger crowding.
The estimated 2022 No-Build Conditions ridership demand is shown to be accommodated by the existing scheduled capacity for all bus routes with the exception of the Route 66 outbound and Route 86 outbound. Both the Route 66 outbound and Route 86 outbound are projected to exceed the MBTA policy capacity (with v/c ratios above 1.0) during the weekday morning peak hour. The Route 70 outbound and Route 70A outbound during the weekday morning peak hour and the Route 66 inbound and Route 70A inbound during the weekday evening peak hour
Harvard ERC PDA – Transportation Impact Study
67 Operations Analysis
are all close to the MBTA policy capacity with v/c ratios nearing but not exceeding 1.0.
Under the 2022 Build Conditions, the Project-generated trips have a slight impact on bus capacities. Both the Route 66 outbound and Route 86 outbound are expected to continue to exceed the MBTA policy capacity (with v/c ratios above 1.0) during the weekday morning peak hour. Additionally, the Route 70 outbound and the Route 70A inbound are expected to exceed the MBTA policy capacity during the weekday morning and weekday evening peak hours, respectively. All remaining bus routes are expected to operate within the MBTA policy capacity. It should be noted that future conditions transit analysis does not account for potential capacity enhancements. Specifically, the recently completed Arsenal Street Corridor Study8 outlined a series of potential service enhancements for the Route 70/70A that could increase capacity and improve operations. These improvements are currently in the planning stages; as such, to be conservative all future transit analysis assumes existing capacity conditions.
8 Arsenal Street Corridor Study, VHB, June 2017.

Harvard ERC PDA – Transportation Impact Study
68 Transportation Mitigation
5 Transportation Mitigation Proposed improvements focus on reducing and managing traffic impacts expected from the Project while improving multimodal access and conditions, consistent with City of Boston Complete Street Guidelines. It should be noted that it is anticipated that the draft mitigation discussed below shall be refined in consultation with BTD and the BPDA as part of the Article 80 process (e.g. Large Project Review and ERC PDA Development Plan) for each development site.
5.1 Transportation Demand Management A Transportation Demand Management (TDM) program will be implemented as part of the ERC PDA Project. The TDM program is an important tool to help manage vehicular trips and support alternative modes of transportation. The TDM program will be refined in consultation with BTD and the BPDA as part of the Article 80 process, but could potentially include the following elements:
› Join the Allston/Brighton Transportation Management Association (TMA) › Designate a TDM coordinator to facilitate and assist with various TDM measures › Encourage use of carpools and vanpools › Designate preferential parking spaces for carpool only, vanpool only, and/or low
emissions vehicles › Provide electric vehicle charging stations › Provide Zipcars › Provide secure bike parking

Harvard ERC PDA – Transportation Impact Study
69 Transportation Mitigation
› Provide a Hubway station › Subsidize transit passes for residents and employees
5.2 Roadway and Intersection Improvements Based on the results of the vehicular operations analysis, Project trips are projected to impact operations at some Project Study Area intersections. The following sections identify measures to mitigate these Project’s impacts.
5.2.1 Signal Timing Optimization Signal timing optimization has been identified for the following intersections to mitigate the Project’s impacts:
› Western Avenue at North Harvard Street (Barry’s Corner) › Cambridge Street at I-90 Ramps/Double Tree Hotel/Soldiers Field Road › Western Avenue at Soldiers Field Road
Table 21 summarizes the overall intersection operations with the mitigation in place. As shown, operations under the 2022 Build with Mitigation Conditions improve upon expected operations in the 2022 Build Conditions and approach expected operations under 2022 No-Build Conditions.

Harvard ERC PDA – Transportation Impact Study
70 Transportation Mitigation
Table 21 Signalized Intersection Capacity Analysis with Mitigation
2022 No-Build Conditions 2022 Build Conditions 2022 Build with Mitigation Conditions
Location v/c a Del b LOS c v/c Del LOS v/c Del LOS North Harvard Street at Western Avenue Weekday Morning 0.61 43 D 0.66 44 D 0.63 43 D Weekday Evening 0.78 57 E 0.82 61 E 0.81 60 E Cambridge Street at I-90 Ramps/Double Tree Driveway Weekday Morning 0.71 109 F 0.71 110 F 0.72 102 F Weekday Evening 0.76 >120 F 0.76 >120 F 0.76 >120 F Cambridge Street at Soldiers Field Road (west) Weekday Morning 0.73 26 C 0.74 27 C 0.74 26 C Weekday Evening 0.75 28 C 0.76 29 C 0.76 28 C Cambridge Street/River Street at Soldiers Field Road (east) Weekday Morning 0.80 43 D 0.80 50 D 0.80 40 D Weekday Evening 0.76 16 B 0.77 16 B 0.77 15 B Western Avenue at Soldiers Field Road (west) Weekday Morning 0.82 26 C 0.84 27 C 0.84 26 C Weekday Evening 0.93 84 F 0.99 119 F 0.99 115 F Western Avenue at Soldiers Field Road (east) Weekday Morning 0.53 66 E 0.53 79 E 0.53 67 E Weekday Evening 0.71 50 D 0.71 51 D 0.71 51 D
a Volume to capacity ratio. b Average total delay, in seconds per vehicle. c Level-of-service.
5.2.2 Western Avenue Corridor Recent and on-going improvements along Western Avenue west of the Project Site were discussed in detail in Chapter 3. This section discusses proposed efforts to extend multimodal improvements along Western Avenue consistent with on-going efforts and to maintain acceptable traffic operations and progression along the corridor.
5.2.2.1 Streetscape
As part of the SEC project, the Western Avenue streetscape is being reconstructed to include a street-level buffered bike lane on the northern side (westbound) of Western Avenue from Batten Way to Academic Way. A sidewalk-level separated bike lane will be provided on the southern side (eastbound) from Academic Way to Hague Street, and will transition to a street-level buffered bike lane west of Hague Street. One travel lane, on-street parking for public use, and sidewalks will be provided in each direction of Western Avenue. The existing curb-to-curb width of 47 feet will be maintained.

Harvard ERC PDA – Transportation Impact Study
71 Transportation Mitigation
As part of the ERC PDA Project, and in consultation with the BTD and BPDA, there is the potential to extend the Western Avenue streetscape adjacent to the ERC PDA to improve multimodal conditions along the corridor. This would include enhancing the southern sidewalk, modifying the southern side (eastbound) bike lane to a sidewalk-level cycle track, continuing the northern side (westbound) street-level buffered bike lane, restriping the street to provide a westbound left-turn lane at Cattle Drive, and providing below ground infrastructure to allow for future intersection signalization, as discussed below. It is anticipated that the eastern limits of the Western Avenue streetscape extension will be defined in consultation with BTD and the BPDA as part of the Article 80 process.
5.2.2.2 Traffic Control and Progression
As part of the Project, two existing intersections will be modified and one new intersection will be created along the Western Avenue corridor. A review of traffic control and operations at each of these intersections and potential improvements is discussed below:
› Western Avenue at Batten Way – The 2022 Build Conditions analysis assumes the existing signal is maintained with the discontinuation of Hague Street. Further review and discussion with BTD is necessary to determine potential modifications to pedestrian crossing locations, stop bar locations, and signal equipment. In addition, vehicle and pedestrian traffic volumes should be monitored to determine if the intersection continues to meet signal warrants in the future.
› Western Avenue at Cattle Drive – The 2022 Build Conditions analysis assumes this intersection is signalized. The signal phasing includes a leading pedestrian interval (LPI) with concurrent pedestrian phasing and two exclusive bicycle phases. Signal phasing and the interaction between all modes at the intersection should be furthered evaluated in consultation with BTD.
› Western Avenue at Kresge Way/East Drive - The 2022 Build Conditions analysis assumes this intersection is unsignalized and the northbound approach at this intersection is projected to operate at LOS F during both the weekday morning and evening peak hours. As shown in Table 22, providing a two-lane northbound approach (shared left-turn/through lane and right-turn lane) would improve operations for right-turning vehicles. In addition to providing a two-lane northbound approach, it is recommended that traffic volumes be monitored under future Conditions to determine if the intersection meets signal warrants. It is anticipated that as part of the Western Avenue streetscape extension discussed above, installation of accommodations for a future traffic signal would be considered at this location.
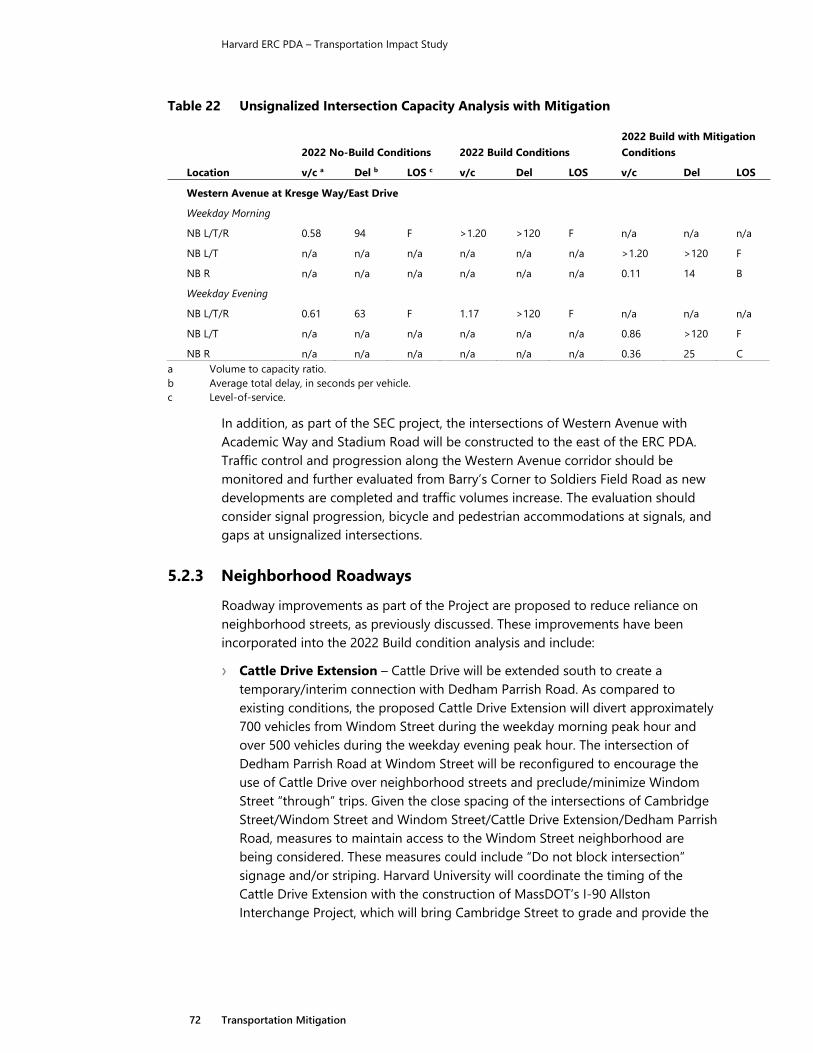
Harvard ERC PDA – Transportation Impact Study
72 Transportation Mitigation
Table 22 Unsignalized Intersection Capacity Analysis with Mitigation
2022 No-Build Conditions 2022 Build Conditions 2022 Build with Mitigation Conditions
Location v/c a Del b LOS c v/c Del LOS v/c Del LOS Western Avenue at Kresge Way/East Drive Weekday Morning NB L/T/R 0.58 94 F >1.20 >120 F n/a n/a n/a NB L/T n/a n/a n/a n/a n/a n/a >1.20 >120 F NB R n/a n/a n/a n/a n/a n/a 0.11 14 B Weekday Evening NB L/T/R 0.61 63 F 1.17 >120 F n/a n/a n/a NB L/T n/a n/a n/a n/a n/a n/a 0.86 >120 F NB R n/a n/a n/a n/a n/a n/a 0.36 25 C
a Volume to capacity ratio. b Average total delay, in seconds per vehicle. c Level-of-service.
In addition, as part of the SEC project, the intersections of Western Avenue with Academic Way and Stadium Road will be constructed to the east of the ERC PDA. Traffic control and progression along the Western Avenue corridor should be monitored and further evaluated from Barry’s Corner to Soldiers Field Road as new developments are completed and traffic volumes increase. The evaluation should consider signal progression, bicycle and pedestrian accommodations at signals, and gaps at unsignalized intersections.
5.2.3 Neighborhood Roadways Roadway improvements as part of the Project are proposed to reduce reliance on neighborhood streets, as previously discussed. These improvements have been incorporated into the 2022 Build condition analysis and include:
› Cattle Drive Extension – Cattle Drive will be extended south to create a temporary/interim connection with Dedham Parrish Road. As compared to existing conditions, the proposed Cattle Drive Extension will divert approximately 700 vehicles from Windom Street during the weekday morning peak hour and over 500 vehicles during the weekday evening peak hour. The intersection of Dedham Parrish Road at Windom Street will be reconfigured to encourage the use of Cattle Drive over neighborhood streets and preclude/minimize Windom Street “through” trips. Given the close spacing of the intersections of Cambridge Street/Windom Street and Windom Street/Cattle Drive Extension/Dedham Parrish Road, measures to maintain access to the Windom Street neighborhood are being considered. These measures could include “Do not block intersection” signage and/or striping. Harvard University will coordinate the timing of the Cattle Drive Extension with the construction of MassDOT’s I-90 Allston Interchange Project, which will bring Cambridge Street to grade and provide the

Harvard ERC PDA – Transportation Impact Study
73 Transportation Mitigation
opportunity to connect Cattle Drive directly to Cambridge Street instead of Windom Street.
› Rotterdam Street Discontinuation – Rotterdam Street will be discontinued between the future Stadium Road and the 114 Western Avenue parking lot entrance. The discontinuation will discourage traffic designated for the ERC PDA and SEC parking area from using Windom Street. Pedestrian and bicycle access with this improvement in place will continue to be refined.
5.3 Transit Based on the results of the transit operations analysis, the increase in Project-generated transit trips is expected to impact the MBTA Bus Routes 66, 86, and 70/70A. The following measures are proposed to mitigate these impacts:
› Harvard University Shuttles – Harvard University provides shuttle service between the Allston and Cambridge campuses via the Allston Campus Express and Barry’s Corner shuttles. To mitigate the impacts to the MBTA Bus Routes 66 and 86, access to these shuttles for ERC PDA development tenants and residents is proposed. Harvard University will work with the MBTA and BTD to review and potentially consolidate stop locations to best serve both its Allston Campus and the ERC PDA.
› Route 70/70A Service Enhancements – Harvard University will coordinate with the MBTA and BTD to add new bus stops along Western Avenue at its intersection with Cattle Drive. These new stops would be approximately 700 to 800 feet from the nearest bus stops. The westbound stop could also be used by the Allston Campus Express. As previously discussed, the recently completed Arsenal Street Corridor Study9 outlined a series of potential service enhancements for the Route 70/70A that could increase capacity and improve operations. Harvard University will coordinate with the MBTA to improve service on this corridor.
In addition, two new bus stops will be added in the vicinity of the Cattle Drive and Western Avenue intersection.
9 Arsenal Street Corridor Study, VHB, June 2017.