master thesis_keränen_ville-veikko
TRANSCRIPT
STUDY FOR IMPROVEMENTS IN BTS RECEARCH AND
DEVELOPMENT PROCESSES
Master’s Thesis
10 May 2012
Degree Programme in Information
Technology
Oulu University of Applied Sciences

3
OULU UNIVERSITY OF APPLIED SCIENCES ABSTRACT
Degree programme Thesis Pages + Appendix
Information Technology M.Eng. 57 1
+
Line Date
10 May 2012
Commissioned by Author
Nokia Siemens Networks (NSN) Ville-Veikko Keränen
Thesis title
Study for Improvements in Bts Research and Development Processes
Keywords
Fault, BTS, SW, HW, Testability, Process, Feature
Nokia Siemens Networks is a company producing Telecommunications hardware,
software and services. The 2nd, 3rd and 4th generation mobile base station hardware and
software development is a fast paced process, and the customer requests and
environmental changes have to be implemented and verified in a matter of months, even
weeks. According to the current way of working the development is separated into
iterations in which a part of desired features are implemented.
Both hardware and software development also have unintentional faults and bugs
implemented into the system. These problems and their corrections are followed closely
throughout the organization. The desired state is that the faults are identified and
corrected as fast as possible. At the moment there are unacceptable delays in these faults
correction times.
In a tight competition situation it possibilities have to be searched to bring research and
development costs down. The market leadership in a product also requires new
innovations on the fault correction side of the mobile base station developing
organization.

4
In this thesis, methods for speeding up the fault correction process are studied. In
addition the ways to improve current processes to avoid future faults are studied. After
all, there is never too much effort put in the faster delivery of a fully functioning system
into the market.

5
OULUN SEUDUN AMMATTIKORKEAKOULU TIIVISTELMÄ
Koulutusohjelma Opinnäytetyö Sivuja + Liitteitä
Information Technology M.Eng. 57 1
+
Suuntautumisvaihtoehto Aika
10.5.2012
Työn tilaaja Työn tekijä
Nokia Siemens Networks (NSN) Ville-Veikko Keränen
Työn nimi
Tutkimus Parannuksista Tukiasematuotekehityksen Prosesseissa
Asiasanat
Virhe, ongelma, tukiasema, SW, HW, testattavuus
Nokia Siemens Networks Oy on telekommunikaatioalan laitteita, ohjelmistoja ja
palveluita tuottava yritys. 2., 3. ja 4. sukupolven mobiilitukiasemien laitteiden ja
ohjelmistojen tuotekehitys on nopeatempoinen prosessi ja asiakkaiden tarpeet sekä
ympäristömuutokset tulee implementoida ja verifioida muutamien kuukausien, jopa
viikkojen aikana. Tämänhetkisen toimintatavan mukaan SW ja HW kehitys on jaettu
iteraatioihin, joiden aikana osa valmiin tuotteen ominaisuuksista implementoidaan.
Sekä laitteiden että ohjelmistojen kehityksessä järjestelmään tehdään myös tahattomia
virheitä. Näitä virheitä ja niiden korjausta seurataan tarkasti jokaisella
organisaatiotasolla. Tahtotila on, että virheet ja ongelmat tunnistetaan ja korjataan niin
nopeasti kuin mahdollista. Tällä hetkellä korjausajoissa on viiveitä, joita on mahdoton
hyväksyä.
Tiukassa kilpailutilanteessa täytyy etsiä uusia mahdollisuuksia yhtiön juoksevien
kulujen minimoimiseksi. Markkinajohtajuus tuotteella vaatii yritykseltä innovaatioita
myös vikojen korjaamistyössä.
Tässä työssä tutkitaan tapoja nopeuttaa vikojen korjausaikoja. Lisäksi nykyisiin
prosesseihin etsitään parannuksia vikojen välttämiseksi tulevaisuudessa. Tuotteen

6
nopeamman markkinoille toimittamisen saavuttamiseksi ei kuitenkaan ikinä voi tehdä
liikaa_työtä.

7
ACKNOWLEDGEMENTS
This Master’s Thesis is done for Nokia Siemens Networks, System Specification
department. The Master’s Thesis is targeted to help the specification organization better
align its resources and time to find the tasks to focus on. It is done by finding the best
ways to take down the effort and time put in fault correction.
I would like to thank Mr. Henri Niemelä, Mr. Orvo Mikkola and Mr. Vesa Hekkala for
the original idea of this thesis. In addition I would like to thank all my colleagues for the
support and advice I received during the study and writing process.
I also thank my supervisor Mr. Veijo Väisänen at Oulu University of Applied Sciences
for guidance and support.
The greatest gratitude goes to to my wife Riika who has believed in me and kept
pushing me forward during the studies and thesis work process.
Oulu, 10 May 2012
Ville-Veikko Keränen

8
CONTENTS
1 INTRODUCTION ................................................................................................... 11
1.1 Scope of thesis ............................................................................................. 12
2 EXISTING METHODS AND TOOLS .................................................................... 14
2.1. OBSAI ........................................................................................................ 14
2.2 Process models of NSN ................................................................................ 15
2.2.1 V-Model .......................................................................................... 16
2.2.2 AGILE ............................................................................................. 18
2.2.3 Differences between AGILE and V-Model ....................................... 22
2.3 BTS Management ........................................................................................ 23
2.3.1 BTS Fault Management ................................................................... 24
2.4 Fault handling .............................................................................................. 25
2.4.1 Fault handling tool ........................................................................... 26
2.4.2 Benefits from using fault handling tool ............................................ 27
2.4.3 Fault correction process and fault states ........................................... 28
2.4.4 Correction states .............................................................................. 30
2.5 CN process .................................................................................................. 32
2.6 Testability Improvements list ....................................................................... 34
3 PROBLEMS IN PROCESSES ................................................................................. 36
3.1 Faults processing time .................................................................................. 36
3.1.1 Insufficient fault analyzing ............................................................... 37
3.1.2 Wrong responsible group ................................................................. 37
3.1.3 Unclear solution ............................................................................... 37
3.1.4 Big changes ..................................................................................... 38
3.2 Testability improvements processing time .................................................... 38
3.3 Cost of time ................................................................................................. 39
3.3.1 Fault costs ........................................................................................ 39
4 STUDY FOR IMPROVEMENTS ............................................................................ 42
4.1 Improving faults processing time ................................................................. 42
4.2 Speeding up testability improvements processing time ................................. 43
4.3 Reducing costs ............................................................................................. 43
5 SOLUTION PRESENTATION ............................................................................... 46

9
5.1. Improved faults processing ......................................................................... 46
5.1.1 Promoting agility in faults processing .............................................. 46
5.1.2 Fault correction responsibility change .............................................. 47
5.2 Enhanced testability improvements processing ............................................. 48
5.2.1 Appointing the responsible person ................................................... 48
5.2.2 Evaluating effort and priority ........................................................... 48
5.2.3 Evaluating impact ............................................................................ 50
5. 3 Cost reductions ........................................................................................... 52
6 CONCLUSION AND DISCUSSION ....................................................................... 54
REFERENCES ........................................................................................................... 56
APPENDIX ................................................................................................................ 58
10
DEFINITIONS AND ABBREVIATIONS
2G 2nd generation mobile communications 3G 3rd generation mobile communications
4G 4th generation mobile communications
APO Area Product Owner
BBM Baseband Module
BTS Base Transceiver Station
CCM Control and Clock Module
CN Change Note
HW Hardware
I&V Integration and verification
ME Mobile Equipment
ODW One Days Work
NSN Nokia Siemens Networks
OBSAI Open Base Station Architecture Initiative
PO Product Owner
R&D Research and Development
RFM RF Module
RP1 Reference Point 1
RP2 Reference Point 2
RP3 Reference Point 3
SPO Supporting Product Owner
SW Software
TM Technical Manager
TPM Transport Module
UE User Equipment
WCDMA Wideband Code Division Multiple Access

11
1 INTRODUCTION
The 3rd Generation Partnership Project (3GPP) is an organisational instance responsible
for defining the requirements for the equipment and service vendors in the mobile
industry. It is responsible for unifying the 2nd, 3rd and 4th generation mobile technologies
in a way that every mobile device supporting certain standards can function correctly in
a network supporting the same standards. Moving forward with the generations the
amount of data and mobile subscribers in the network has increased dramatically. This
puts the weight to the needed features and functionalities providing organisations
shoulders. Today it is not enough that the needed functionality is there. A company has
to be the first to come up with a feasible solution to gain the market advantage. If a
proposition for standard is accepted by the 3GPP a telecommunication hardware (HW)
and software (SW) producing company can gain a considerable asset since others then
have to come up with a similar solution to follow the standard. To get this advantage a
company must focus on both feature and process development. The Features have to be
on the market on time to gain a market share or even the leadership. To be able to be the
first, a company must develop world class processes to minimise the faults and
maximise the quality of their product.
Feature development is a process dedicated to providing the market with new products
and features or improvements to the existing ones. Maintaining the provided equipment
is also a part of the feature development. In the mobile industry, feature development
consists of mobile phones and network equipment to provide a data transporting
medium to the mobile subscriber. This is further divided into HW and SW for the
different network elements. The HW development focuses on providing the most cost
efficient and reliable components with the needed capabilities to support the standards
and planned SW features. Nowadays even economical questions such as low power
consumption and thermal abilities are one of the key factors from the HW development
point of view. Production processes mature and HW manufacturers aim to make their
products simpler and simpler while the network components have to cope with the ever
accelerating demand for capacity. This leads to a complex SW. The SW development
focuses on providing the HW with the rules of configuration, communication and the
usage of internal and external interfaces.

12
The process development aims to the efficiency of the feature development. Creating
powerful tools to produce and test the features, tracing faults and keeping these
processes up-to-date is very important to reduce the costs for the company. The
business impact of a poor quality in both HW and SW can be a question of life and
death for a company. Some amount of faults is inevitably created in the feature
development but a poor overall quality is a result of poor processes where those faults
are not found during the development. In worst case they are implemented as a part of a
customer solution and found in the field use. A fast and accurate correction of the faults
found is absolutely necessary.
1.1 Scope of thesis
In the BTS design, integration and verification problems and faults occur in both SW
and HW. A constant effort is put in the identification and the removal of those faults as
early as possible. After all the later in the process the problem is identified the more
expensive it is to fix it. This thesis identifies problems in different mobile base station
(BTS) researches and development (R&D) related processes. It aims to find solutions
for a more efficient fault correction and putting new ideas and features into action. A
method for analyzing the best possible order and the importance for the execution of
these tasks is introduced. The fault correction process of a BTS specification team and
methods for improving this process are studied. The aim is to tackle the effort put in the
fault correction and speed it up. The study is finished with effort estimations and
proposals for possible tool and/or process development. The thesis focuses on the BTS
specification side of R&D and the proposals are mainly focusing on improving this part
of the R&D at the Nokia Siemens Networks Oy (NSN) R&D. Nowadays even
globalisation and the multi-site structure of the company having dozens of different
nationalities have an effect on the easiness of communication but this point of view is
not to be taken into account in this thesis. It could serve a purpose as a further study
item.
The thesis is divided into chapters that split it into logical entities. Chapter 1 gives an
overall description of the scope and the reason for this thesis. Chapter 2 describes the

13
used BTS design principles, processes, tools and methods for the fault identification at
NSN. Chapter 3 concentrates on identifying the problems in the processes and tools
used for the fault correction. Chapter 4 describes the study process and methods to find
additional development that could be made to improve the described tools and processes
further. Chapter 5 sums up the effort estimations and additional improvements and
analyses their impact. Chapter 6 concludes the study and the learning process during the
making of the study.

14
2 EXISTING METHODS AND TOOLS
There are principles used in both the process and feature development and verification
at NSN. The following sections outline these tools and processes used for feature
development at NSN.
2.1. OBSAI
At NSN, the BTS product family design and the verification of the interfaces and
modules is based on the OBSAI architecture. OBSAI aims to create an open market for
cellular base stations. An open market substantially reduces the development effort and
costs that have been traditionally associated with creating new base station product
ranges. Since OBSAI was first established in September 2002, its member companies
have worked together to produce a complete set of interface, hardware and test
specifications. These enable the production of base station modules to fit any base
station utilizing the OBSAI interface specifications. (1.)
In the OBSAI compatible model the Base Station is divided into four modules, the RF
Module (RFM), the Baseband Module (BBM), the Transport Module (TPM) and the
Control and Clock Module (CCM) which is illustrated in Figure 1. There are also three
internal interfaces described by OBSAI. (2, p.10)

15
BaseBandModule
TransportModule
RF Module
Control andClock
Module
RP3 RP2
RP1
Uu Iub
FIGURE 1. Reference architecture of a WCDMA base station (2, p.10)
Internal interfaces defined by OBSAI are Reference Point 1 (RP1), Reference Point 2
(RP2) and Reference Point 3 (RP3). An RP1 interface is placed between CCM and other
three modules. RP1 defines the interface for the exchange of CCM signals. Also, the
Control and Management Plane message transfer between the CCM and the BBM is
handled via RP1. Management Plane messages are transferred also to RFM and TPM.
An RP2 interface is located between BBM and TPM. RP2 is used for interchanging
User Plane data. An RP3 interface can be found between BBM and RFM. RP3
interchanges formatted air interface user data and fast control data. (2, p.11)
2.2 Process models of NSN
The following chapters describe the process models that are used in the BTS
specification and implementation at NSN.
16
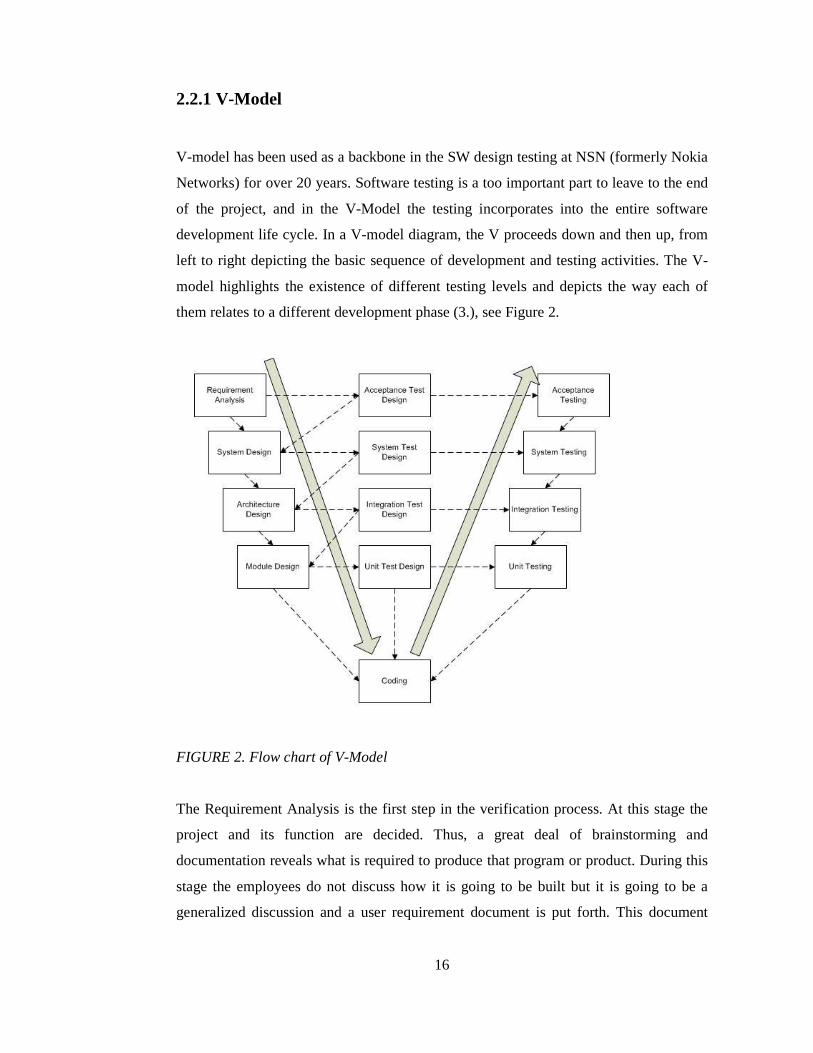
2.2.1 V-Model
V-model has been used as a backbone in the SW design testing at NSN (formerly Nokia
Networks) for over 20 years. Software testing is a too important part to leave to the end
of the project, and in the V-Model the testing incorporates into the entire software
development life cycle. In a V-model diagram, the V proceeds down and then up, from
left to right depicting the basic sequence of development and testing activities. The V-
model highlights the existence of different testing levels and depicts the way each of
them relates to a different development phase (3.), see Figure 2.
FIGURE 2. Flow chart of V-Model
The Requirement Analysis is the first step in the verification process. At this stage the
project and its function are decided. Thus, a great deal of brainstorming and
documentation reveals what is required to produce that program or product. During this
stage the employees do not discuss how it is going to be built but it is going to be a
generalized discussion and a user requirement document is put forth. This document

17
carries information regarding the function of the system, performance, security, data,
interface etc. (3.)
The next phase is the System Design. As the name of the phase suggests, here the
possible design of the product is formulated. It is formulated after keeping in mind the
requirement notes. While following the documents, if there is something that does not
fit in the design, the user is made aware of it and changes are accordingly planned. The
diagrams and the data dictionary are also produced at this stage. (3.)
The Architecture Design, also known as the computer architecture design or the
software design, should realize the modules and the functionality of the modules which
have to be incorporated. In the Unit Design, the architectural design is again broken up
into sub units so that they can be studied and explained separately. The units are called
modules. The modules can separately be decoded by the programmer. (3.)
The testing levels of the V-model are: Unit Testing with a definition of a unit being
<1000 rows of code, Integration Testing where these units are gathered into entities and
their interfaces verified, System Testing in which the components of the whole system
are brought together and their internal and external functionalities are verified. A
separated Acceptance Testing is executed after the System Testing. The module tests
are performed on the units during the Coding phase. The programmer of a unit owns the
unit and is responsible for testing it or getting it tested against the module design and
architecture design specifications and finding all the faults contained in it.
The biggest advantage of using the V-Model is that every stage is tested. As the
Analysis and Design phases reflect the Test Design phases, the testing phases get the
needed info for test preparation in an early enough stage. The disadvantage of the V-
model is that it assumes that the requirements do not change. The design is not
authenticated. The Requirements are not verified. At each stage there is a potential of
errors. The first testing is done after the design of modules which is very late and costs
very much. (3.)

18
In the current mobile network market the problem with using the V-model is that the
requirements tend to change by a substantial amount during the process. A tight
competition makes the mobile network equipment providing companies compete for
customers. Their needs are listened to and tried to be made real even if the request does
not necessarily cope with the original plans. There have been attempts to diminish the
disadvantages of the V-model at NSN by arranging inspections all the way down from
the Requirement Analysis to the Coding and different Test Design phases. The target is
to make the design versatile for changes in the future and also during the process. The
basic idea is also to tackle problems as early as possible and not let flaws in the design
scatter into later phases and multiply. An efficient inspection requires participants for
starters to attend and take part into the inspection. Participation and a deep level of
competence and understanding of the inspector’s own responsibility area is required. An
unattended inspection or an inspection with participants with no real knowledge of how
the product to be designed should work will lead to problems.
Problems in SW and HW occur in the upward flow phase of the V-model starting from
the Coding. This is the first phase, where the design requirements are put into action by
developing actual HW and SW products according to them. Inspecting the code helps
remove problems from it before it is put to test. In any case, the faults generated in the
coding and design are not always found in inspections. A solid, well designed testing
process for the upward V-model flow is needed.
2.2.2 AGILE
Agile development is a newly adopted iterative and incremental methodology at NSN
where requirements and solutions evolve through the collaboration between the self-
organizing, cross-functional Feature Teams (FT). (see Figure 3) Having AGILE
principles in use has been proven to be beneficial for most companies over rather an un-
flexible V-model.

19
FIGURE 3. Agile SW development (4)
There are twelve principles in the Agile Manifesto (5) including:
1. Customer satisfaction by a rapid delivery of a useful software
o The highest priority is to satisfy the customer through an early and a
continuous delivery of a valuable software.
2. Welcome changing requirements, even late in the development
o The harness of the Agile process change for the customer’ competitive
advantage.
3. Working software is delivered frequently
o From a couple of weeks to a couple of months, with a preference to the
shorter timescale.
4. Working software is the principal measure of progress
5. Sustainable development, able to maintain a constant pace
o The sponsors, developers, and users should be able to maintain a
constant pace indefinitely.
6. Close, daily co-operation between business people and developers
o Work together daily throughout the project.
7. Face-to-face conversation is the best form of communication (co-location)

20
o The most efficient and effective method of conveying information to and
within a development team
8. Projects are built around motivated individuals, who should be trusted
o Give them the environment and support they need, and trust them to get
the job done.
9. Continuous attention to technical excellence and good design
o Attention to technical excellence and good design enhances the agility.
10. Simplicity
o The art of maximizing the amount of work not done–is essential.
11. Self-organizing teams
o The best architectures, requirements, and designs emerge from self-
organizing teams.
12. Regular adaptation to changing circumstances
o At regular intervals, the team reflects on how to become more effective,
then tunes and adjusts its behavior accordingly.
The problems that underlie in aiming to be agile at NSN are not easily solvable in a
multi-national, multi-continental business with tens of thousands of employees working
for dozens of different SW and HW projects.
From the BTS Specification’s point of view principle 1 is faced with a complex SW that
needs much work from different teams to implement the new requests. To avoid this,
the specification is needed to be split into small enough entities so that the
implementing can be done in a very short time period of a few weeks.
Having relatively heavy and unaligned CN process at use with the design,
implementation and testing makes principle 2 affect the whole process. Principle 3 faces
the same obstacles as principle 1. Having the possibility for a frequent SW delivery
needs an excellent quality and flexibility also from the specification.
Principle 4 is met with different tools that follow the progress even from other aspects
than from the maturity of the SW. The tasks not directly related to the coding or
verification of the SW such as documentation are heavily present in the case company.

21
Principle 5 faces the problem in the specification with individuals having a massive
amount of work at times and much less work at other times. This comes down to an
accurate analysis of tasks and knowing the working hours to be done for each task to be
in the ‘done’ state. Understanding the requirements is more important than before and
questions have to be asked to avoid misunderstandings.
Principle 6 is probably the most difficult to perform due to the scattered teams and
organizations. Business is often somewhere else than the development.
Principle 7 falls into the same category as the previous. It is simply not possible to have
face-to-face conversations with people, who are in one team but located in another
continent at the worst case. Of course this is not mandatory but surely beneficial.
For principle 8 the main problem is not the lack of motivation but the lack of
individuals with both motivation and technical expertise at such a high level that a
project can be trusted in their hands. A small project in a different type of organization
does not have this problem but the sheer technical complexity of the BTS SW nowadays
requires more than a few persons to build a project on. In addition, the problem of those
persons having the needed time to plan and execute projects comes to play.
Principle 9 also has its drawback in the individuals able to follow the quality having a
massive amount of work in their hands and not being able to contribute to all of the
needed design phases. Principle 10 is faced with a constantly growing amount of mobile
subscribers and results the complex SW design to handle this demand.
Principle 11 is taken into use in the specification but there is still much individual work
load, and the SW component specialists are still located in the component teams instead
of the FTs. Principle 12 faces problems if no FTs are being deployed. The component
teams still in place can have internal adjustment on affectivity but this does not
necessarily reflect on the feature development at the organizational level.
The Manifesto for Agile Software Development is as follows: (6.)

22
• Individuals and interactions over processes and tools
• Working software over comprehensive documentation
• Customer collaboration over contract negotiation
• Responding to change over following a plan
While the AGILE methods and being agile in a SW development organization is
beneficial, it is easier to adopt them in a program with local resources instead of a
globally scattered work force or originally smaller groups instead of organizations with
hundreds of individuals. The principles are not easy to adopt when the teams cannot
apply them locally but have to exchange e-mails and use conference calls for the
communication. Nevertheless, these obstacles should not be seen as something that
cannot be improved or even crossed. Finding the best possible process solutions for this
company, its products and work force should be of a common interest.
2.2.3 Differences between AGILE and V-Model
The agile methods are sometimes characterized as being at the opposite end of the
spectrum from the plan-driven or disciplined methods. The agile teams may, however,
employ highly disciplined formal methods. A more accurate distinction is that the
methods exist on a continuum from adaptive to predictive. The agile methods lie on the
adaptive side of this continuum. The adaptive methods focus on adapting quickly to the
changing realities. When the needs of a project change, an adaptive team changes as
well. An adaptive team has a difficulty describing exactly what will happen in the future.
The further away a date is, the more vague an adaptive method is about what will
happen on that date. An adaptive team cannot report exactly what tasks they will do
next week, but only which features they plan for the next month. When asked about a
release six months from now, an adaptive team might be able to report only the mission
statement for the release, or a statement of the expected value vs. cost. The predictive
methods, in contrast, focus on planning the future in detail. A predictive team can report
exactly what features and tasks are planned for the entire length of the development
process. The predictive teams have adifficulty in changing the direction. The plan is
typically optimized for the original destination, and changing the direction can require a

23
completed work to be started over. The predictive teams often institute a change control
board to ensure that only the most valuable changes are considered. (7.) V-Model
shaped organization is a good example of such predictive method.
At NSN the transition is ongoing and the process is clearest when looking at the V-
model shaped organization. It relies on the component teams where an AGILE
organization is based on the feature teams. There is a common drive towards agility, and
the FTs are being deployed to study, specify and implement the features that are on the
development pipeline. There is also a good effort in bringing the people from the
existing component teams and integrate them as parts of a FT. However, these
component teams still exist, and forming a new type of commitment an understanding
for the relevance of the FTs is not easy. The problem with having these component
teams still at place is that the FT type brainstorming session of a cross-functional team
is an invitation only issue instead of being a daily process.
According to Larman and Vodde (8, p.175) most drawbacks of the component teams
can be resolved with the feature teams. They enable teams to put the requirements
analysis, interaction design, planning, high-level design, programming, and system test
responsibilities within the team, since they now have a whole end-to-end customer-
feature focus. Planning, coordinating, and doing the work are greatly simplified. The
handoff and delay wastes are dramatically reduced, leading to a faster cycle time.
Learning increases and the organization can focus on truly high-priority market-valued
features. In addition, because multiple feature teams will work on shared components,
sometimes at the same time, it is essential that the code is clean, constantly refactored,
continually integrated, and surrounded by unit tests—as otherwise it is not possible to
work with.
2.3 BTS Management
The SW, HW and the faults of the BTS have to be managed. The SW management is
very critical from the troubleshooting’s point of view because the SW is downloaded
into several Plug-in units inside the BTS either locally or remotely. Additionally, in a

24
remote case, it can be performed for hundreds of BTSs simultaneously. From the same
viewpoint even the HW Management is very critical, because problems may appear in
the HW units when installing the BTS sites. Fault management is needed for detecting
and cancelling alarms and faults that appear in some point of the BTS installation or
runtime for both the BTS HW and SW. The BTS management is handled with different
Element management tools (EMT). The EMT is usually a desktop client on the
operator's site (NMS/OSS), but the Network EMT software can also be run locally on a
PC as part of the field engineering workstation. (9, p.19)
The improvements for the BTS management aim to easier and more efficient
configurability and fault situation analysis for both the end-user and the R&D
organization. The SW and HW management are not gone through in detail.
2.3.1 BTS Fault Management
Fault Management (FM) is probably the most important area for the BTS
Troubleshooting. The fault management system of the BTS is designed to co-operate
seamlessly with the fault management system of the RNC and the network management.
The fault management system of the BTS collects the fault indications from the
applications. It keeps the alarm situation up to date in the BTS, reports the alarms to the
network management system and to the BTS Manager and informs changes in the HW
resources to the Telecom. (10.)
The BTS SW uses acknowledgement messages. The sender sets a timer called a timeout
immediately after providing the acknowledgement message. If no acknowledgement is
returned to the sender within the timeout period, the sender deduces an error on the
monitored component. This solution can detect errors that lead to an omission or crash
failures of the co-operating subsystem, but by no means does it guarantee the
correctness of the input reception by the co-operating subsystem or the correct process
of the input by the latter. When faults occur, the system can still function with a reduced
capacity. (11, p.12)

25
Software development models change and enhance to ensure the ability of the software
development to be able to compensate the increasing complexity, as well as
architectural and hardware changes. The lifespan of the base station’s
telecommunication software is long, 10 to 20 years or even longer. The fault
management process changes during the product’s lifespan, but the primary function, to
fix bugs and tests the corrections, stays the same. The fault management process has to
evolve and support the software development of long lifespan products better. (12, p.3)
According to one of the interviewed persons it is needed to have the ability to identify
quicker and better where the problem has occurred. The faults pointed to one of the SCs
end up being someone else’s fault. In many cases there were plenty of time and effort
needed to find out the responsible party. An ideal fault management system should be
capable of finding a root-cause of the fault, thusly greatly diminishing the time used for
processing the fault.
The FM cannot, however, necessarily point the origin of the fault. If the fault is
originated into the specification of the SW and its correct functioning against
requirements is clarified, FM does not have the ability show it. If inconsistency is found
in the specification, it has to be corrected first. After the changed requirements have
been approved, the SW is officially changed and the fault verified corrected.
2.4 Fault handling
A Mobile networks producing company such as any business revolving around the SW
or HW must concentrate on the fault handling. The problems must be found and fixed in
order to provide the customers with good quality products. It is also imperative to be
able to handle possible reclamations regarding the products in an acceptable period of
time to keep the customer satisfaction at a good level.
SW and HW can be also released with faults still not handled or corrected if the faults
are considered not to be critical for the customer. While software products may, by
definition, contain any number of unknown bugs, the measurements during the testing

26
can provide an estimate of the number of likely bugs remaining; this becomes more
reliable the longer a product is tested and developed ("if we had 200 bugs last week, we
should have 100 this week"). Most big software projects maintain two lists of "known
bugs"— those known to the software team, and those to be told to users. This is not
dissimulation, but users are not concerned with the internal workings of the product.
The second list informs the users about the bugs that are not fixed in the current release,
or not fixed at all, and a workaround may be offered. (13.)
There are various reasons for not fixing bugs:
- The developers often do not have time or it is not economical to fix all non-
severe bugs.
- The bug could be fixed in a new version or patch that is not yet released.
- The changes to the code required to fix the bug could be large, expensive, or
delay the finishing of the project.
- Even seemingly simple fixes bring the chance of introducing new unknown bugs
into the system. At the end of a test/fix cycle some managers may only allow the
most critical bugs to be fixed.
- Users may be relying on the undocumented, buggy behavior, especially if the
scripts or macros rely on a behavior; it may introduce a breaking change.
- It is "not a bug". A misunderstanding has arisen between the expected and
provided behavior (13.)
2.4.1 Fault handling tool
The NSN Fault handling tool (FHT) is a web-based tool for managing faults that are
found in the NSN products. It provides the users with a controlled way to manage the
correction of the faults and keeps the status of corrections and the information flow
continuously visible.
The FHT is, e.g., used for reporting and managing faults found in the product
development and managing faults found in the use by the customer. The customer faults
are created into an external tool and transferred afterwards to the FHT for security
purposes. The FHT is also used for communicating the progress of corrections to the

27
customer and managing the data created in the fault correction phase, e.g. modified
component names and versions. The FHT is also used for managing the testing phase
and the results of it (e.g. test case names and status) and gathering metrics data and
monitoring fault states.
Fault reports can be created by everyone who notices a fault in the BTS HW, SW or
related specification. The faults found by end customers are reported to Pronto by the
customer service, or by the NSN personnel or collaborators (e.g. testers). The NSN
personnel or collaborators then investigate and correct the reported faults. The fault is
analyzed by the creator into the point, it can be assigned to a group or individual
responsible for correcting the fault. Pronto is used in all phases of this process to keep
track of the processing of the fault. Pronto also provides tools for a smooth
communication between the customer, coordinator, engineer and tester. Nowadays the
FHT reports and fault fixing times are also used as measuring tools for the organization,
team and individual performance. This means that pinpointing the original problem is
essential to avoid giving a false impression on the performance. At the moment, the
fault reports do not necessarily indicate what the original reason was. The group or
individual who ends up closing the fault report can just be one of many that had to make
changes because the original fault ended up having an effect on the whole R&D chain.
The “point ability” of a fault correction responsibility would probably be helped if not a
component but a feature could be used more effectively as a reference.
2.4.2 Benefits from using fault handling tool
There are non-arguable benefits from using the FHT at NSN. By using a unified FHT,
the NSN R&D gets support for the common fault management process across the Nokia
Siemens Networks product families. Every fault in any of the HW types and versions
with every available SW release can be traced. Statistics can be gathered from the tool
and a general view on the progress of fault amounts, correction times and responsible
groups is available. A common interface between the FHT and the customer’s fault
reporting tool is also embedded in the system. The developers have a visibility on both
internal and customer faults while customers have visibility on the faults they’ve

28
created and the faults that are critical from their point-of-view. Same tool can be used
by both internal and external users. It has an easy-to-use, web-based interface. The FHT
has a possibility to use an integrated Change Note tool. There are three different fault
classes: A, B and C, A being the most critical. The correction time of the A and B class
faults should not extend to more than a couple of days. This means that all the different
fault and correction states have to be handled very quickly.
2.4.3 Fault correction process and fault states
When a manual or an automated test finds a fault, a new problem report is created.
These reports go through the following states after which the fault is solved:
The Fault Reports in the NEW state have not been given to a responsible person. To
proceed with the investigation of the Fault Report, the Development Fault Coordinator
or an engineer examines the new Fault Report and assigns it to the responsible
person/group or, creates a new Correction document(s) and fills in the Responsible
Person field. Alternatively, the Care Contact may assign the Fault Report to the
responsible group.
The Fault Reports in the INVESTIGATING state have been assigned. To proceed with
the internal Fault Reports, the responsible person completes a correction, making it
ready for testing.
The Customer Fault Reports in CORRECTION PLAN READY state mean that the
responsible person writes the Correction Plan and marks it ready. To proceed, a
notification is sent to the Care Contact who checks (and modifies) the response, adds
the target delivery and date and then sends it to the customer. The Internal Fault Reports
do not have this state.
Fault report in CORRECTION PLAN SENT state is set for the Customer Fault Reports
when the customer has been notified of the Correction Plan, but the correction is not yet
available. To reach the next state, the responsible person completes a correction, making
it ready for testing. The Internal Fault Reports do not have this state.

29
The Fault report in the FIRST CORRECTION READY FOR TESTING state is set for
reports where there is at least one correction ready for testing or under testing, but with
no corrections tested. To reach the next state, the test engineer finishes the testing and
accepts the correction, reporting it tested.
The Fault report in the FIRST CORRECTION COMPLETE state is set for Fault
Reports where there is at least one correction tested but, for customer fault reports, the
customer has not been notified of an available correction or testing of the correction is
not needed. To proceed with the Customer Fault Reports, the responsible person writes
the Correction Response and marks it ready. The Care Contact receives a notification
mail, checks (and modifies) the response, adds the target delivery and date and sends it
to the customer by pressing the Send button. For the internal Fault Reports, the
remaining corrections are tested or marked as Needless or Testing Not Needed. The
Needless corrections do not affect the Fault Report state.
The Fault report in the FINAL RESPONSE SENT state is set for Correction Response
that has been sent to the customer by the Care Contact and at least one correction has
not reached the Tested state. To proceed and reach the Closed state, the responsible
people and test engineers report the remaining corrections to Tested, Testing Not
Needed or Needless. This applies to the Fault Reports with several corrections. The
Internal Fault Reports do not have this state.
The Fault report in CLOSED state means that all corrections are finished and for
Customer Fault Reports, Correction Response has been sent. The Fault report in the
POSTPONED state is set for Fault reports, which will be fixed on a later date in the
future. The Fault Report is automatically activated back to the state where it was at the
time of the postponing, when the reactivation date was reached. The Postponed Fault
Reports can also be activated manually.
The Fault reports in CORRECTION NOT NEEDED state point to the Fault Reports
which are declined because they were not faults at all, or because all the needed
information was not received from the author, or for similar reasons. The Fault Report
can be reopened, returning it to the state New.
30
The Fault reports in REOPENED status note the Customer faults with the correction (or
the lack thereof) rejected by the customer. The rejection can be done to the Customer
Fault Reports in state the Correction Not Needed, Final Response Sent or Closed. After
the rejection, the Fault Report state is set to a state New or First Correction Complete.
E.g. Fault Report in the state Closed is after the rejection in the state First Correction
Complete. The Fault Report is moved back to the Closed state when the renewed
Correction Response is updated and sent to the customer.
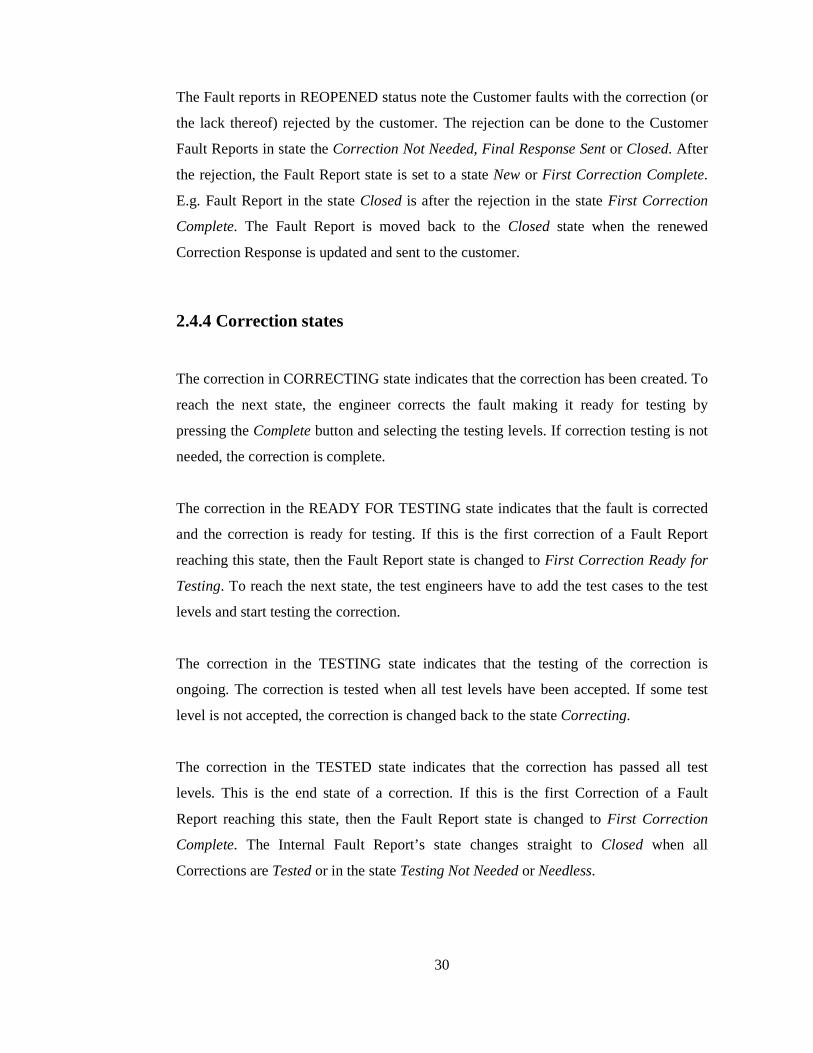
2.4.4 Correction states
The correction in CORRECTING state indicates that the correction has been created. To
reach the next state, the engineer corrects the fault making it ready for testing by
pressing the Complete button and selecting the testing levels. If correction testing is not
needed, the correction is complete.
The correction in the READY FOR TESTING state indicates that the fault is corrected
and the correction is ready for testing. If this is the first correction of a Fault Report
reaching this state, then the Fault Report state is changed to First Correction Ready for
Testing. To reach the next state, the test engineers have to add the test cases to the test
levels and start testing the correction.
The correction in the TESTING state indicates that the testing of the correction is
ongoing. The correction is tested when all test levels have been accepted. If some test
level is not accepted, the correction is changed back to the state Correcting.
The correction in the TESTED state indicates that the correction has passed all test
levels. This is the end state of a correction. If this is the first Correction of a Fault
Report reaching this state, then the Fault Report state is changed to First Correction
Complete. The Internal Fault Report’s state changes straight to Closed when all
Corrections are Tested or in the state Testing Not Needed or Needless.

31
Correction in the TESTING NOT NEEDED state indicates that the correction is ready
and no testing is needed at all. This is an end state of a correction.
Correction in the NEEDLESS state indicates that implementation for the correction is
not needed. This is an end state of a correction but the Needless Corrections do not
affect the state of the Fault Report.
FIGURE 4. Flow chart of Fault Correction process

32
2.5 CN process
The Change Notes (CN) are proposals to modify the existing process, documentation,
HW or SW. A CN is a useful way for making moderate or big changes while the project
has already started. As said, the BTS design is a considerable process and incorporating
a CN is not as easily done as an ideal AGILE method suggests. Implementing a change
in a small piece of the SW instead of a unit having components for which the SW has
been written by dozens of teams all around the world is a whole different situation. One
big problem in the CN process at the moment is also that it is not consistent between
different development organizations. The organization aiming towards AGILE
processes has to have simple, aligned and consistent processes to implement the
changes fast. In the OBSAI style R&D where everything is connected a CN can have an
impact on most of the modules and interfaces. The general process guidelines exist
(Figure 5) but different parts of the organization have made the process more suitable
for themselves.
The CN can be originated by anyone in the organization. The CN template contains
fields that give general information in the area such as Nature of the change and Origin
of the change.
Some examples of most typical sources of the CNs are as follows:
- A Fault report can in specific conditions result in the creation of the CN.
- Customer needs a certain change in the product
- A Change requested internally as an improvement, or a preventive action (e.g.
faulty functionality discovered that has to be corrected before the problem
occurs in the customer network).
- The specification alignment for the features shifted to later releases.

33
FIGURE 5. Flow chart of Change Note Process (14)
As there are projects at NSN aiming at the improvement and speeding up the CN
process, it is not taken for further processing in this thesis. It is used only as a
clarification of different methods for affecting the product during design and
development.

34
2.6 Testability Improvements list
A Microsoft Excel based list of the improvement proposals for testability is maintained
at NSN by the Testability Feature Analysis Team (FAT). The proposals are gathered bi-
weekly in a separate meeting. There are seven different sheets in the Excel for these
proposals:
- Log sheet, which is used for the updates information and modifications of the
list.
- Open sheet, which lists the new proposals taken into the list. They are being
analyzed in the meetings and based on a discussion and a preliminary analysis
passed on into the next sheets.
- ‘To CN or feature’ sheet, which means that the proposal has been handled, and a
Change Note (CN) or a feature proposal has been created out of it.
- ‘No CN or Feature’ sheet which means that the improvement proposal is
handled in some other way than the CN or the feature.
- Future study items sheet which lists the proposals for those “Nice to have” items
with no clear idea of benefit.
- Closed sheet, which lists the items that have been handled in meetings and the
CN or a feature, is on the way.
- To Other FAT Sheet which could be used to list the proposed items that are
clearly beneficial from some other than the Testability’s point of view.
The columns from the Testability Improvements list are used to describe the
improvement proposal and its attributes, see Figures 6 and 7. Studying this process was
seen beneficial from the point of view of this thesis.

35
FIGURE 6. Testability Improvements List, Part 1
FIGURE 7. Testability Improvements List, Part 2

36
3 PROBLEMS IN PROCESSES
Chapter 3 outlines the problems identified at the beginning of this thesis process. The
solutions for them are studied in Chapter 4.
3.1 Faults processing time
The time for analyzing a found fault is essential for both the fixing cost and customer
satisfaction. In the specification area, however, there are a few faults with the fixing
time of months and still no obvious reason can be pinpointed. Approximately a half of
the faults take more than the target amount of days. As it was previously stated, the
critical A and B type faults should be fixed in a couple of days’ time. (Chapter 2.5.3)
There are a few assumed problems in specification area. They are believed to go around
in a circle affecting each other over and over again.
Good specification quality is a result of an individual with a vast knowledge of the
specified area having the needed time to prepare specifications ready to be inspected.
The great quality is achieved as these specifications are then inspected by the key
contributors who also have a good knowledge of the specified area from the point of
view of some other component or instance. Problems occur, when there is too little time
for the individual to familiarize oneself with the specified area. This results in a lowered
initial specification. If all of the key contributors are not known or do not attend the
inspection, the initially lowered level of specification can be passed through and
becomes official. This results in faults being found in the design or later phases. In the
worst case these problems spread into the whole design and verification process thusly
resulting in very expensive corrections

37
3.1.1 Insufficient fault analyzing
When faults reports with too little information regarding the occasion are created, the
correction time tends to stretch. The lack of clarity in the cause of the problem, the lack
of the needed information or simply a poor language can slow the process down or even
stop it for a period of time. The integration testing mostly uses automated testing and
macros for executing the verification tests. If these macros fail, a fault report is usually
created without a further analysis.
3.1.2 Wrong responsible group
The inability to name a person or a group responsible for the fault at the very beginning
of the fault correction process is another problem. The creator/founder of the fault does
not necessarily know the responsible instance and still has to find someone to start
analyzing the fault. The responsibilities in the organization are also very fragmented due
to the global structure and partially because the occasional individual role changes.
There is a list of key contributors in different areas but it is impossible to keep the list
updated by one single person.
3.1.3 Unclear solution
Many times it is difficult to find an agreement on the solution of the fault. In a system
based on communication between components, a fix could in many cases be
implemented in either one of the components whose communication has caused the
failure. The decision is difficult to be made if the key contributors do not attend the
planning meetings or leave the e-mails unanswered. There are reasons for this such as
heavy workload with other problems and responsibilities. Another reason is that there is
not enough experienced personnel in some areas to contribute or give feedback.

38
3.1.4 Big changes
There are interdependencies that when changed also affect other areas thusly making
their specification incompatible. This results in a ripple effect and other areas need a
change, too. In addition, it is not always clear what the effects of the changes made in
one area of the specification on other areas specification are. There is no clear relation
between the requirements in the specification documentation tools used by NSN. The
interface specifications of the system components are stored in a separate server based
documentation tool such as the element feature specifications and the system
specifications are maintained in another tool. The aim is to have a unified UML model
made of the whole BTS depicting the whole functionality from start to finish. This task
is just starting and needs a great deal of effort from many different expertise areas.
3.2 Testability improvements processing time
There are numerous improvement proposals made in the Testability Improvement List.
Many of these proposals stay on the “Open” sheet, and no effort is put to process them
forward. Through interviewing it was clarified that while proposing persons were ready
to give ideas, pushing the ideas further or deepen the analysis was seen as a nuisance.
This is mostly due to the fact that usually the people with ideas are the ones having a
great deal of other responsibilities. Clarity is needed in understanding that even a good
idea is not viable if enough time is not used to show it to others or carry it out by
oneself. Another problem is that probably the most important attributes of such a list are
not used. Many of the proposals stay open because they lack Priority, Effort and
Responsible Person info. If no one is selected to push the improvement proposal
forward or no estimation of the work effort or gained improvement is available, no one
wants to put focus on such tasks.

39
3.3 Cost of time
The problems with the prolonged processing time are most visible in the operating
expenses (OPEX) of the company. As stated in the introduction, the companies in the
mobile network business fight fiercely for a customer market share. The price of the end
product is becoming the most important factor in the decision made for a network
company to be chosen or left out. Not wanting to reduce the quality, companies must
concentrate on making every day spent on the R&D count. Diminishing the amount of
faults in as early state as possible and speeding up the fixing time of thefaults found is
one of the most effective ways. It does not only reduce the producing costs but can take
away the fees paid to customers for delayed deliveries. The indirect costs such as
negative effects on closing the future deals and keeping the existing customers are also
one aspect to be taken into account whencounting these costs.
3.3.1 Fault costs
Testing and fixing can be done at any stage in the lifecycle. However, the cost of
finding and fixing faults increases dramatically as the development progresses.
Evidence suggests that if a fault uncovered during the design costs 1.0 monetary unit to
correct, and then the same fault uncovered just before the testing costs 6.5 units, during
the testing 15 units, and after the release between 60 and 100 units. The need to find the
faults as soon as possible reinforces the need for the quality assurance of documents
such as the requirements specification and the functional specification. This is
performed using static testing techniques such as inspections and walkthroughs. (15.)
An internal study (16) conducted in the WCDMA organization estimated the cost of a
fault found at different stages of the verification. According to it the costs would be
multiplied in the following way:
All figures are based on very rough estimates.
Universal assumption:
1 ODW (one day’s work) low cost ~ 190€

40
1 ODW high cost ~ 490€
Case 1:
TABLE 1. Cost distribution in SCT fault
Fault Found in SCTTask Time spent(h) Cost(€)
Log collection 0,5 12,5
Log analysis 1 25
Correction 7,5 187,5
Regression 4 100Total 13 325
This case is quite ideal, assuming that all work is done at a low cost location.
Case 2.
TABLE 2. Cost distribution in I&V fault
Fault Found in I&V/STTask Time spent(h) Cost(€)
Log collection 3 135
Log analysis 2 90
Correction 15 675
Regression 10 450Total 30 1350
Assuming a mix of half low-cost and half high-cost = 350 €/ ODW

41
Case 3.
TABLE 3. Cost distribution in Customer site fault
Fault found by customerTask Time spent(h) Cost(€)
Log collection 3 195
Log analysis 2 130
Correction 15 975
Regression 10 650
Customer testbed testing 7,5 487,5
Correction deplyment onsite 150 9750Total 13 12188
Assuming most work is done at a high-cost, customer site.
As the figures do not match the V-model estimations of cost progress, they are roughly
the same and give a general idea of the distribution of the costs.
42
4 STUDY FOR IMPROVEMENTS
Chapter 4 introduces the solutions for problems found in specification process. Both
process and tool related improvements are outlined.
4.1 Improving faults processing time
The study was conducted by using the FHT’s embedded filtering system (Appendix 1)
to select the faults reported for two BTS specification groups located in Finland and
Poland. The total amount of the fault reports to be analyzed was 40. There were 20
Fault Reports gathered from both groups, that were already fixed and not in the
CORRECTION NOT NEEDED state. These faults were gone through one by one, and
their revision history and R&D info fields were used to see how much time these
specification groups used to correct the faults. The following information was gathered
from every fault report to get a unified view on all of them.
1. Phase of origin
- This information was seen essential for seeing if a problem found in the later
phases of the process had an effect on the total time spent for the correction.
2. Country of origin
- This information was seen essential for seeing if multi site problems had an
effect on the total time spent for the correction.
3. Responsible Person
- This information was seen essential for seeing if responsibility areas had an
effect on the total time spent for the correction.
4. Report creation date
- Needed to get the total time spent
5. Date of transfer to the specification group
- Needed to get the total time spent in the specification
6. Date of closing the fault as fixed
- Needed to get the total time spent
7. Group in charge

43
- Needed to see if the groups had differences in the completion times
8. Severity
- Needed to filter the A and B severity faults having the correction target of 2 days
max.
One of the items to be inspected was how the V-model horizontal level affects the time
spent on finding the original cause of the problem. If a fault is found in the System
testing and it is originated in the BTS Design specification, how much more effort has
been put in tracing and correcting the fault than for example a fault found in the Unit
Testing and originating in the BTS Design specification.
4.2 Speeding up testability improvements processing time
The improvement study was started by taking part in weekly meetings. While in the
meeting, it quickly became obvious that there were starting difficulties for many of the
tasks. Secondly, a list of separate persons having open proposals on the list was created.
Then, a meeting was held with the ones having most of those proposals together with
the person responsible for the maintenance of the list and Testability meetings. Doing
this gave an insight on why those proposals stay on the list and are not put into action.
Thirdly, the list itself was taken into processing and its advantages and disadvantages
were analyzed. According to the participants of the meetings the problem is that they
simply do not have time to take action with the proposals or explain the depths of the
proposals to colleagues with more time in their hands. Also, discussion with the person
responsible for maintaining the list and holding the meetings was conducted to reflect
on the ideas and improvement proposals. His insight and long experience on the subject
helped focusing and getting rid of non-beneficial ideas.
4.3 Reducing costs
The working hour costs cannot be taken down since the salaries do not usually decline.
Cost of R&D has been fought globally by multi-national companies by conducting
changes such as transferring work to low-cost countries. Transferring the needed
knowledge has proven to be a task more difficult to perform. Probably the only viable

44
way to improve on costs is to find ways to take down the amount of hours used for
performing the tasks and eliminating the ones causing extra work with no real benefit.
To achieve this, it was decided to estimate the impact of the proposed improvements on
the fault fixing process speed up and the possible cost reduction.
The gathered list of faults was focused on to see how many days could be taken away
from the total processing of those 40 fault reports. In the unclear situations the person
responsible for the correction was interviewed briefly to make sure no
misunderstandings occurred. The aim was to see if the faults could have been found in
the specification and if not, if the situation would have been helped using the FT style
approach. The total time used to fix the A an B severity faults was 657 days of which
the specification had the faults assigned to them for 522 days.
The 9/40 fault reports were made by the Unit Testing. These faults found early had the
shortest correction time with an average of ~ 9 days. Most delays in the correction were
caused by the lack of clarity in fault report, the internal assignment delays of the
specification and the multi-site correction needs. A cautious estimate of having stripped
part of these unnecessary delays only by having the clarity over the responsibility could
have speeded up the total correction of these faults by 10 days.
The 6/40 fault reports were made by the I&V. One of them had major responsible group
assignment problems and the total time taken for the fixing was 51 days. The
specification group time taken to fix the specification took 30 days. If the problem had
been found in the specification, a total of 21 days could have been saved. This is a very
conservative estimate since the specification correction was delayed greatly due to the
difficult clarifications of the changed areas. One of the faults had a 35-day delay in the
verification after the first correction had been made ready. The other fault correction
delays were caused by the responsibility assignment delays inside the specification.
These were no major delays but had an effect on the target correction time overall
results of an estimated 10 days.
The 6/40 fault reports were made by the System Testing. One of them had major
responsible group assignment problems, and the total time taken for the fixing was 44
45
days. The specification group time taken to fix the specification took 26 days. If the
problem had been found in the specification, a total of 18 days could have been saved.
This is also a very conservative estimate since the specification correction was delayed
greatly due to the difficult clarifications of the changed areas.
The 2/40 fault reports were made by the Customer. One of them had a major
responsible group assignment problem and the total time taken for the fixing was 92
days. The specification group time taken to fix the specification took three days. If the
problem had been found in the specification, up to 89 days could have been saved.
The calculation of the seemingly unnecessary days used for the specification corrections
adds up to 148. Using the predefined average, ODW cost of 350€ adds up to 51800€ of
costs. As it was said, this is a very cautious estimate, and the savings would most
probably be much bigger if the problems causing the delays were tackled. Both
specification teams are mostly located in the High Cost sites, and the case company
costs for the ODW are bigger.
Definitely, all of these faults and the time used to correct them could have been avoided
at least partially if the specification had been correct at the first time. Such situation
where specification faults could be avoided totally would most probably only exist if the
specification was left undone. Even if the agile testing methodology suggest a very light
specification, there has to be a deep level of specification in the case company due to
the tailored customer needs and deep co-dependencies inside the system.
46
5 SOLUTION PRESENTATION
Chapter 5 outlines the solution proposals found in the study. Estimated impact of the
proposals into the process as well as their effort is analysed.
5.1. Improved faults processing
There is a considerable amount of effort already put on the faults processing and the
improvement of it. The work is definitely ongoing but it is safe to say that this task is
never ready, and expanding the development organization across the globe has made
this task more difficult and at the same time more important than ever before. The next
sections give proposals for diminishing time and money used for the fault correction.
5.1.1 Promoting agility in faults processing
Analyzing the fault reports revealed some interesting facts. The original estimation of
the faults with the longest correction times being found in the later phases of the testing
could not be proved. Although this has been proven in many different studies, it would
most probably require a sample of a few hundred fault reports. This sample had less
than five System Testing or customer originated faults. Instead, the problem with the
prolonged correction seemed to be dependent on the agreement on the responsible group.
In many cases the faults were tossed around between as many as five different groups
while burning valuable time for weeks or even months. This supports the effect of a
narrow analysis of the initial fault. Other faults with long correction times were in many
cases delayed due to the larger correction needs in many sites, and necessary
responsibility transfers took a few days to complete. In many cases where the fault
correction took only two days or less, the assignment of the problem took two to three
days making the whole correction time more than five days. In a few cases the
verification of the correction was also delayed for some reason. That is definitely
something to look into, but it is not done within this thesis.

47
Most of these problems could probably be avoided by promoting the agility and taking
the FTs into real use instead of keeping the component teams in place.
1. The verification inside the FT makes the communication easier. Enough
information should be put into pre-analysis of fault reports to avoid wrong group
and missed time on more analysis
2. The FT having responsibility for the feature implementation from the design to
system verification level makes the fault correction assignment clearer than in a
component team based organization
3. The FT having persons from all the needed groups to implement the feature also
has the needed persons to decide on the correction solution more quickly.
4. No delays of weeks between the correction and verification if done within the
FT
The benefit of this would also be that the FTs would have the needed competence in
place, not necessarily immediately but in due time. Big problems require big corrections.
The FT could better evaluate and split bigger features into smaller, more easily
implementable entities. Implementing and verifying small changes would probably
reveal the faults sooner and the correction would be faster.
5.1.2 Fault correction responsibility change
The responsible person being too busy to correct the fault can take the time to explain
the needed correction to a colleague who can then take over the correction responsibility.
A face-to-face discussion is much more efficient than trying to explain even the
simplest subjects via e-mail. In a multi-person-team there are also always imbalances
between co-workers’ workloads. Those momentarily with a less workload can help this
way to improve the team results since the fault amounts and correction times are
nowadays one of the most critical measures of the team and individual performance.
The second benefit from this way of contributing is that individual competence is
increased since the knowledge outside one’s own expertise area has to be gathered and
used. The lack of such competence is seen as one of the main problems holding back a

48
successful R&D organization. The Method also promotes the agile way of working with
a shared knowledge and by expanding one’s know how. This proposition applies firstly
on those non-critical faults and can be tested with no serial effect on the more critical
tasks. If proven usable, it can be later taken into use. This method would probably also
help in sharing knowledge in the global sense and cross-culturally through the FTs with
members from all over the world.
5.2 Enhanced testability improvements processing
The guideline for the testability improvements processing was seen as beneficial in
getting the ideas into the reality faster or at all. The following sections describe the
proposal for this.
5.2.1 Appointing the responsible person
The list itself maintains the states of different tasks well (see chapter 2.3). However
there are numerous different tasks that do not go forward. The reason for this is that
many vital elements for making decisions on the improvements taken into the further
processing are missing. It is imperative that, in all times, a responsible person is pointed
for each task. If the responsible person is not the one who has given the proposal, the
needed information to process the improvement forward has to be given to another
person who takes the responsibility for taking the improvement proposal further. If there
are subjects regarding the improvement that fall outside the responsible person’s
expertise, the responsibility can be changed to a more suitable person. Also, if the
workload is preventing the more experienced persons from taking over the
responsibility, another person can be appointed.
5.2.2 Evaluating effort and priority
It is also needed to know which of the activities are the most important. If there is no
information regarding the best possible order to execute the tasks, the important ones

49
might be easily lost in masses. In this case, it is recommended that a simple EFFORT –
GAIN measurement is taken into use for the prioritization of the tasks. Having the
following type of information available for all of the tasks in the list makes it easier to
choose the ones most probably having the best positive effect on the processes. The
effort is divided into three different categories. LOW means that less than 20 hours is
needed to complete the task. MED means that less than 50 hours is needed to complete
the task. HIGH means that less than 100 hours is needed to complete the task. If a task
is estimated to take more than 100 hours to complete, it should be divided into subtasks
so that the maximum of 100 hours is estimated to be taken to complete each task.
Evaluating the impact of these “sub” tasks is not necessary as the big picture is the most
important one. The impact of the main task is important as the subtasks aim to fulfill a
part of that main task.
TABLE 4. Points for Effort and Priority
Exemplary list (Table 4) is created by giving points from 0-2 from the priority and 2-0
from the effort from low to high. A task having a high effort and a low priority gets 0
points etc. From this it is easy to see that tasks E and M are the most important ones.
This evaluation can be given by the proposing person when the proposal item enters the
list or it can be analyzed by a larger group of contributors having a view on the subject.

50
5.2.3 Evaluating impact
Evaluating the impact of a task is more difficult. This depends at first solely on the level
of understanding of the impact of the proposition by the proposing person. The
Testability Feature Team must then assess the given information and figure out the
persons needed to evaluate the impact of the task further. When all the needed persons
are present, a credible evaluation of the impact can be given. This can also affect the
effort estimation.
For a proposition it has to be taught if it helps solve the existing faults or help remove a
type of a fault totally. Another viewpoint is if an improvement brings something totally
new and needed into the R&D process. This sort of improvements can definitely be seen
as a lower priority if their impact on a current problem is clearly visible. Points to help
make the decision can be given from the estimated impact of the proposal on the
existing problems (Table 5)
TABLE 5. Points for impact
Now when these both evaluation methods are combined, a more accurate evaluation of
the importance of those tasks can be given.

51
TABLE 6. Total evaluation points
Now task E has the highest score and should be the one most effort is put into bringing
the testability improvement in the company use. The process now incorporates the
priority, effort and impact evaluation and can be better used to filter out the change
proposals with no real benefit (see Figure 8).

52
FIGURE 8. New testability improvement process
5. 3 Cost reductions
There were clear indications found in both the fault and the testability studies that the
lack of, or an unknown responsibility is a real problem when it comes to cost. Not
knowing this has an effect on both delivering the new and fixing the old.

53
The problems affect each other and go around in a circle stretching the fault correction
time and increasing their amount ever further. There is no one clear solution to fix these
problems but there are ways to diminish the costs by making an effort to do this.
The initial analysis before creating the faults helps to
• Narrow down the root cause
• Pinpoint the responsible group
• Speed up the correction
Appointing features to the FTs instead of separate component teams taking
responsibilities help to
• Spread knowledge to new individuals
• Clarify the fault correction responsibilities
• Have more effective inspections and analysis
All of the mentioned indirect improvements take down costs by reducing the time taken
to run new features into the system. They can change the process from an uncontrolled
generation of faults into the controlled process of generating new features with fewer
initial faults and fixing faster the few problems that occur (see Figure 9). As the team
and individual fault amounts are also used in the evaluation of the performance, this is
definitely beneficial for not only the company but the employees as well.
FIGURE 9. FT introduction impact
54
6 CONCLUSION AND DISCUSSION
The target of the thesis was to take a role in clarifying the different projects currently
ongoing at NSN targeted to improve the fault tracing and correction time. The target
was not to create any new tools or processes but to introduce methods to improve the
existing ones. The work was carried out at a good level. Proposals for the process
improvements and methods for diminishing the costs were introduced. Delimiting the
area to be analyzed proved to be a difficult task. Testability as a topic expands after all
from the first initial HW startup verification into the System Verification and further.
Even when the decision was made to rule out the Customer related testabilty, there was
still too much area to be covered within one thesis. The Testability Improvement Team
meetings gave an excellent viewpoint on this being limited enough for a detailed study.
Tackling the problem of the testability improvements process made a real impact. When
the improvement ideas were taken into use, after the first meeting the amount of
proposals not going forward was dropped in half. Generally, also taking the needed time
to analyze any task from the impact’s and work load’s points of view’s is also beneficial
to avoid spending much time in the projects with no real gain on the process or the
feature development.
The lesson learned during the thesis process was that determination is needed when
carrying out even small improvements in an organization having customary processes
embedded into their work style. The pure amount of work for those, whose knowledge
is beneficial in taking the processes and features further, delimits their possibility to
contribute. One with no authority over the processes or individuals has to be able to
justify and show that changing those processes is beneficial not only for the company
but also for the individual side. Understanding this creates commitment. My studies
were strongly focused on the SW, GUI design and such, and thus their impact on this
thesis was not strong. I still believe that having seen both the feature and the process
development side helped me in getting this work done.
The most important subject having done this thesis is to concentrate on defining and
delimiting the area to be studied. In an organization this size even a person with a

55
limited viewpoint can notice dozens of different improvements, big and small. Focusing
on those subjects close to one’s work improves the concentration.
A bigger amount of faults could be beneficial to be analyzed. An even better view on
reasoning a change from the component team structure to the FT structure might be
found. The multisite structure of the company and its effects on the fault correction time
should also be analyzed with a more extensive sample of fault reports. This could give
leverage in the decisions over restructuring needs and team organizing planning. An
organization with a considerable amount of projects aiming to provide customers with
dozens of different products gets a real economical benefit even in small improvements
for the fault fixing process.
56
REFERENCES
1. OBSAI – About OBSAI
Available at: http://www.obsai.com. Date of data acquisition: 7 March 2012
2. Koivula H-L. (2005) Integration Testing for System-on-Chip. University of Oulu,
Department, of Electrical and Information Engineering. Master’s thesis
3. V-model
Available at: http://www.waterfall-model.com/v-model-waterfall-model/
Date of data acquisition: 7 March 2012
4. AGILE SCRUM
Available at: http://agilescrum.biz/six-sigma-and-agile-software-development/
Date of data acquisition: 5 July 2012
5. Principles Behind The Agile Manifesto
Available at: http://agilemanifesto.org/principles.html
Date of data acquisition: 5 July 2012
6. The Agile Manifesto
Available at: http://www.agilealliance.org/the-alliance/the-agile-manifesto/
Date of data acquisition: 5 July 2012
7. Agile software development
Available at:
http://en.wikipedia.org/wiki/Agile_software_development#Comparison_with_other_me
thods
Date of data acquisition: 5 July 2012
8. Larman, C., & Vodde, B. (2008). Scaling Lean & Agile Development: Thinking and
Organizational Tools for Large-Scale Scrum. Boston, MA, USA: Addison-Wesley.
57
9. Latomaa J. (2005), Fault localization and usability enhancement in WCDMA
base station. University of Oulu, Department of Electrical Engineering. Master’s
Thesis
10. Rutkowski A. (2012) Fault Management, BTS Management element
Feature Specification, Internal NSN Document. Unpublished.
11. Evisalmi A. (2004) WN releases SW Architecture specification. Internal
Nokia Specification. Unpublished.
12. Eade K. (2010) Fault management of Basestation software. University of Oulu,
Department of Electrical and Information Engineering. Master’s Thesis, 56 p.
13. Software bug
Available at: (http://en.wikipedia.org/wiki/Software_bug#Bug_management)
Date of data acquisition: 5 July 2012
14. Polak A. (2011) CN Process.
Internal NSN Specification. Unpublished. 15p.
15. The V-model Available at: www.compensationanalytics.com/_resources/vtestingmodel.pdf
Date of data acquisition: 5 July 2012
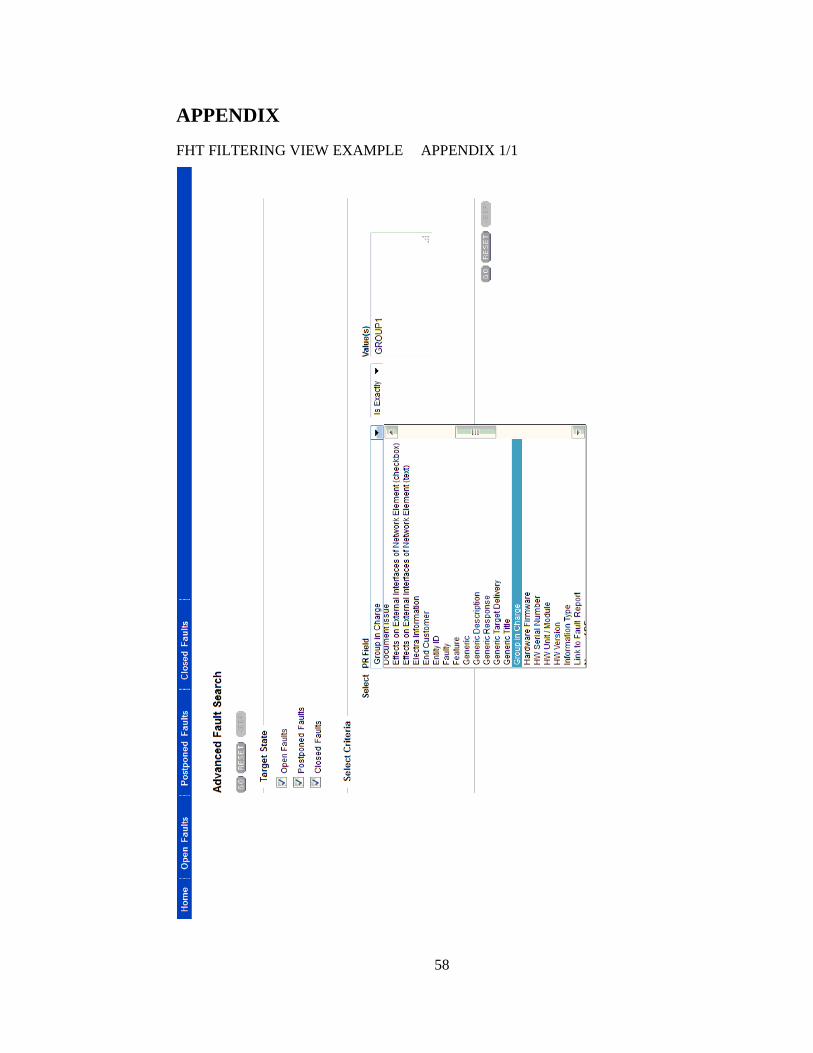
58
APPENDIX
FHT FILTERING VIEW EXAMPLE APPENDIX 1/1