master - vtechworks.lib.vt.edu · two projects concern the prospects of sex reversal by employing...
TRANSCRIPT
. VARIOUS ASPECTS OF REPRODUCTIVE CONTROL IN FRESHWATER FISHES ·
by
Helen T" Smith
Thesis submitted to the Graduate Faculty of the
Virginia Polytechnic Institute and State University
in partial :t'ulfillment of the requirements for the degree of
APPROVED:
Carl B. Schreck
MASTER OF SCIENCE
in
Fisheries and Wildlife Science
(Fisheries Science Option)
Patrick F. Sldnion
ACKNOWIEDGEMENTS
I am very grateful to those members of the Fisheries and
Wildlife Department who were instrumental in providing the
opportunity for me to continue l!IY' education and to m.Y' family for
their encouragement in this direction. I particularly thank the
National Marine Fisheries Service and West Virginia Department of
Natural Resources for providing :funds for this study.
Special acknowledgement goes to my graduate committee,
for their constructive guidance and personal interest in my graduate
studies. A special 11thank you" is extended to
of the National Water Quality laboratory, Duluth, Minnesota, who
generously supplied fathead minnow eggs and helpful suggestions
for raising the fry. Also,
are gratefully acknowledged for their expertise in the statistical
analyses.
I am sincerely grateful to my husband, for his moral
support and understanding while I was writing this manuscript.
ii

TABIJ: Qr CONTENTS
Page
ACKNOWIEDGEMENTS. ii
TABU: OF CONTENTS iii
LIST OF FIGURES v
LIST OF TABI.ES vii
LIST OF APPENDIX TABIES ix
INTRODUCTION. 1
PART I
INTRODUCTION. 3
METHODS 5
RESULTS 7
DISCUSSION. 16
PART II
INTRODUCTION. 19
MATERIAI.S AND METHODS 21
RESULTS 24
DISCUSSION. 31
PART III
INTRODUCTION. 33 MATERIAI.S AND METHODS 34
RESULTS 38
DISCUSSION. 63
iii

REFERENCES CITED.
APPENDIX.
VITA.
iv
Figure
1
2
3
LIST OF FIGURES
Frequency of sexual display (dorsal fin erection, sigmoid body configuration, and vibrating-backing motion) in male guppies in replicate treatments with Ml', CA, and CA/'llfr. Each bar consists of the total number of male displays per aquarium. The Y's =the average number of displays over the test period per day per treatment. The 9 days represent the 8th through the 16th day of treatment inclusively.
Average number (+ standard error) of cysts in each spermatogenic stage for each testicular sample in each treatment. SPG • spermatogonia; SPC • sperma-tocytes; SPD = spermatids; SPM • spermatozoa; SPR • spermatophorea • • . • • . • . • . • • • • • •
Number of ll ve fish in each treatment at the start (S) and at the finish (F) of Experiment 2 •••••
4 Numbers of fish (Experiaent 4) in the initial population densities (plain bar); after the first month (hatched bar); and at the end of the experiment
5
(black bar) for each experimental group. Numbers below bars indicate food ration given each experi-mental group. AL = ad libitum; 66 • 66 percent ot !!! libitum amount; 33 • 33 percent of ad llbitwa amount . . . . . . . . . . . . • . . . . ·
Plot of transformed data of Experiment 4: log10 egg size/length2 on l/length. A = one observation,
8
12
27
44
B = two observations • • • • • . • • • 47
6
7
Plot of transformed data of Experiment 4: log10 egg size/weight2 on l/weight2. A • one observation, B = two observations, C = three observations, D • four observations, H • eight observations, T = 20 observations. • • • • • • • . • • • • 49
.Numbers of fish {Experiment 5) in the initial population density of each experimental group are indicated by the height of the bar; black bars show number of fish at end of the study. Number• under bars indicate number of feedings per day . •
v

Figure
8
vi
Plot of transformed data of Experiment 5: log10 egg size/length2 on l/length. A a one observation, B = two observations, C = three observations, D • four observations ••
9 Plot of transformed data of Experiment 5: log10 egg 1ize/weight2 on l/weight2. A • one observation, B = two observations, C = three observations, D = f0\11" observations, I • five observations, F = six observations, G = seven observations, H • eight observations, K • eleven observations, M • thirteen observations, O = fi~een observations • • • • • • • • • • • •
59
61

1
2
3
4
5
6
7
LIST Q!'. TABIES
Effects of cyproterone acetate (CA), methyl testosterone (MT), and a combination of CA with M'l' on color elabor•tion in male and female guppies after 18 days treatment . •
Histological observations revealing treated females with eggs and/or embryos at termination of the experiment. CA = cyproterone acetate; Ml' = methyl testosterone. • . . • . • • • • • . •
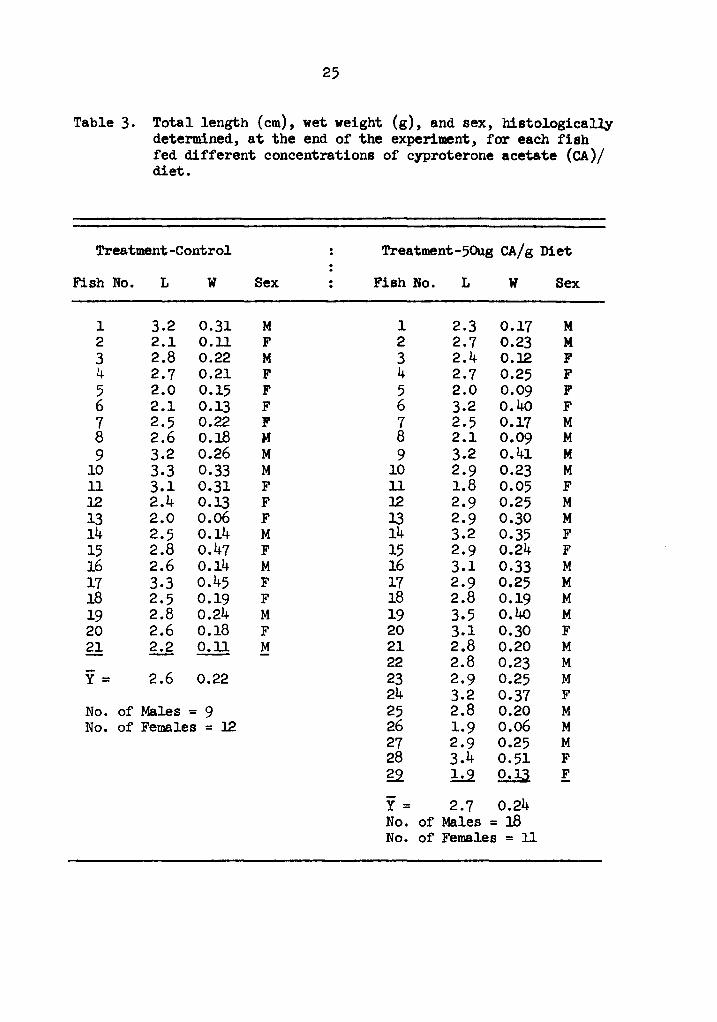
Total length (cm), wet weight (g), and sex, histologicall.y determined, at the end of the experiment, for each fish fed different concen-trations of cyproterone acetate (CA)/diet. • • •
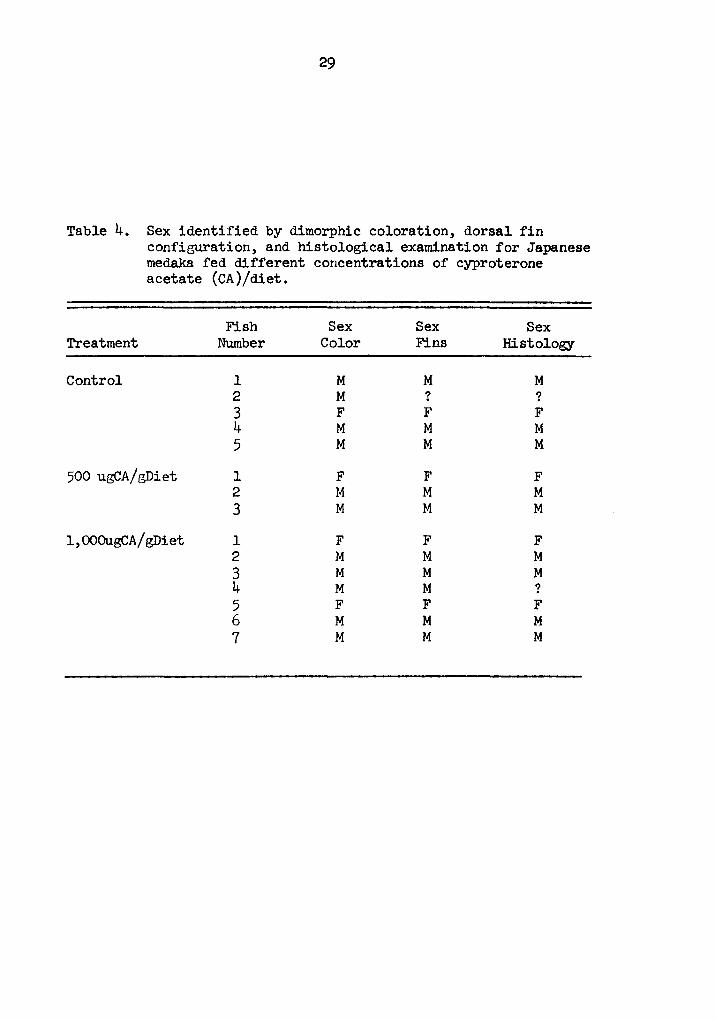
Sex identified by dimorphic coloration, dorsal fin configuration, and histological examination for Japanese medaka fed different concentrations of cyproterone acetate (CA)/diet • • • • • • • • •
Means for total length (mm) and wet weight (g) of fathead minnows (Pi:mephales promelas) subjected to different feeding rates and population densities. N = pooled number of all male and female fish in three aquaria corresponding to a particular food abundancy or population density treatment at the end of the experiment. SD = standard deviation.
Means for total length (mm), wet weight (g), and egg size (mm) of female fathead minnows (Pimephales promelas) subjected to different feeding rates and population densities. N = pooled number of all female fish in three aquaria corresponding to a particular food abundancy or population deneity treatment at the end of the experiment. SD = standard deviation • • • • • • • • • • • •
Means for total length (mm) and wet weight (g) of male fathead minnows (Pimephales promelas) subjected to different feeding rates and population densities. N = pooled number of all male fish in three aquaria corresponding to a particular food abundancy or population density treatment at the end of the experiment. SD = standard deviation . • • • . • • • . • • • • • •
vii
. . . . .
10
15
25
29
39
40
41
viii
Table
8 Means for total length (DID) and wet weight (g) of fathead minnows (Pimephales promelas) subjected to different feeding rates and population densities. N = pooled number of all male and female fish in four aquaria corresponding to a particular feeding rate or population density treatment at the end of the experiment. SD = standard deviation. • • • • • • • 51
9 Means for total length (mm), wet weight (g), and egg size (mm) of female fathead minnows (Pimepbales promelas) subjected to different feeding rates and population denai ties. N = pooled number of all female fish in four aquati·a corresponding to a particular feeding rate or population density treatment at the end of the experiment. SD = standard deviation • • • • • • • • • • . • • • • • • • • • 52
10 Means for total length (mm) and wet weight (g) of male fathead minnows (Pimephales promelas) subjected to different feeding rates and population densities. N = pooled number of all male fish in four aquaria corresponding to a particular feeding rate or population density treatment at the end of the experiment. SD a standard deviation. • • • • • • • 53

~ Q! APPENDIX TABIES
Table Page
I Weekly food calculations .•...•......•.. 74
ix

INTRODUCTION
One of the problems in :fisheries management is the control
of fish populations. Control of reproduction and numbers of fish
is the general theme of this thesis. I designed three projects.
Two projects concern the prospects of sex reversal by employing
an antiandrogenic compound, cyproterone acetate, on adult guppies
(Poecilia reticulata) and larval Japanese med.aka (Or:rzias latipes).
The third project is a study of the effects of different food
amounts and different population densities on the growth and
reproduction of :fathead minnows (Pimepbales promelas).
Control of numbers and reproduction in fish is an important
management tool for many purposes: to prevent the overcrowding
and, hence, stunting of fish growth; to control numbers of
undesirable fish; to control exotic species while being teated
in new habitats; to control the number of a species used for
biological controls; and to control numbers of predators in the
species balance of farm ponds. Manipulation of population number
by control of sex or by limiting some biotic or abiotic factor
in the ecosystem is a practice which is being studied further in
fisheries science research today.
1

PART I
REPRODUCTIVE BEHAVIOR, COLORATION, AM> GAMETOGENESIS I1'f
GUPPIIS (POECIL.IA RETICUIATA) TREATED WITH METHYL
TESTOOTEROIO! AND CYPROTEROD ACETATE
2

INTRODUCTION
Androgens are involved in the expression of primary and
secondary sex characters in teleosts (Pickford and Atz 1957;
Hoar 1962, 1969; Liley 1969). Pandey (19698) found that administra-
tion of methyl testosterone to hypophysectomized adult guppies
(Poecilia reticulata) effects spermatogenesia and the elaboration
of male coloration. Other studies employing the antigonadotropic
agent methallibure (I.C.I. 33, 828) on adult guppies have shovn
that spermatogenesis and secondary sex characters are, at least in
part, dependent on gonadotropin secretion (Pandey 1970; Pandey and
leather land 1970). The above reports of experiments employing
androgen administration, hypophysect~, and gonadotropin antagonism
illustrate the relationship of the pituitary-gonadal axis with
respect to expression of sexual characteristics in the guppy.
The development of cyproterone acetate (CA) (l,2-methylene-6-
chloro-~4'6-pregnadiene-17a-ol-3 ,20-dione-17a-acetate), a potent
antiandrogen in mall'ID8ls (Neumann et al. 1967a, b) may provide a new
approach in the research of the role of androgens in fishes. Typical
female sexual behavior was induced by CA in male rats (Neumann and
Elger 1965, lg66a). Reduced male sexual activity was observed in
other male rodents treated with CA (Neumann et al. 1967c; Steinbeck
et al. 1967). However, Whalen and Edwarda (1969) and Whalen et al.
(1969) reported no inhibitory effect of CA on the androgen-dependent
mating behavior in male rats. Further, adult males treated with CA
showed depressed spermiogenesis (Neumann and von Berswordt-lfallrabe
3

4
1966a; Neumann et al. 1968), whereas in females, cyproterone reduced
the ovulatory inhibition of androgens, estrogena, and other 1ex
steroid& (:Neumann and von Berswordt-liiBllrabe lg66b). CA apparently
affects the feedback mechanism of the pituitary-gonad axis by block-
ing the effects of testosterone and increasing gonadotropin
secretion (Neumann 1966; Bloch and Davidson 1967). Ill fish, it is
known that CA effectively blocks androgen uptake and/ or retention in
testes but not in ovaries of rainbow trout (Salmo gairdlleri)
(Schreck 1973). Rastogi and Chieffi (1975) showed that CA failed
to block the masculinizing action of androgens on secondary sex
characters in Xiphophoru.a helleri. CA did, however, inhibit the
seminal vesicular J:zypersecretion cauaed by androgens in castrate
Heteropneustea foasilis (Sundararaj and :Nayyar 1969). The action
of the antiand.rogen in other classes of vertebrates ia reviewed by
Chieffi et al. (1974) and Rastogi and Chieffi (1975). CA possibly
blocks androgens at both a central and peripheral level and, therefore,
it is of interest to evaluate effects of CA administration on
reproductive attributes in fishes.
The objective of this study was to establish the efficacy of CA
in inhibiting the action of androgens in fishes. Effects ot CA,
metb;y'l testosterone, and a mixture of the two steroids on behavioral,
colorational, and gametogenic characteristics ot intact, adult guppies
were evaluated.
METHODS
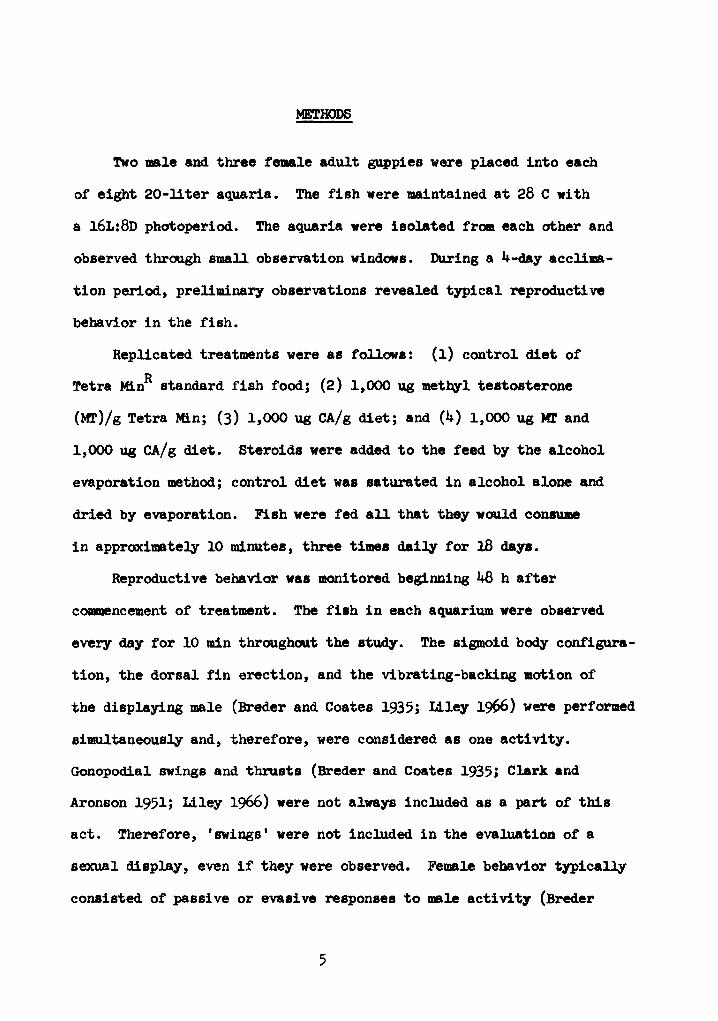
Two male and three female adult guppies were placed into each
of eight 20-liter aquaria. The fish were maintained at 28 C with
a 16L:8D photoperiod. The aquaria were isolated from each other and
observed through small observation windows. During a 4-day acclima-
tion period, preliminary observations revealed typical reproductive
behavior in the fish.
Replicated. treatments were as follow•: (1) control diet of
Tetra MinR standard fish food; (2) 1,000 ug met~l testosterone
(Ml')/g Tetra Min; (3) 1,000 ug CA/g diet; and (4) 1,000 ug Ml' and
1,000 ug CA/g diet. Steroids were added to the feed by the alcohol
evaporation method; control diet was saturated in alcohol alone and
dried by evaporation. Fish were fed all that they woW.d conaume
in approximately 10 minutes, three times daily for J.8 days.
Reproductive behavior was monitored beginning 48 h after
commencement of treatment. The fiah in each aquarium were observed
every day for 10 min throughout the study. The sigmoid body configura-
tion, the dorsal fin erection, and the vibrating-backing motion of
the displaying male (Brader and Coates 1935; Liley 1966) were performed
si111U.l.taneously and, therefore, were considered as one activity.
Gonopodial swings and thrusts (Breder and Coates 1935; Clark and
Aronson 1951; Liley 1966) were not always included as a part of this
act. Therefore, 'swings' were not included in the evaluation of a
sexual display, even if they were observed. Female behavior typically
consisted of passive or evasive responses to male activity (Bred.er
5

6
and Coates 1935; Clark and Aronson 1951). Female positive response
(Liley 1968; Liley and Wiahlow 1974) waa never observed.
At the conclusion of the experiment, pigmentation intenaity and
distribution were visually evaluated for all fish and ranked on a
scale from 0 (pale color) to 3 (extreme~ brilliant) for males
and O (normal, dull gray) to 3 (extra brilliance) for females. All
fish were fixed in Bouin's solution, paraffin-imbedd.ed, serially
crossed-sectioned (7µ), and stained with Harris' hematoxylin and
eosin stains. Stages of ga11etogene1is were quantified by determining
the average number of cysts per tissue section for each gonadal
sample.

RESULTS
Male courtship behavior was observed prior to treatment and
regularly in all tests for 8 days after onset of treatment.
Ichtb,,yophthirius was contracted by some fish on day 18 of treatment;
hence, only the data up to day 16 are presented. Also, to overcome
any differences due to adjustment periods to the treated diets, the
behavioral results acculllllated between days 8 and 16 are reported.
The average frequency of male courtship display was not significantly
different between treatments (Fig. 1). Hierarchical position of
males with respect to dominance and territories was established by
the fish in all treatments, except for Mr in which co-dOllinance
prevailed. Any apparent differences in frequencies of display within
and among treatments ll8Y be due to natural variability in dominance
relationships between fish.
In the Mr and CA/Mr treatments, females ·displayed male sexual
behavior by adopting the sigmoid body configuration as well as the
vibrating-backing motion. Dorsal fin erections did not always
accompany this display. The masculinization in the female' a behavior
was noted on the 11th and 12th days in the M'l' treatment; whereas,
in the CA/Mr treatment, the masculinized behavior of females was
observed on the 14th and succeeding days. CA did not block this
androgen-induced activity.
At termination of the experiment, all surviving mles and females
were ranked according to color intensity (Table 1). Control and CA
treated females exhibited no observable color change. However,
7

8
Fig. 1. Frequency of sexual display (dorsal fin erection, sigmoid
body configuration, and vibrating-backing motion) in male
guppies in replicate treatments with Ml', CA, and CA/'tl/!.
Each bar consists of the total number of male displays
per aquarium. The Y's = the average number of displays
over the test period per day per treatment. The 9 days
represent the 8th through the 16th day of treatment
inclusively.

40 CA
30
20
10
o._._......_._.._. ....................................................... ~-1 2 3 4 5 6 7 8 9
>- 30 (.) z 20 w :) 0 w a:: LL
10
0
>- 40 <( _J 30 a.. en 0 20
10
....
....
....
....
....
MT - -- ... -... -
-
n 123456789
CA/MT
123456789 4 0 CONTROL
30
20
I 2 3 4 5 6 7 8 9
9
y =9.7
Y=I0.3
y =7.5
y = 7.0
40
30
20
10
0
30
20
10
0
40
30
20
10
- CA -- -... - -- ... i..- .. -...
-----
I 2 3 4 5 6 7 8 9
MT
... --
-.... ,... -n -I 2 3 4 5 6 7 8 9
CA/MT*
I 2 3 4 5 6 7 8 9 4 0 CONTROL
30
20
123456789
TIME-DAYS *one male died on day one. ·

10
Table 1. Effects of cyproterone acetate (CA), metl'J¥l testosterone (Mr), and a combination of CA with Mr on color elaboration in male and female guppies after 18 days treatment.
Treatments
Color Rank Control CA Mr CA/Mr
Number of females
Normal, dull gray 6 6 0 2
Slight iridescence 0 0 0 l
Brilliant-iridescence with black and orange blotches 0 0 1 3
Extra brilliant 0 0 5 0
Number of males
Pale color la 28 0 la
Normal, brilliant color 3 2 0 2
Extra brilliant 0 0 4b 0
8 Subordinate males.
b Co-dominant males.
11
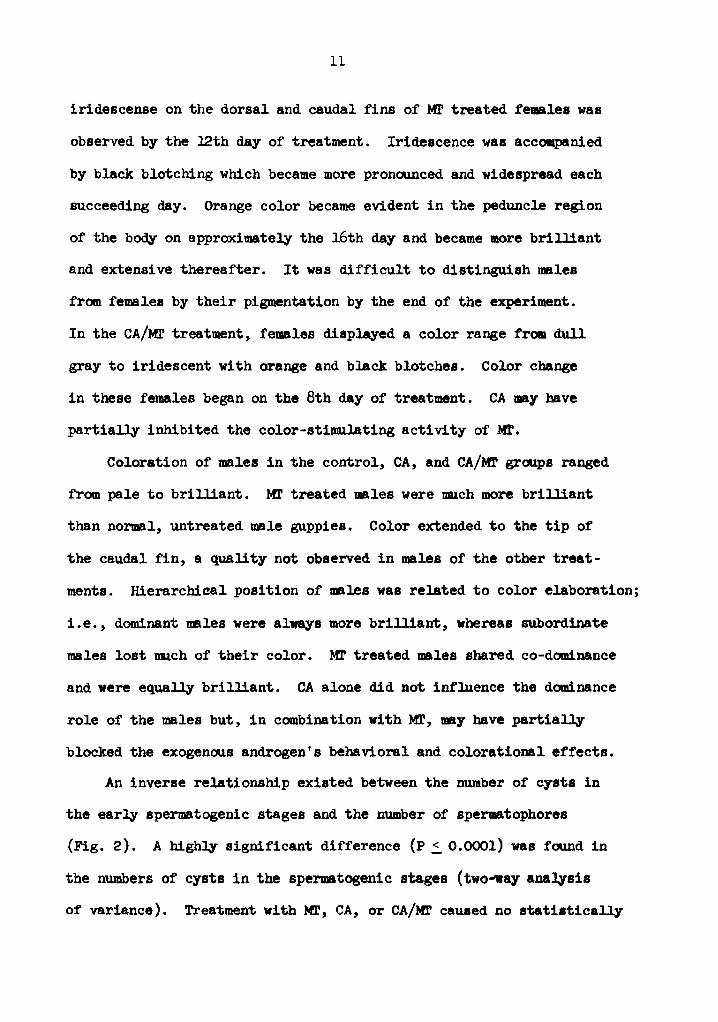
iridescense on the dorsal and caudal fins of Ml' treated females was
observed by the l2th day of treatment. Iridescence was accompanied
by black blotching which became more pronounced and widespread each
succeeding day. Orange color became evident in the peduncle region
of the body on approximately the 16th day and became more brilliant
and extensive therea~er. It was difficult to distinguish males
from females by their pigmentation by the end of the experiment.
In the CA/Ml' treatment, females displayed a color range from dull
gray to iridescent with orange and black blotches. Color change
in these females began on the 8th day of treatment. CA 11/JAy have
partially inhibited the color-stimulating activity of Ml'.
Coloration of males in the control, CA, and CA/llfr groups ranged
from pale to brilliant. Ml' treated males were llDlCh more brilliant
than normal, untreated male guppies. Color extended to the tip of
the caudal fin, a quality not observed in males of the other treat-
ments. Hierarchical position of males was related to color elaboration;
i.e., dominant males were always more brilliant, whereas subordinate
males lost much of their color. Ml' treated males shared co-dominance
and were equally brilliant. CA alone did not influence the dominance
role of the males but, in combination with Ml', may have partially
blocked the exogenous androgen's behavioral and colorational effects.
An inverse relationship existed between the number of cysts in
the early spermatogenic stages and the number of spermatophores
(Fig. 2). A highly significant difference (P ~ 0.0001) was found in
the numbers of cysts in the spermatogenic stages (two-way analysis
of variance). Treatment with Ml', CA, or CA/Ml' caused no statistically

12
Fig. 2. Average number (~ standard error) of cysts in each
spermatogenic stage for each testicular sample in
each treatment. SPG = spermatogonia; SPC = spermatocytes; SPD = spermatida; SPM • spermatozoa;
SPR = spermatophores.

190
180
170
160
CJ) 150 I-~ 140 0 130 u z 120 w g 110
~ 100 ~
ffi 90 a.. CJ) 80 LL 0 70
a:: 60 w ~ 50 :::::> z 40
30
20
10
13
~ • CONTROL [I]• CA
[].MT
D = CA I MT
01-....1~~~~WL-l--...a.lo&.~_._~.M.&1~---l.aai..~-
SPG SPC SPD SPM SP~
STAGES OF SPERMATOGENESIS
14
demonstrable difference from the control pattern.
Histological examination revealed the presence of eggs in the
ovaries of all but two felll81ea (Table 2). The exceptions probab~
do not reflect differences due to treatment. Embryos were :f'ou.nd
in all females in the control and CA trea tmenta. On~ one female
in the Ml' treatment and none in the CA/'!ltr group had embryoa present
in its ovaries. A binomial teat revealed a highly significant
difference (P ~ 0.003) between proportions of females with embryos
in the four treatment groups.

15
Table 2. Histological observations revealing treated femlea with eggs and/or embryos at termination of the experiaent. CA = cyproterone acetate; Mr = methyl testosterone.
Number Number Number of Females of Females
Treatment of Femles with Eggs with Embryos
Control 6 6 6
CA 6 5 5
Mr 6 5 1
CA/Ml 4 4 0

DISCUSSIOO
·Even though there was some difference in male seXW!ll display
between treatments, it appears that MT elicited male co-dominance.
CA possibzy inhibited the action of endogenous as well as exogenous
androgens in both the CA and CA/Mr treated males because co-dominance
was not demonstrated. One-half of the females receiving the combined
steroids displayed masculinized behavior, whereas all Ml' treated
females displayed male courtship behavior. It is, therefore,
probable that the antiandrogen partially inhibited the effects of
Mr in the CA/?tf! treated females. It ii also possible that the
co-dominance observed in the Ml' treated males was the result of
the masculinization of the females in those tanks.
The antiandrogen did not inhibit the action of endogenous
androgen in production of male coloration in the CA and CA/J!tr treated
males. The antiandrogen, however, appeared to have blocked the
action of the exogenous androgen because of the difference in
coloration between Ml' and CA/lff treated fish of either sex. In all
cases, the male exhibiting pale color was the subordinate. Where
Mr alone was administered, no territories were established and both
males were co-dominant and exhibited equal brilliance. Changes in
the males' color expression most~ involved the integumentary
lipophores, whereas in the females, the iridocytes, melanophores,
and lipophores were noticeab~ affected. This difference is probab~
due to the distinct dimorphic coloration that exists naturally.

17
Pandey (19698,b) found that hypopbysectOley' completely blocks
mitotic division in spermatogonia and inhibits development of
spermatogonia into spermatocytea. Treatment with methyl testosterone
restored and increased mitosis in spermatogonia and increased the
number of spermatocytes (Pandey 1969&). Because CA acts as an
antiandrogen to testosterone retention in piscine testicular tissue
(Schreck 1973), one would expect gametogenesis to be inhibited.
The relationships of spermtogonia and spermatocytes, as shown in
Fig. 2, are approximately the same in all treatments, except for the
control, suggesting that CA has no effect on the transformation of
spermatogonia into spermatocytes in the fish treated with androgen.
When administered alone, CA also had no effect. There were more
spermatophores in all the treated males than in the controls, and
only one femle in the Ml' treatment and none in the CA/Mr group
bad embryos present in its ovary. The higher number of spermatophores
in the males and the absence of embryos in the females of the Mr and
CA/Mr treatments are, perhaps, best explained by the masculinized or
otherwise altered behavior and/or physiology on the part of the female.
In general, CA appears, at least at the concentration employed, to
be an extremely weak antiandrogen with respect to inhibiting sexual
characteristics induced by endogenous and exogenous androgen in both
male and female guppies.

PART II
THE EFFECT OF CYPROTIRONE ACETATE ON SEX DETERMINATION
IN THE JAPANESE MEDAKA ( ORIZIAS IATIPES)
18

INTRODUCTION
Sex reversal is a phenotypic and functional sex change from
that of an individual's genotype. Larval fish, treated with proper
doses of androgens or estrogens prior to and during the stage of
gonadal differentiation, successfully change to the sex appropriate
for the sex steroid administered. Embryonic sex inductors, similar
to sex steroids, may mediate sex determination in fish (Yamamoto
1953, 1955, 1958, 1959&,b, 1961, 1962, 1963, 1964a,b, 1965, 1968;
Yamamoto and Kajishima 1968; Yamamoto and Matsuda 1963). other
studies concerning sex determination in fish have been reviewed
and accompany a comprehensive reference chart of sex hormones and
other steroids teated for their eff ecta on sex of juvenile fish
(Schreck 1974). By these experiments, it was shown that the gonads
in fish respond to sex steroids and that man can direct the sex of
certain teleostean fishes, irrespective of their genotype. However,
in ma1JID8ls treated with sex hormones, only the secondary and
accessory sex characters are changed to the heterologous sex; the
gonads are not changed. In contrast to studies on fish, mammalian
research may support a non-steroid sex inductor theory.
Laboratory synthesis of cyproterone acetate (CA) (1,ai-met~lene-
6-chloro-~ 4•6-pregnadiene-17a-ol-3,20-dione-17a-acetate) a potent
antiandrogen in mammals has afforded a new approach in studying the
function of male sex hormones and the effects of inhibiting endogenous
male sex steroids on sex determination. If embryonic sex inductors
are similar to sex steroids, CA would be expected to block the
19

20
androgenic effect of a male sex inductor during sex differentiation.
Earliest studies demonstrating the efficacy of CA in inhibiting
the male sex steroids in mammals are reviewed by Neumarm and Elger
( 1966a) and Neumann et al. ( 1967a, b). Feminization of male secondary
and accessory sex characters was induced when fetal male rabbits,
mice, and rats were treated with CA via administration of the anti-
androgen to their pregnant mothers (Elger and Neumann 1966; Elger
et al. 1967; Neumann and Elger 1966b; Neumann et al. 1966&,b).
Neumann et al. (1967b) suggested that CA attaches to androgen receptor
sites, blocking endogenous androgens at target tissues. However,
the gonads were not influenced by CA and were, therefore, assumed to
be androgen-independent. These studies further supported a non-
steroid-like sex inductor theory.
Little is known about the effects of CA in teleosts. In a
preliminary study, Schreck (1973) demonstrated the blocking effective-
ness of CA on the uptake and retention of labelled testosterone in
rainbow trout (Salmo gairdneri) testes. Nothing has been done to
demonstrate the effects of CA in sex determination of larval fish.
In nonmammalian experiments, Chieffi et al. (1974) demonstrated
that undifferentiated tadpoles treated with testosterone or with CA
developed into male frogs. The present experiment was designed to
demonstrate the effects of CA in larval fish and to test whether
embryonic sex inductors in fish are similar to sex steroids.

MATERIAU> AND METHODS
Experiment 2. Japanese medak.a (Qryzias latipes) eggs of the
cultivated golden strain were obtained from Carolina Biological
Supply Company, Burlington, North Carolina. Eggs were incubated in
petri dishes containing an embryo-rearing solution to minimize
mortall ty (Kirchen and West 1969). Upon hatching, fry were equally
distributed among 12 4-liter jars for the first 3 weeks after hatch-
ing. Fish from each of the 12 jars were then transferred to 12
100-liter aquaria and reared to maturity in 25 C aerated water under
14L:lOD photoperiod. R Three dosage levels, 50, 250, and 500 ug CA/g Tetra Min ,
standard fish diet were prepared. The steroid was added to the food
by the alcohol evaporation method. Control diet, without steroid,
was saturated in alcohol and dried by evaporation. Three groups of
fish were fed control diet; three groups were fed 50 ug CA/g diet;
three groups were fed 250 ug CA/g diet; and three groups were fed
500 ug CA/g diet. Feedings, three times daily, began within 24 h
after batching and continued for 12 weeks. Thereafter, all fish
were fed standard diet of dried food supplemented with nashed egg
or liver.
The experiment was terminated after 27 weeks. Total length
and vet weight were measured for each fish. Histological examina-
tions were made on the gonads of each fish. Fish were fixed in
Bouin's solution and embedded in paraffin. Serial cross-sections
(lOu) were stained with Harris' hematoxylin and eosin. Ratio of
21

22
males to females was used as an index of the effect of CA.
Interpretation of the results of this experiment was not
definitive. Based on observations of sex ratios, I could not assume
that sex reversal had, in fact, been established. Therefore, the
experiment was repeated using a strain of medaka with a sex-indica-
tive genetic marker.
Experiment 3. Eggs of the d-rR strain Japanese medaka (Qryzias
l.atipes) were obtained from the Department of Anatomy, State University
of New York, Brooklyn. This strain of medaka produces sex-linked
dimorphically colored fish: red males and white females. Eggs were
incubated in petri dishes containing embryo-rearing solution. Hatched
fish were equally distributed among eight 20-liter aquaria.
Two treatment diets were prepared. R CA was added to Tetra Min
standard fish food by the alcohol evaporation method in concentrations
of 500 and 1,000 ug CA/g diet. Control diet, without steroid, was
saturated in alcohol and dried by evaporation. Two groups of fish
were fed control diet; two groups were fed 500 ug CA/g diet; and four
groups were fed 1,000 ug CA/g diet three times daily. Exogenous
feedings began immediately upon hatching of fish and continued for
12 weeks. Thereafter, fish were fed fish diet without steroid until
the end of the experiment.
The project was terminated in 6 months. Wet weight and total
length were measured for each fish. Sex ratios in each treatment
were determined by three methods: dimorphic coloration; dimorphic
secondary sex characters, especially the dorsal fin configuration
described by Yamamoto (1953) and Kirchen and West (1969); and

23
histological examination.
RESULTS
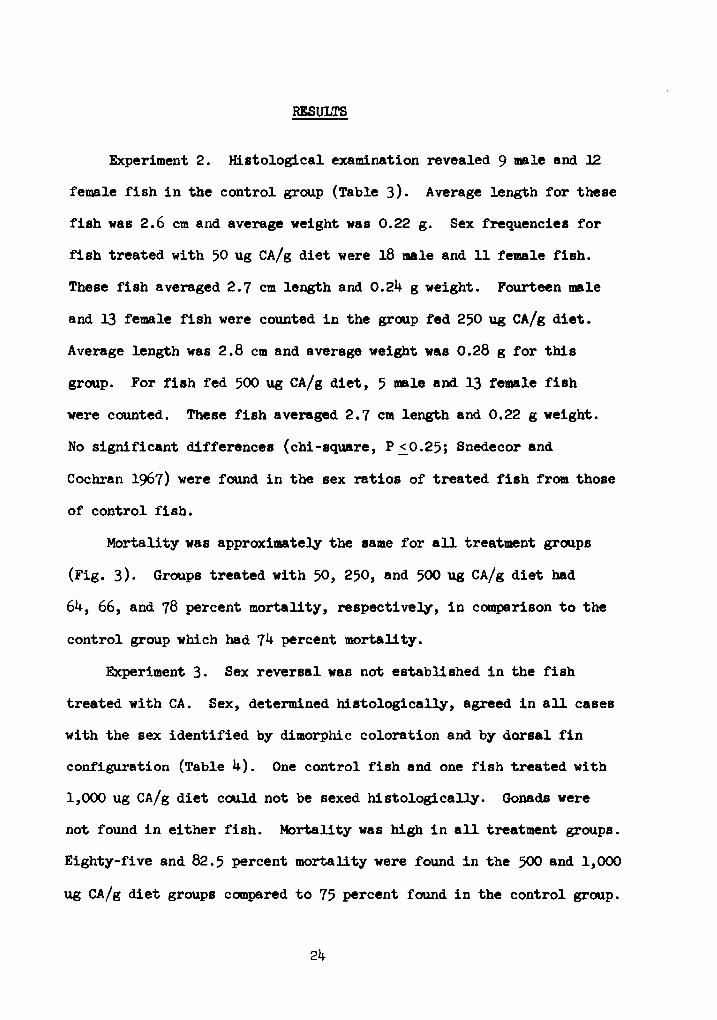
Experiment 2. Histological examination revealed 9 male and 12
female fish in the control group (Table 3). Average length for these
fish was 2.6 cm and average weight was 0.22 g. Sex frequencies for
fish treated with 50 ug CA/g diet were 18 male and ll female fish.
These fish averaged 2.7 cm length and 0.24 g weight. Fourteen male
and 13 female fish were counted in the group fed 250 ug CA/g diet.
Average length was 2.8 cm and average weight was 0.28 g for this
group. For fish fed 500 ug CA/g diet, 5 male and 13 female fish
were counted. These fish averaged 2. 7 cm length and 0. 22 g weight.
No significant differences (chi-square, P ~0.25; Snedecor and
Cochran 1967) were found in the sex ratios of treated fish from those
of control fish.
Mortality was approximately the same for all treatment groups
(Fig. 3). Groups treated with 50, 250, and 500 ug CA/g diet had
64, 66, and 78 percent mortality, respectively, in comparison to the
control group which had 74 percent mortality.
Experiment 3. Sex reversal was not established in the fish
treated with CA. Sex, determined histologically, agreed in all cases
with the sex identified by dimorphic coloration and by dorsal fin
configuration (Table 4). One control fish and one fish treated with
1,000 ug CA/g diet could not be sexed histologically. Gonads were
not found in either fish. Mortality was high in all treatment groups.
Eighty-five and 82.5 percent mortality were found in the 500 and 1,000
ug CA/g diet groups compared to 75 percent found in the control group.
24
25
Table 3. Total length (cm), wet weight (g), and sex, histologicall.y determined, at the end of the experiment, for each fish fed different concentrations of cyproterone acetate (CA)/ diet.
Treatment-Control Treatm.ent-50ug CA/ g Diet
Fish No. L w Sex Fish No. L w Sex
1 3.2 0.31 M 1 2.3 0.17 M 2 2.1 0.11 F 2 2.7 0.23 M 3 2.8 0.22 M 3 2.4 O.l2 F 4 2.7 0.21 F 4 2.7 0.25 F 5 2.0 0.15 F 5 2.0 0.09 F 6 2.1 0.13 F 6 3.2 o.4o F 7 2.5 0.22 F 7 2.5 0.17 M 8 2.6 o.18 M 8 2.1 0.09 M 9 3.2 0.26 M 9 3.2 o.41 M
10 3.3 0.33 M 10 2.9 0.23 M 11 3.1 0.31 F 11 1.8 0.05 F 12 2.4 0.13 F l2 2.9 0.25 M 13 2.0 o.06 F 13 2.9 0.30 M 14 2.5 0.14 M 14 3.2 0.35 F 15 2.8 o.47 F 15 2.9 0.24 F 16 2.6 0.14 M 16 3.1 0.33 M 17 3.3 o.45 F 17 2.9 0.25 M 18 2.5 0.19 F 18 2.8 0.19 M 19 2.8 0.24 M 19 3.5 o.40 M 20 2.6 0.18 F 20 3.1 0.30 F 21 2.2 0.11 M 21 2.8 0.20 M
22 2.8 0.23 M y = 2.6 0.22 23 2.9 0.25 M
24 3.2 0.37 F No. of Males = 9 25 2.8 0.20 M No. of Females = l2 26 1.9 0.06 M
27 2.9 0.25 M 28 3.4 0.51 F g,2 b.2 2.:lJ. F
y = 2.7 0.24 No. of Males = 18 No. of Females = 11

26
Table 3. Total length (cm), wet weight (g), and sex, histologically determined, at the end of the experiment, for each fish fed different concentrations of cyproterone acetate (CA)/ diet (continued).
Treatment-250ag CA/g Diet Treatment-500.g CA/g Diet
Fish No. L w Sex Fish No. L w Sex
1 2.9 0.33 F 1 2.8 0.23 F 2 3.2 o.4o F 2 2.5 0.28 F 3 3.0 0.34 F 3 2.2 0.16 F 4 3.2 o.42 F 4 3.2 0.33 F s 2.8 0.30 M 5 2.7 0.27 F 6 1.9 o.o8 F 6 2.6 o.l.8 M 7 2.7 0.31 M 7 3.2 o.45 F 8 2.5 0.20 F 8 2.5 0.14 F 9 2.2 0.13 F 9 2.4 0.11 F
10 3.2 0.39 F 10 2.1 0.10 F 11 2.9 0.27 M 11 2.0 o.oa ? 12 3.1 0.34 M 12 1.7 0.04 M 13 3.1 0.31 M 13 2.5 0.15 F 14 3.2 0.33 F f 14 3.5 0.37 M 15 3.2 o.49 F 15 2.8 0.22 F 16 3.5 0.37 M 16 2.9 0.27 F 17 3.0 0.30 F 17 2.9 0.27 M 18 2.9 0.28 M 18 2.9 0.32 F 19 2.0 0.09 M !2 ld 0.29 M 20 2.1 0.13 F 21 3.1 0.29 M Y= 2.7 0.22 22 3.2 0.34 M No. of Males = 5 23 3.0 0.27 M No. of Females = 13 24 3.1 0.31 M 25 2.9 0.23 M 26 2.7 0.21 F gi 2.1 2.:.22 M
-Y= 2.8 0.28 No. of Males = 14 No. of Females = 13

27
Fig. 3. Number of live fish in each treatment at the start (S)
and at the finish (F) of Experiment 2.

28
80
70 I.LI 60 > ....I <t 50 a:: 40 I.LI al ~ 30 => z
20
10
s F s F s F s F CONTROL 50 250 500
TREATMENT ( ug CA I g DI ET )
29
Table 4. Sex identified by dimorphic coloration, dorsal fin configuration, and histological examination for Japanese medaka fed different concentrations of cyproterone acetate (CA)/diet.
Fish Sex Sex Sex Treatment Number Color Fins Histology
Control l M M M 2 M ? ? 3 F F F 4 M M M 5 M M M
500 ugCA/gDiet l F F F 2 M M M 3 M M M
l,OOOugCA/gDiet l F F F 2 M M M 3 M M M 4 M M ? 5 F F F 6 M M M 7 M M M

30
Evidence of the effects of CA on sex determination in fish was
definitive. Three male and one female fish were identified in the
control group; two male and one female fish were found in the group
treated with 500 ug CA/g diet; and four male and two female fish were
counted in the group treated with 1,000 ug CA/g diet.

DISCUSSION
It appears, by the results of Experiment 2 and Experiment 3,
that the embryonic sex inductor in fish is not similar to a male sex
hormone. However, very recently, while my experiment was in progress,
Rastogi and Chieffi (1975) showed that CA did not inhibit the
masculinization effects of testosterone proprionate or of 11-keto-
testosterone on secondary sex characters when administered concurrently
to female swordtail fish (Xiphophorus helleri). In support, the
experiment in Part I of this thesis showed that CA was an extremely
weak antiandrogen with respect to inhibiting sex characteristics
induced by endogen~s and exogenous androgen in both male and female
guppies (Poecilia reticulate). It is apparent, with this added
information, that CA does not block the effects of androgens on sex
characters that are known to be androgen dependent in fish. It is,
therefore, assumed that CA would not be effective in blocking a
steroid sex inductor, if present, in the larval fish.
31

PART III
GROwrH, FECUNDITY, AND TOLERANCE DENSITY IN THE FATHEAD
MINNOW (PIMEPHAIES PROMELAS): EFFECTS OF FOOD AND
POPUIATION DENSITY
32

INTRODOCTION
A study designed to determine the impact of different harvesting
intensities on wild bait species has been conducted on Rich Creek,
West Virginia (Brandt and Schreck 1975). Data for 2 years (1973 and
1974) showed these harvesting pressures to have no measurable effect
on the densities of the bait fish populations.
Two variables that influence recruitment to bait fish stocks
are food and population density. These factors could influence
both growth and fecwidi ty of the fish {Bagenal 1971). Generally, a
direct relationship exists between food abwidance and growth rate,
and an inverse relationship is present between population density and
growth rate (Le Cren 1965). However, there may be no relationship
between food abundance and growth when a space-limiting effect is
operating on the population (Johnson 1965). As a partial explanation
for the reduction in reproduction and growth under crowded conditions,
several people have suggested the presence of a water-borne, fish
produced represser factor that inhibits reproduction (Swingle 1953;
Rose and Rose 1965) and reduces growth rate (Rose and Rose 1965;
Yu and Perlmutter 1970; Francis et al. 1974). Pfuderer et al. (1974)
partially purified this substance. However, Glaser and Kantor (1974)
showed that spawning rate in med.aka (Oryzias latipes) can be inhibited
by social factors of crowding, irrespective of chemical conditions
of the water. The present experiment was designed to separate the
variables of population density and nutrition and to test their effects
on growth and fecundity of fish.
33

MATERIAI.S AND METHODS
Experiment 4. Fathead minnow (Pimephales prom.els.a) eggs were
obtained by placing several terrs cotta pots in the shallows of a
pond in Blacksburg, Virginia. Mi.Mows spawned in the pots, and the
eggs were incubated in the laboratory. Resultant fry were fed finely
pestled coa:mercial flake diet (Tetra MinR) ad libitum after hatching.
Three- to four-week-old fish were randomly divided into nine groups.
Each group of fish was placed in a 90-liter aquarium containing aged,
dechlorinated tapwater. Three groups contained 25 fish each, three
groups contained 50 fish each, and three groups contained 100 fish
each. One group of 25 fish was fed ad libitum (all they could eat
in 20 minutes), the second group of 25 fish was fed 66 percent of the
ad libitwn amount and the third group of 25 fish was fed 33 percent
of the ad libitum amount. The same procedure was followed with each
of the other two population densities. Feedings were twice daily.
Food rations were recalculated we~ to compensate for growth and
for any mortality of fish in the aquaria. Calculated food amounts
are tabulated in Appendix I. Fish were maintained on a l.6L:8D
photoperiod at 21:!:,lC. Each aquarium was equipped with incurrent and
excurrent waterflow. A complete water exchange was effected in
approximately 24 h to ensure adequate water quality in the aquaria
but prevent a total depletion of potential pheromones. Population
densities and water chemistries were monitored monthly. Dissolved
oxygen was measured by the azide modification of the Winkler method
and ranged between 7 and 8. 5 ppm in all aquaria during the experiment.
34

35
The pH fluctuated between 7 .1 and 7. 7 as determined on a Corning TM
Model 10 pH meter. Total alkalinity ranged between 36 and 48 mg/ liter. Total ammonia, measured by the Nesslerization method, remained
at less than O. 5 mg/liter.
The research plan called for female fish to be sacrificed when
they appeared gravid and ready for spawning. However, 9 months after
beginning the study, even though the temperature and photoperiod were
optimum to induce maturation and spawning, the fish showed no indica-
tion of having reached this condition. water temperature was then
increased to 25 C. Females still did not appear gravid after an
additional 2 months. This experiment was then terminated. 'l'otal
length and wet weight were measured for each fish. Total number of
eggs were to be counted. However, the ovaries, in many cases, were
not well developed. Dissection of the entire ovary, necessary in
fecundity measurements, was impossible. Fifty eggs were then randomly
sampled from each female fish and measured with an ocular micrometer.
Because these fish from wild parents did not reach maturity by
the end of the experiment, some requirement for successful reproduction
apparently was not being satisfied under laboratory conditions.
Consequently, a second experiment was designed to use a laboratory
stock of fathead minnows with known success in spawning under
laboratory conditions.
Experiment 5. A laboratory stock of fathead minnow fry, 3 to 7
days old, was obtained from. the National water Quality laboratory,
Duluth, Minnesota. Fish were acclimated for one month in five 40-llter
aerated aquaria at 18 C. At the end of this time period mortality

was no longer significant. Finely pestled, freeze-dried brine shrimp
were fed six times daily to all fry during the first 2 weeks of
acclimation. During the last 2 weeks of the acclimation period the
fish were fed frozen brine shrimp nauplii four times daily supplemented
with freeze-dried brine shrimp.
At the end of the acclimation period the fish were randomly
divided among eight 160-liter aquaria containing aged dechlorinated
water. Fifteen fish were placed in each of four aquaria. Forty-five
fish were placed into each of the remaining four aquaria. Two of the
groups of 15 fish and two of the groups of 45 fish were fed twice
daily. The remaining two groups of each population density were fed
six times daily. Feedings were ad libitum (all the fish could eat
in 20 minutes) and consisted of frozen adult brine shrimp. Fish were
maintained on a 16L:8D photoperiod. water temperature was held at
25~1C. An incurrent and excurrent waterflow provided an approximate
24 h water exchange rate to help maintain good water quality but
prevent a total loss of possible pheromones.
By 19 weeks the fish appeared in spawning condition. The males
had the characteristic enlarged black heads with nuptial tubercles
while females appeared robust in girth. Procedures for measurements
and data collection were the same as in Experiment 4. Statistical tests were conducted for each experiment separately.
A two-way factorial analysis of variance with unequal cell sizes
designed for Statistical Analysis System (SAS, Barr and Goodnight 1972)
was used to evaluate differences in lengths, weights, and egg sizes
due to population density, food abundance, and their interaction.

37
In addition, SAS procedures for regression analyses were performed
on the data to determine what relationship egg size had to the
variables length and weight.
RESULTS
Experiment 4. Pooled data ou growth of fish in all three
population densities fed ad libitum were compared to the pooled
data for those fish fed 66 percent of the ad libitum amount. These
data in turn were each compared to the pooled data for fish fed
33 percent of the ad libitum amount. In all cases, fish fed greater
amounts of food were larger and weighed more than thoae fish fed
lesser amounts of food. Mean lengths for fish fed ad libitum,
66 percent, and 33 percent of the ad libitum amount were 59, 53,
and 46 mm, respectively (Table 5), which were significantly different
from each other {P ~ 0.01). Mean weights were significantly different
from each other (P ~ 0.01) and were 2.3, 1.6, and 1.0 g for fish fed
ad libitum, 66 percent, and 33 percent of the ad libitum amount,
respectively {Table 5).
Similar comparisons on pooled growth data for female fish only
and for male fish only were made. Male fish were consistently larger
than female fish in all treatments. Male fathead minnows, in nature,
are generally larger than the female fish of the same age. Average
lengths for female fish fed ad libitum, 66 percent, and 33 percent
ad libitum were 54, 51, and 44 mm, respectively {Table 6), which
were significantly different from each other (P ~0.05); average
weights, 1.6, 1.3, and 0.9 g (Table 6) were found significantly
different (P ~ 0.05). Average lengths for male fish fed ad libitum,
66 percent, and 33 percent ad libitum were 62, 55, and 47 mm, respec-
tively (Table 7), which were significantly different from each other

Table 5. Means for total length (mm) and wet weight (g) of fathead minnows (Pimephales promelas) subjected to different feeding rates and population densities. N = pooled number of all male and female fish in three aquaria corresponding to a particular food abundancy or population density treatment at the end of the experiment. SD = standard deviation.
Experiment 4
Fish Growth Data
Treatment N Length SD Weight SD
Food Abundancy ad libitum 48 59x 7 2.3x 0.9 ~ad libitum 56 53Y 7 i.GI 0.7 33~ ad libitum 36 46Z 8 l.Oz 0.5
Initial Population Density8
53b b 25 45 9 l.6b 0.9 50 42 53b 9 l.7b 0.9
100 53 54b 9 1.6 0.9
a Initial population density = DU.mber of fish in each of three aquaria at the start of the experiment.
x,y,zMeans with different superscripts in the same colllmn (food abundancy treatment) are significantly different from each other at the P ~ 0.01 level.
b Means with the same superscript in the same column (population density treatment) are not significantly different from. each other.
w \0
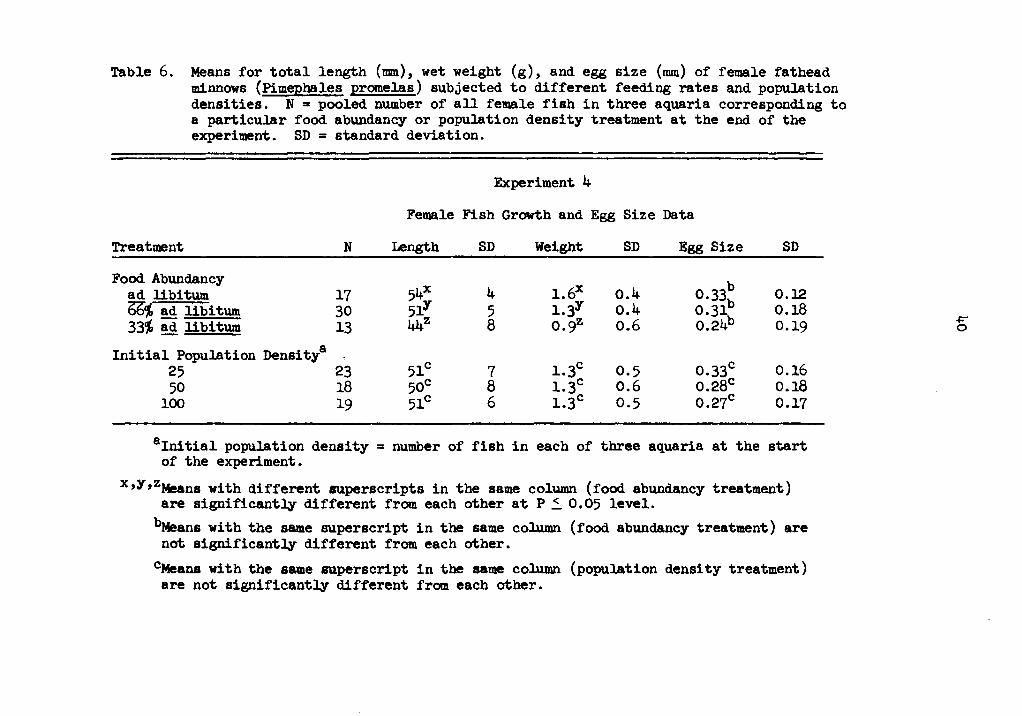
Table 6. Means for total length (mm), wet weight (g), and egg size (mm) of female fathead minnows (Pimephales promelas) subjected to different feeding rates and population densities. N .. pooled number of all female fish in three aquaria corresponding to a particular food abundancy or population density treatment at the end of the experiment. SD = standard deviation.
Experiment 4
Female Fish Growth and Egg Size Data
Treatment N length SD Weight SD Egg Size SD
Food Abundancy 54X l.6x b ad libitum 17 4 0.4 o.33b O.l2
bb;; ad libi tum 30 51Y 5 i.3Y o.4 0.31 0.18 331' ad libitum 13 44z 8 o.9z o.6 0.24b 0.19
Initial Population Densitya 51C l.3c 0.33C 25 23 7 0.5 0.16
50 18 50C 8 l.3c 0.6 0.28c o.18 100 19 51C 6 l.3c 0.5 0.27C 0.17
8 Initial population density = number of fish in each of three aquaria at the start of the experiment.
x,y,zMeans with different superscripts in the same column (food abundancy treatment) are significantly different from each other at P ~ 0.05 level. ~ans with the same superscript in the same column (food abundancy treatment) are not significantly different from each other.
C.Means with the same superscript in the same column (population density treatment) are not significantly different from each other.
-4=" 0

Table 7. Means for total length (mm) and wet weight (g) of male fathead minnows (Pimephales promelas) subjected to different feeding rates and population densities. N = pooled number of all male fish in three aquaria corresponding to a particular food abundancy or population density treatment at the end of the experiment. SD = standard. deviation.
Experiment 4
Male Fish Growth Data
Treatment N Length SD Weight SD
Food Abundancy 62.x 2.6x ad libitum 31 7 0.9
~itum 26 55Y 9 l.8Y o.8 33~ ad libitum 23 47Z 8 l.Oz 0.5
Initial Population Density& 55b l 9b 25 22 ll 1.2
50 24 56b 9 • b
0.9 2.0b 100 34 56b 9 1.9 1.0
alnitial population density = number of fish in each of three aquaria at the start of the experiment.
x,y,zMeans with different superscripts in the same column (food abundancy treatment) are significant~ different from each other at P .::_ 0.01 level.
'bi4eans with the same superscript in the same column (population density treatment) are not significant~ different from each other.
~ I-'

42
(P ~ 0.01); average weights were 2.6, 1.8, and 1.0 g, respectively
(Table 7), and were significantly different from each other (P~0.01).
Pooled data on egg size for female fish fed different food
rations were also compared in like manner as the growth data. Mean
egg sizes, 0.33, 0.31, and 0.24 (Table 6), for female fish fed
ad libitum, 66 percent, and 33 percent ad libitum, respectively, - -were not found to differ statistically (P 2 0.2018).
Three different population density treatments were compared to
test if fish growth and reproduction are related to population size.
Pooled data on growth of fish fed the three different food rations
and raised in the initial population density of 25 fish, were compared
to pooled data for those fish raised in the initial population density
of 50 fish. Each of these data, in turn, were compared to the pooled
data for fish raised in the initial population density of 100 fish.
Population density had little or no effect on the parameters measured.
Average lengths and average weights (Table 5) were not significantly
different (P ~ 0.9678, 0.9083, respectively) for fish raised in the
three population densities.
Similar comparisons on pooled growth data for female fish only
and for male fish only were made. Female fish showed no significant
differences (P ~ 0.6212, o.6l34) in their lengths and their weights,
respectively, with different population densities (Table 6). Correspondingly, no significant differences were found for lengths
and weights (P ~ 0.9495, 0.7706, respectively} of male fish raised
in different population densities (Table 7).

43
Pooled data on egg size from female fish stocked at different
initial population densities were also compared. A different trend
in egg size with different population densities was evident. Female
fish produced eggs with average diameters of 0.33, 0.28, 0.27 when
raised in the initial population densities of 25, 50, and 100, respec-
tively (Table 6). However, these differences were not found to be
statistically different (P ~ 0.1933). No interaction effect, due
to nutrition and population density, was found for any of the factors
tested.
High mortality in all experimental groups early in the study may
be an explanation for finding no differences in growth of the fish
raised under different initial population densities. Population
levels under all experimental conditions became nearly equal during
the first month of the study. Numbers of fish decreased from 100,
50, and 25 to numbers between 10 and 25 fish (Fig. 4) by the end of
the study. Few fish were found dead, and it was the smaller fish
that were discovered missing from each aquarium. I suspect cannibalism
for the reduction in fish numbers.
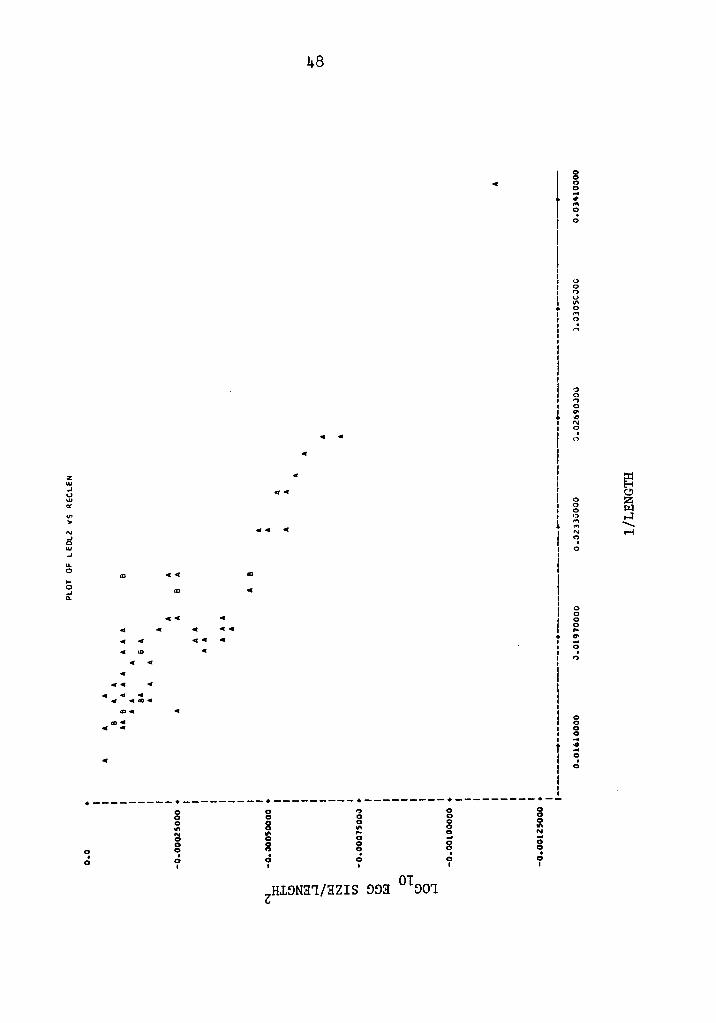
Regression analyses of egg size on lengths and egg size on weight
of female fish were performed and a low ~ (0.36091, 0.37441,
respectively) was reported for both variables. Regression ana.ly'ses
were then performed on transformed data. length and weight were found
to be exponentially related to egg size. Weight was related to egg
size (R2 = 0.99551) by the model:
b1rl-egg size = b010
44
Fig. 4. Numbers of fish (Experiment 4) in the initial population
densities (plain bar}; after the first month (hatched
bar); and at the end of the experiment (black bar) for
each experimental group. Numbers below bars indicate
food ration given each experimental group. AL = ad libitum;
66 = 66 percent of ad libitum amount; 33 = 33 percent of
ad libitwn amount.

100
90
80
70 :I: ~ 60 LL LL 0 50 a:: LLJ
~ 40 :::> z
30
20
10
AL 66 33 LOW DENSITY
45
AL 66 33 MEDIUM DENSITY
AL 66 33 HIGH DENSITY
EXPERIMENT 4 GROUPS

46
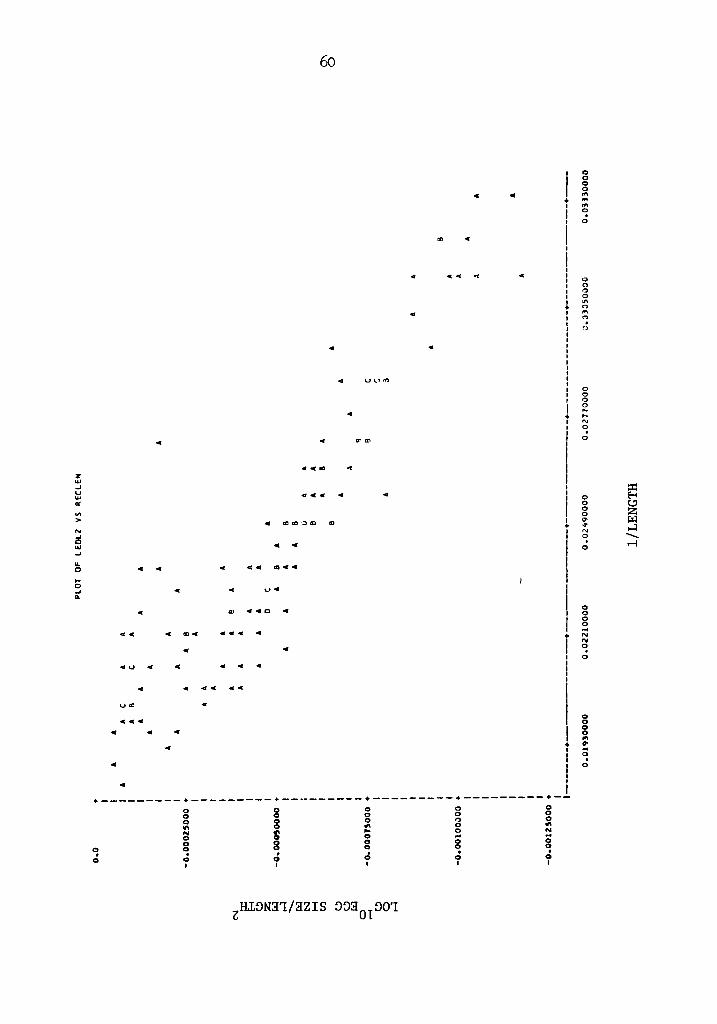
where b0 = 0.10686 and b1 = 0.19357. Length was related to egg
size (R2 = o.82224) by the model:
egg size = 10L(bo+b1L)
where b0 = -0.05946 and b1 = 0.00092. Figs. 5 and 6 illustrate the
linear relationship of the transformed data of egg size on length
and on weight, respectively.
Experiment 5. Pooled data on growth of fish in the two popula-
tion densities fed twice daily were compared to fish fed six times
a day. Growth was consistent~ greater for fish fed six tiaes daily
than for fish fed twice daily. Average lengths for fish fed twice
and six times daily were 41 and 46 mm, respectively (Table 8), and
were significantly different from each other (P ~ 0.0003). Mean
weights were 0.8 and 1.1 g for fish fed twice and six times daily,
respectively (Table 8), and were statistically different from each
other (P ~ 0.0003).
Similarly, pooled data on growt)l for male fish only and for
female fish only were compared. Male fish were consistently larger
than female fish. In nature, male fathead minnows are generally
larger than female fish of the same age. Average lengths for female
fish fed twice and six times a day were 4o and 44 um, respectively
(Table 9), and were found significantly different from each other
(P < 0.01). Mean weights, 0.6 and 0.9 g (Table 9) for female fish
given different food rations were significantly different from each
other (P < 0.01). Male fish fed twice and six times daily exhibited
mean lengths of 43 and 50 mm, respectively (Table 10), and were found

47
Fig. 5. Plot of transformed data of Experiment 4; log10 2 egg size/length on l/length. A = one observation,
B = two observations.
z w _, u w
"' .,, ,. "' _, 0 w _, ... 0 .... 0 _, ...
"' c ...
"' cc .. ..
... ... c "' c ... c
cc c c ... ...
c c co ... co ... ...
<aC c .. c
... .....
cc c
co
c
... c .. c cc c
c
48
c
l I I I I
l I I I • I I
i I
I I I 1 I I I I I
I I I I i I I
i I I I I
I • I I I I I
I
I I I
l I I I ·---------·---------·---------·---------·---------+-! g g g g g
s:: 8 ~ 8 ~ ~ g ~ ~ ;
~ ~ ~ ~ l I I I I I
8 ., 0 ... #
"' 0 . 0
0 0 ., 0
"' 0
"' 0 . n
~ 0
"' 0 .,. .., "' 0 . "
0 () 0 ·~ .., .., "' () . 0
0 0 0 0 ... .,. 0 . .,
0 0 0 0
! 0 . 0
~ C!l z r:i::I ..... -..-1

49
Fig. 6. Plot of transformed data of Experiment 4; log10 2 2 egg size/weight on !/weight . A = one observation,
B = two observations, C = three observations,
D = four observations, H = eight observations,
T = twenty observations.

"' ... • u w "' "' >
"' JI 0 w ... ... 0 .. 0 ... Q.
cc
0 .. .. c :cu ':: ..
0
50
c I I l I I I
I I
I I I
l I I I I I I I I I I I I I
1 I I
I I I
I I
l I I I I r
I I • I
I I I ·---------·---------·---------·----------·---------·--
8 8 0 ~ 8 ,, g I " 0 i 0 <> g 0 0 0
0 8 8 0 0 0 0 0 0 . . 0 . . .
0 "' "' 0 "' I ... ... N N I I I I
zlHDI3~/3ZIS DD3 OTD01
§ 0 0 0
"' .. . .., "'
0 ,, ,, 0 0 .., "' .. . .. ...
0 0 n 0 0 0
"' .. . ..,
0 0 0 .., 0 0
"' .. . ..
0 0 0 0 0 0
"' .. . ...
0 0 0 g 0
"' N . ... I
N E-1 (5 H
~ -..-i
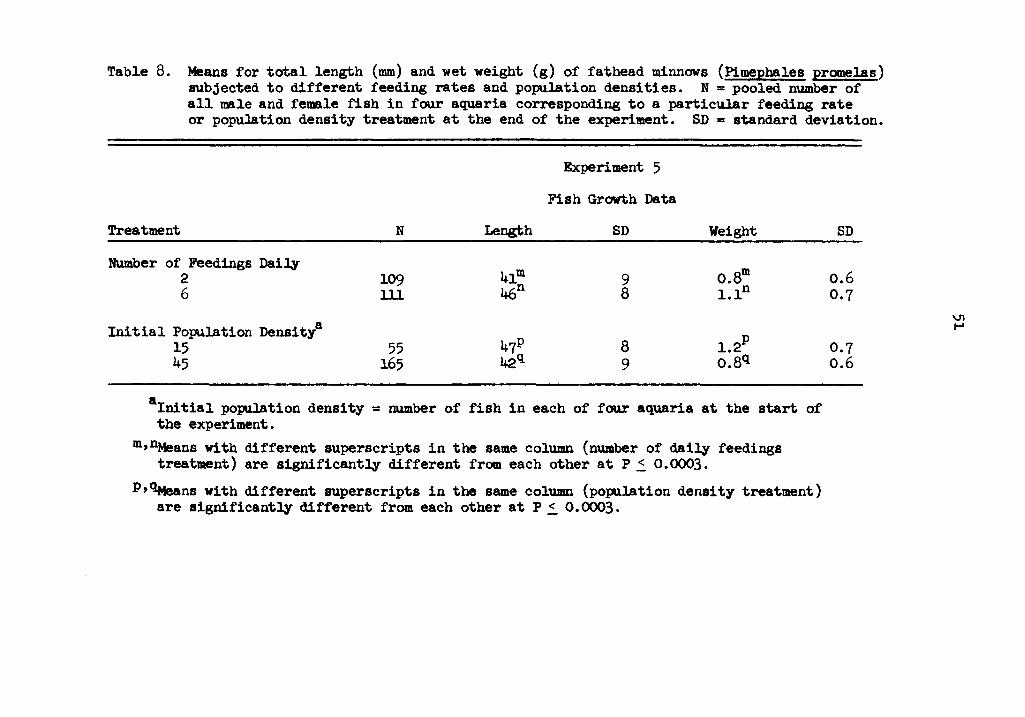
Table 8. Means for total length (mm) and wet weight (g) of fathead minnows (Pimephales prom.elas) subjected to different feeding rates and population densities. N = pooled number of all male and female fish in four aquaria corresponding to a particular feeding rate or population density treatment at the end of the experiment. SD = standard deviation.
Treatment
Number of Feedings Dai~ 2 6
Initial Population Densitya 15 45
N
109 ill
55 165
Length
4lm 46n
47P 42q
Experiment 5
Fish Growth Data
SD
9 8
8 9
Weight
0.8m l.ln
l.2p o.8q
&Initial pop.ll.ation density = number of fish in each of four aquaria at the start of the experiment.
m,D.r-teans with different superscripts in the same column (number of dai~ feedings treatment) are significant~ different from each other at P 2_ 0.0003.
p,~ns with different superscripts in the same column (population density treatment) are significant~ different from each other at P ~ 0.0003.
SD
o.6 0.7
0.7 o.6
\J1 I-'

Table 9. Means for total length (mm), wet weight {g), and egg size (mm) of female fathead minnows {Pimepbales promelas) subjected to different feeding rates and popul.ation densities. N = pooled number of all female fish in four aquaria corresponding to a particul.ar feeding rate or population density treatment at the end of the experiment. SD = standard deviation.
Treatment N
Number of Feedings Daily 2 52 6 69
Initial Popul.ation Densitya 15 31 45 90
Experiment 5
Female Fish Growth and Egg Size Data
Length
~ 44n
43r 41S
SD
6 5
5 6
Weight SD
o.6m 0.3 o.9° 0.3
o.9w 0.4 o.7x 0.3
Egg Size SD
b 0.16 o.19b 0.25 0.20
0.28~ 0.21 0.21 0.17
ainitial population density = number of fish in each of four aquaria at the start of the experiment.
m,11Means with different superscripts in the same column {number of daily feedings treatment) are significantly different from each other at P < O.Ol.
r,8Means with different superscripts in the same column (population density treatment) are significantly different from each other at P < 0.05.
x,:x,.ans with different superscripts in the same colllJnn (population density treatment) are significantly different from each other at P < O.Ol.
'bi4eans with the same superscript in the same collllnn (number of daily feedings treatment) are not significantly different from each other.
V1 I\)

Table 10. Means for total length (mm) and wet weight (g) of male fathead minnows (Pimepbales promelas) subjected to different feeding rates and popul.ation densities. N = pooled number of all male fish in four aquaria corresponding to a particular feeding rate or population density treatment at the end of the experiment. SD = standard deviation.
Experiment 5
Male Fish Growth Data
Treatment N Length SD Weight
Nwnber of Feedings Daily 43m 2 57 ll o.~
6 42 5on 10 l.4n 8 Initial Population Density
51W l.6w 15 24 9 45 75 44x ll i.cr
alnitial population density = number of fish in each of four aquaria at the start of the experiment.
SD
0.7 1.0
0.9 o.8
m,11Means with different superscripts in the same col\1.IDll (number of daily feedings treatment) are significantly different from each other at P < 0.003.
w,xMeans with different superscripts in the same column (population density treatment) are significantly different from each other at P < O. 003.
\J1 w
54
significantly different from each other (P ~ 0.003). Average
weights were 0.9 and 1.4 g (Table 10) and were significantly different
from. each other (P < 0.003) for male fish fed twice and six times
a day, respectively.
Pooled data on egg size for female fish given different food
allowances were also analyzed in a similar manner as the growth data.
Mean egg diameters were 0.19 and 0.25 111111 for female fish fed twice
and six times daily (Table 9) and were not statistically different
from each other (P < 0.2376).
Similar comparisons on growth for fish raised with different
population numbers were made. Pooled data on growth of fish fed
twice and six times daily and raised in the initial population density
of 15 fish were compared to pooled data for fish raised in the initial
population density of 45 fish. Statistical results concerning effects
of population density on growth were different from those found in
Experiment 4. An inverse relationship is indicated between growth
and population density. Length and weight were consistently greater
for fish raised with 15 fish than for those raised with 45 fish.
Average lengths for fish raised in initial population density of 15
fish and 45 fish were 47 and 42 11111, respectively (Table 8), and were
significantly different from each other (P ~ 0.0003). Mean weights of
1.2 and 0.8 g were significantly different from each other (P ~0.0003)
for fish raised with 15 fish and ~5 fish, respectively (Table 8).
Similarly, pooled data on growth, each for female fish and for
male fish raised in different initial population densities, were

55
compared. Mean lengths for female fish reared in densities of 15
and 45 fish were 43 and 41 mm, respectively (Table 9), and were
statistically different from each other (P < 0.05); average weights
were 0.9 and 0.7 g (Table 9) and were significantly different from
each other (P < 0.01). Male fish raised with 15 and 45 fish exhibited
mean lengths of 51 and 44 mm, respectively (Table 10), and were
statistically different from each other (P < 0.003). Average weights
for males reared with 15 and 45 fish were 1.6 and 1.0 g, respectively
(Table 10), and were statistically different from each other
(P < 0.003).
Pooled data on egg size were also compared for female fish raised
in the two initial popul.ation densities. An inverse relationship of
egg size to population density is revealed by the data. Egg diameters
averaged 0.28 and 0.21 for female fish raised with 15 and 45 fish,
respectively (Table 9), and were found statistically different from
each other (P < 0.05). No interaction effect, due to nutrition and
population density, was found for any of the factors tested.
I believe differences between Bxperiment 4 and Experiment 5 with
respect to effects of popul.ation density on growth and egg size were
due to different mortality rates found in the two experiments. Unlike
the high mortality found in Experiment 4, few fish died in Experiment
5 (Fig. 7); differential densities were maintained throughout the
experiment.
Regressions of egg size on length and egg size on weight of
female fish were performed and a low R2 (0.36939 and 0.49033, respec-
ti vel,y) was found for both analyses. The data were then transformed

Fig. 7. Numbers of fish (Experiment 5) in the initial population
density of each experimental group are indicated by the
height of the bar; black bars show number of fish at
end of the study. Numbers under bars indicate number
of feedings per day.

57
:c 50 en Li: LL.
40 0 0::: 30 w CD ~ 20 :::::> z
10
6 2 2 6 6 2 2 6
LOW DENSITY HIGH DENSITY
EXPERIMENT 5 GROUPS

and regression analyses were repeated. Length and weight were found
to be exponential.ly related to egg size. Weight was related to egg
size (R2 = 0.98555) by model:
egg size = b01ob1w2
where b0 = 0.09809 and b1 = 0.33347. length was related to egg size
{R2 = 0.82835) by model:
egg size = ioL{bo+b1L)
where b0 = -0.07161 and b1 = 0.00125. Figs. 8 and 9 show the linear
relationship of the transformed data of egg size on length and egg
size on weight, respectively.

59
Fig. 8. Plot of transformed data of Experiment 5; log10 egg size/length2 on l/length. A = one observation,
B = two observations, C = three observations,
D = four observations.
r w ..J u w
"' VI > N ..J 0 w ..J ... 0 ... 0 ..J Q.
..
.... .. ..
.. .. ..., .. ..
.... .. ., .. .. .... .. .. ..., .. .. .. .. .. u., ...... .. .. .. .. .. ..
6o
.. ., ..
.... ..
.. 4 Ul.>l'f1
cc cc ..,.
.. I • I I I I I
I I
I I I I I I I
i I I l I I I I I I I I I I I I I
I + I
I I I
I I I •
r I
I I
I • I I I I I ·---------·---------·---------·---------·---------·--
0 8 0 0 0 0 0 0 0 0 8 0 0 0
"' "' 0 "' N ~ ... 0 N
0 0 8 -0 8 0 0 0 0 0 ~ . . 0 0 . 0 0 0 0
I I I I I
ZH.1DN31/3ZIS DD3 01 D01
0 0 0 0
"' "' "' 0 . 0
0
" 0 0
"' 0
"' " . r)
0 0 0 0 .... .. "' 0 . 0
0 0 0 0
"' ~ N 0
0
0 0 0 0 ... N N 0
0
0 0 0 0
"' .,. -0 . 0

Fig. 9. Plot of transformed data of Experiment 5. log10 egg size/weight2 on l/weigbt2 . A= one observation,
B = two observations, C = three observations,
D = four observations, E = five observations,
F = six observations, G = seven observations,
H = eight observations, K = eleven observations,
M = thirteen observations, 0 = fi~een observations.

"' ... .. u w
"' "' >
"' ll 0 w ..J ... 0
... 0 ..J ~
62
.. ..
.....
... :r ... CD%
l I I I ! I
l I I I I I I I T I I I I
l I I I • I
I I I I •
i I I I I ·---------·---------·---------·---------·---------·--
8 0 0 0 .. 0 0 .. Cl
0 i 0 0 § .. 0 0 g .. 0 .. 0 .. 8 8 g .. g
0 .. . . .. . . 0 0 • ~ • ~ I i N "' I I I
zlHDI3M/3ZIS DD3 01 D01
g 0 a 0 0
"' ... . "' "'
·~ ·~ 0 0 0 0 .,.. ... . "'
0 .., 0 0
"' n .,.. ... ..;
" 0 0 0 0 0
"' ... . "'
0 0 0 0 ., 0
"' ... . "'
0 0 0 0 0 0
"' N . -I
N £-< ::c: (.!) H µ:i ~ -r-1

DISCUSSION
Genetic composition of the experimental fish, water temperature,
population density, and nutrition are variables which may have affected
growth and maturation rates between wild and laboratory fish stocks
employed in the two experiments. Genetic differences between native
pond fish used in Experiment 4 and laboratory reared minnows ·used in
Experiment 5 may have partially been responsible for growth rate
differences found in the two experiments because laboratory fish are
selected for rapid growth and early maturity under laboratory condi-
tions. Different diets used in Experiment 4 and Experiment 5 may
have also been responsible for different growth rates between the
experiments. Exogenous factors such as photoperiod and temperature
influence reproductive cycles (De Vlaming 1972). Photoperiods were
identical in both experiments, however, a difference in water
temperatures of 5 C existed between Experiment 4 and Experiment 5
(20 and 25 c, respectively). Fathead minnows spawn within the range
18-30 C (Dobie et al. 1956; Flickinger 1971). The experimental
conditions were well within this range. However, fish raised at
20 C water grew slower and failed to reach spawning condition by
the end of one year, whereas, fish raised at 25 C water grew faster
and appeared ready to spawn after 4 months. Alm ( 1953) and Le Cren
(1965) found fish with a higher growth rate mature earlier than
slower growing fish. Moreover, Le Cren (1965) stated that matllrity
is a function of size rather than age of fish. r.tY" data showed egg
size was closely related to growth (i.e., length and weight) of the

64
fish. Most larger fish had actively developed eggs (i.e., eggs of
various sizes), whereas smaller fish had small undeveloped eggs.
Female fish with the larger eggs in both experiments were approximately
the same length and weight. An optimum size is apparently necessary
to stimulate the onset of maturation in fathead minnows. Although
larger females bad a greater propensity to have developing eggs,
average egg size was comparatively smaller for the faster growing
female fish (Experiment 5) than for the slower growing females
(Experiment 4). Faster growing fish seemed to utilize available
energy for growth, whereas, slower growing fish were also able to
channel energy into egg production.
In addition to the different growth rates observed. between fish
in both experiments, I found growth to be directly related to food
ration. Even though a statistical significance was not found, I
believe a direct relationship of egg size with food ration also
exists. Obviously, nutrition is required for energy supply for growth
and gamete development. Also, my data appeared to indicate that
increased population density in Experiment 5 may have limited growth
and perhaps gamete development regardless of food abundance.
Factors establishing the final densities in the aquaria appeared
to be operating. Water volume (i.e., space) may be an ultimate limit-
ing factor for the optimum number of fish which can be supported within
a contained area. Increased food increased the average weight per
fish but not the number of fish which was supported by a particular
volume of water in Experiment 4 and perhaps Experiment 5 (Figs. 4, 7

and Tables 5, 6, 7, 8, 9, 10). All treatments in Experiment 4
stabilized at nearly the same population density, which was an average
of 0.17 (!:. 0.016 S.E.) fish/liter. This tolerance density {Dasmann
1964) of the aquaria was established al.most completely during the
first month of the study {Fig. 4). There was only very slight
mortality evident in the fish stocked at low density in Experiment 5
(Fig. 7) where the mean number of fish/liter was 0.09 (;t 0.005 s.E.). There was slight mortality of the fish stocked at the higher density,
the average tolerance density appearing to be 0.26 (;t 0.008 S.E.)
fish/liter. This value may be somewhat of an underestimation of the
actual tolerance density for this laboratory stock, because mortality
was limited; i.e., the upper limits of tolerance density may not have
been reached. Nevertheless, one would not expect any mortality of the
fish stocked at the lower density. Such mortality was not seen,
therefore, supporting my findings. Although the tolerance densities
established within the two experiments were slightly different
(t' -test, P = 0.01; Snedecor and Cochran 1967), they still are in
extremely close agreement, considering the vastly different genetic
histories of the stocks, the physical conditions, and feeds.
I was interested in comparing the tolerance densities of the
fish populations in this study with the suggested rearing densities
for fathead minnows under intensive fish culture conditions in ponds.
Data presented by Dobie et al. (1956) and Flickinger (1971) were used
to develop the following argument. The optimum stocking density of
fathead minnow fry into ponds is 100,000-300,000 fish/0.4 ha (1 acre),
with the maximum suggested for commercial farming being 600,000 fish/

66
o.4 ha. The average depth of' a pond for rearing these fish was
91. 4 cm ( 3 ft) . If 600, 000 fey were stocked. into a O. 4 ha pond,
91.4 cm deep, then the density of fish would be 0.16 fish/liter.
This density derived from fish farming ponds is in remarkably close
agreement with the tolerance density of 0.17 fish/liter established
in the small, 100-liter laboratoey tanks.

REFERENCES CITED --Alm, G. 1953. Maturity, mortality, and growth of perch (~
fluviatilis L.) grown in ponds. Rep. Inst. Freshwater Res. Drottningholm 35:11-20.
Bagenal, T. B. 1971. Eggs and early life history. Part I. Fecundity. Pages 166-179 in W. E. Ricker (ed.) Methods for assessment of fish production in fresh waters. 2nd ed. IBP Handbook No. 3, Blackwell Scientific Publications, Oxford, England. 348pp.
Barr, A. J., and J. H. Goodnight. 1972. Statistical analysis system. North Carolina State University Press, Raleigh. 58pp.
Bloch, G. J., and J. M. Davidson. 1967. Antiandrogen implanted in brain stimulates male reproductive system. Science 155(3762):593-595.
Brandt, T. M., and C. B. Schreck. 1975. Effects of harvesting aquatic bait species from a small West Virginia stream. Trans. Am. Fish. Soc. 104(3):446-453.
Breder, c. M., and c. W. Coates. 1935. Sex recognition in the guppy (Lebistes reticulatus Peters). Zoologies, N. Y. 19(5) :187-207.
Chieffi, G., L. Iela, and R. K. Rastogi. 1974. Effect of cyproterone, cyproterone acetate and ICI46,474 on gonadal sex differentiation in Rana esculenta. Gen. Comp. Endocrinol. 22:532-535.
Clark, E., and L. R. Aronson. 1951. (Lebistes reticulatus Peters).
Sexual behavior in the guppy Zoologica, N. Y. 36(4):49-65.
Dasmann, R. F. 1964. Wildlife biology. John Wiley and Sons, Inc. N. Y. 23lpp.
De Vlaming, V. L. tive cycles:
1972. Environmental control of teleost reproduc-a brief review. J. Fish. Biol. 4:131-140.
Dobie, J., o. L. Meehean, S. F. Snieszko, and G. N. Washburn. 1956. Raising bait fishes. U. S. Fish Wildl. Serv. Circ. 35, 123pp.
E18er, W. , and F. Neumann. 1966. The role of androgens in differentiation of the mammary gland in male mouse fetuses. Proc. Soc. Exp. Biol. 123:637-642.
68
Elger, w., H. Steinbeck, and F. Neumann. 1967. The influence of an antiandrogen (cyproterone acetate) on the sexual differentia-tion of rabbit fetuses. Acta Endocrinol. Congr. 6th, Abstr. 42. Acta Endocrinol., Suppl. 119:58.
Flickinger, s. A. 1971. Pond culture of bait fishes. Colorado State Univ., Coop. Ext. Serv. Bull. 478A. 39PP·
Francis, A. A., F. Smith, and P. Pf'uderer. 1974. A heart-rate bioassay for crowding factors in goldfish. Prog. Fish Cult. 36(4) :196-200.
Glaser, M. J., and R. A. Kantor. 1974. Effects of crowding on the spawning rate of the medaka (Oryzias latipes}. Northeast. Fish and Wildl. Conf. McAfee, N. J. 17pp. Typescript.
Hoar, W. S. 1962. Reproductive behavior of fish. Gen. Comp. Endocrinol., Suppl. 1:2o6-216.
• 1969. Reproduction. Pages 1-72 in W. s. Hoar ___ a_n_d_D-.-J-.-Randall (eds. ) Fish physiology. Vol-. 3. Academic
Press, N. Y.
Johnson, W. E. 1965, On mechanisms of self-regulation of population abundance in (Oncorh.ynchus nerka). Mitt. int. Verein. theor. angew. Limnol. 13:66-87. --
Kirchen, R. v., and W. R. West. 1969. The Japanese Medaka. It's care and development. Carolina Biological Supply Company. Burlington, N. c. 36pp.
Le Cren, E. D. 1965. Some factors regulating the size of populations of freshwater fish. Mitt. int. Verein. theor. angew. Limnol. 13:88-105.
Liley, N. R. 1966. Ethological isolating mechanisms in four sympatric species of poeciliid fishes. Behaviour Suppl. 13:1-195.
. 1968. The endocrine control of reproductive -------behavior in the female guppy (Poecilia reticulate Peters). Anim. Behav. 16:318-331.
------- and W. Wlshlow. 1974. The interaction of endocrine and experiential factors in the regulation of sexual behaviour in the female guppy (Poecilia reticulate). Behaviour 48:185-214.
Neumann, F. 196§. Auftreten von .Kastrationzellen im ~oph;ysenvorderlappen mannlicher Ratten nach behandlung mit einem Antiandrogen. Acta Endocrinol. 53(1):53-60.

Neumann, F., and W. Elger. 1965. Physiological and psychical intersexuality of male rats by early treatment with an anti-androgenic agent (1,2 a-methylene-6-chloro-tib-bydroxyproges-terone-acetate). Acta Endocrinol. Suppl. 100(142):174.
------- and 1966a. Permanent changes in gonadal :t'unction and sexual behavior as a result of early feminization of male rats by treatment with an antiandrogenic steroid. Endokrinologie 50:209-225.
and • 1966b The effect of the ----a-n-ti_a_n_dr_o-gen l,2a-metbylene-6-chloro-ti4,6_pregnadiene-l7a-
ol-3,20-dione-l7a-acetate (cyproterone acetate) on the development of the mammary glands of male foetal rats. J. Endocrinol. 36:347-352.
--------, , and M. Kramer. 1966a. Develop-ment of a vagina in male rats by inhibiting androgen receptors with an antiandrogen. Endocrinology 78:628-632.
, , H. Steinbeck, and R. von Berswordt----W&-llr ___ a_b_e-.- 1967a. Antiandrogene. Symp. Deut. Ges. Edndokrinol.
13th. Pages 78-101.
, , and R. von Berswordt-Wallrabe. ____ ..,..,.. __ _ 1966b. The structure of the mammary glands and lactogenesis in feminized male rats. J. Endocrinol. 36:353-356.
-------, , and 1967b. Review. Intersexuality of male fetuses and inhibition of androgenic :t'unctions in adult animals with a testosterone blocker. Ger. Med. Monthly XII(4):l.82-l88.
-------, J. D. Hahn, and M. Kramer. l967c. Hemmung von testosteronabh11ngigen DifferenzierungsvorgUngen der mtlnnlichen Ratte nach der Geburt. Acta Endocrinol. 54(2):227-240.
, H. Steinbeck, W. Elger, and R. von Berswordt---------W&llrabe. 1968. Hoden-Morphologie und-Funktion unter der Einwirkung von PM:> \ind Jl:G bei gleichzeitiger Antiandrogen-Behandlung. Acta Endocrinol. 57 (4) :639-648.
-------- and R. von Berswordt-Wallrabe. l966a. Effects of the androgen antagonist cyproterone acetate on the testicular structure, spermatogenesis and accessory sexual glands of testosterone-treated adu1t hypophysectiomized rats. J. Endocrinol. 35(4):363-371.

70
Neumann, F., and R. von Berswordt-Wallrabe. 1966b. Abolishing effect of an androgen-antagonist on steroid-induced inhibition of ovulation in rats. Proc. Fifth World Congr. Fertility and Sterility. Excerpts Medics Internatl. Congr. Ser. 133:129-133.
Pandey, S. 1969a. Effects of methyl testosterone on the testis and secondary sex characteristics of the hypophysectiomized adult guppy (Poecilia reticulata Peters). Can. J. Zool. 47:783-786.
-------• 1969b. Effects of hypoph;ysectoU1¥ on the testis and secondary sex characters of the adult guppy (Poecilia reticulata Peters). Can. J. Zool. 47:775-781.
1970. Effects of methallibure on the testes and secondary sex characters of the adult and juvenile guppy (Poecilia reticulata Peters). Biol. Reprod. 2:239-244.
------- and J. F. Leather land. 1970. Comparison of the effects of methallibure and thiourea on the testis, t~oid, and adenohypophysis of the adult and juvenile guppy (Poecilia reticulata Peters). Can. J. Zool. 48:445-450.
Pfuderer, P., P. Williams, and A. A. Francis. 1974. Partial purification of the crowding factor from (Carassius auratus) and (Cyprinus carpio). J. Exp. Zool. 187:375-382.
Pickford, G. E., and J. W. Atz. pituitary gland of fishes. 6l3pp.
1957. The physiology of the N. Y. Zoological Society, N. Y.
Rastogi, R. K., and G. Chieffi. 1975. The effects of antiandrogens and antiestrogens in nonmalllDBlian vertebrates. Gen. Comp. Endocrinol. 26:79-91.
Rose, S. M., and c. F. Rose. 1965. The control of growth and reproduction in freshwater organisms by specific products. Mitt. int. Verein. theor. angew. Limnol. 13:21-35.
Schreck, c. B. 1973. Uptake of 3H-testosterone and influence of an antiandrogen in tissues of rainbow trout (Salmo gairdneri). Gen. Comp. Endocrinol. 21:60-68.
------- (ed.) 1974. Control of sex in fishes. Sea Grant Ext. Div., Virginia Polytechnic Institute and State Univ., Blacksburg. VPI-SG-74-01. lo6pp.
Snedecor, G. w., and W. G. Cochran. 1967. The Iowa State University Press, Ames.
Statistical methods. 593PP·

71
Steinbeck, H., W. E~er, and F. Neumann. 1967. Sexual activity of male rats under the influence of oestradiol and antiandrogens and recurrence of libido after cessation of treatment. Acta Endocrinol., Suppl. 119:63.
Sundararaj, B. I., ands. K. Nayyar. 1969. Effects of estrogen, SU-9055, and cyproterone acetate on the bypersecretory activity in the seminal vesicles of the castrate catfish, Heteropneustes fossilis (Bloch). J. Exp. Zool. 172:399-408.
Swingle, H. s. 1953. A repressive factor controlling reproduction in fishes. Proc. 8th Pacific Sci. Congr., IIIA:865-871.
Whalen, R. E., and D. H. Edwards. 1969. Effects of the antiandrogen cyproterone acetate on mating behavior and seminal vesicle tissue in male rats. Endocrinology 84(1):155-156.
, W. G. Iuttage, and R. Green. 1969. Effects of the ___ a_n_t~i--a-n-dr--ogen cyproterone acetate on the uptake of l,2-3H-testos-
terone in neural and peripheral tissues of the castrate male rat. Endocrinology 84(2):217-222.
Yamameto, T. 1953. Artificially induced sex-reversal in genotypic males of the med.aka (Oryzias latipes). J. Exp. Zool. 123:571-594.
• 1955. Progeny of artificially induced sex-reversals ---of-ma-le-g-enotype (XY) in the med.aka (Or;yzias latipes} with
special reference to YY-males. Genetics 40:406-419.
. 1958. Artificial induction of functional sex-___ r_e_v_e-rs_a_l_in genotypic females of the medal:a (()ryzias l.atipes).
J. Exp. Zool. 137(2):227-263.
• 1959&. The effects of estrone dosage levels upon ___ t_h_e_p_e_r_c_e-ntage of sex-reversals in genetic male (XY) of the
medaka (Oryzias latipes). J. Exp. Zool. 141:133-153.
. 1959b. A further study on induction of functional ___ s_e_x--r-e_v_e_r_sal in genotypic males of the med.aka (Qryzias latipes)
and progenies of sex-reversals. Genetics 44:739-757.
-------· 1961. Progenies of sex-reversal females mated with sex-reversal males in the med.aka (Qryzias latipes}. J. Exp. Zool. 146(2):163-179·
1962. Hormonic factors affecting gonadal sex differentiation in fish. Gen. and Comp. Endocrinol. Suppl. 1:341-345.
72
Yamamoto, T. 1963. Induction of reversal in sex differentiation of Y'! zygotes in the medaka (Qryzias l.atipes). Genetics 48: 293-306.
• 1964a. ---r(Qryz--ia-s-latipes).
Linkage map of sex chromosome in the medaka Genetics 50:59-64.
------· 1964b. The problem of viability of Y'! zygotes in the medaka (Qryzias l.atipes). Genetics 50:45-58.
• 1965. Estriol-induced XY females of the med.aka ______ i_a_s-1.atipes) and their progenies. Gen. Comp. Endocrinol.
:527-533.
1968. Effects of 17 a-hydro:xyprogesterone and androstenedione upon sex differentiation in the med.aka (Oryzias latipes). Gen. Comp. Endocrinol. 10(1):8-13.
------- and T. KaJishime. 1968. Sex hormone induction of sex reversal in the goldfish and evidence for male heterogamity. J. Exp. Zool. 168(2):215-221.
-------and N. Matsuda. 1963. Effects of estradiol, stilbestrol and some alkylcarbonyl androstanes upon sex differentiation in the med.aka (Qryzias latipes). Gen. Comp. Endocrinol. 3:101-110.
Yu, M., and A. Perlmu.tter. l<J70. Growth inhibiting factors in the zebrafish (Brach,ydanio rerio) and the blue gourami (Trichogaster trichopterus). Growth 34:153-175.

APPENDIX
73

74
Append.ix Table I. Weekly food calculations.
Treatment Food Amounts (GM)
Food Ration/ 8/26-Initial 8/11- 8/18- 9/1- 9/8- 9/15- 9/22-
Pop. Density 8/17 8/25 8/31 9/7 9/14 9/21 9/29
AL8~25 0.0029 0.0029 0.0039 o.oo49 0.0114 O.Oll4 0.0230 33'fo /25 0.0007 0.0007 0.0013 0.0016 0.0035 0.0035 0.0073 66'foc/100 0.0057 0.0057 0.0105 0.0131 0.0099 0.0099 0.0200 33'fo/50 0.0014 0.0014 0.0026 0.0033 0.0052 0.0052 0.0105 AL/100 O.Oll5 O.Oll5 0.0157 0.0198 0.0255 0.0255 0.0513 66%/50 0.0029 0.0029 0.0052 o.oo66 o.oo67 o.oo61 0.0135 661o/25 0.0014 0.0014 0.0026 0.0033 o.oo63 o.0063 0.0129 33'fo/100 0.0029 0.0029 0.0052 o.oo66 0.0033 0.0033 o.oo67 AL/50 0.0057 0.0057 0.0079 0.0099 0.0145 0.0145 0.0292
9/30-lOL2.
10/6-lOLl2
10/13-lOL12
10/20-lOL26
10/27-uL2
ll/3-uL2
ll/10-uL16
AL/25 0.0375 0.0685 0.0922 O.lllO O.l220 o.1806 0.2250 33'fo/25 O.Oll8 0.0215 0.0226 0.0272 0.0300 o.o444 0.0552 66",,/100 0.032~ 0.0592 0.0803 0.0968 0.1064 0.1576 0.1968 3Jfo/50 0.0171 0.03ll 0.0339 0.0409 0.0450 0.0667 0.0552 AL/100 o.o834 0.1522 0.1562 0.1881 o.2o67 o.3o61 0.2616 66%/50 o.~o o.o4o1 o.o607 0.0731 o.o805 0.1192 O.ll74 66'fo/25 0.0209 0.0381 0.0515 0.0620 o.o682 0.1010 0.1329 33'/o/100 0.0110 0.0200 0.0190 0.0229 0.0252 0.0374 0.0509 AL/50 o.olf75 o.o868 o.o827 0.0996 0.1096 0.1622 0.1910
11/17- ll/24- l2/l- l2/8- l2/15- l2/21- 1/5-11L2J 11L30 l2L'l l2L14 l2L21 1L4 1L11
AL/25 0.2373 0.2373 o.25o4 0.2686 0.2863 0.2863 0.2913 3'3'fo/25 0.0583 0.0583 0.0615 o.o660 0.0700 0.0700 o.07u 66'fo/100 0.2076 0.2076 0.2191 0.2350 0.2286 0.2286 0.2326 33'fo/50 0.0583 0.0583 o.o615 o.o66o o.o642 o.0642 o.o654 AL/100 0.2759 0.2759 0.2912 0.3123 0.2863 0.2863 0.2913 66'fo/50 O.l238 0.1238 0.1307 0.1402 0.1493 0.1493 0.1519 66'fo/25 0.1402 0.1~ 0.1480 0.1587 0.1682 0.1682 0.1711 33'fo/l00 0.0537 0.0537 0.0567 o.06o8 0.0548 0.0548 0.0558 AL/50 0.2014 0.2014 0.2126 0.2280 0.2262 0.2262 0.2301

75
Appendix Table I. Wee.kly food calculations (continued).
Treatment Food Amounts (GM)
Food Ration/ 1/11- 1/19- 1/26- 2/1-Initial 2/8-
Pop. Density 1/18 1/25 2/1 2/7 2/13
AL/25 0.2913 0.3090 0.2880 0.2880 0.2880 33'fo/25 0.0711 0.0755 0.0703 0.0703 0.0703 661o/100 0.2326 0.2794 0.26o4 0.26o4 o.26o4 3'3'fo/50 o.~54 o.<>642 0.0599 0.0599 0.0599 AL/100 0.2913 0.3090 0.288o o.288o 0.2736 66'fo/50 0.1519 0.1611 0.1502 0.1502 0.1502 66'fo/25 0.1711 0.1815 0.1692 0.1692 0.1692 33'1>/100 0.0558 0.0540 0.0540 0.0540 0.0540 AL/50 0.2301 0.2441 0.2275 0.2275 0.2275
2/14-3/14
3/15-3/22
3/23-3/29
3/30-4/13
4/14-5/Ll.4
AL/25 0.2880 0.2933 0.2933 o.34o5 0.3405 33'1>/25 0.0703 0.0716 0.0716 o.o832 0.0832 66'fo/100 0.26o4 0.2652 0.2652 0.3079 0.3079 33%/50 0.0599 o.o610 o.o610 o.07o8 o.07o8 AL/100 0.2736 0.2700 0.2700 0.3235 0.3235 66'1>/50 0.1502 0.1529 0.1529 0.1775 0.1775 66'fo/25 0.1692 0.1723 0.1723 0.2000 0.2000 33%/100 0.0540 0.0513 0.0513 0.0596 0.0596 AL/50 0.2275 0.2205 0.2205 0.2690 0.2690
a AL = ad libitum.
b 33% = 33 percent of the ad libitum amount.
c 6&/o = 66 percent of the ad libitum amount.

The vita has been removed from the scanned document

VARIOUS ASPECTS OF REPRODUCTIVE CONTROL IN FRESHWATER FISHES
by
Helen T. Smith
(ABSTRACT)
Male and female guppies (Poecilia reticul.ata) were treated
with either methyl testosterone, cyproterone acetate {CA) (an antiandro-
gen) or a combination of the two steroids to determine effects on
behavior, coloration, and gametogenesis. The antiandrogen did not
fully block the effects of endogenous or exogenous textosterone
in enhancing male sexual behavior and coloration in males or females.
An inverse relationship existed between the numbers of cysts in the
early stages of spermatogenesis and the number of spermatophores
for males receiving any of the steroids. Only one female in the
testosterone and ccmbined steroid treatments had embryos present
in its ovaries.
CA was administered orally to juvenile Japanese med.aka (Oryzias
l.atipes) in two experiments to determine the possible role of the
antiandrogen on sex determination. Sex ratios were determined in
the mature fish by dimorphic coloration, secondary sex characters,
and histological examination. Sex reversal was not established
in the fish.
The effects of population density and nutrition on growth and
fecundity of fathead minnows (Pimephales promel.as) were studied.
Length and weight of the fish increased with increased food avail.ability.

Perhaps a direct relationship of egg size with food ration also
existed. Egg size was found exponentially related to growth of
fish. Increased population density appeared to limit growth and
perhaps gamete development regardless of food abundance. Additionally,
water volume appears to limit the number (tolerance density) of fish
which can be supported within a specific area. Increased food
increased weight per fish but not number of fish in a particular
volume of water.