master’s thesis 2020 60 ects
TRANSCRIPT

Master’s Thesis 2020 60 ECTS
Faculty of Environmental Sciences and Natural Resource Management
(MINA)
Effects of gut microbiota
composition on vitellogenin
expression in honeybees
Elisa Cervetti Ecology

I

II
Abstract
The relationship between animals and their gut microbiota is one of the most important
symbiotic relationships in nature. The western honeybee, Apis mellifera, has received particular
attention in microbiota research because of both its utility as a model organism and its economic
importance. Honeybees have a specific gut microbiota which consists of few core members and
contributes to the normal metabolism, immunity, behavior and endocrine signaling of the host.
Among other genes, the honeybee microbiota affects the expression of vitellogenin, a
multifunctional lipid-carrier protein that affects aging, immunity and behavior. The link
between vitellogenin and the microbiota and the overlap between their functions suggest that
vitellogenin could be the mediator of the microbiota effects on bee physiology.
In this thesis, we explored how microbiota composition affects vitellogenin expression in
honeybees, both locally and systemically. To do so, we used quantitative real-time PCR to study
vitellogenin expression in the gut and fat body of honeybees experimentally inoculated with
different members of the normal gut microbiota.
Our results support the hypothesis that the various members of the microbiota contribute
differently to the regulation of vitellogenin expression. We found that the gram-negative
members of the honeybee microbiota, Snodograssella alvi and Gilliamella apicola, might be
responsible for a systemic suppression of vitellogenin expression. We also found the gram-
positive members of the microbiota to stimulate vitellogenin expression in the gut tissue, but
we believe this might be an artifact of the experimental design. Nonetheless, the low efficiency
of vitellogenin amplification and our inability to verify the presence and composition of the
experimental microbiota in our bees reduce the quality of our data and prevent us from drawing
any definitive conclusions.

III
Table of contents
ABSTRACT ............................................................................................................................. II
LIST OF FIGURES ................................................................................................................ V
LIST OF TABLES .................................................................................................................. V
ABBREVIATIONS ................................................................................................................ VI
1 INTRODUCTION ............................................................................................................ 1
1.1 THE HONEYBEE GUT MICROBIOTA ............................................................................... 2
1.2 VITELLOGENIN ............................................................................................................ 7
1.3 QPCR .......................................................................................................................... 8
1.4 AIM OF THIS THESIS ................................................................................................... 10
2 MATERIALS AND METHODS................................................................................... 11
2.1 EXPERIMENTAL PROCEDURES .................................................................................... 11
2.1.1 Experimental design ............................................................................................. 11
2.1.2 Preliminary bacteria survival tests ...................................................................... 14
2.1.3 Gut and fat body collection .................................................................................. 14
2.2 SAMPLE ANALYSIS .................................................................................................... 15
2.3 DATA ANALYSIS ........................................................................................................ 16
2.3.1 Statistical analysis ................................................................................................ 16
2.3.2 Fold change estimate ........................................................................................... 17
3 RESULTS ........................................................................................................................ 19
3.1 PRELIMINARY BACTERIA SURVIVAL TESTS ................................................................ 19
3.2 MAIN RESULTS .......................................................................................................... 19
3.2.1 Fat body ................................................................................................................ 20
3.2.2 Gut ........................................................................................................................ 22
4 DISCUSSION ................................................................................................................. 24
4.1 DATASET LIMITATIONS .............................................................................................. 25
5 CONCLUSION ............................................................................................................... 27
REFERENCES ....................................................................................................................... 28

IV
APPENDIX 1 .......................................................................................................................... 36
APPENDIX 2 .......................................................................................................................... 38

V
List of figures
Figure 1 – Typical composition and spatial distribution of the bacterial gut microbiota of
honeybees ................................................................................................................................... 4
Figure 2 – Example of cages and feeders used in this experiment .......................................... 11
Figure 3 – Overview of the diet administered to honeybees each day of the experiment ....... 12
Figure 4 – Bacterial growth in the presence of autoclaved royal jelly ..................................... 19
Figure 5 – Vitellogenin expression in the fat body of bees with different gut bacterial
communities ............................................................................................................................. 21
Figure 6 – Change in vitellogenin expression in the fat body of bees with different gut bacterial
communities, relative to the SC group ..................................................................................... 21
Figure 7 – Vitellogenin expression in the gut of bees with different gut bacterial communities
.................................................................................................................................................. 22
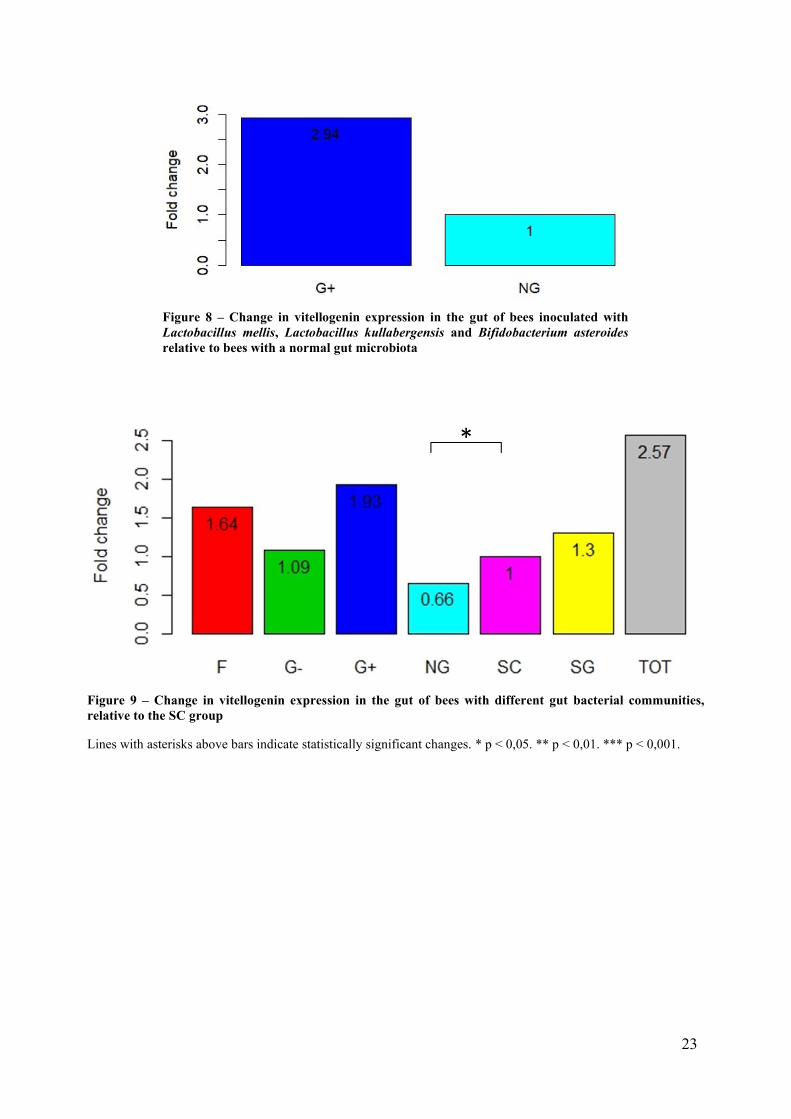
Figure 8 – Change in vitellogenin expression in the gut of bees inoculated with Lactobacillus
mellis, Lactobacillus kullabergensis and Bifidobacterium asteroides relative to bees with a
normal gut microbiota .............................................................................................................. 23
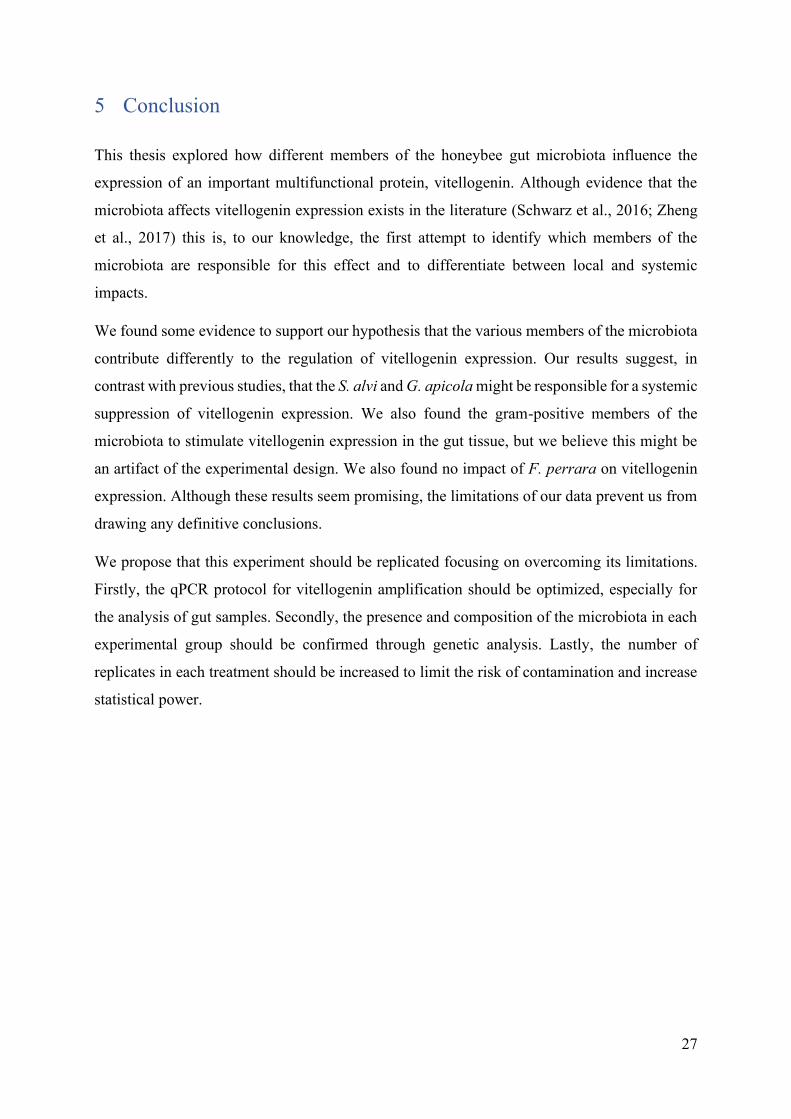
Figure 9 – Change in vitellogenin expression in the gut of bees with different gut bacterial
communities, relative to the SC group ..................................................................................... 23
List of tables
Table 1 – Details of the bacteria used in this thesis ................................................................. 13
Table 2 – Details of primers used for qPCR in this experiment .............................................. 16
Table 3 – Number of samples from each treatment and cage included in the analysis ........... 20

VI
Abbreviations
Act Actin
bp Base pair
cDNA Complementary DeoxyriboNucleic Acid
Ct Threshold cycle
DNA DeoxyriboNucleic Acid
F Treatment with lab-cultured F. perrara
G+ Treatment with lab-cultured B. asteroides, L. mellis and L. kullabergensis
G- Treatment with lab-cultured G. apicola and S. alvi
mRNA Messenger RiboNucleic Acid
MRS De Man, Rogosa and Sharpe agar
NG Treatment with homogenized gut of hive bees
PBS Phosphate-buffered saline
PCR Polymerase Chain Reaction
qPCR Quantitative real-time Polymerase Chain Reaction
RNA RiboNucleic Acid
SC Treatment with no bacteria source
SG Treatment with homogenized gut of sterile bees
Ta Annealing temperature
TOT Treatment with all the lab-cultured bacteria strains
TSA Tryptic soy agar
Vg Vitellogenin

1
1 Introduction
The relationship between animals and the complex community of microorganisms living in
their digestive tract, i.e. their gut microbiota, is arguably amongst the most important symbiotic
relationships in nature. Bacterial gut symbionts have been observed in many phylogenetically
distant animals including nematodes (Clark & Hodgkin, 2016; Dirksen et al., 2016; Jiang &
Wang, 2018), mollusks (Dudek et al., 2014), echinoderms (Hakim et al., 2019; Pagan-Jimenez
et al., 2019), annelids (Murakami et al., 2015; Siddall et al., 2011), crustaceans (Li et al., 2018;
Nougue et al., 2015), insects (Engel & Moran, 2013), tunicates (Dishaw et al., 2014), and
several vertebrate groups, including fish (Clements et al., 2014; Givens et al., 2015), birds
(Waite & Taylor, 2015) and mammals, most notably humans (Ley et al., 2008). While
interaction stability and effects on the host vary greatly in different species and contexts
(Douglas, 2014; Hammer et al., 2019), the host and its microbiota often form a mutualistic
relationship. The animal’s gut provides a stable, nutrient-rich, and relatively competition-free
ecological niche for the bacteria, which in return benefit the animal. Bacteria can do this by
performing novel functions, such as aiding metabolism or defense against pathogens, or, when
the interaction is stable enough to act as an evolutionary pressure, by modulating host’s traits
(Douglas, 2014). Some of these interactions can be so intimate as to become obligated when
the bacteria are unable to survive outside of the host’s gut and the host depends on the
microbiota to develop and maintain the normal phenotype and health. Because of their ubiquity
and great impact on both human and animal health, over the past few decades, an increasing
effort has been devoted to studying host-microbiota interactions in various species. One species
that has received particular attention in this field, because of both its utility as a model organism
and its inherent importance, is the western honeybee (Apis mellifera).
Honeybees possess several characteristics that make them suitable as a model organism for gut
microbiota research. Firstly, it is both easy and inexpensive to obtain a great number of
individuals for research. Beehives last for years, are mostly self-sustaining once established,
and contain 30000-80000 adult workers each, with the queen laying 1000-2000 eggs per day
under favorable conditions (Bodenheimer, 1937). Secondly, the anatomy and biology of
honeybees are both well understood. In fact, honeybees have long been used in research,
particularly as model organisms to study behavior, developmental plasticity, and aging (Zheng
et al., 2018). This is also due to research on invertebrates being subject to fewer ethical concerns
and more relaxed regulations compared to other animals. Lastly, the honeybee gut microbiota,

2
which will be described in detail later, is well characterized and presents several parallels with
the microbiota of mammals, particularly humans, while being simpler in composition and easier
to manipulate for research. For example, in both humans and bees, the microbiota is acquired
through social interactions, the bacteria occupy similar positions and ecological niches within
the gut (Kwong & Moran, 2016), and disturbances of the microbiota have been shown to
contribute to similar health problems (see Wang et al. (2018) for examples). For these reasons,
research on the honeybee gut microbiota is feasible and can lead to useful insights that could
be applied to other organisms.
Nonetheless, the factors influencing honeybee health are worth studying even when they do not
apply to other organisms. Firstly, honeybees are among the insects most important to
humankind. Since the Neolithic, humans have used bees to produce honey and beeswax (Roffet-
Salque et al., 2015). To this day, honey arguably remains the best-known use of this insect, with
a growing global market estimated to be worth over 8 billion dollars in 2018 (Grand View
Research, 2019). Nonetheless, the most important human use of honeybees is in agriculture as
a provider of pollination services. Depending on the region, bee pollination is estimated to be
worth from 30 to 100 times the value of honey and wax production (Bradbear, 2009). In North
America alone, honeybees pollinate over 100 commercially grown crops and the contribution
of this service to the economy is estimated to be as high as $19 billion annually (National
Research Council, 2007). Secondly, honeybee populations have been declining over the past
few decades. This has been in line with the decline experienced by almost half of the insect
species worldwide (Sanchez-Bayo & Wyckhuys, 2019), but concerns for honeybees
specifically have increased after the rise in 2006 of colony collapse disorder, a syndrome
characterized by the sudden loss of worker bees from the hives and whose causes remain largely
unclear (VanEngelsdorp et al., 2009). The vulnerability of this species and its economic
importance offer compelling reasons to explore the drivers of honeybee health.
1.1 The honeybee gut microbiota
The gut microbiota changes dramatically through the development of honeybees. When the egg
hatches, the larval gut is mostly devoid of bacteria (Martinson et al., 2012). The little bacteria
that has been observed at this stage, appears to be transient rather than a stable community
(Kwong & Moran, 2016; Zheng et al., 2018). At the end of the larval stage, nurse bees seal the
cell containing the larva with a wax cap so that pupation can begin. At the beginning and end
of the metamorphosis, the exoskeleton is shed, in a process called ecdysis. This process also
removes the gut lining, effectively eliminating any bacteria that might have been present at the
3
larval stage (Zheng et al., 2018). If pupae are removed from their cells and raised under sterile
conditions, they will emerge as microbiota-free adults and never acquire the characteristic gut
biota. Under normal conditions, once the metamorphosis is completed, the adult bee emerges
from its cell by chewing through the wax cap. While some bacteria may be acquired during the
process (Schwarz et al., 2016), the newly emerged worker remains largely bacteria-free
(Martinson et al., 2012). In the following days, as the bee interacts with other individuals and
with the hive surfaces, the number of bacteria in the gut increases. Around 5 days after
emergence, before it ever leaves the hive, the young bee has acquired all the characteristic
members of the adult microbiota, which it will maintain over the rest of its life, and the number
of bacteria in the gut stabilizes at 108-109 bacterial cells (Powell et al., 2014).
The gut microbiota of adult worker honeybees is remarkably consistent and made up of few
bacterial taxa, all of which can be cultured in the lab and used to inoculate microbiota-free bees
(Kwong & Moran, 2016). Each taxon corresponds to a species or a cluster of closely related
species and, similarly to the members of the human microbiota (Schloissnig et al., 2013), often
include genetically diverse strains even within individual bees (Engel et al., 2012; Moran et al.,
2012). The most abundant taxa, which are present in virtually all honeybees, are two clusters
of gram-positive species, Lactobacillus Firm-4 and Lactobacillus Firm-5, and the two gram-
negative bacteria Snodgrassella alvi and Gilliamella apicola. The gram-positive
Bifidobacterium asteroides and other bacteria of the same genus are also ubiquitous, although
less abundant. In addition, Frischella perrara, Bartonella apis, Parasaccharibacter apium, and
a cluster referred to as Alpha2.1 are also commonly present in lower numbers. The relative
abundance of each taxon can vary through a worker’s life and between workers, even between
individuals of similar age from the same hive (Moran et al., 2012). Nonetheless, these nine taxa
account for over 95% of the gut microbiota of individual honeybees worldwide (Martinson et
al., 2012)(figure 1a).

4
This bacterial community has a characteristic, unequal distribution in the honeybee gut (figure
1b). The most anterior part of the gut is the crop, an organ used to store nectar, which contains
very little bacteria despite the availability of nutrients (Martinson et al., 2012) and mostly
species that inhabit nectar and hive materials (Kwong & Moran, 2016). The crop is followed
by the midgut, the main site of digestion and absorption. The constant shedding of the midgut
lining makes this compartment unsuitable for bacteria, which are present in very low numbers
Figure 1 – Typical composition and spatial distribution of the bacterial gut microbiota of honeybees
a – Average composition of the gut microbiota of and adult worker honeybee. b – Spatial distribution of bacteria
in the compartments of the honeybee gut. Figure from Kwong and Moran (2016)

5
(Martinson et al., 2012). Almost all the microbiota resides in the most posterior part of the gut,
the hindgut. The ileum, the first section of the hindgut, is a small, tubular organ with deep
longitudinal folds that absorbs nutrient not assimilated in the midgut. The bacterial community
in the ileum is dominated by the gram-negative S. alvi and G. apicola, which form a stratified
biofilm on the gut wall, while Lactobacillus species are less abundant and can be found in the
lumen (Martinson et al., 2012). The small region connecting the ileum to the midgut, the
pylorus, presents the same bacterial community, but its epithelium is also specifically colonized
by F. perrara, which is most abundant here (Engel et al., 2015). The most posterior part of the
hindgut, where waste is retained until defecation, is the rectum. The bacterial community hosted
in the lumen of this region accounts for most of the microbiota and is dominated by the gram-
positive Lactobacillus and Bifidobacterium species (Kwong & Moran, 2016; Martinson et al.,
2012).The bacterial microbiota is well adapted to thrive in the bee hindgut, as suggested by its
genetic and metabolic characteristics. Although it lacks certain core metabolic functions
(Bonilla-Rosso & Engel, 2018), the microbiota possesses an unusually high number of genes
for the metabolism of carbohydrates, an adaptation to the carbohydrate-rich diet of bees, mostly
consisting of pollen and nectar (Engel et al., 2012). Furthermore, since most of the readily
available nutrients are absorbed in the midgut, the bacteria must rely on substrates that the host
is not able to utilize. In fact, different members of the microbiota can metabolize a great variety
of such substrates, especially recalcitrant pollen-derived compounds, as shown by both
metagenomic and metabolomics studies (Kesnerova et al., 2017; Zheng et al., 2016). The host
potentially benefits from this microbial activity because the breakdown products are more
readily available as nutrients and have antimicrobial properties (Kesnerova et al., 2017).
Evidence also shows that different members of the microbiota engage in cross-feeding
interactions through complementary metabolic pathways (Kesnerova et al., 2017), suggesting
that the different bacterial species have coevolved to occupy specialized niches within the gut
community. Coevolution between honeybees and their microbiota is also suggested by the fact
that native bacteria strains colonize the bee gut more effectively than non-native strains and
supported by the comparison of host and microbe phylogenies (Zheng et al., 2018). In addition
to potentially aiding host metabolism, evidence suggests that the microbiota also affects
honeybee immunity. Bees whose microbiota is altered display increased mortality associated
with higher susceptibility to several parasites and pathogens (Maes et al., 2016; Raymann et al.,
2017; Schwarz et al., 2016). The microbiota could strengthen the host’s immunity by producing
antimicrobial substances. This is supported by the fact that some members of the microbiota
can inhibit the growth of pathogenic microorganisms in vitro (Forsgren et al., 2010; Killer et

6
al., 2014). But the microbiota also plays a role in regulating the host’s own immune response.
When compared to bees with the normal microbiota, bees lacking gut microbes or treated with
antibiotics show significant downregulation of genes coding for crucial components of the
honeybee innate immune response normally released upon infection (Kwong et al., 2017; Li et
al., 2017). The fact that Kwong et al. (2017) observed this regulation effect in the hemolymph
indicates that the microbiota stimulates the honeybee immune response at a systemic level,
rather than locally in the gut. They also observed that inoculation with S. alvi alone induces the
normal upregulation in the expression of one but interestingly not all families of antimicrobial
peptides, suggesting that different members of the microbiota contribute differently to the
regulation of the host’s immunity.
The idea that different bacteria affect host immunity differently is also supported by the unique
response elicited by F. perrara. This bacterium causes a localized activation of several parts of
the host immune system and is the only member of the microbiota to induce melanization of
the area of the gut epithelium it colonizes (Emery et al., 2017). Melanization is a part of the bee
innate immune response typically observed upon pathogen infection and tissue damage. It
remains unclear whether this strong immune reaction indicates a pathogenic effect of F. perrara
or whether the host befits from the immune activation, for example through enhanced resistance
to subsequent encounters with pathogens (Emery et al., 2017).
The microbiota also has a broader effect on honeybee gene expression and endocrine signaling,
which are connected to behavior. Kesnerova et al. (2017) found that B. asteroides stimulates
the production of host-derived prostaglandins and juvenile hormone derivatives involved in bee
development, including the shift from nurse bee to forager bee. Another study by Zheng et al.
(2017) found that the bees lacking the normal gut microbiota had reduced expression of several
genes involved in the insulin/insulin-like signaling pathway. This shift inhibited the response
to sugar in microbiota-free bees and consequently caused them to have lower body and gut
weights compared to bees with the normal gut bacteria (Zheng et al., 2017). One gene along the
insulin/insulin-like signaling pathway that contributed to the effects found by the authors codes
for a protein called vitellogenin, which was found to be downregulated in the abdomen of bees
without a microbiota. Intriguingly, vitellogenin has the potential to be involved in several other
changes induced by the microbiota.

7
1.2 Vitellogenin
Vitellogenin is an ancient lipid-carrier protein. It is present in most egg-laying animals, where
it provides lipids necessary for egg-yolk formation (Havukainen et al., 2013). In insects it is
mainly produced in the fat body, an organ lining the abdomen wall and functionally
homologous to the vertebrate liver and adipose tissue, and then secreted into the hemolymph
(Amdam et al., 2012; Tufail & Takeda, 2008). In social insects, including honeybees,
vitellogenin also serves several functions other than yolk formation.
Firstly, in honeybees vitellogenin regulates aging and inflammation. Bee castes characterized
by a longer lifespan also have higher levels of vitellogenin in their hemolymph (Salmela &
Sundström, 2017). This is true both in queens, which typically live 1-3 years, and in winter
workers, which have a lifespan of 6-8 months, in contrast to summer workers, whose lifespan
is usually 3-8 weeks (Corona et al., 2007; Fluri et al., 1977). The anti-aging effect of
vitellogenin is probably related to its anti-inflammatory properties. One way in which this
protein reduces inflammation is by acting as an antioxidant, as vitellogenin has been shown to
neutralize free radicals both in vivo and in cell culture (Salmela & Sundström, 2017).
Furthermore, vitellogenin has been shown to identify and bind to dead and damaged cells, a
behavior typical of anti-inflammatory blood proteins in mammals and that could reduce
inflammation by promoting cell clearance (Havukainen et al., 2013). These antioxidant and
anti-inflammatory actions are believed to be the basic mechanism through which vitellogenin
delays senescence and extends longevity.
Secondly, vitellogenin has a role in immunity. Immunological functions of vitellogenin are
possibly as ancient as its role in egg formation and are observed in many distant animal groups
(Du et al., 2017). Fish vitellogenin has many antibacterial, antiviral, and antifungal effects, most
of which are probably shared by insect vitellogenin (Salmela & Sundström, 2017). A study by
Salmela et al. (2015) showed that honeybee vitellogenin recognizes and binds to pathogen-
associated molecular patterns on the bacterial surface, which probably shields against infection
by facilitating the phagocytosis of the pathogen. Thanks to its role in egg yolk formation,
vitellogenin is then able to carry these pathogenic pattern molecules to the eggs in the queen
ovaries, allowing the transfer of immunological information to the offspring even without
antibodies, which insects lack (Salmela et al., 2015). Vitellogenin also contributes to immunity
by interacting directly with the immune cells. In particular, in honeybees vitellogenin is the
main carrier of zinc, which is necessary for immune cells to maintain their function (Amdam et
al., 2004b).

8
Finally, vitellogenin is involved in regulating behavior, in particular food-related worker
behavior. As previously mentioned, vitellogenin interacts with the insulin/insulin-like signaling
pathway to regulate nutritional status and determine the normal sugar response (Zheng et al.,
2017). But vitellogenin also determines the shift from nursing to foraging behavior in workers.
Young nurse bees have high levels of vitellogenin which suddenly drop immediately preceding
the onset of foraging (Salmela & Sundström, 2017). Experimentally silencing the vitellogenin
gene anticipates foraging onset, demonstrating that vitellogenin level determines the timing of
the behavioral shift (Nelson et al., 2007). Interestingly, the change in worker task is also
determined by a rise in juvenile hormone which inhibits vitellogenin expression (Amdam et al.,
2012), and accompanied by a rearrangement of the gut microbial community (Miller et al.,
2019).
There is a significant overlap between the functions of vitellogenin and the effect of the gut
microbiota in honeybees. As mentioned, both vitellogenin and the microbiota affect food-
related behavior, such as sugar response and foraging, immunity, and potentially caste-related
behavior, although the role of the microbiota in this last area remains under-explored.
Furthermore, the microbiota has been shown to cause changes in vitellogenin expression
(Zheng et al., 2017). These facts suggest that the effects of the microbiota on bee physiology
could be mediated by an effect on vitellogenin expression.
1.3 qPCR
Real-time quantitative polymerase chain reaction (qPCR) is a powerful technique for the
quantification of nucleic acids. To do so, it combines the principle of qualitative polymerase
chain reaction (PCR) and fluorometry.
PCR is a technique for the amplification of a specific DNA sequence, first proposed in 1985
(Saiki et al., 1985). It uses a cyclical reaction in the presence of the template DNA sequence, a
heat-resistant DNA-polymerase, DNA primers specific to the sequence of interest, and
nucleotide triphosphates. A PCR cycle consists of three temperature steps: first, the temperature
is raised to denature the DNA double-helix, separating the two DNA strands; then, the
temperature is lowered to allow the primers to bind to the template DNA; finally, the
temperature is raised to the optimal temperature for the polymerase to copy the template by
adding new nucleotides to the primers. This cycle is repeated several times, with the number of
copies of the sequence of interest increasing exponentially with each cycle. This method allows
to detect and study even small amounts of DNA and has found several applications in research,
9
medical sciences, and forensics. Furthermore, the technique can easily be extended to study
RNA by adding a preliminary step, during which the sample of interest is reverse-transcribed
into its complementary DNA sequence (cDNA). Nonetheless, there are limitations to traditional
PCR. For instance, the efficiency of the reaction decreases as reagents become scarcer after
repeated cycles, meaning that the amount of PCR product is essentially independent of the
initial number of template copies and quantification virtually impossible.
This limitation was overcome in 1992 with the development of qPCR (Higuchi et al., 1992). In
qPCR the target is amplified and detected at the same time by using a fluorescent detector. The
detector can be non-specific fluorescent dyes, activated by binding to any double-stranded
DNA, or sequence-specific fluorescent probes, activated by binding specifically to the target
DNA sequence (Ståhlberg et al., 2005). The fluorescence increases as the PCR product
accumulates and can be measured through a fluorometer in real time. Before the availability of
reagents become limiting, the fluorescence is proportional to the initial number of target
sequences, the number of PCR cycles, and the efficiency of the amplification reaction. The
reaction efficiency varies between 1 when there is no amplification and 2 when every target
molecule is successfully copied, and depends exclusively on the reagents and temperature used.
Therefore, differences in the initial amount of DNA will be reflected in the number of PCR
cycles necessary for fluorescence to reach a threshold level, with higher initial amounts giving
lower threshold cycle (Ct) values. Thanks to its accuracy, sensitivity, and reproducibility, this
technique is now one of the most common methods for the quantification of nucleic acids.
A field in which qPCR has found one of its widest application is gene expression analysis. In
this context, reverse transcription is used in combination with qPCR to quantify the mRNA of
the gene of interest present in a sample. Although it is possible to determine the absolute number
of copies present at the beginning of the qPCR reaction by relating the Ct value to a standard
curve (absolute quantification), it is normally not necessary. Most commonly, the expression
level of a gene is determined in comparison with a reference sample (relative quantification),
such as an untreated control. Usually, the expression of a second gene expected to have a similar
expression in all samples, such as a housekeeping gene, is also measured. The expression of
this second gene is then used to normalize the expression of the gene of interest, to account for
differences in baseline protein expression and amount of biological material in different
samples (Kubista et al., 2006). The two samples can then be compared with statistical methods
of different complexity and the results are presented as the change in expression in the sample
compared to the control.

10
1.4 Aim of this thesis
This thesis aimed to explore how gut microbiota composition influences vitellogenin expression
in honeybees. To do so, we used qPCR to quantify vitellogenin expression in bees
experimentally inoculated with different bacteria. Newly emerged, microbe-free bees were
inoculated with either no microbiota, the complete microbiota obtained from hive bees, or
different groupings of lab-cultured members of the microbiota. We focused on the core
microbiota members, which we grouped based on their spatial and ecological distribution
within the gut to reduce the number of experimental groups and increase the statistical power
of our experiment. Nonetheless, we examined the role of F. perrara in isolation. This was done
to avoid the confounding effect of the unique immune response this bacterium elicits in the
host, which could be reflected in a peculiar effect on vitellogenin expression. We also included
a group of bees inoculated with all the lab-cultured bacteria strains used in this experiment: if
our experiment included all relevant bacterial groups this group would show similar
vitellogenin expression as bees inoculated with the microbiota obtained from hive bees,
supporting the biological relevance of our findings.
We measured vitellogenin expression separately in the bee gut and fat body. This was done
because changes in vitellogenin expression in the gut could reflect a local immune response
elicited by direct contact with the bacteria. On the other hand, changes in vitellogenin
expression in the fat body would reflect a systemic impact of the microbiota on the host
endocrine signaling.

11
2 Materials and methods
2.1 Experimental procedures
2.1.1 Experimental design
The bees involved in this study were collected during August 2019 from colonies kept at
NMBU in Ås, Norway. Pupae with lightly pigmented eyes but lacking body pigmentation
(Powell et al., 2014) were aseptically removed from capped brood cells, placed in sterile plastic
cages equipped with a feeder modified from a plastic syringe (figure 2)(Huang et al., 2014;
Williams et al., 2013), and incubated at approx. 35°C. Each cage contained a total of
approximately 21 pupae of similar age, which were collected from 3 different hives to ensure
genetic diversity. Under these conditions, the pupae emerged as adult bees within 5-8 days after
collection.
Figure 2 – Example of cages and feeders used in this experiment
12
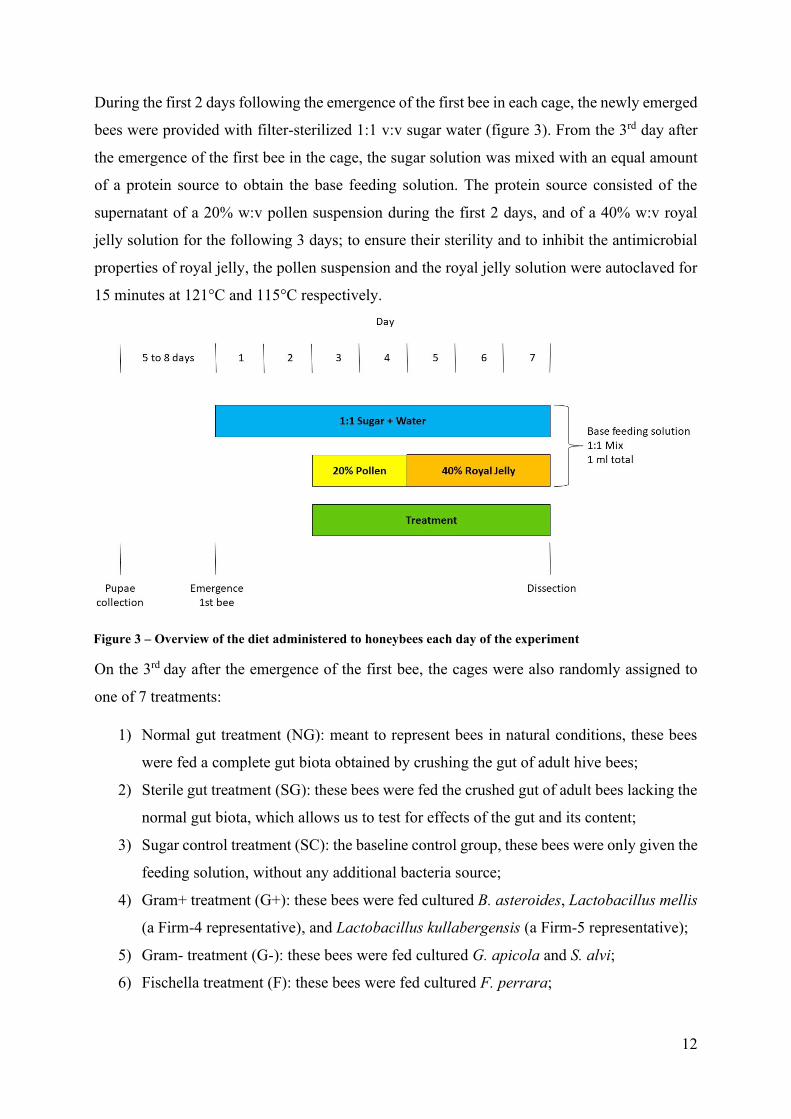
During the first 2 days following the emergence of the first bee in each cage, the newly emerged
bees were provided with filter-sterilized 1:1 v:v sugar water (figure 3). From the 3rd day after
the emergence of the first bee in the cage, the sugar solution was mixed with an equal amount
of a protein source to obtain the base feeding solution. The protein source consisted of the
supernatant of a 20% w:v pollen suspension during the first 2 days, and of a 40% w:v royal
jelly solution for the following 3 days; to ensure their sterility and to inhibit the antimicrobial
properties of royal jelly, the pollen suspension and the royal jelly solution were autoclaved for
15 minutes at 121°C and 115°C respectively.
On the 3rd day after the emergence of the first bee, the cages were also randomly assigned to
one of 7 treatments:
1) Normal gut treatment (NG): meant to represent bees in natural conditions, these bees
were fed a complete gut biota obtained by crushing the gut of adult hive bees;
2) Sterile gut treatment (SG): these bees were fed the crushed gut of adult bees lacking the
normal gut biota, which allows us to test for effects of the gut and its content;
3) Sugar control treatment (SC): the baseline control group, these bees were only given the
feeding solution, without any additional bacteria source;
4) Gram+ treatment (G+): these bees were fed cultured B. asteroides, Lactobacillus mellis
(a Firm-4 representative), and Lactobacillus kullabergensis (a Firm-5 representative);
5) Gram- treatment (G-): these bees were fed cultured G. apicola and S. alvi;
6) Fischella treatment (F): these bees were fed cultured F. perrara;
Figure 3 – Overview of the diet administered to honeybees each day of the experiment
13
7) Total treatment (TOT): these bees were fed all the six cultured bacteria strains fed to the
other groups.
Each treatment was run in parallel on 2 different cages, except for the sterile gut treatment,
which was administered to only 1 cage due to the unforeseen die-off of the second cage.
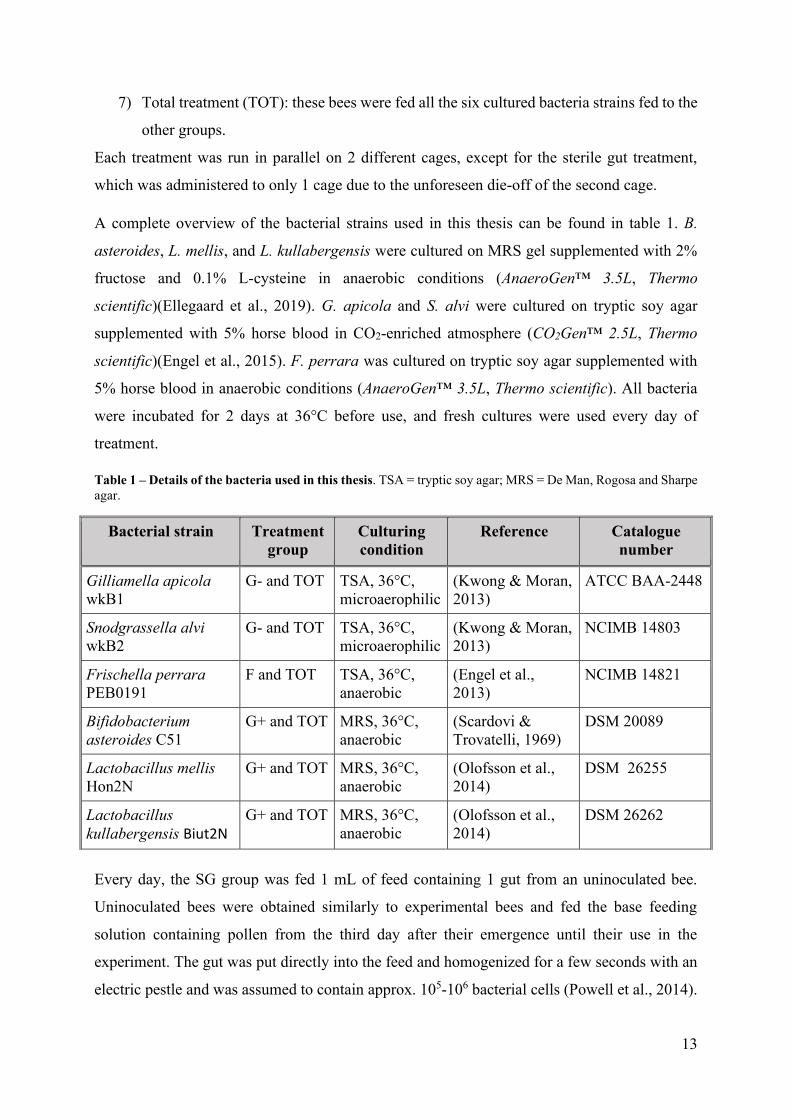
A complete overview of the bacterial strains used in this thesis can be found in table 1. B.
asteroides, L. mellis, and L. kullabergensis were cultured on MRS gel supplemented with 2%
fructose and 0.1% L-cysteine in anaerobic conditions (AnaeroGen™ 3.5L, Thermo
scientific)(Ellegaard et al., 2019). G. apicola and S. alvi were cultured on tryptic soy agar
supplemented with 5% horse blood in CO2-enriched atmosphere (CO2Gen™ 2.5L, Thermo
scientific)(Engel et al., 2015). F. perrara was cultured on tryptic soy agar supplemented with
5% horse blood in anaerobic conditions (AnaeroGen™ 3.5L, Thermo scientific). All bacteria
were incubated for 2 days at 36°C before use, and fresh cultures were used every day of
treatment.
Table 1 – Details of the bacteria used in this thesis. TSA = tryptic soy agar; MRS = De Man, Rogosa and Sharpe
agar.
Every day, the SG group was fed 1 mL of feed containing 1 gut from an uninoculated bee.
Uninoculated bees were obtained similarly to experimental bees and fed the base feeding
solution containing pollen from the third day after their emergence until their use in the
experiment. The gut was put directly into the feed and homogenized for a few seconds with an
electric pestle and was assumed to contain approx. 105-106 bacterial cells (Powell et al., 2014).
Bacterial strain Treatment
group
Culturing
condition
Reference Catalogue
number
Gilliamella apicola
wkB1
G- and TOT TSA, 36°C,
microaerophilic
(Kwong & Moran,
2013)
ATCC BAA-2448
Snodgrassella alvi
wkB2
G- and TOT TSA, 36°C,
microaerophilic
(Kwong & Moran,
2013)
NCIMB 14803
Frischella perrara
PEB0191
F and TOT TSA, 36°C,
anaerobic
(Engel et al.,
2013)
NCIMB 14821
Bifidobacterium
asteroides C51
G+ and TOT MRS, 36°C,
anaerobic
(Scardovi &
Trovatelli, 1969)
DSM 20089
Lactobacillus mellis
Hon2N
G+ and TOT MRS, 36°C,
anaerobic
(Olofsson et al.,
2014)
DSM 26255
Lactobacillus
kullabergensis Biut2N
G+ and TOT MRS, 36°C,
anaerobic
(Olofsson et al.,
2014)
DSM 26262

14
For the NG group, the gut of 1 hive-bee was homogenized in PBS and diluted to the same
bacterial concentration, assuming it originally contained around 109 bacterial cells (Kwong &
Moran, 2016; Zheng et al., 2018), before adding it to the feeding solution. To eliminate any
effect from the gut content, the hive bees were isolated and fed the base feeding solution
containing pollen for at least 3 days before their gut was used in the NG treatment. For the
remaining groups, the cultured bacteria were suspended in PBS and quantified by measuring
the suspension’s optical density at 600nm (UV-1800 spectrophotometer, Shimadzu) before
adding them to the feeding solution in a concentration of 106 bacterial cells per 1mL. This
procedure ensured that all treatment groups received a similar number of bacteria and that each
strand was equally represented in treatments involving more than one bacteria group.
2.1.2 Preliminary bacteria survival tests
To ensure treatment continuity, two tests were conducted to confirm that the bacteria
administered could survive in the feeding solution. The first test meant to verify that all bacteria
strands could survive in the sugar solution. For each of the bacterial strands involved in the
experiment, approximately 106 bacterial cells were suspended in 1mL of filtered sterilized 1:1
v:v sugar water and incubated at room temperature (ca. 23°C). After 1 and 2 days, 20µL of the
solution were cultured as described above. The second test meant to verify that the antibiotic
properties of royal jelly (Fratini et al., 2016) were inactivated by autoclaving. L. kullabergensis
and G. apicola were plated on their respective growth mediums. Then, a 40% w:v royal jelly
solution which had previously been autoclaved at 115°C for 15 minutes was dripped on
different spots of the plate. The plates were then incubated for 2 days as described above.
2.1.3 Gut and fat body collection
After 5 days of treatment, the bees were dissected to collect an intestine sample consisting of
midgut and ileum, and the fat body. First, bees were put into a chill coma by cooling them at
4°C (Free & Spencer-Booth, 1960). Then, the gut was extracted by pulling the stinger apart
from the body and the rectum was cut off. Finally, the abdomen was pulled apart from the
thorax. The intestine sample and the abdomen were then immersed in 300µL and 500µL
(respectively) of RNAlater™ solution (Ambion)(RNAlater™ user manual, 2014) and stored at
-20° C. To avoid RNA degradation, the handling of each sample took no longer than 1 minute,
from the initial extraction of the gut to the immersion of the samples in the preservative solution.

15
2.2 Sample analysis
To measure protein expression in the samples, RNA was isolated. Samples were homogenized
and lysed using TRIzol™ reagent by Thermo scientific (TRIzol™ User Guide, 2016) and RNA
was isolated using the RNeasy Mini Kit in combination with the RNase-Free DNase Set, both
by Qiagen (DNase Set Product Sheet, 2018; RNeasy Mini Handbook, 2013). The complete
protocol used for RNA extraction and isolation can be found in Appendix 1.
The isolated RNA was then reverse-transcribed into DNA. The FIREScript® RT cDNA
synthesis Mix with Oligo (dT) and Random primers (Solis Biodyne) was used. 2µL of RNA
were mixed with the kit components following the kit instructions (FIREScript® data sheet,
2017), and cDNA synthesis was conducted with an Applied Biosystems 2720 Thermal Cycler.
The program used for cDNA synthesis consisted of 7 min at 25°C (primer annealing), 20 min
at 45°C (reverse transcription) and 5 min at 85°C (enzyme inactivation), before samples were
cooled down at 4°C and stored at -20°C.
The cDNA was then quantified using a Qubit™ dsDNA HS Assay Kit and a Qubit™ 2.0
fluorometer (Thermo Scientific) following the manufacturer’s recommendations (Qubit® user
manual, 2015) and diluted with PCR grade water to a concentration of approximately 2 µg/ml
before qPCR.
Vitellogenin and actin, the gene chosen for normalization (Lourenço et al., 2008), were then
quantified through qPCR. For each gene examined, the qPCR mix consisted of:
- 2 µl or approximately 4 ng of template DNA,
- 4 µl of 5x HOT FIREPol® EvaGreen® qPCR Supermix (Solis BioDyne)(EvaGreen®
data sheet, 2017),
- 0,4 µl of forward primer (table 2), for a final concentration of 0.2 µM
- 0,4 µl of reverse primer, for a final concentration of 0.2 µM
- 13,2 µl of PCR-grade water.
The qPCR protocol used consisted of an initial activation step at 95°C for 15 minutes followed
by 40 amplification cycles (30s at 95°C for denaturation; 30s for annealing at 60°C for actin
and at 54°C for vitellogenin, during which fluorescence was measured; 30s at 72°C for
elongation). Melting curves for the qPCR products were also recorded, to ensure the specificity
of the PCR reaction. The qPCR was performed using a CFX96 Touch Real-Time PCR Detection
System (Bio-Rad).

16
Table 2 – Details of primers used for qPCR in this experiment. Ta = annealing temperature; bp = base pair
2.3 Data analysis
2.3.1 Statistical analysis
The PCR data was processed separately for the guts and the fat bodies. Individual samples were
excluded from the analysis if the melting curve suggested that the PCR reaction had not been
specific, i.e. if the melting curve showed more than one melting peak or a single melting peak
at a temperature different from the one expected for the intended amplicon.
The raw data was compiled into excel and imported into the program LineRegPCR (Ruijter et
al., 2009) to calculate the PCR efficiency (E) for each amplicon in each sample type. The
calculated efficiencies and the Ct values were then imported into R (R Core Team, 2018) and
analyzed.
The relationship between the Ct value and the initial number of copies (n) in the qPCR reaction
is expressed by the relationship
𝐶𝑡 = 𝑘 × log 𝑛
where k is the slope of a standard curve obtained through a serial dilution of a standard (Kubista
et al., 2006). Since said slope is related to the efficiency (E) of the reaction through the equation
𝑘 = −1
log 𝐸
(Kubista et al., 2006; Ståhlberg et al., 2005), the logarithm of the initial amount of DNA in the
reaction can be calculated as
log 𝑛 = − 𝐶𝑡 × log 𝐸.
Gene Primer Sequence 5'-->3' Ta (°C) Reference Amplicon
length (bp)
Actin Forward TGCCAACACTGTCCTTTCTG 60 (Lourenço et al., 2008)
155 Reverse AGAATTGACCCACCAATCCA 60 (Lourenço et al., 2008)
Vitellogenin Forward GTTGGAGAGCAACATGCAGA 54 (Amdam et al., 2004a)
150 Reverse TCGATCCATTCCTTGATGGT 54 (Amdam et al., 2004a)

17
Based on this relationship, a quantification of the expression of vitellogenin (Vg) relative to
that of actin (Act) on which to perform the statistical analysis was calculated for each sample
as:
log𝑉𝑔
𝐴𝑐𝑡⁄ = log 𝑉𝑔 − log 𝐴𝑐𝑡 = (𝑙𝑜𝑔(𝐸𝐴𝑐𝑡) × 𝐶𝑡𝐴𝑐𝑡) − (𝑙𝑜𝑔(𝐸𝑉𝑔) × 𝐶𝑡𝑉𝑔).
Within each treatment group, outliers were identified and excluded from further analysis.
Samples were considered outliers when their Vg/Act ratio fell more than 1,5 interquartile range
below the first quartile or above the third quartile of the distribution for their treatment group.
The Vg/Act ratio values which were not considered outliers were then analyzed to find
statistically significant differences among groups. Non-parametric statistical tests were favored,
as the data did not always meet the assumption for parametric tests. First, Wilcoxon tests and,
when possible, t-tests were performed to verify there were no significant differences between
cages assigned to the same treatment. Then, independently of the results of this test, data from
the two cages assigned to the same treatment were pooled together and a Kruskal-Wallis test
and a posthoc pairwise Mann-Whitney U test with a Bonferroni correction were performed to
detect differences between treatments.
2.3.2 Fold change estimate
The average Ct was calculated for both actin and vitellogenin in each experimental group. For
all groups, the fold change in vitellogenin expression, relative to the expression in the SC group,
was estimated from these averages using two relative quantification methods. In the 2-ΔΔCt
method (Livak & Schmittgen, 2001) it was assumed that the PCR reaction had perfect
efficiency for both the target and calibrator gene, and the change in the expression of
vitellogenin was calculated as:
𝐹𝑜𝑙𝑑 𝑐ℎ𝑎𝑛𝑔𝑒 = 2− (∆𝐶𝑡𝑠𝑎𝑚𝑝𝑙𝑒−∆𝐶𝑡𝑆𝐶),
where
∆𝐶𝑡 = 𝐶𝑡𝑉𝑔 − 𝐶𝑡𝐴𝑐𝑡.
In the efficiency correction method (Pfaffl, 2001) differences in the efficiencies of the
amplification reactions were instead kept into account, and the fold change was calculated as:
𝐹𝑜𝑙𝑑 𝑐ℎ𝑎𝑛𝑔𝑒 = (𝐸𝑉𝑔)
∆𝐶𝑡𝑉𝑔(𝑆𝐶−𝑠𝑎𝑚𝑝𝑙𝑒)
(𝐸𝐴𝑐𝑡)∆𝐶𝑡𝐴𝑐𝑡(𝑆𝐶−𝑠𝑎𝑚𝑝𝑙𝑒)
.

18
If a significant difference was found between two treatments other than the SC group, the
change in Vg expression was also calculated between those two treatments with the same
methods, by setting one of the 2 groups as the baseline instead of the SC group.

19
3 Results
3.1 Preliminary bacteria survival tests
In our first preliminary test, all experimental bacteria were able to grow after having been
incubated in the sugar solution for 1 day. After 2 days, all bacteria apart from F. perrara were
able to grow. These results confirmed that all the strands could survive in the base feeding
solution between 24 and 48 hours. In the second test, both L. kullabergensis and G. apicola
were able to grow on the entire plate, including the areas where the royal jelly solution had been
dripped (figure 4), suggesting that the royal jelly did not interfere with bacterial survival.
3.2 Main results
A total of 180 bees were dissected. mRNA extraction and reverse transcription were successful
in all the 360 samples collected, with cDNA yield ranging from 1,5µg/mL to 9,5µg/mL in fat
body samples and from 4,1µg/mL to 12,4µg/mL in gut samples. The mean amplification
efficiency calculated through LineRegPCR was above 2 for actin in both fat body and gut
samples (2,049 and 2,078 respectively). The efficiency was lower for vitellogenin, with a mean
value of 1,72 in fat bodies and 1,672 in guts. Because of this difference in efficiency, we
consider the efficiency correction method the most appropriate to calculate the changes in gene
expression, and present the results of the 2-ΔΔCt calculations in Appendix 2. In gut samples,
Figure 4 – Bacterial growth in the presence of autoclaved royal jelly
a – Lactobacillus kullabergensis. b – Gilliamella apicola.

20
vitellogenin amplification was also less specific: half of the samples showed a melting peak
consistent with the formation of primer-dimers in addition to or instead of the expected peak
for vitellogenin and were therefore excluded from the analysis. The number of samples included
in the analysis after outlier removal and their repartition between treatments and cages can be
found in table 3.
Table 3 – Number of samples (n) from each treatment
and cage included in the analysis
3.2.1 Fat body
The distribution of the logVg/Act ratio in fat body samples from each cage, after outliers
removal, can be seen in figure 5. The average logVg/Act value across treatments was 2,23.
Results and exact p-values for all statistical tests conducted can be found in Appendix 2. The
Wilcoxon test revealed significant differences between the cages that received the G- treatment
and between those that received the TOT treatment (in both cases, p < 0,001), while there were
no significant differences between the replicates of the other treatments. The t-test had similar
results.
The Kruskal-Wallis and posthoc Mann-Whitney U tests showed that Vg expression in the G-
and NG treatments was significantly different than in the SC treatment (p = 0,0049 and p =
0,0228 respectively). In both cases, the expression of vitellogenin decreased in the treated
samples compared to the sugar control group. When treatments were compared with the
Fat body Gut
Treatment n n by cage n n by cage
F 25 11
8 7
14 1
G- 22 13
10 5
9 5
G+ 25 14
21 11
11 10
NG 27 13
15 9
14 6
SC 26 12
12 7
14 5
SG 16 16 14 14
TOT 32 16
8 3
16 5
173 88

21
efficiency correction method, Vg expression decreased by 46% in the NG treatment, and by
60% in the G- treatment (figure 6). The magnitude of the change was similar when calculated
with the 2-ΔΔCt method (figure S1a).
Figure 5 – Vitellogenin expression in the fat body of bees with different gut bacterial communities
Asterisks indicate significant differences between treatments (black) and between replicates of the same treatment
(blue). * p < 0,05. ** p < 0,01. *** p < 0,001.
Figure 6 – Change in vitellogenin expression in the fat body of bees with different gut bacterial communities,
relative to the SC group
Lines with asterisks above bars indicate statistically significant changes. * p < 0,05. ** p < 0,01. *** p < 0,001.

22
3.2.2 Gut
The distribution of the log relative Vg/Act ratio in gut samples, after outliers removal, can be
seen in figure 7. The average logVg/Act value across treatments was 1,50. The Wilcoxon test
revealed significant differences between the cages that received the NG treatment (p = 0.029),
while there were no significant differences between the replicates of the other treatments. For
those treatments that met the conditions to perform t-tests, the results of the 2 tests were similar.
The Kruskal-Wallis and posthoc Mann-Whitney U tests showed a significant difference in Vg
expression between the G+ and NG treatment (p = 0,034), while all other comparisons were not
significant. Vg expression increased almost 3-fold in the G+ treatment compared to the NG
treatment, when the treatments were compared with the efficiency correction method (figure
8). The magnitude of the change was even greater when calculated with the 2-ΔΔCt method
(figure S2). It is also worth noting that, compared to the SC treatment, Vg expression seemed
to increase in the G+ treatment and decrease in the NG treatment, although these differences
were not statistically significant (figure 9 and figure S1b in Appendix 2).
Figure 7 – Vitellogenin expression in the gut of bees with different gut bacterial communities
Asterisks indicate significant differences between treatments (black) and between replicates of the same treatment
(blue). * p < 0,05. ** p < 0,01. *** p < 0,001.
23
Figure 8 – Change in vitellogenin expression in the gut of bees inoculated with
Lactobacillus mellis, Lactobacillus kullabergensis and Bifidobacterium asteroides
relative to bees with a normal gut microbiota
Figure 9 – Change in vitellogenin expression in the gut of bees with different gut bacterial communities,
relative to the SC group
Lines with asterisks above bars indicate statistically significant changes. * p < 0,05. ** p < 0,01. *** p < 0,001.

24
4 Discussion
Overall, we found that vitellogenin expression, as reflected by the log Vg/Act ratio, was higher
in the fat body than in the gut. This is consistent with the fat body being the main site of
vitellogenin synthesis.
We found that vitellogenin expression in the fat body of bees in the NG group decreased by
46% compared to the SC group. A similar decrease was observed in the gut, although this
difference was not statistically significant. These trends seem to suggest that the presence of
the normal microbiota suppresses vitellogenin expression both locally and systemically. In stark
contrast, Zheng et al. (2017) found gut vitellogenin expression to increase almost 5-fold in bees
with the normal microbiota compared to germ-free bees. This discrepancy could be due to
differences in methods, such as differences in bee diet or inoculation method, or reflect
ecological differences between different honeybee populations, such as different degrees of
dependence on the microbiota for endocrine regulation.
Vitellogenin expression in the fat body also decreased significantly in bees in the G- group.
This result suggests that the presence of either S. alvi or G. apicola could be responsible for the
systemic-level suppression of vitellogenin also observed in the NG group. Nonetheless, we did
not find a significant decrease in the TOT group, which also included these bacteria. This
contradicting result is possibly caused by part of the data in the G- and TOT groups being
unreliable. In both these groups, the two cages to which the treatment was administered showed
significantly different levels of fat body vitellogenin. Differences between cages suggest that
one or both cages might not be representative of the treatment because of external effects, and
our data does not allow us to identify if and where this is the case. Therefore, since we cannot
exclude that part of the data might be driving an artificially significant result (or lack thereof)
in these treatments, these results should be interpreted with caution.
In the gut, we found that vitellogenin expression was almost 3 times higher in the G+ group
than in the NG group. Although we are not aware of any studies directly linking the gram-
positive members of the microbiota and vitellogenin expression, Kesnerova et al. (2017) found
that B. asteroides stimulates the production of juvenile hormone. Since high levels of juvenile
hormone inhibit vitellogenin synthesis (Amdam & Omholt, 2003), our finding that gram-
positive bacteria increase vitellogenin expression is particularly surprising. Interestingly, we
only found this effect in the gut, and more specifically in the midgut and ileum. Under normal
conditions, the midgut contains very little bacteria and the ileum is dominated by the gram-

25
negative members of the microbiota, while the gram-positive bacteria colonize the rectum. If,
in the absence of the gram-negative bacteria, the ileum of bees in the G+ group was colonized
by gram-positive bacteria, this abnormal distribution could have elicited a localized immune
response and an increase in vitellogenin expression in this area of the gut. This dynamic would
also explain why vitellogenin expression would be promoted in bees in the G+ group but not in
those in the NG group, which would presumably have a normal distribution of bacteria and no
immune response. Unfortunately, we are not able to confirm or deny this hypothesis, as we did
not monitor spatial distribution of the bacteria in the different treatments.
We found no effect of F. perrara on vitellogenin expression in either the gut or fat body. This
suggests that, although this bacterium activates the host’s immune system and induces a
melanization reaction (Emery et al., 2017), it does not do so by influencing vitellogenin
expression. This is in line with the current understanding of the insect melanization response,
as the mechanisms that generate it do not involve vitellogenin (Nakhleh et al., 2017).
4.1 Dataset limitations
Some limitations of our datasets emerge from both our results and methodology, and should be
considered when drawing conclusions from the data we presented.
Firstly, the low amplification efficiency for vitellogenin suggests that our qPCR protocol was
not adequately optimized for this protein. This could result from sub-optimal primer sequences
or reaction conditions, i.e. temperature, pH, etc. While the efficiency correction method
accounts for sub-optimal amplification when calculating changes in gene expression, the
inadequate reaction optimization caused additional problems in gut samples. Here the melting
curve of the qPCR products suggested an extensive formation of unintended amplification
products, probably mostly consisting of primer dimers. We are not able to establish whether
this resulted from particularly low vitellogenin expression in the gut or from the gut content
interfering with the reaction. All samples where amplification had not been specific to
vitellogenin had to be excluded from our analysis. This halved the sample size of our gut dataset
and potentially introduced a systematic bias in our data. Overall, this reduced the statistical
power of our experiment and left our analysis of gut samples more susceptible to false negatives
and to positive results being driven by potential outliers.
Secondly, we could not verify the presence and composition of the experimental microbiota in
our bees. To this end, we originally collected the complete gut of 1 bee from each cage and
preserved it in 300µL of DNA preservative solution (S.T.A.R. buffer, Roche) after removing the

26
stinger. With the same procedure, we also collected the gut of 5 bees, each from a different
cage, immediately before the beginning of treatment to verify that cages had not been
contaminated before the experiment. Unfortunately, these samples could not be analyzed due
to the unforeseen time constraint imposed by the 2020 COVID-19 pandemic. Without genetic
data, we cannot confirm that all the bacteria included in our treatments successfully colonized
the bee gut. We also cannot exclude colonization by unintended bacteria species, either from
the environment or through cross-contamination of different treatments. Hence, the levels of
vitellogenin expression observed in part of our data could result from experimental failure or
contamination rather than from treatment. This occurrence is particularly likely in those
treatments where replicate cages showed significantly different results.
For these reasons, our results should be interpreted cautiously, especially those regarding
vitellogenin expression in the gut tissue.
27
5 Conclusion
This thesis explored how different members of the honeybee gut microbiota influence the
expression of an important multifunctional protein, vitellogenin. Although evidence that the
microbiota affects vitellogenin expression exists in the literature (Schwarz et al., 2016; Zheng
et al., 2017) this is, to our knowledge, the first attempt to identify which members of the
microbiota are responsible for this effect and to differentiate between local and systemic
impacts.
We found some evidence to support our hypothesis that the various members of the microbiota
contribute differently to the regulation of vitellogenin expression. Our results suggest, in
contrast with previous studies, that the S. alvi and G. apicola might be responsible for a systemic
suppression of vitellogenin expression. We also found the gram-positive members of the
microbiota to stimulate vitellogenin expression in the gut tissue, but we believe this might be
an artifact of the experimental design. We also found no impact of F. perrara on vitellogenin
expression. Although these results seem promising, the limitations of our data prevent us from
drawing any definitive conclusions.
We propose that this experiment should be replicated focusing on overcoming its limitations.
Firstly, the qPCR protocol for vitellogenin amplification should be optimized, especially for
the analysis of gut samples. Secondly, the presence and composition of the microbiota in each
experimental group should be confirmed through genetic analysis. Lastly, the number of
replicates in each treatment should be increased to limit the risk of contamination and increase
statistical power.

28
References
5x HOT FIREPol® EvaGreen®qPCR Supermix data sheet. (2017). Solis BioDyne. Available
at:
https://www.solisbiodyne.com/pics/8142_Data_Sheet_HOT_FIREPol_EvaGreen_qPC
R_Supermix.pdf (accessed: 29/5/2020).
Amdam, G. V. & Omholt, S. W. (2003). The hive bee to forager transition in honeybee colonies:
the double repressor hypothesis. J Theor Biol, 223 (4): 451-64. doi: 10.1016/s0022-
5193(03)00121-8.
Amdam, G. V., Norberg, K., Fondrk, M. K. & Page, R. E., Jr. (2004a). Reproductive ground
plan may mediate colony-level selection effects on individual foraging behavior in
honey bees. Proc Natl Acad Sci U S A, 101 (31): 11350-5. doi:
10.1073/pnas.0403073101.
Amdam, G. V., Simoes, Z. L., Hagen, A., Norberg, K., Schroder, K., Mikkelsen, O., Kirkwood,
T. B. & Omholt, S. W. (2004b). Hormonal control of the yolk precursor vitellogenin
regulates immune function and longevity in honeybees. Exp Gerontol, 39 (5): 767-73.
doi: 10.1016/j.exger.2004.02.010.
Amdam, G. V., Fennern, E. & Havukainen, H. (2012). Vitellogenin in Honey Bee Behavior
and Lifespan. In Galizia, C. G., Eisenhardt, D. & Giurfa, M. (eds) Honeybee
Neurobiology and Behavior, pp. 17-29. Dordrecht: Springer Netherlands.
Bodenheimer, F. S. (1937). Studies in Animal Populations. II. Seasonal Population-Trends of
the Honey-Bee. The Quarterly Review of Biology, 12 (4): 406-425. doi:
10.1086/394540.
Bonilla-Rosso, G. & Engel, P. (2018). Functional roles and metabolic niches in the honey bee
gut microbiota. Curr Opin Microbiol, 43: 69-76. doi: 10.1016/j.mib.2017.12.009.
Bradbear, N. (2009). Bees and their role in forest livelihoods: a guide to the services provided
by bees and the sustainable harvesting, processing and marketing of their products. Non-
Wood Forest Products (No.19): vii + 194 pp.
Clark, L. C. & Hodgkin, J. (2016). Caenorhabditis microbiota: worm guts get populated. BMC
Biol, 14 (37): 37. doi: 10.1186/s12915-016-0260-7.
Clements, K. D., Angert, E. R., Montgomery, W. L. & Choat, J. H. (2014). Intestinal microbiota
in fishes: what's known and what's not. Mol Ecol, 23 (8): 1891-8. doi:
10.1111/mec.12699.
Corona, M., Velarde, R. A., Remolina, S., Moran-Lauter, A., Wang, Y., Hughes, K. A. &
Robinson, G. E. (2007). Vitellogenin, juvenile hormone, insulin signaling, and queen
honey bee longevity. Proceedings of the National Academy of Sciences, 104 (17): 7128-
7133. doi: 10.1073/pnas.0701909104.
Dirksen, P., Marsh, S. A., Braker, I., Heitland, N., Wagner, S., Nakad, R., Mader, S., Petersen,
C., Kowallik, V., Rosenstiel, P., et al. (2016). The native microbiome of the nematode

29
Caenorhabditis elegans: gateway to a new host-microbiome model. BMC Biol, 14 (1):
38. doi: 10.1186/s12915-016-0258-1.
Dishaw, L. J., Flores-Torres, J., Lax, S., Gemayel, K., Leigh, B., Melillo, D., Mueller, M. G.,
Natale, L., Zucchetti, I., De Santis, R., et al. (2014). The gut of geographically disparate
Ciona intestinalis harbors a core microbiota. PLoS One, 9 (4): e93386. doi:
10.1371/journal.pone.0093386.
Douglas, A. E. (2014). Symbiosis as a general principle in eukaryotic evolution. Cold Spring
Harb Perspect Biol, 6 (2): a016113. doi: 10.1101/cshperspect.a016113.
Du, X., Wang, X., Wang, S., Zhou, Y., Zhang, Y. & Zhang, S. (2017). Functional
characterization of Vitellogenin_N domain, domain of unknown function 1943, and von
Willebrand factor type D domain in vitellogenin of the non-bilaterian coral Euphyllia
ancora: Implications for emergence of immune activity of vitellogenin in basal
metazoan. Dev Comp Immunol, 67: 485-494. doi: 10.1016/j.dci.2016.10.006.
Dudek, M., Adams, J., Swain, M., Hegarty, M., Huws, S. & Gallagher, J. (2014).
Metaphylogenomic and potential functionality of the limpet Patella pellucida's
gastrointestinal tract microbiome. Int J Mol Sci, 15 (10): 18819-39. doi:
10.3390/ijms151018819.
Ellegaard, K. M., Brochet, S., Bonilla-Rosso, G., Emery, O., Glover, N., Hadadi, N., Jaron, K.
S., van der Meer, J. R., Robinson-Rechavi, M., Sentchilo, V., et al. (2019). Genomic
changes underlying host specialization in the bee gut symbiont Lactobacillus Firm5.
Mol Ecol, 28 (9): 2224-2237. doi: 10.1111/mec.15075.
Emery, O., Schmidt, K. & Engel, P. (2017). Immune system stimulation by the gut symbiont
Frischella perrara in the honey bee (Apis mellifera). Mol Ecol, 26 (9): 2576-2590. doi:
10.1111/mec.14058.
Engel, P., Martinson, V. G. & Moran, N. A. (2012). Functional diversity within the simple gut
microbiota of the honey bee. Proc Natl Acad Sci U S A, 109 (27): 11002-7. doi:
10.1073/pnas.1202970109.
Engel, P., Kwong, W. K. & Moran, N. A. (2013). Frischella perrara gen. nov., sp. nov., a
gammaproteobacterium isolated from the gut of the honeybee, Apis mellifera. Int J Syst
Evol Microbiol, 63 (Pt 10): 3646-3651. doi: 10.1099/ijs.0.049569-0.
Engel, P. & Moran, N. A. (2013). The gut microbiota of insects – diversity in structure and
function, 37. pp. 699-735.
Engel, P., Bartlett, K. D. & Moran, N. A. (2015). The Bacterium Frischella perrara Causes Scab
Formation in the Gut of its Honeybee Host. mBio, 6 (3): e00193-15. doi:
10.1128/mBio.00193-15.
FIREScript® RT cDNA Synthesis MIX with Oligo (dT) and Random primers data sheet. (2017).
Solis BioDyne. Available at:
https://www.solisbiodyne.com/pics/8098_Data_Sheet_FIREScript_RT_cDNA_Synthe
sis_MIX_with_Oligo_(dT)_and_Random_primers.pdf.

30
Fluri, P., Wille, H., Gerig, L. & Lüscher, M. (1977). Juvenile hormone, vitellogenin and
haemocyte composition in winter worker honeybees (Apis mellifera). Experientia, 33
(9): 1240-1241. doi: 10.1007/bf01922354.
Forsgren, E., Olofsson, T. C., Vasquez, A. & Fries, I. (2010). Novel lactic acid bacteria
inhibiting Paenibacillus larvae in honey bee larvae. Apidologie, 41 (1): 99-108. doi:
10.1051/apido/2009065.
Fratini, F., Cilia, G., Mancini, S. & Felicioli, A. (2016). Royal Jelly: An ancient remedy with
remarkable antibacterial properties. Microbiol Res, 192: 130-141. doi:
10.1016/j.micres.2016.06.007.
Free, J. B. & Spencer-Booth, Y. (1960). Chill-Coma and Cold Death Temperatures of Apis
Mellifera. Entomologia Experimentalis et Applicata, 3 (3): 222-230. doi:
10.1111/j.1570-7458.1960.tb00451.x.
Givens, C. E., Ransom, B., Bano, N. & Hollibaugh, J. T. (2015). Comparison of the gut
microbiomes of 12 bony fish and 3 shark species. Marine Ecology Progress Series, 518:
209-223. doi: 10.3354/meps11034.
Grand View Research. (2019). Honey Market Size, Share & Trends Analysis Report By
Application (Food & Beverages, Personal Care & Cosmetics, Pharmaceutical), By
Distribution Channel, By Region, And Segment Forecasts, 2019 - 2025, GVR-3-68038-
280-8.
Hakim, J. A., Morrow, C. D., Watts, S. A. & Bej, A. K. (2019). High-throughput amplicon
sequencing datasets of the metacommunity DNA of the gut microbiota of naturally
occurring and laboratory aquaculture green sea urchins Lytechinus variegatus. Data
Brief, 26: 104405. doi: 10.1016/j.dib.2019.104405.
Hammer, T. J., Sanders, J. G. & Fierer, N. (2019). Not all animals need a microbiome. FEMS
Microbiol Lett, 366 (10). doi: 10.1093/femsle/fnz117.
Havukainen, H., Munch, D., Baumann, A., Zhong, S., Halskau, O., Krogsgaard, M. & Amdam,
G. V. (2013). Vitellogenin recognizes cell damage through membrane binding and
shields living cells from reactive oxygen species. J Biol Chem, 288 (39): 28369-81. doi:
10.1074/jbc.M113.465021.
Higuchi, R., Dollinger, G., Walsh, P. S. & Griffith, R. (1992). Simultaneous amplification and
detection of specific DNA sequences. Biotechnology (N Y), 10 (4): 413-7. doi:
10.1038/nbt0492-413.
Huang, S. K., Csaki, T., Doublet, V., Dussaubat, C., Evans, J. D., Gajda, A. M., Gregorc, A.,
Hamilton, M. C., Kamler, M., Lecocq, A., et al. (2014). Evaluation of cage designs and
feeding regimes for honey bee (Hymenoptera: Apidae) laboratory experiments. J Econ
Entomol, 107 (1): 54-62. doi: 10.1603/ec13213.
Jiang, H. & Wang, D. (2018). The Microbial Zoo in the C. elegans Intestine: Bacteria, Fungi
and Viruses. Viruses, 10 (2). doi: 10.3390/v10020085.

31
Kesnerova, L., Mars, R. A. T., Ellegaard, K. M., Troilo, M., Sauer, U. & Engel, P. (2017).
Disentangling metabolic functions of bacteria in the honey bee gut. PLoS Biol, 15 (12):
e2003467. doi: 10.1371/journal.pbio.2003467.
Killer, J., Dubna, S., Sedlacek, I. & Svec, P. (2014). Lactobacillus apis sp. nov., from the
stomach of honeybees (Apis mellifera), having an in vitro inhibitory effect on the
causative agents of American and European foulbrood. Int J Syst Evol Microbiol, 64 (Pt
1): 152-7. doi: 10.1099/ijs.0.053033-0.
Kubista, M., Andrade, J. M., Bengtsson, M., Forootan, A., Jonak, J., Lind, K., Sindelka, R.,
Sjoback, R., Sjogreen, B., Strombom, L., et al. (2006). The real-time polymerase chain
reaction. Mol Aspects Med, 27 (2-3): 95-125. doi: 10.1016/j.mam.2005.12.007.
Kwong, W. K. & Moran, N. A. (2013). Cultivation and characterization of the gut symbionts
of honey bees and bumble bees: description of Snodgrassella alvi gen. nov., sp. nov., a
member of the family Neisseriaceae of the Betaproteobacteria, and Gilliamella apicola
gen. nov., sp. nov., a member of Orbaceae fam. nov., Orbales ord. nov., a sister taxon
to the order ‘Enterobacteriales’ of the Gammaproteobacteria. International journal of
systematic and evolutionary microbiology, 63 (6): 2008-2018.
Kwong, W. K. & Moran, N. A. (2016). Gut microbial communities of social bees. Nat Rev
Microbiol, 14 (6): 374-84. doi: 10.1038/nrmicro.2016.43.
Kwong, W. K., Mancenido, A. L. & Moran, N. A. (2017). Immune system stimulation by the
native gut microbiota of honey bees. R Soc Open Sci, 4 (2): 170003. doi:
10.1098/rsos.170003.
Ley, R. E., Hamady, M., Lozupone, C., Turnbaugh, P. J., Ramey, R. R., Bircher, J. S., Schlegel,
M. L., Tucker, T. A., Schrenzel, M. D., Knight, R., et al. (2008). Evolution of mammals
and their gut microbes. Science, 320 (5883): 1647-51. doi: 10.1126/science.1155725.
Li, E., Xu, C., Wang, X., Wang, S., Zhao, Q., Zhang, M., Qin, J. G. & Chen, L. (2018). Gut
Microbiota and its Modulation for Healthy Farming of Pacific White Shrimp
Litopenaeus vannamei, 26. Groton. pp. 381-399.
Li, J. H., Evans, J. D., Li, W. F., Zhao, Y. Z., DeGrandi-Hoffman, G., Huang, S. K., Li, Z. G.,
Hamilton, M. & Chen, Y. P. (2017). New evidence showing that the destruction of gut
bacteria by antibiotic treatment could increase the honey bee's vulnerability to Nosema
infection. PLoS One, 12 (11): e0187505. doi: 10.1371/journal.pone.0187505.
Livak, K. J. & Schmittgen, T. D. (2001). Analysis of Relative Gene Expression Data Using
Real-Time Quantitative PCR and the 2−ΔΔCT Method. Methods, 25 (4): 402-8. doi:
10.1006/meth.2001.1262.
Lourenço, A. P., Mackert, A., Cristino, A. D. & Simões, Z. L. P. (2008). Validation of reference
genes for gene expression studies in the honey bee, Apis mellifera, by quantitative real-
time RT-PCR. Apidologie, 39 (3): 372-U33. doi: 10.1051/apido:2008015.
Maes, P. W., Rodrigues, P. A., Oliver, R., Mott, B. M. & Anderson, K. E. (2016). Diet-related
gut bacterial dysbiosis correlates with impaired development, increased mortality and
Nosema disease in the honeybee (Apis mellifera). Mol Ecol, 25 (21): 5439-5450. doi:
10.1111/mec.13862.

32
Martinson, V. G., Moy, J. & Moran, N. A. (2012). Establishment of characteristic gut bacteria
during development of the honeybee worker. Appl Environ Microbiol, 78 (8): 2830-40.
doi: 10.1128/AEM.07810-11.
Miller, D. L., Parish, A. J. & Newton, I. L. (2019). Transitions and transmission: behavior and
physiology as drivers of honey bee-associated microbial communities. Curr Opin
Microbiol, 50: 1-7. doi: 10.1016/j.mib.2019.08.001.
Moran, N. A., Hansen, A. K., Powell, J. E. & Sabree, Z. L. (2012). Distinctive gut microbiota
of honey bees assessed using deep sampling from individual worker bees. PLoS One, 7
(4): e36393. doi: 10.1371/journal.pone.0036393.
Murakami, T., Segawa, T., Bodington, D., Dial, R., Takeuchi, N., Kohshima, S. & Hongoh, Y.
(2015). Census of bacterial microbiota associated with the glacier ice worm
Mesenchytraeus solifugus. FEMS Microbiol Ecol, 91 (3). doi: 10.1093/femsec/fiv003.
Nakhleh, J., El Moussawi, L. & Osta, M. A. (2017). The Melanization Response in Insect
Immunity. In Ligoxygakis, P. (ed.) Advances in Insect Physiology, vol. 52 Insect
Immunity, pp. 83-109: Academic Press.
National Research Council. (2007). Status of Pollinators in North America. Washington, DC:
The National Academies Press.
Nelson, C. M., Ihle, K. E., Fondrk, M. K., Page, R. E. & Amdam, G. V. (2007). The gene
vitellogenin has multiple coordinating effects on social organization. PLoS Biol, 5 (3):
e62. doi: 10.1371/journal.pbio.0050062.
Nougue, O., Gallet, R., Chevin, L. M. & Lenormand, T. (2015). Niche Limits of Symbiotic Gut
Microbiota Constrain the Salinity Tolerance of Brine Shrimp. Am Nat, 186 (3): 390-
403. doi: 10.1086/682370.
Olofsson, T. C., Alsterfjord, M., Nilson, B., Butler, E. & Vasquez, A. (2014). Lactobacillus
apinorum sp. nov., Lactobacillus mellifer sp. nov., Lactobacillus mellis sp. nov.,
Lactobacillus melliventris sp. nov., Lactobacillus kimbladii sp. nov., Lactobacillus
helsingborgensis sp. nov. and Lactobacillus kullabergensis sp. nov., isolated from the
honey stomach of the honeybee Apis mellifera. Int J Syst Evol Microbiol, 64 (Pt 9):
3109-3119. doi: 10.1099/ijs.0.059600-0.
Pagan-Jimenez, M., Ruiz-Calderon, J. F., Dominguez-Bello, M. G. & Garcia-Arraras, J. E.
(2019). Characterization of the intestinal microbiota of the sea cucumber Holothuria
glaberrima. PLoS One, 14 (1): e0208011. doi: 10.1371/journal.pone.0208011.
Pfaffl, M. W. (2001). A new mathematical model for relative quantification in real-time RT-
PCR. Nucleic Acids Res, 29 (9): e45. doi: 10.1093/nar/29.9.e45.
Powell, J. E., Martinson, V. G., Urban-Mead, K. & Moran, N. A. (2014). Routes of Acquisition
of the Gut Microbiota of the Honey Bee Apis mellifera. Appl Environ Microbiol, 80
(23): 7378-87. doi: 10.1128/AEM.01861-14.
Qubit® dsDNA HS Assay Kits. (2015). Thermo Fisher Scientific Inc. Available at:
https://assets.thermofisher.com/TFS-
Assets/LSG/manuals/Qubit_dsDNA_HS_Assay_UG.pdf (accessed: 29/5/2020).
33
R Core Team. (2018). R: A Language and Environment for Statistical Computing. Vienna,
Austria: R Foundation for Statistical Computing. Available at: https://www.R-
project.org/.
Raymann, K., Shaffer, Z. & Moran, N. A. (2017). Antibiotic exposure perturbs the gut
microbiota and elevates mortality in honeybees. PLoS Biol, 15 (3): e2001861. doi:
10.1371/journal.pbio.2001861.
RNAlater® Tissue Collection: RNA Stabilization Solution Protocol. (2014). Carlsbad: Thermo
Fisher Scientific Inc. Available at: https://www.thermofisher.com/document-
connect/document-
connect.html?url=https%3A%2F%2Fassets.thermofisher.com%2FTFS-
Assets%2FLSG%2Fmanuals%2F7020M.pdf&title=VXNlciBHdWlkZTogUk5BbGF0
ZXImcmVnOyBUaXNzdWUgQ29sbGVjdGlvbjogUk5BIFN0YWJpbGl6YXRpb24=
(accessed: 23/5/2020).
RNase-Free DNase Set Product Sheet. (2018). Qiagen. Available at:
https://www.qiagen.com/ca/resources/resourcedetail?id=b0ca9e5a-ff87-476e-811b-
ff80e4f07b3f&lang=en (accessed: 29/05/2020).
RNeasy Mini Handbook. (2013). Qiagen. Available at:
https://www.qiagen.com/ca/resources/resourcedetail?id=14e7cf6e-521a-4cf7-8cbc-
bf9f6fa33e24&lang=en (accessed: 23/5/2020).
Roffet-Salque, M., Regert, M., Evershed, R. P., Outram, A. K., Cramp, L. J., Decavallas, O.,
Dunne, J., Gerbault, P., Mileto, S., Mirabaud, S., et al. (2015). Widespread exploitation
of the honeybee by early Neolithic farmers. Nature, 527 (7577): 226-30. doi:
10.1038/nature15757.
Ruijter, J. M., Ramakers, C., Hoogaars, W. M., Karlen, Y., Bakker, O., van den Hoff, M. J. &
Moorman, A. F. (2009). Amplification efficiency: linking baseline and bias in the
analysis of quantitative PCR data. Nucleic Acids Res, 37 (6): e45. doi:
10.1093/nar/gkp045.
Saiki, R. K., Scharf, S., Faloona, F., Mullis, K. B., Horn, G. T., Erlich, H. A. & Arnheim, N.
(1985). Enzymatic amplification of beta-globin genomic sequences and restriction site
analysis for diagnosis of sickle cell anemia. Science, 230 (4732): 1350-4. doi:
10.1126/science.2999980.
Salmela, H., Amdam, G. V. & Freitak, D. (2015). Transfer of Immunity from Mother to
Offspring Is Mediated via Egg-Yolk Protein Vitellogenin. PLoS Pathog, 11 (7):
e1005015. doi: 10.1371/journal.ppat.1005015.
Salmela, H. & Sundström, L. B. (2017). Vitellogenin in inflammation and immunity in social
insects. Inflammation and Cell Signaling, 4: e1506. doi: 10.14800/ics.1506.
Sanchez-Bayo, F. & Wyckhuys, K. A. G. (2019). Worldwide decline of the entomofauna: A
review of its drivers. Biological Conservation, 232: 8-27. doi:
10.1016/j.biocon.2019.01.020.

34
Scardovi, V. & Trovatelli, L. D. (1969). New species of bifid bacteria from Apis mellifica L.
and Apis indica F. A contribution to the taxonomy and biochemistry of the genus
Bifidobacterium. Zentralbl Bakteriol Parasitenkd Infektionskr Hyg, 123 (1): 64-88.
Schloissnig, S., Arumugam, M., Sunagawa, S., Mitreva, M., Tap, J., Zhu, A., Waller, A.,
Mende, D. R., Kultima, J. R., Martin, J., et al. (2013). Genomic variation landscape of
the human gut microbiome. Nature, 493 (7430): 45-50. doi: 10.1038/nature11711.
Schwarz, R. S., Moran, N. A. & Evans, J. D. (2016). Early gut colonizers shape parasite
susceptibility and microbiota composition in honey bee workers. Proc Natl Acad Sci U
S A, 113 (33): 9345-50. doi: 10.1073/pnas.1606631113.
Siddall, M. E., Min, G. S., Fontanella, F. M., Phillips, A. J. & Watson, S. C. (2011). Bacterial
symbiont and salivary peptide evolution in the context of leech phylogeny.
Parasitology, 138 (13): 1815-27. doi: 10.1017/S0031182011000539.
Ståhlberg, A., Zoric, N., Åman, P. & Kubista, M. (2005). Quantitative real-time PCR for cancer
detection: the lymphoma case. Expert Rev Mol Diagn, 5 (2): 221-30. doi:
10.1586/14737159.5.2.221.
TRIzol™ Reagent User Guide. (2016). Thermo Fisher Scientific Inc. Available at:
http://tools.thermofisher.com/content/sfs/manuals/trizol_reagent.pdf (accessed:
29/5/2020).
Tufail, M. & Takeda, M. (2008). Molecular characteristics of insect vitellogenins. J Insect
Physiol, 54 (12): 1447-58. doi: 10.1016/j.jinsphys.2008.08.007.
VanEngelsdorp, D., Evans, J. D., Saegerman, C., Mullin, C., Haubruge, E., Nguyen, B. K.,
Frazier, M., Frazier, J., Cox-Foster, D., Chen, Y., et al. (2009). Colony collapse
disorder: a descriptive study. PLoS One, 4 (8): e6481. doi:
10.1371/journal.pone.0006481.
Waite, D. W. & Taylor, M. W. (2015). Exploring the avian gut microbiota: current trends and
future directions. Front Microbiol, 6: 673. doi: 10.3389/fmicb.2015.00673.
Wang, X., Zhang, X., Zhang, Z., Lang, H. & Zheng, H. (2018). Honey bee as a model organism
to study gut microbiota and diseases. Drug Discovery Today: Disease Models, 28: 35-
42. doi: 10.1016/j.ddmod.2019.08.010.
Williams, G. R., Alaux, C., Costa, C., Csáki, T., Doublet, V., Eisenhardt, D., Fries, I., Kuhn,
R., McMahon, D. P., Medrzycki, P., et al. (2013). Standard methods for maintaining
adult Apis mellifera in cages under in vitro laboratory conditions, 52. pp. 1-36.
Zheng, H., Nishida, A., Kwong, W. K., Koch, H., Engel, P., Steele, M. I. & Moran, N. A.
(2016). Metabolism of Toxic Sugars by Strains of the Bee Gut Symbiont Gilliamella
apicola. mBio, 7 (6): e01326-16. doi: 10.1128/mBio.01326-16.
Zheng, H., Powell, J. E., Steele, M. I., Dietrich, C. & Moran, N. A. (2017). Honeybee gut
microbiota promotes host weight gain via bacterial metabolism and hormonal signaling.
Proc Natl Acad Sci U S A, 114 (18): 4775-4780. doi: 10.1073/pnas.1701819114.

35
Zheng, H., Steele, M. I., Leonard, S. P., Motta, E. V. S. & Moran, N. A. (2018). Honey bees as
models for gut microbiota research. Lab Animal, 47 (11): 317-325. doi:
10.1038/s41684-018-0173-x.

Appendix 1
RNA purification protocol
The first 7 steps in this protocol are derived from the TRIzol reagent protocol (TRIzol™ User Guide,
2016). The remaining steps follow the RNeasy mini handbook (RNeasy Mini Handbook, 2013),
including steps 11 to 14 referring to the use of the RNase-free DNAse set.
All centrifugation steps were conducted at room temperature unless otherwise specified, using an
Eppendorf Centrifuge 5804 R. All incubation steps were conducted at room temperature (20–30°C).
1. Thaw tissue, extract from RNA later (be sure to remove any crystals that may have formed),
transfer to a new tube and add 3 sterile, RNase-free 3mm ceramic beads.
2. Add 1 mL of TRIzol™ Reagent to each fat body sample and 0,5 mL of TRIzol™ Reagent to
each gut sample. Homogenize for 1 minute at 20 oscillations per second using a mixer mill
(RETSCH MM 400).
3. Incubate for 5 minutes to permit complete dissociation of the nucleoproteins complex.
4. Add 0.2 mL of chloroform per 1 mL of TRIzol™ Reagent used for lysis, then securely cap
the tube and mix by inversion.
5. Incubate for 2–3 minutes.
6. Centrifuge the sample for 15 minutes at 12,000 × g at 4°C. The mixture separates into a
lower red phenol-chloroform, and interphase, and a colorless upper aqueous phase.
7. Transfer the aqueous phase containing the RNA (300 μl for fat body samples and 200 μl for
gut samples) to a new tube by angling the tube at 45° and pipetting the solution out.
8. Add 1 volume of 70% ethanol to the solution and mix immediately by pipetting. Do not
centrifuge. Proceed immediately to the next step.
9. Transfer the sample, including any precipitate that may have formed, to an RNeasy spin
column placed in a 2 ml collection tube. Close the lid gently, and centrifuge for 15 s at ≥8000
x g (≥10,000 rpm). Discard the flow-through.
10. Add 350 μl Buffer RW1 to the RNeasy spin column. Close the lid gently, and centrifuge for
15 s at ≥8000 x g (≥10,000 rpm) to wash the spin column membrane. Discard the flow-
through.
11. Before using the RNase-Free DNase Set for the first time, prepare DNase I stock solution.
Dissolve the lyophilized DNase I (1500 Kunitz units) in 550 μl of the RNasefree water
provided. To avoid loss of DNase I, do not open the vial. Inject RNasefree water into the vial
using an RNase-free needle and syringe. Mix gently by inverting the vial. Do not vortex.

12. Add 10 μl DNase I stock solution to 70 μl Buffer RDD. Mix by gently inverting the tube, and
centrifuge briefly to collect residual liquid from the sides of the tube.
13. Add the DNase I incubation mix (80 μl) directly to the RNeasy spin column membrane, and
incubate for 15 min.
14. Add 350 μl Buffer RW1 to the RNeasy spin column. Close the lid gently, and centrifuge for
15 s at ≥8000 x g (≥10,000 rpm). Discard the flow-through.
15. Add 500 μl Buffer RPE to the RNeasy spin column. Close the lid gently, and centrifuge for
15 s at ≥8000 x g (≥10,000 rpm) to wash the spin column membrane. Discard the flow-
through.
16. Add 500 μl Buffer RPE to the RNeasy spin column. Close the lid gently, and centrifuge for 2
min at ≥8000 x g (≥10,000 rpm) to wash the spin column membrane.
After centrifugation, carefully remove the RNeasy spin column from the collection tube so
that the column does not contact the flow-through.
17. Place the RNeasy spin column in a new 1.5 ml collection tube. Add 50 μl RNase-free water
directly to the spin column membrane. Close the lid gently, and centrifuge for 1 min at
≥8000 x g (≥10,000 rpm) to elute the RNA.
Store purified RNA at -80°C.

Appendix 2
Comparison of log ratio by cage in fat body samples of the same treatment
Wilcoxon rank sum test with continuity
correction
alternative hypothesis: true location shift
is not equal to 0
Welch Two Sample t-test
alternative hypothesis: true difference in means
is not equal to 0
F W = 82, p-value = 0.8054
t = 0.15174, df = 14.507, p-value = 0.8815
95 percent confidence interval:
-0.3072997 0.3542564
sample estimates:
mean in group A mean in group B
2.298417 2.274939
G- W = 8, p-value = 0.0008411
t = -4.4672, df = 19.098, p-value = 0.0002612
95 percent confidence interval:
-0.6651019 -0.2408024
sample estimates:
mean in group A mean in group B
1.846102 2.299054
G+ W = 72, p-value = 0.8054
t = -0.36432, df = 20.919, p-value = 0.7193
95 percent confidence interval:
-0.2988858 0.2097923
sample estimates:
mean in group A mean in group B
2.298623 2.343169
NG W = 99, p-value = 0.7159
t = 0.60184, df = 24.455, p-value = 0.5528
95 percent confidence interval:
-0.1049230 0.1914234
sample estimates:
mean in group A mean in group B
2.183091 2.139841
SC W = 52, p-value = 0.1052
t = -1.8468, df = 20.718, p-value = 0.07911
95 percent confidence interval:
-0.45624540 0.02723786
sample estimates:
mean in group A mean in group B
2.315363 2.529867
TOT W = 23, p-value = 8.2e-05
t = -5.6954, df = 28.169, p-value = 4.079e-06
95 percent confidence interval:
-0.6079211 -0.2863682
sample estimates:
mean in group A mean in group B
1.974189 2.421333

Comparison of log ratio by cage in gut samples of the same treatment
Wilcoxon rank sum test with continuity
correction
alternative hypothesis: true location shift
is not equal to 0
Welch Two Sample t-test
alternative hypothesis: true difference in means
is not equal to 0
F W = 2, p-value = 0.6625 NA
G- W = 10, p-value = 0.6761
t = -0.54461, df = 7.9262, p-value = 0.601
95 percent confidence interval:
-0.4263770 0.2636708
sample estimates:
mean in group A mean in group B
1.368678 1.450031
G+ W = 45, p-value = 0.5035
t = -0.80311, df = 15.16, p-value = 0.4343
95 percent confidence interval:
-0.3880011 0.1754887
sample estimates:
mean in group A mean in group B
1.602532 1.708788
NG W = 46, p-value = 0.02924
t = 2.9505, df = 7.9393, p-value = 0.01857
95 percent confidence interval:
0.1060355 0.8694289
sample estimates:
mean in group A mean in group B
1.4105738 0.9228416
SC W = 17, p-value = 1
t = -0.29984, df = 6.1122, p-value = 0.7742
95 percent confidence interval:
-0.7269016 0.5675733
sample estimates:
mean in group A mean in group B
1.349519 1.429183
TOT W = 9, p-value = 0.7656
t = 0.91932, df = 5.1565, p-value = 0.3989
95 percent confidence interval:
-0.4153468 0.8844416
sample estimates:
mean in group A mean in group B
1.927767 1.693220

Fat body log ratio by treatment
Kruskal-Wallis rank sum test
chi-squared = 20.172, df = 6, p-value = 0.002581
P values for pairwise comparisons using Wilcoxon rank sum test. Adjustment method: bonferroni
F G- G+ NG SC SG
G- 0.7317 - - - - -
G+ 1.0000 0.1823 - - - -
NG 1.0000 1.0000 0.9936 - - -
SC 1.0000 0.0049 1.0000 0.0228 - -
SG 1.0000 1.0000 1.0000 1.0000 0.2185 -
TOT 1.0000 1.0000 1.0000 1.0000 0.1621 1.0000
Gut log ratio by treatment
Kruskal-Wallis rank sum test
chi-squared = 16.771, df = 6, p-value = 0.01016
P values for pairwise comparisons using Wilcoxon rank sum test. Adjustment method: bonferroni
F G- G+ NG SC SG
G- 1.000 - - - - -
G+ 1.000 1.000 - - - -
NG 1.000 1.000 0.034 - - -
SC 1.000 1.000 1.000 1.000 - -
SG 1.000 1.000 1.000 0.772 1.000 -
TOT 1.000 0.720 1.000 0.178 0.994 1.000

a
b
Figure S 2 – Relative vitellogenin expression in the gut Apis mellifera in the G+ and NG treatment, calculated with
the 2-ΔΔCt method.
Figure S1 –Vitellogenin expression in fat body (a) and gut (b) samples in Apis mellifera with different
gut biota composition relative to a group with no gut biota (SC), calculated with the 2-ΔΔCt method.
