material fluxes through the procaryotic compartment in a
TRANSCRIPT
Vol. 17: 211-230,1999 AQUATIC MICROBIAL ECOLOGY
Aquat Microb Ecol Published June 18
Material fluxes through the procaryotic compartment in a eutrophic backwater branch
of the River Danube
A. K. T. Kirschner, T. Ulbricht, A. Steitz, B. Velimirov*
Institut fiir Medizinische Biologie, Arbeitsgruppe Allgemeine Mikrobiologie, UniversitZt Wien, Wahringerstr. 10, A-1090 Wien, Austria
ABSTRACT: A seasonal study on the quantification of energy fluxes through the rnlcrobial compart- ment and on bacterial morphotype succession was performed in a hypertrophic shallow backwater branch, which had shifted from a macrophyte-dominated clear-water to a phytoplankton-dominated turbid-water state from 1992 to 1994. Filamentous cyanobacterial species dominated the phytoplank- tonic compartment during summer. Bacterial numbers ranged from 2 7 X 10' to 9.8 X 10' cells 1-', corre- sponding to biomass values of 35 and 119 1.19 C I-', respectively. Temperature, dissolved organic carbon (DOC), primary production and soluble phosphorus were found to explain most of the variation of bac- terial numbers and biomass in the system. Bacterial morphotypes exhibited a seasonal succession pat- tern with rods and vibrios as the most abundant morphotypes. Vibrios dominated during the bloom of cyanobacteria in summer, while rods were found to increase rapidly after the breakdown of the bloom in autumn and winter. Filamentous bacteria with cell lengths of up to 120 pm bloomed during a short period in spring, making up more than 60% of the total bacterial biomass. With principal component analysis we could extract 2 main factors influencing the variation of bacterial morphotypes, namely an abiotic/inorganic factor, containing temperature, oxygen, nitrate and ammonium, and a trophic factor, containing DOC, total nitrogen, total phosphorus and chlorophyll a. Variation of filamentous bacteria, however, could not be explained by these 2 factors. Bacterial secondary production amounted on aver- age to 3.1 pg C 1-' h-' with a range from 0.5 to 7.0 pg C 1-' h-'. The impact of top-down factors like graz- ing and viral lysis is expected to influence both the occurrence of filamentous bacteria and bacterial production rates. Enzyme kinetics of P-glucosidase, leu-aminopeptidase and alkaline phosphatase were established and the relations to the other investigated parameters are described. By integrating the phosphatase and aminopeptidase activity into a phosphorus and nitrogen budget for the bacterial and phytoplanktonic compartment in the Alte Donau, we were able to show that there was no P W t a - tion over the whole year, while N was possibly limiting at the beginning of algal blooms. On an annual basis primary production exceeded by far the bacterial carbon demand, but periods with the reverse situation occurred from October to May. Temperature and carbon supply were seen as the main factors for limiting bacterial growth in the Alte Donau during the cold months. The importance of viral lysis and predation in controlling bacterial growth during the summer months was pointed out. A compari- son of the investigated bacterial parameters with those of a mesotrophic but macrophyte-dominated branch of the same backwater system led us to the conclusion that the equilibrium shift of the Alte Donau has resulted in high primary production of the autotrophic procaryotic compartment but not in the expected increase of energy flux through the compartment of the heterotrophic bacterioplankton.
KEY WORDS: Backwater system . Eutrophication . Alternative equilibria . Nutrients . Bacterioplank- ton . Morphotypes . Enzyme activities . Bacterial carbon demand
INTRODUCTION ecosystems may have the potential for more than 1 equilibrium (May 1977, 1981, Scheffer 1990), an
Since the discussions on the stability and complexity increasing documentation of the existence of alterna- in model ecosystems (Levontin 1969, May 1973) and tive stable states in freshwater ecosystems could be the consideration of the theoretical possibility that observed (Hosper 1989, Irvine et al. 1989, Hanson &
Q Inter-Research 1999 'Addressee for correspondence. E-mail: [email protected]
212 Aquat Microb Ec
Butler 1990, Scheffer 1990, Blindotv et al. 1993). Shal- low lakes seem to be characterized by either abundant submerged macrophytes and clear water at low nutri- ent concentrations or by abundant phytoplankton and turbid water at high nutrient concentrations (Jeppesen et al. 1990, Moss 1990, Blindow et al. 1993, Scheffer et al. 1993).
A shift from a macrophyte-dominated system to a phytoplankton-dominated one was recorded for the Alte Donau (Dokulil & Janauer 1995), which is part of the backwater system of the River Danube near Vienna (Austria). The whole system has been sepa- rated from the main stream since the last decades of the 19th century by a series of embankments, which has led to a complete alteration of the character of the ecosystem, which now exhibits features of a shallow lake system. The reduced hydrological dynamics resulted in terrestrification processes leading to the development of a thick sediment layer and of extensive macrophyte vegetation in the backwater branches (Schiemer 1995). The Alte Donau is fed only by groundwater and precipitation and no tributaries and distributaries exist. Thus, the residence time of this backwater branch is in the magnitude of about 1 yr.
The fact that such a shift to an alternative stable state had taken place in the Alte Donau became evident by the total disappearance of the submersed macrophytes between 1992 and 1994 (Dokulil & Janauer 1995). In the following year, changes in the phytoplanktonic community were recorded (Dokulil & Mayer 1996, Mayer et al. 1997), leading to a key role of the procary- otic compartment in channeling energy and material through the ecosystem. This was indicated by the fact that the primary producers within the planktonic com- partment were dominated by filamentous cyanobacte- ria, namely Cylindrospermopsis raciborskii and Lim- nothrix redekei (Dokulil & Mayer 1996). Filamentous cyanobactena are known to be grazing resistent and therefore less accessible to zooplankton than eucary- otic phytoplankton cells (Giide 1989, Hawkins & Lam- pert 1989, Gliwicz 1990, Gliwicz & Lampert 1990); additionally, they are considered to be an unsuitable food source for crustaceans (Bernardi & Giussani 1990, Haney et al. 1994). Consequently, an important frac- tion of the photosynthetically produced carbon frnm the water column is expected to enter the detritus pool as particulate organic matter or to be directly available to the bacterial compartment in the form of exudates. Furthermore, one may assume a potential increase of dissolved and particulate detritus fractions within the system due to the organic matter derived from the decay of dying macrophytes from 1992 to 1994, thus increasing the production potential of the hetero- trophic bacterial community. In consequence, we assume that bacterial production is statistically signifi-
cantly higher than in those systems where macro- phytes are the dominating primary producers. Because no data on biomass or production for phyto- and bacte- rioplankton are available from the Alte Donau for the situation before the shift took place, our hypothesis was tested by comparing the monitored data with those obtained from a mesotrophic branch of the same backwater system (Mathias et al. 1995, Kirschner & Velimirov 1997), which exhibits features such as abun- dant submersed macrophytes, clear water and compar- atively low concentrations of inorganic nutrients. Beside this energetic aspect, the nitrogen and phos- phorus fluxes through the procaryotic compartment were studied and the key factors limiting microbial activity in the system were elaborated.
Finally, the bacterioplankton community with re- spect to its morphotype composition and succession pattern was investigated with the aim to reveal poten- tial differences in the morphotype structure of bacter- ial communities in systems with different stable states.
MATERIALS AND METHODS
Sampling. Sampling took place from April 1994 to April 1995 at 2 stations on the Alte Donau (Gajewski et al. 1997). The water depth of Stn 1 was on average 3.8 m, varying between 3.6 and 4.0 m; at Stn 2 mean depth was 1.8 m, varying between 1.6 and 2.0 m. Sam- ples were taken from 4 depths at Stn 1 (0.5, 1.5, 2.5 and 3.5 m) and 2 depths at Stn 2 (0.5 and 1.5 m) with a 2.5 1 Ruttner sampler and transferred into 1 1 plastic con- tainers. Subsamples for the measurement of primary production were immediately filled into 100 m1 Win- kler bottles and assayed in situ (see below). The sam- ples were transferred to the laboratory in cooling bags (dark and at in situ temperature) within 1 h.
Physical and chemical parameters. Concurrently with sampling temperature, pH and oxygen were mea- sured in situ at each depth with a multi-parameter probe (Hydrolog 2100; Grabner Instruments, Vienna).
For determination of the chemical parameters, pooled samples from all depths were used. Total phos- phorus (P,; after dissolution of the unfiltered sample with p~tarci i~m-p~rcx\~rl_is~!f~te) , ~ ~ S Q C ! V P C ! phcsphc rus (P,; after dissolution of the filtered sample) and sol- uble react~ve phosphorus (P,,; in the untreated filtrate) were determined photometrically using the molyb- dene-blue method according to Strickland & Parsons (1968). Total organic nitrogen (after dissolution of the unfiltered sample with sulfuric acid and hydrogenium- peroxide), dissolved organic nitrogen (after dissolution of the filtered sample) and NH4 (in the untreated fil- trate) were measured with the indophenolic-blue method according to Parsons et al. (1984). NO3 was
l r s c h n e r et al.. material fluxes t hrough the procaryot~c compartment 213
determined photometrically with the sodium-salicylate method after Legler (1988). Total nitrogen (N,) was cal- culated as the sum of total organic nitrogen, NH, and NO3, and dissolved nitrogen (N,) was calculated as the sum of dissolved organic nitrogen (DON), NH, and NO3. All photometrical measurements were performed with a Hitachi U-2000 photometer.
Dissolved organic carbon, chlorophyll a and pri- mary production. For the determination of dissolved organic carbon (DOC) water samples were filtered through precombusted (550°C; 2 h) Whatman GF/C fil- ters. The filtrate was transferred into combusted ampoules and stored at -20°C until analysis. DOC was determined using a Shimadzu TOC 5000 after sparg- ing the sample with CO2-free air. Standards were pre- pared with potassium hydrogen phthalate (Kanto Chemical Co., Inc.); a platinum catalyst on quartz was used. Chlorophyll a (chl a) was measured spectro- photometrically (Hitachi U-2000) at wavelengths of 750 and 665 nm. 50 to 100 m1 of each sample were fil- tered through a Whatman GF/F filter (0.7 pm nominal pore size), followed by extraction for 1 h at 80°C with 90 % ethanol (Nusch 1980).
Primary production was determined for each depth using the radiocarbon method developed by Vollen- weider (1974). 100 m1 samples were incubated in s i tu with 1 m1 of ',C-sodium bicarbonate (148 kBq, 14C- Agency, Denmark) for 4 h and thereafter transported to the laboratory in the dark. 10 m1 subsamples were transferred into 20 m1 scintillation vials (Canberra Packard) and assayed according to the acid bubbling method (Riemann & Jensen 1991) to determine the radioactivity incorporated by the phytoplankton. 10 m1 of scintillation cocktail were added and radioactivity was measured in a Canberra Packard scintillation counter (1900 TR). Counts were autoniatically cor- rected for quenching using a stored standard curve and a machine counting efficiency program.
Bacterial abundance, cell volumes and biomass. For estimation of bacterial numbers and biomass, 20 nil subsamples were fixed with 1 m1 buffered formalde- hyde (33%; pH = 8), and stored at 4OC in the dark for less than 2 wk. For microscopic examination, a slightly modified version of the acridine-orange direct count method after Hobbie et al. (1977) was applied, as described in detail by Kjrschner & Velimirov (1997). Bacteria were classified into 4 groups according to their different morphology: rods, cocci, curved rods (vibrios, including spirillae) and filamentous bacteria. Cells were defined as rods, if their length and width differed by more than 0.2 pm (Velimirov & Walenta- Sinion 1992). Bacteria longer than 3 pm and showing a diameter smaller than or equal to 0.5 pm were defined as filamentous forms (Kirschner & Velimirov 1997). Bacteria were sized by eyepiece micrometer. Details
on the calibration of the sizing procedure are pub- lished in Velimirov & Walenta-Simon (1992). At least 20 eyefields per sample were counted and 160 to 200 cells were measured (> 40 per morphotype). Cellular carbon content in fg C cell-' (C) was calculated from estimated cell volumes (V; pm3) assumlng the allomet- ric relation C = I ~ O V ~ . ' ~ after Norland (1993).
Bacterial secondary production. Bacterial sec- ondary production was determined by the '"-leucine incorporation method (Simon & Azam 1989). 10 nil trip- llcates of each depth were dispensed into a series of 20 m1 polyethylene vials and supplemented with a con- stant amount of 14C-leucine (325 mCi mmol-'; NEN- Research Products) to a final concentration of 40 to 60 nM. The adequate concentrations were determined bimonthly in saturation experiments and revealed that saturation occurred at concentrations no higher than 60 nM. All samples were incubated for 30 niin at in situ temperature; triplicate blanks were killed with form- aldehyde (final conc. 4 %) prior to incubation. Proteins were precipitated by adding trichloroacetic acid (final. conc. 5 %) and boiling for 30 min to solubilize DNA. The precipitated proteins were then collected on 0.1 pm membrane filters (Sartorius). After addition of 5 nll scintillation cocktail (Ultima Gold; Canberra Packard), radioactivity on the filters was determined in the scintillation counter (see above). Rates of ',C- leucine incorporation were converted to bacterial C production according to Simon & Azam (1989), assum- ing a recommended isotope dllution of 2.
Enzyme activity. Pooled water samples from the dif- ferent depths were used for enzyme assays. The activ- ity of the enzymes D-D-glucosidase (E.C. 3.2.1.21), aminopeptidase (E.C. 3.4.1.1) and alkaline phos- phatase (E.C. 3.3.3.1) was assayed fluorometrically (Hoppe 1983, Somville & Billen 1983). We used the nonfluorescent artificial substrates 4-methyl-umbellif- eryl-P-D-glucose (MUF-GLC; Sigma), ~-1eucine-4- methyl-7-coumarinylamide (LEU-MCA; Fluka) and methyl-umbelliferyl-phosphate (MUF-P; Sigma); after enzymatic hydrolysis we measured the release of the fluorescent products 4-methyl-umbelliferone (MUF) in the case of MUF-GLC and MUF-P while LEU-MCA led to the release of 7-amino-4-niethyl-coumarin (AMC). MUF fluorescence was determined at a 366 nm excita- tion and a 464 nm emission wavelength. AMC fluores- cence was measured at a 380 nm excitation and a 440 nm emission wavelength. The spectrofluorometer (F-2000, Hitachi) was calibrated with standard solu- tions (final conc, ranging from 1 to 2000 nM) of MUF (Sigma) and AMC (Fluka). Substrate solutions were prepared with ultra pure Milli-Q water, yielding final sample concentrations of 25, 12.5, 6.3, 3.2 and 1.6 pM for MUF-GLC, 100, 50, 25, 12.5 and 6.3 pM for LEU- MCA and 10, 5 , 2.5, 1.3 and 0.6 pM for MUF-P. Incu-
214 Aquat Microb Ecol 17: 211-230. 1999
bation was stopped after 2 h for MUF-P and LEU-MCA and after 4 h in the case of MUF-GLC. Increase in flu- orescence was linear for this period (data not shown). Blanks were determined by measuring fluorescence immediately after the addition of the substrate. The enzymatic reaction followed Michaelis-Menten kinet- ics and the plot of the reaction velocity (v) against the added concentration of substrate ([S]) gave a rectangu- lar hyperbola according to the equation v = (V,,,[S]) (K, + [S])-', where V,,, describes the velocity of the reaction which is theoretically attained at an infinitive concentration of substrate ([S]), and K, is the Michaelis-Menten constant representing the substrate concentration where half of V,,, is achieved. Kinetic parameters were calculated using the PC program 'Enzfitter' (Elsevier Biosoft) to determine the best fit of the rectangular hyperbola (Leatherbarrow 1987).
Statistical analysis. All statistical analyses were performed with the IBM PC program 'Statistica for Windows 4.0' (Statsoft Inc. 1993). ANOVA was used to test for significant differences between depths and locations. For the following analyses only mean values of the investigated depths were used. Principal component analysis (PCA, varimax-normalized) was performed to evaluate the parameters which were mainly responsible for the observed biological variations in the Alte Donau. For ANOVA, simple linear correlation, multiple linear, stepwise regression analysis and PCA analyses data not meeting the requirements of homoscedaticity and normal distribution (Shapiro-Wilks test) were loglo- transformed after adding 1 to the variable.
RESULTS
In general, results from both investigated stations were similar. Thus, only Stn 1 was considered in the text and most figures. For statistical analyses and inte- grative calculations on material fluxes in the system, data from Stn 2 were included.
Physical and chemical parameters
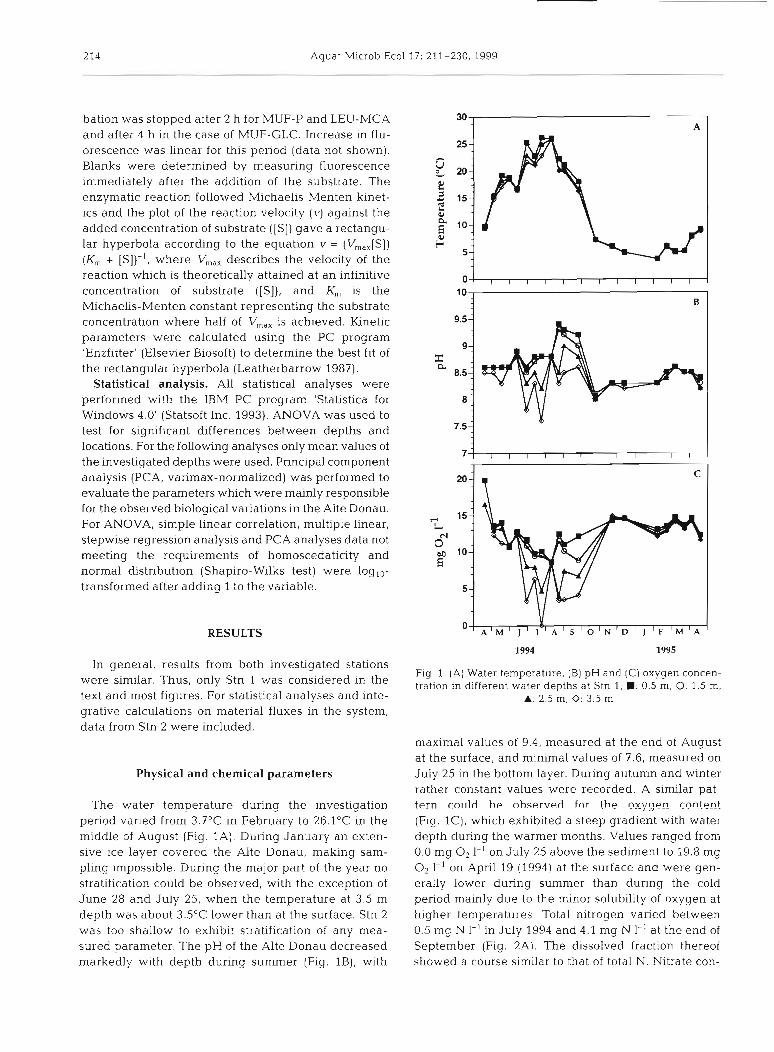
The water temperature during the investiaation period varied from 3.7"C in February to 26.1°C in the middle of August (Fig. 1A). During January an exten- sive ice layer covered the Alte Donau, making sam- pling impossible. During the major part of the year no stratification could be observed, with the exception of June 28 and July 25, when the temperature at 3.5 m depth was about 3.5"C lower than at the surface. Stn 2 was too shallow to exhibit stratification of any mea- sured parameter. The pH of the Alte Donau decreased markedly with depth during summer (Fig. l B ) , with
Fig. 1. (A) Water temperature. (B) pH and (C) oxygen concen- tration in different water depths at Stn 1; M: 0.5 m, 0: 1.5 m.
A: 2 5 m, 0: 3.5 m
maximal values of 9.4, measured at the end of August at the surface, and minimal values of 7.6, measured on July 25 in the bottom layer. During autumn and winter rather constant values were recorded. A similar pat- tern r o i ~ l d h~ nhserverl for the oxygen content (Fig. l C ) , which exhibited a steep gradient with water depth during the warmer months. Values ranged from 0.0 mg O2 1-l on July 25 above the sediment to 19.8 mg O2 1-l on April 19 (1994) at the surface and were gen- erally lower during summer than during the cold period mainly due to the minor solubility of oxygen at higher temperatures. Total nitrogen varied between 0.5 mg N 1-' in July 1994 and 4.1 mg N 1-' at the end of September (Fig. 2A). The dissolved fraction thereof showed a course similar to that of total N. Nitrate con-
Klrschner et al.: Matenal fluxes through the procaryotic compartment 215
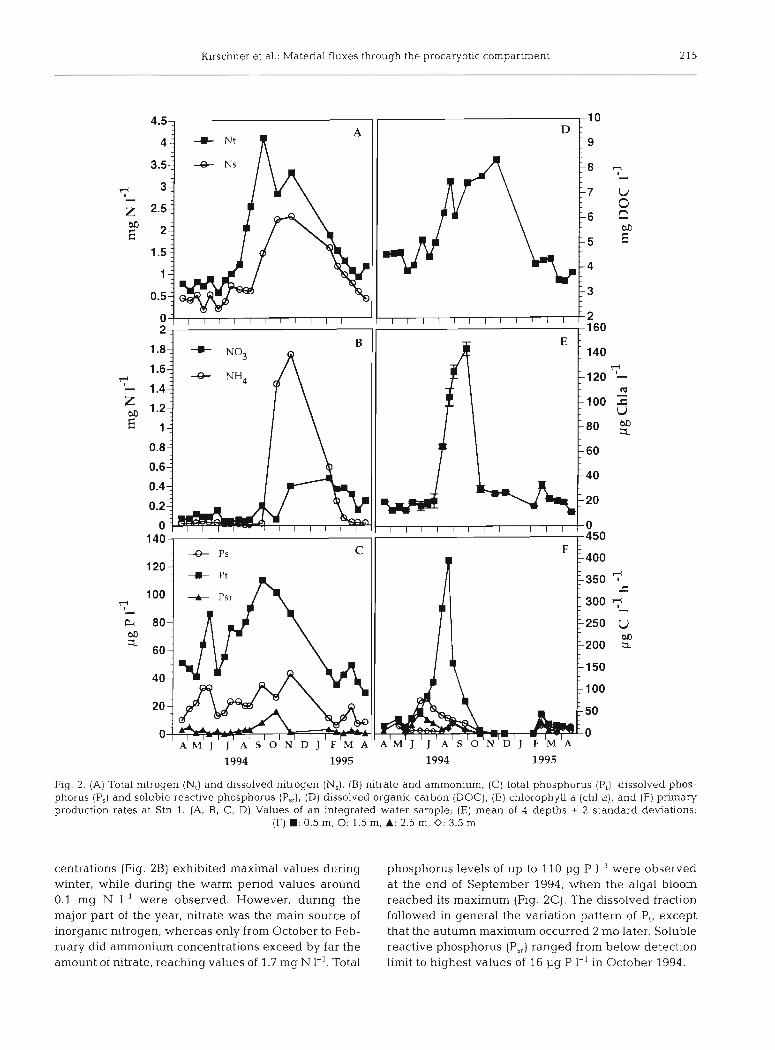
Fig. 2. (A) Total nitrogen (N,) and dissolved nitrogen (N,), (B) nitrate and ammonium, (C) total phosphorus (P,), dissolved phos- phorus (P,) and soluble reactive phosphorus (P,,), (D) dissolved organic carbon (DOC), (E) chlorophyll a (chl a) , and (F) primary production rates at Stn 1. (A, B, C, D) Values of an integrated water sample; (E) mean of 4 depths i 2 standard deviations,
(F) W : 0.5 m, 0: 1.5 m, A: 2.5 m, 0: 3.5 n~
centrations (Fig. 2B) exhibited maximal values during phosphorus levels of up to 110 1-19 P 1-' were observed winter, while during the warm period values around at the end of September 1994, when the algal bloom 0.1 mg N 1-' were observed. However, during the reached its maximum (Fig. 2C). The dissolved fraction major part of the year, nitrate was the main source of followed in general the variation pattern of P,, except inorganic nitrogen, whereas only from October to Feb- that the autumn maximum occurred 2 mo later. Soluble ruary did ammonium concentrations exceed by far the reactive phosphorus (P,,) ranged from below detection amount of nitrate, reaching values of 1.7 mg N I-'. Total limit to highest values of 16 1-19 P 1-' in October 1994.
216 Aquat Microb Ecol 17: 21 1-230, 1999
DOC, chl a and primary production
DOC ranged from lowest values of 3.2 mg DOC 1-' in April 1994 to highest values of 8.4 mg 1-' at the end of November (Fig. 2D). Low DOC concentrations were ob- served in spring 1994, thereafter increasing strongly from the middle of June until September, concomitantly with the development of the cyanobacterial bloom, as documented by Dokulil & Mayer (1996). Highest DOC concentrations, however, were recorded at both stations in November, after the fast decline of chl a in October (Fig. 2E). During winter, values dropped again to the same level as in spring 1994. Chl a exhibited a marked peak in September with values of more than 130 pg 1-' (Fig. 2E). The drastic increase in chl a during August and September was caused by a fast increase of filarnentous cyanobacteria (Cylindrospermopsis raciborskii and Limnothrix redekei, microscopic observation), con- tributing more than YUYO to total phytoplanktonic bio- mass (Dokulil & Mayer 1996). Even during winter chl a values remained above 11 pg 1-l. No significant differ- ence in chl a values could be observed between the in- vestigated depths. Phytoplanktonic primary production was below detection limit during the period from December to the beginning of February. Maximal rates of 400 pg C l-l h-' were measured at 0.5 m depth at the end of August and September (Fig. 2F). During the summer bloom primary production showed a steep decrease with depth. In the middle of February 1995, concomitant with a small peak in chl a concentration, a peak in primary production could be observed.
Bacterial abundance, cell volumes and biomass
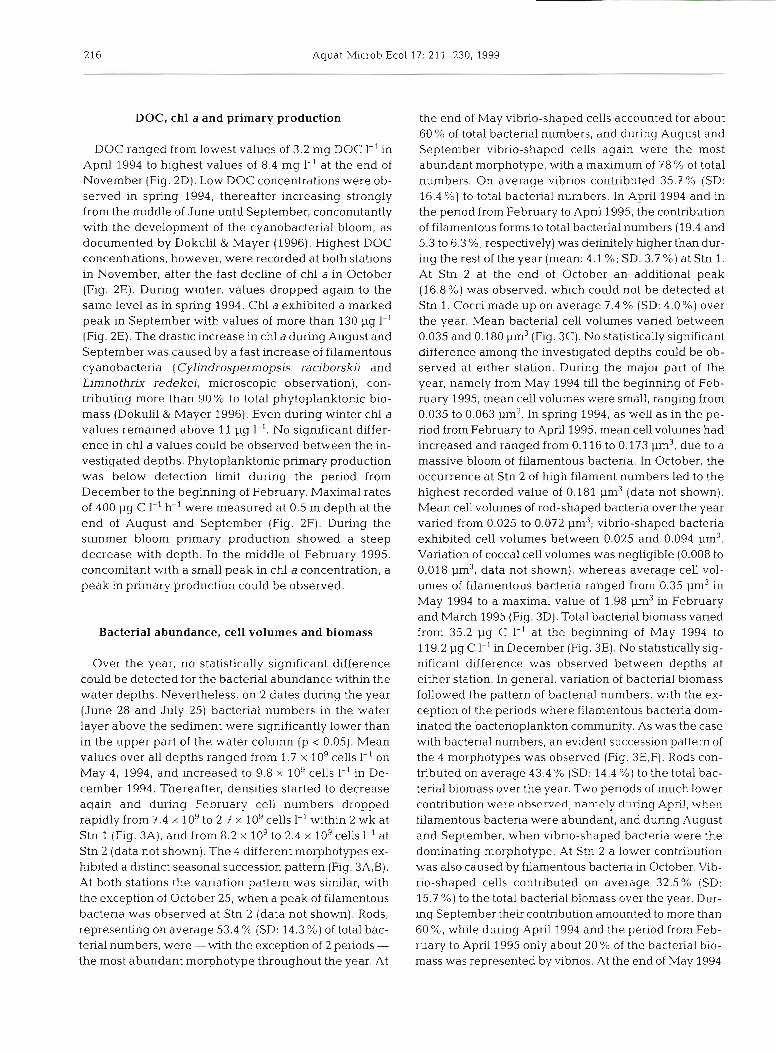
Over the year, no statistically significant difference could be detected for the bacterial abundance within the water depths. Nevertheless, on 2 dates during the year (June 28 and July 25) bacterial numbers in the water layer above the sediment were significantly lower than in the upper part of the water column (p i 0.05). Mean values over all depths ranged from 1.7 X log cells 1-' on May 4, 1994, and increased to 9.8 X log cells 1-' in De- cember 1994. Thereafter, densities started to decrease again and durinq February cell numbers dropped rapidly from 7.4 X 10' to 2.7 X log cells 1-' within 2 wk at Stn 1 (Fig. 3A), and from 8.2 X log to 2.4 X 10⁹cells I-' at Stn 2 (data not shown). The 4 different morphotypes ex- hibited a distinct seasonal succession pattern (Fig. 3A,B). At both stations the variation pattern was similar, with the exception of October 25, when a peak of filamentous bacteria was observed at Stn 2 (data not shown). Rods, representing on average 53.4 % (SD: 14.3 %) of total bac- terial numbers, were - with the exception of 2 periods - the most abundant morphotype throughout the year. At
the end of May vibrio-shaped cells accounted for about 60 % of total bacterial numbers, and during August and September vibrio-shaped cells again were the most abundant morphotype, with a maximum of 78 % of total numbers. On average vibnos contributed 35.7 % (SD: 16.4 %) to total bacterial numbers. In April 1994 and in the period from February to April 1995, the contribution of filamentous forms to total bacterial numbers (19.4 and 5.3 to 6.3 %, respectively) was definitely higher than dur- ing the rest of the year (mean: 4.1 %; SD: 3.7%) at Stn l . At Stn 2 at the end of October an additional peak (16.8 %) was observed, which could not be detected at Stn 1. Cocci made up on average 7.4 % (SD: 4.0 %) over the year. Mean bacterial cell volumes varied between 0.035 and 0.180 pm3 (Fig. 3C). No statistically significant difference among the investigated depths could be ob- served at either station. During the major part of the year, namely from May 1994 till the beginning of Feb- ruary 1995, mean cell volumes were small, ranging from 0.035 to 0.063 pm3 In spring 1994, as well as in the pe- riod from February to April 1995, mean cell volumes had increased and ranged from 0.116 to 0.173 pm3, due to a massive bloom of filamentous bacteria. In October, the occurrence at Stn 2 of high filament numbers led to the highest recorded value of 0.181 pm3 (data not shown). Mean cell volumes of rod-shaped bacteria over the year varied from 0.025 to 0.072 pm3; vibrio-shaped bacteria exhibited cell volumes between 0.025 and 0.094 pm3. Variation of coccal cell volumes was negligible (0.008 to 0.018 pm3, data not shown), whereas average cell vol- umes of filamentous bacteria ranged from 0.35 pm3 in May 1994 to a maximal value of 1.98 pm3 in February and March 1995 (Fig. 3D). Total bacterial biomass varied from 35.2 pg C 1-' at the beginning of May 1994 to 119.2 pg C 1-' in December (Fig. 3E). No statistically sig- nificant difference was observed between depths at either station. In general, variation of bacterial biomass followed the pattern of bacterial numbers, with the ex- ception of the periods where filamentous bacteria dom- inated the bacterioplankton community. As was the case with bacterial numbers, an evident succession pattern of the 4 morphotypes was observed (Fig. 3E,F). Rods con- tributed on average 43.4 % (SD: 14.4 %) to the total bac- terial biomass over the year. Two periods of much lower contribution were nhserv~rl; namely dunLng Apr?!, when filamentous bacteria were abundant, and during August and September, when vibrio-shaped bacteria were the dominating morphotype. At Stn 2 a lower contribution was also caused by filamentous bacteria in October. Vib- no-shaped cells contributed on average 32.5% (SD: 15.7 %) to the total bacterial biomass over the year. Dur- ing September their contribution amounted to more than 60 %, while during April 1994 and the period from Feb- ruary to April 1995 only about 20% of the bacterial bio- mass was represented by vibrios. At the end of May 1994
K~rschner et al. Material f l u e s through the procaryotic compartment 217
Fig. 3 (A, B) Numbers, (C, D) cell volun~es and (E, F) biomass of total bacteria (T), rods (R) , vibrios (V) , cocci (C) and filamentous bactena (F) at Stn 1. Bars represent 2 standard deviations of the data from the 4 depths
another peak with values around 60 % was observed at both stations. Coccal biomass averaged 2.3 % (SD: 1.1) over the investigation period, thus being rather negligi- ble throughout the year. Filamentous bacteria, however, exhibited biomass maxima during April 1994 and the pe- riod from February to April 1995, when values of 62 % (Stn 1) and 44 % (Stn 2) of total bacterial biomass were reached. At Stn 2 one additional peak was observed at the end of October with a value of 63 %.
Bacterial leucine incorporation and secondary production
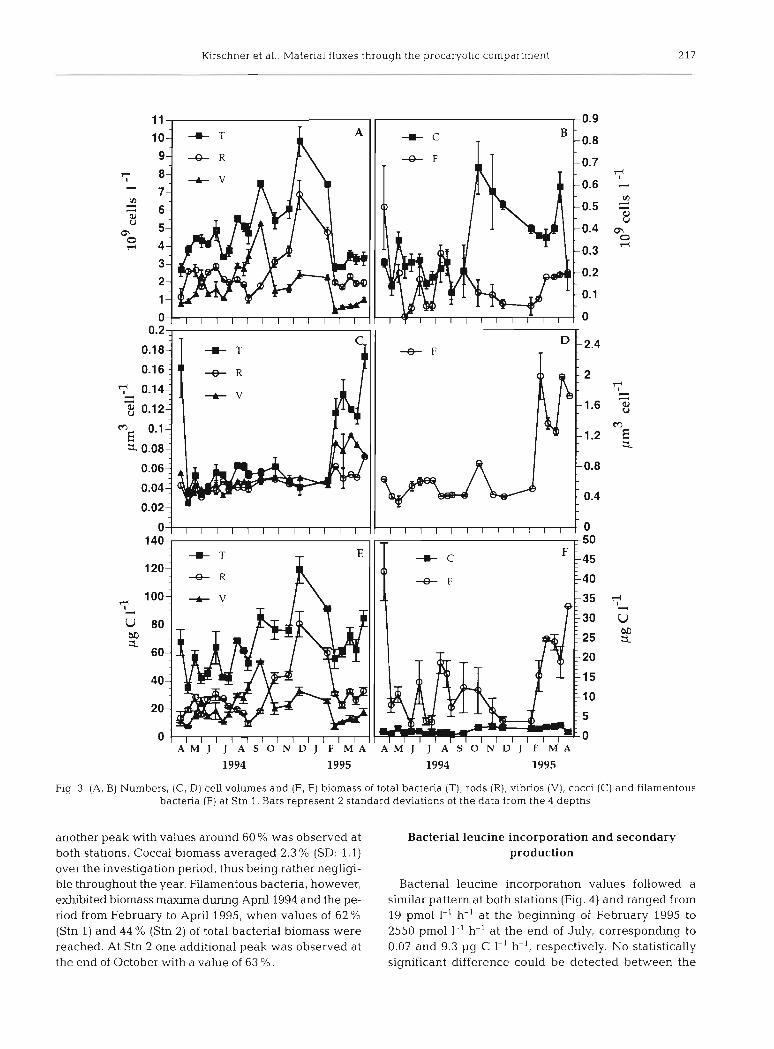
Bacterial leucine incorporation values followed a similar pattern at both stations (Fig. 4 ) and ranged from 19 pm01 1-' h-' at the beginning of February 1995 to 2550 pm01 1-' h-' at the end of July, corresponding to 0.07 and 9.3 pg C 1-' h-', respectively. No statistically significant difference could be detected between the
218 Aquat Microb Ecol 17: 211-230, 1999
DISCUSSION
Enzyme activity
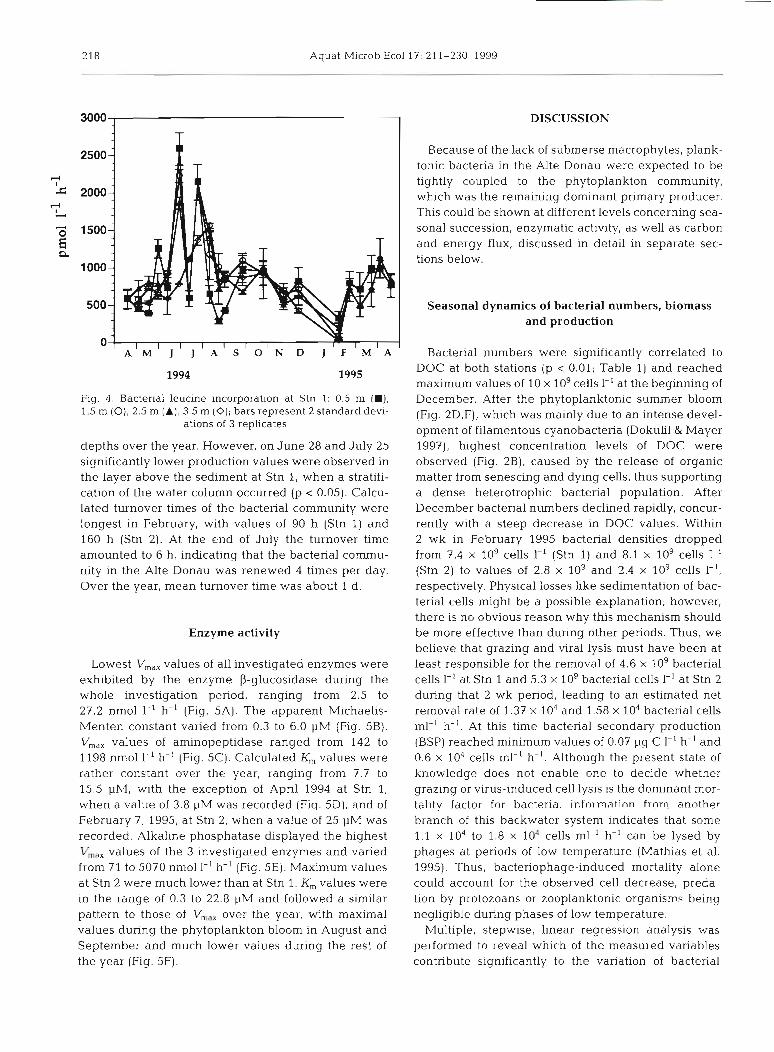
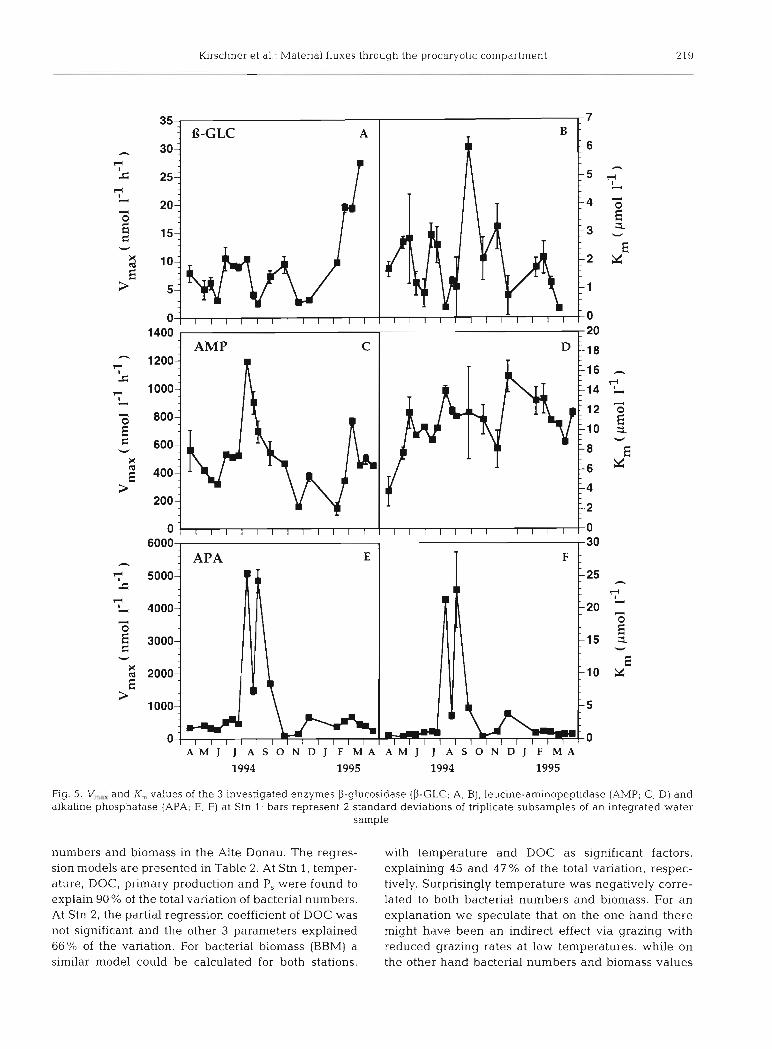
Lowest V,,,,, values of all investigated enzymes were exhibited by the enzyme P-glucosidase during the whole investigation period, ranging from 2.5 to 27.2 nmol I-' h-' (Fig. 5A). The apparent Michaelis- Menten constant varied from 0.3 to 6.0 PM (Fig. 5B). V,,, values of aminopeptidase ranged from 142 to 1198 nmol 1-' h-' (Fig. 5C). Calculated K, values were rather constant over the year, ranging from 7.7 to 15.5 FM, with the exception of April 1994 at Stn 1, when a value of 3.8 pM was recorded (Fiq. 5D), and of February 7, 1995, at Stn 2, when a value of 25 pM was recorded. Alkaline phosphatase displayed the highest V,,, values of the 3 investigated enzymes and varied from 71 to 5070 nmol 1-' h-' (Fig. 5E). Maximum values at Stn 2 were much lower than at Stn 1. K,,, values were in the range of 0.3 to 22.8 pM and followed a similar pattern to those of V,,,,, over the year, with maximal values during the phytoplankton bloom in August and September and much lower values during the rest of the year (Fig. 5F).
J
2500- Because of the lack of submerse macrophytes, plank- tonic bacteria in the Alte Donau were expected to be
7' tightly coupled to the phytoplankton community, * 2000- which was the remaining dominant primary producer.
7' m This could be shown at different levels concerning sea-
" 1500- sonal succession, enzymatic activity, as well as carbon I and energy flux, discussed in detail in separate sec- P
1000- tions below.
500- Seasonal dynamics of bacterial numbers, biomass and production
0 A I M I J J A S O N D J F M A
I I I I I I I I - I I Bacterial numbers were significantly correlated to
1994 1995 DOC at both stations (p < 0.01; Table 1) and reached maximum values of 10 X 10' cells 1-' at the beginning of
Fig. 4. Bacieriai leucine incorporat~on at Stn 1: 0.5 m (H), December. After the phytoplanktonic summer bloom 1.5 m (O), 2.5 m (A), 3.5 m (0); bars represent 2 standard devi- (Fig. 2D,F), which was mainly due to an intense devel-
ations of 3 replicates opment of filamentous cyanobacteria (Dokulil & Mayer depths over the year. However, on June 28 and July 25 1997), highest concentration levels of DOC were significantly lower production values were observed in observed (Fig. 2B), caused by the release of organic the layer above the sediment at Stn 1, when a stratifi- matter from senescing and dying cells, thus supporting cation of the water column occurred (p < 0.05). Calcu- a dense heterotrophic bacterial population. After lated turnover times of the bacterial community were December bacterial numbers declined rapidly, concur- longest in February, with values of 90 h (Stn 1) and rently with a steep decrease in DOC values. Within 160 h (Stn 2). At the end of July the turnover time 2 wk in February 1995 bacterial densities dropped amounted to 6 h, indicating that the bacterial cornmu- from 7.4 X log cells I-' (Stn 1) and 8.1 X 10⁹ cells 1-' nity in the Alte Donau was renewed 4 times per day. (Stn 2) to values of 2.8 X log and 2.4 X log cells I-', Over the year, mean turnover time was about 1 d. respectively. Physical losses like sedimentation of bac-
terial cells might be a possible explanation; however, there is no obvious reason why this mechanism should be more effective than during other periods. Thus, we believe that grazing and viral lysis must have been at least responsible for the removal of 4.6 X log bacterial cells 1-' at Stn 1 and 5.3 X l o g bacterial cells 1-' at Stn 2 during that 2 wk period, leading to an estimated net removal rate of 1.37 X 10⁴ and 1.58 X 10⁴ bacterial cells ml-' h-'. At this time bacterial secondary production (BSP) reached minimum values of 0.07 pg C 1-' h-' and 0.6 X 10⁴ cells ml-' h-'. Although the present state of knowledge does not enable one to decide whether grazing or virus-induced cell lysis is the dominant mor- tality factor for bacteria, infnrmatinn frnV another branch of this backwater system indicates that some 1.1 X 10⁴ to 1.8 X 10⁴ cells ml-' h-' can be lysed by phages at periods of low temperature (Mathias et al. 1995). Thus, bacteriophage-induced mortality alone could account for the observed cell decrease, preda- tion by protozoans or zooplanktonic organisms being negligible during phases of low temperature.
Multiple, stepwise, linear regression analysis was performed to reveal which of the measured variables contribute significantly to the variation of bacterial
l r schner et al.: Material fluxes through the procaryotic compartment 219
Fig. 5. c,, and I(, values of the 3 investigated enzymes P-glucosidase (P-GLC; A. B) , leucine-aminopeptldase (AMP; C, D) and alkaline phosphatase (APA; E, F) at Stn 1; bars represent 2 standard deviations of triplicate subsamples of an integrated water
sample
. .""
1 2
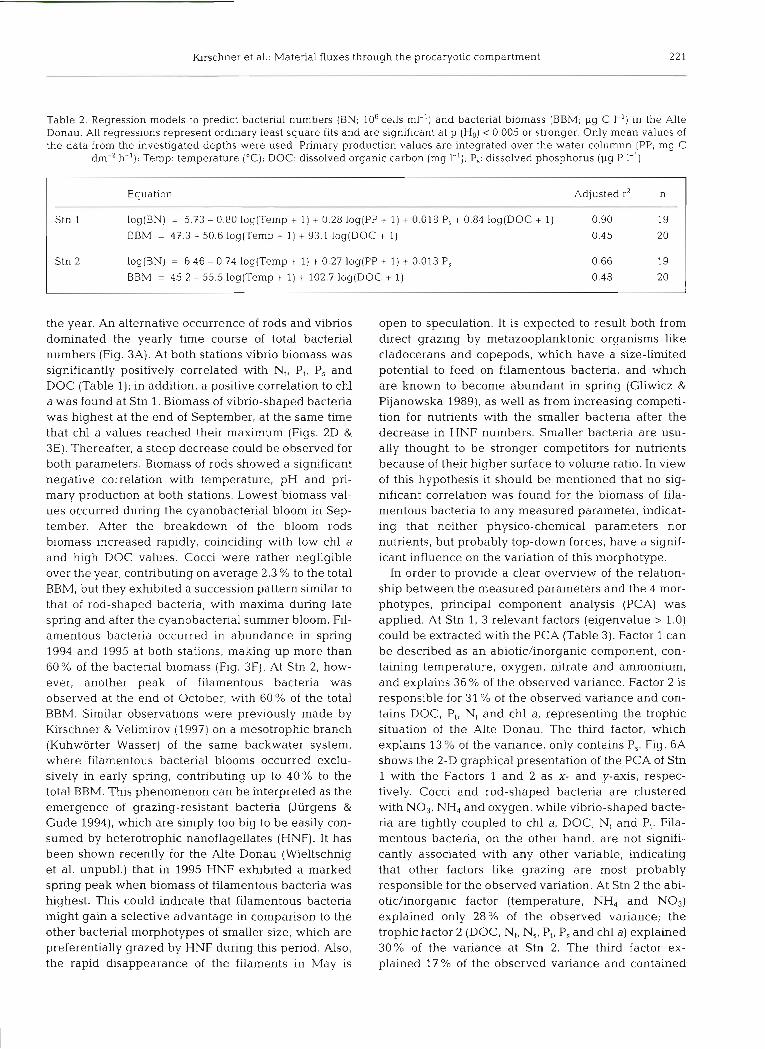
numbers and biomass in the Alte Donau. The regres- sion models are presented in Table 2. At Stn 1, temper- ature, DOC, primary production and P, were found to explain 90 % of the total variation of bacterial numbers. At Stn 2, the partial regression coefficient of DOC was not significant and the other 3 parameters explained 66% of the variation. For bacterial biomass (BBM) a similar model could be calculated for both stations,
0 6000
A :
with temperature and DOC as significant factors, explaining 45 and 47% of the total variation, respec- tively. Surprisingly temperature was negatively corre- lated to both bacterial numbers and biomass. For an explanation we speculate that on the one hand there might have been an indirect effect via grazing with reduced grazing rates at low temperatures, while on the other hand bacterial numbers and biomass values
, , , , , , , , , , , , APA E
l l , , l l l , ~
- 25
l l l l l l l l l l l l
A M J J A S O N D J F M A A M J J A S O N D J F M A
0 30
Aquat Microb Ecol 17: 211-230, 1999
. . . . . . 1 0 0 r . l . (D
. . . . ' Y " " 1 1 : . . . .
n m - ( D m o m ? , , ? m , ? , , , 8 q 8 ? 8 8 ~ ~ m ~ ~ o m m m I I
. . . . a . . . . . . . U I jj ,j; i ~ i U ) U m m y " , , ~ ~ " w ' w " ' ~ " " " "
. . . . . . . - m m (0 v) 6 5 y m 8 ? y y r f p y t t t s ' Y " '
. . . . . . 0 N v) v) a (D
. . . . . . . . . . . . a . : . . m OD m m v) -r PI *
t-"
were highest during winter because of the high DOC levels during that time.
BSP showed only a weak posi- tive correlation with temperature in the Alte Donau (r = 0.41; p < 0.1) at both stations. For several freshwater and marine ecosys- tems (e.g. Wikner & Hagstrom 1991, Autio 1992, Pace & Cole 1994) and for the backwater Kiih- worter Wasser (Kirschner & Veli- mirov 1997) temperature was found to be significantly corre- lated to BSP, and Schweitzer & Simon (1994) presented evidence that bacterial production in tem- perate freshwater ecosystems is mainly controlled by temperature and substrate. In the Alte Donau none of the BSP peaks coincided with the chl a or DOC maxima, but occurred at the end of June and July. At this time we recorded rather low phytoplanktonic bio- mass and DOC values, while tem- perature exhibited its highest val- ues for the year. However, a striking feature was that maxima in bacterial numbers and biomass were found during periods of low temperatures, namely December, thus being uncoupled from the maximum bacterial production events in summer. Although bac- terial production ranged from only 1.7 to 2.3 pg C 1-' h-' for December, corresponding bio- masses amounted to 104- 119 pg C I-' (Fig. 3E), 2 to 3 times higher than in June-July. The fact that such low production rates are suf- ficient to support high bacterial biomasses is seen as an indication fnr a w~alreninr; ef !he tcp-.lewr? effect on the bacterial compart- ment in late autumn and winter as compared to summer.
Bacterial morphotype succession
The morphotype composition of the bacterioplankton in the Alte nnnaii rhnnnpd m a r k ~ r l l v nvpr
Grschner et al.: Material fluxes through the procaryotic compartment 221
the year. An alternative occurrence of rods and vibrios dominated the yearly time course of total bacterial numbers (Fig. 3A). At both stations vibrio biomass was significantly positively correlated with N,, P,, P, and DOC (Table 1); in addition, a positive correlation to chl a was found at Stn 1. Biomass of vibrio-shaped bacteria was highest at the end of September, at the same time that chl a values reached their maximum (Figs. 2D & 3E). Thereafter, a steep decrease could be observed for both parameters. Biomass of rods showed a significant negative correlation with temperature, pH and pri- mary production at both stations. Lowest biomass val- ues occurred during the cyanobacterial bloom in Sep- tember. After the breakdown of the bloom rods biomass increased rapidly, coinciding with low chl a and high DOC values. Cocci were rather negligible over the year, contributing on average 2.3 % to the total BBM, but they exhibited a succession pattern similar to that of rod-shaped bacteria, with maxima during late spring and after the cyanobacterial summer bloom. Fil- amentous bacteria occurred in abundance in spring 1994 and 1995 at both stations, making up more than 60% of the bacterial biomass (Fig. 3F). At Stn 2, how- ever, another peak of filamentous bacteria was observed at the end of October, with 60% of the total BBM. Similar observations were previously made by Kirschner & Velimirov (1997) on a mesotrophic branch (Kiihworter Wasser) of the same backwater system, where filamentous bacterial blooms occurred exclu- sively in early spring, contributing up to 40% to the total BBM. This phenomenon can be interpreted as the emergence of grazing-resistant bacteria (Jiirgens & Giide 1994), which are simply too big to be easily con- sumed by heterotrophic nanoflagellates (HNF). It has been shown recently for the Alte Donau (Wieltschnig et al. unpubl.) that in 1995 HNF exhibited a marked spring peak when biomass of filamentous bacteria was highest. This could indicate that filamentous bacteria might gain a selective advantage in comparison to the other bacterial morphotypes of smaller size, which are preferentially grazed by HNF during this period. Also, the rapid disappearance of the filaments in May is
open to speculation. It is expected to result both from direct grazing by metazooplanktonic organisms like cladocerans and copepods, which have a size-limited potential to feed on filamentous bacteria, and which are known to become abundant in spring (Gliwicz & Pijanowska 1989), as well as from increasing competi- tion for nutrients with the smaller bacteria after the decrease in HNF numbers. Smaller bacteria are usu- ally thought to be stronger competitors for nutrients because of their higher surface to volume ratio. In view of this hypothesis it should be mentioned that no sig- nificant correlation was found for the biomass of fila- mentous bacteria to any measured parameter, indicat- ing that neither physico-chemical parameters nor nutrients, but probably top-down forces, have a signif- icant influence on the variation of this morphotype.
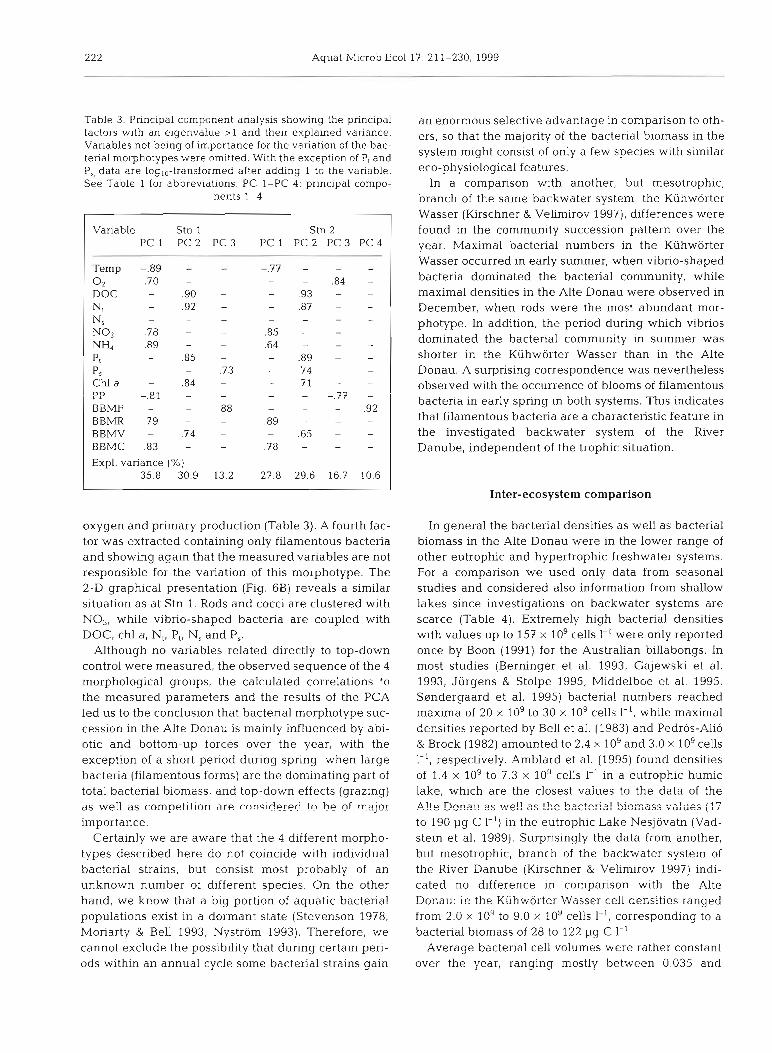
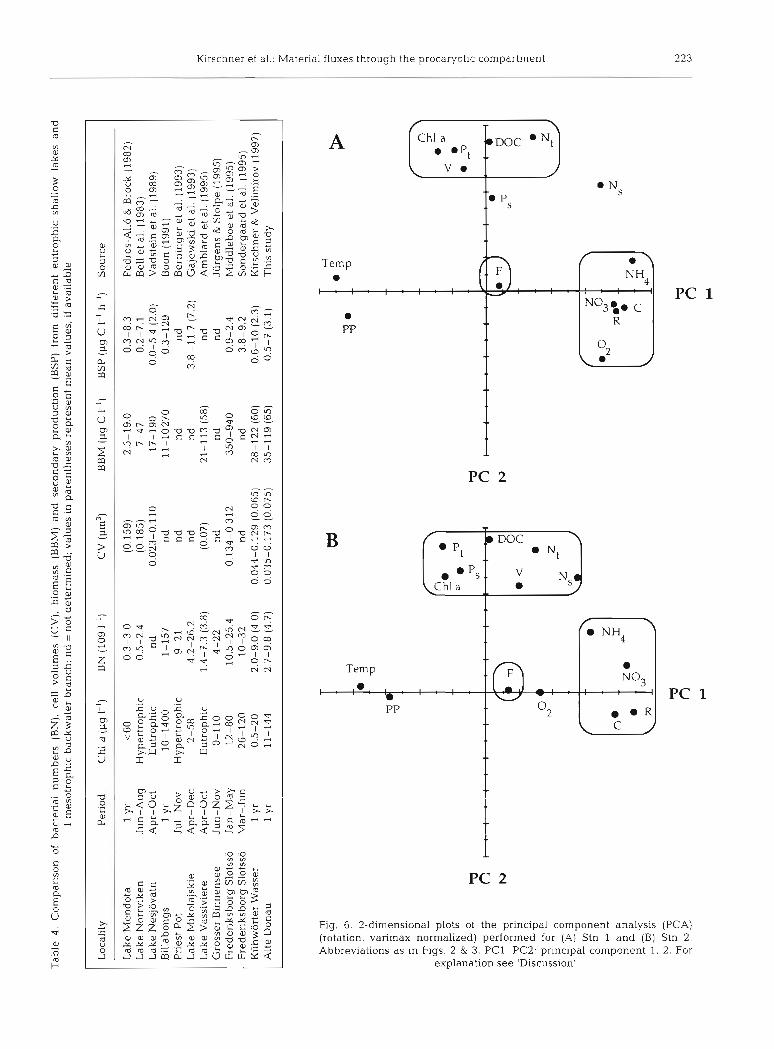
In order to provide a clear overview of the relation- ship between the measured parameters and the 4 mor- photypes, principal component analysis (PCA) was applied. At Stn 1, 3 relevant factors (eigenvalue > 1.0) could be extracted with the PCA (Table 3). Factor 1 can be described as an abiotic/inorganic component, con- taining temperature, oxygen, nitrate and ammonium, and explains 36 % of the observed variance. Factor 2 is responsible for 31 % of the observed variance and con- tains DOC, P,, N, and chl a, representing the trophic situation of the Alte Donau. The third factor, which explains 13 % of the variance, only contains P,. Fig. 6A shows the 2-D graphical presentation of the PCA of Stn 1 with the Factors 1 and 2 as X- and y-axis, respec- tively. Cocci and rod-shaped bacteria are clustered with NO3, NH, and oxygen, while vibrio-shaped bacte- ria are tightly coupled to chl a, DOC, N, and P,. Fila- mentous bacteria, on the other hand, are not signifi- cantly associated with any other variable, indicating that other factors like grazing are most probably responsible for the observed variation. At Stn 2 the abi- otichnorganic factor (temperature, NH, and NO3) explained only 28% of the observed variance; the trophic factor 2 (DOC, N,, N,, P,, P, and chl a) explained 30% of the variance at Stn 2. The third factor ex- plained 17 % of the observed variance and contained
222 Aquat Microb Ecol 17: 211-230, 1999
Table 3. Principal component analysis showing the principal factors wlth an eigenvalue > l and their explained variance. Variables not being of importance for the variation of the bac- terial morphotypes were omitted. With the exception of P, and P,, data are log,o-transformed after adding 1 to the variable. See Table 1 for abbreviations. PC 1-PC 4 : principal compo-
nents 1-4
Variable Stn 1 Stn 2 PC 1 PC 2 PC 3 PC 1 PC 2 PC 3 PC 4
Temp -.89 - - -.77 - - - 0 2 .70 - - - - .84 -
DOC - .90 - - .93 - -
Nt - .92 - - .87 - -
N, - - - - - NO3 .?8 - - .85 - - -
NH4 .89 - - 64 - - -
pt - .85 - - .89 - -
P S - - -.73 - .74 - -
C h l a - .84 - - 71 - PP -.S1 - - - - -.77 -
BBMF - - .88 - - .92 BBMR .?9 - - .89 - - -
BBMV - .74 - - .65 - -
BBMC .83 - - .78 - - Expl. variance (%)
35.8 30.9 13.2 27.8 29.6 16.7 10.6
oxygen and primary production (Table 3). A fourth fac- tor was extracted containing only filamentous bacteria and showing again that the measured variables are not responsible for the variation of this morphotype. The 2-D graphical presentation (Fig. 6B) reveals a similar situation as at Stn 1. Rods and cocci are clustered with No3, while vibrio-shaped bacteria are coupled with DOC, chl a, N,, P,, N, and P,.
Although no variables related directly to top-down control were measured, the observed sequence of the 4 morphological groups, the calculated correlations to the measured parameters and the results of the PCA led us to the conclusion that bacterial morphotype suc- cession in the Alte Donau is mainly influenced by abi- otic and bottom-up forces over the year, with the exception of a short period during spring, when large bacteria (filamentous forms) are the dominating part of total bacterial biomass, and top-down effects (grazing) as well as competition a r e rnn*irlere? tn he cf ma;nr
importance. Certainly we are aware that the 4 different morpho-
types described here do not coincide with individual bacterial strains, but consist most probably of an unknown number of different species. On the other hand, we know that a big portion of aquatic bacterial populations exist in a dormant state (Stevenson 1978, Moriarty & Bell 1993, Nystrom 1993). Therefore, we cannot exclude the possibility that during certain peri- ods withln an annual cycle some bacterial strains gain
an enormous selective advantage in comparison to oth- ers, so that the majority of the bacterial biomass in the system might consist of only a few species with similar eco-physiological features.
In a comparison with another, but mesotrophic, branch of the same backwater system, the Kuhworter Wasser (Kirschner & Velimirov 1997). differences were found in the community succession pattern over the year. Maximal bacterial numbers in the Kuhworter Wasser occurred in early summer, when vibrio-shaped bacteria dominated the bacterial community, while maximal densities in the Alte Donau were observed in December, when rods were the most abundant mor- photype. In addition, the period during which vibrios dominated the bacterial community in summer was shorter in the Kuhworter Wasser than in the Alte Donau. A surprising correspondence was nevertheless observed with the occurrence of blooms of filamentous bacteria in early spring in both systems. This indicates that filamentous bacteria are a characteristic feature in the investigated backwater system of the River Danube, independent of the trophic situation.
Inter-ecosystem comparison
In general the bacterial densities as well as bacterial biomass in the Alte Donau were in the lower range of other eutrophic and hypertrophic freshwater systems. For a comparison we used only data from seasonal studies and considered also information from shallow lakes since investigations on backwater systems are scarce (Table 4). Extremely high bacterial densities with values up to 157 X 10' cells 1-' were only reported once by Boon (1991) for the Australian billabongs. In most studies (Berninger et al. 1993, Gajewski et al. 1993, Jiirgens & Stolpe 1995, Middelboe et al. 1995, Sandergaard et al. 1995) bacterial numbers reached maxima of 20 X log to 30 X 109 cells 1-l, while maximal densities reported by Bell et al. (1983) and Pedr6s-Alio & Brock (1982) amounted to 2.4 X 10"nd 3.0 X l o g cells I-', respectively. Arnblard et al. (1995) found densities of 1.4 X log to 7.3 X log cells 1-' in a eutrophic humic lake, which are the closest values to the data of the Plte Per??u 2s ye!! 1s the bactcr;,a! Sicia,nss va!i;e; (17 to 190 pg C l-l) in the eutrophic Lake Nesjovatn (Vad- stein et al. 1989). Surprisingly the data from another, but mesotrophic, branch of the backwater system of the River Danube (Kirschner & Velimirov 1997) indi- cated no difference in comparison with the Alte Donau: in the Kuhworter Wasser cell densities ranged from 2.0 X 1 0 9 0 9.0 X log cells I-', corresponding to a bacterial biomass of 28 to 122 pg C I-'.
Average bacterial cell volumes were rather constant over the year, ranging mostly between 0.035 and
Tab
le 4
. C
om
par
iso
n o
f ba
cter
ial
nu
mb
ers
(BN
), c
ell
vo
lum
es (
CV
), b
iom
ass
(BB
M)
and
sec
on
dar
y p
rod
uct
ion
(B
SP
) fr
om d
iffe
ren
t eu
tro
ph
ic s
hall
ow l
akes
an
d
1 m
esot
roph
ic b
ack
wat
er b
ran
ch;
nd
= n
ot d
eter
min
ed; v
alu
es i
n p
aren
thes
es r
epre
sen
t m
ean
val
ues
, if
avai
lab
le
Loc
alit
y P
erio
d C
hl
a (p
g I-
') B
N (
109
I-')
C
V (
pm
3)
BB
M (
pg
C I
-')
BSP
(p
g C
1-'
h-'
) S
ou
rce
Lak
e M
end
ota
L
ake
Nor
rvik
en
Lak
e N
esjo
vatn
B
illa
bong
s P
ries
t P
ot
Lak
e M
ikol
ajsk
ie
Lak
e V
assi
vier
e G
ross
er B
inn
ense
e F
red
erik
sbo
rg S
lots
so
Fre
der
iksb
org
Slo
tsso
K
iihw
orte
r W
asse
r A
lte
Don
au
1 Y
r Ju
n-A
ug
A
pr-O
ct
1 Y
r Ju
l-N
OV
A
pr-D
ec
Apr
-Oct
Ju
n-N
ov
Ja
n-M
ay
Mar
-Ju
n
1 Y
r 1
Yr
< 6
0
Hy
per
tro
ph
ic
Eu
tro
ph
ic
10-1
400
Hyp
ertr
ophi
c 2-
58
Eu
tro
ph
ic
0-11
0 12
-80
26-1
20
0.5-
20
11-1
44
Ped
ros-
A11
0 &
Bro
ck (
19
82
) B
ell
et a
l. (
1983
) V
adst
ein
et a
l. (
1989
) B
oon
(199
1)
Ber
nin
ger
et
al.
(19
93
) G
ajew
ski
et a
l. (
19
93
) A
mb
lard
et
al. (
19
95
) Ji
irg
ens
& S
tolp
e (1
995)
M
idd
leb
oe
et a
l. (
1995
) S
snd
erg
aard
et
al. (
1995
) K
irsc
hner
& V
elim
irov
(19
97)
Th
is s
tud
y
-
2 "
.3
--
-Q
* 9
t:
::
::
::
::
:
::
:=
:.
l
. 'j U
7
. ,
<.
0 8 . Z
f z
*
-- \
0 ..
.,.p
W
. ;d..
--
W, Z
\
224 Aquat Microb Ecol I f : 21 1-230, 1999
0.060 pm3 cell-', with the exception of periods when fil- amentous bacteria dominated the system. In the Kiih- worter Wasser (Kirschner & Velimirov 1997) filaments with a length of up to 60 pm were found and were reported to belong to the largest bacteria occurring in the aquatic environment (Sime-Ngando et al. 1991). In the hypertrophic lake 'GroRer Binnensee', filament lengths of up to 20 pm were found during a bloom in August (Jiirgens & Stolpe 1995). In the present study filamentous bacteria reached a length of up to 120 pm (5.6 pm3), thus being twice as long as those in the mesotrophic Kiihworter Wasser and 6 times longer than those in the 'GroRer Binnensee'. Cell volumes were only reported in a few studies (Table 4), usually being on average bigger than those in the Alte Donau. Only Arnblard et al. (1995) found a mean cell volume of 0.07 pm3 in the eutrophic Lake Vassiviere, and in Lake Nesjovatn cell volumes ranged between 0.023 and 0.110 pm3 (Vadstein et al. 1989). In the mesotrophic Kiihworter Wasser similar mean cell volumes ranging from 0.044 to 0.129 pm3 were measured.
In general BSP rates were in the range of other com- parable ecosystems (Table 4). With the exception of the Australian billabongs (Boon 1991), maximal produc- tion rates were always in the magnitude of the values in the Alte Donau (5.4 to 11.7 pg C 1-' h-'). Therefore, we assume that our BSP rates and the used conversion factors are reliable estimates for the calculation of a carbon budget for the Alte Donau (see below).
Enzyme activity
Bacterial numbers showed a strong significant nega- tive correlation with P-glucosidase (P-GLC) activity in our system (Table 1). A positive correlation between these 2 parameters was observed by Chrost & Over- beck (1990) and Chrost (1989) in Lake PluDsee during a phytoplankton bloom. In the Alte Donau, however, this negative correlation might be explained by the fact that P-glucosidase is an enzyme which is inducible and endproduct controlled. Thus, a low P-GLC activity indicates a large amount of readily utilizable mono- and disaccharids favo.uring bacterial growth and lead- ing to higher bacterial numbers. At the beainning of the phytoplankton bloom P-GLC activity decreased, probably because active algae liberated low molecular weight carbohydrates easily assimilable by micro- heterotrophs. In October, on the other hand, during the breakdown of the phytoplankton bloom, a peak in P- GLC activity was observed. High amounts of polymeric carbohydrates are supposed to have been liberated during autolysis of algal cells (Chrost 1989, 1991), inducing the synthesis of P-GLC. During that period highest K, values were also recorded, reflecting a very
low substrate affinity and indicating again a high con- centration of polymeric carbohydrates. From Decem- ber until the end of the investigation period P-GLC activity gradually increased to its maximum, while K, values dropped to their lowest values within the year. During this period low primary production obviously led to a deficit in readily uthzable DOM, thus inducing the production of P-GLC.
Aminopeptidase activity and the incorporation of leucine into the bacterial biomass were significantly positively correlated over the year at Stn 2 (Table 1). Similar observations were made in other eutrophic ecosystems (Chrost 1989, Chrost & Rai 1993, Gajewski & Chrost 1995). However, during the time of high phytoplankton biomass and production (July to Sep- tember) both processes were uncoupled (Figs. 4 & 5), probably because phytoplankton released large amounts of amino acids during that period (Miinster & Chrost 1990, and citations therein). Surprisingly the aminopeptidase activity was also significantly posi- tively correlated to algal biomass (Stn 2) and primary production (Stn 1; Table 1). Until now leucine-amino- peptidase (AMP) has been shown to be mainly pro- duced by bacterial cells (Chrost 1991 and citations therein) but not by phytoplankton. Therefore, we do not assume that phytoplanktonic cells are responsible for AMP activity in the Alte Donau. Gajewski & Chrost (1995) also observed such a correlation in Lake Miko- lajskie and concluded that overall bacterial enzymatic activity strongly depends on algal organic matter pro- duction. Another explanation might also be an associa- tion of attached bacterial cells with cyanobacterial cells, but this was not quantitatively observed in our samples. Nitrate and ammonium were significantly negatively correlated to AMP activity at Stn 1 (Table l ) , indicating that at periods with high amounts of readily utilizable inorganic (NO3, NH,) and organic (released by phytoplankton) nitrogen compounds, aminopeptidase production is repressed.
Alkaline phosphatase (APA) exhibited a very strong correlation with prim.ary production and chl a (Table 1). Primary production alone explained 43 and 72% of the seasonal variation of APA at Stns 1 and 2, respectively, pH was also signiflcantly positively corre- lated to A P A activity, cnnfirrning that this er?zyme binds and hydrolyses substrates more efficiently under more alkaline conditions. Algae as well as bacteria have been found to produce alkaline phosphatase when available P compounds are limiting (Chrost 1991 and citations therein). Highest V,,, values were mea- sured during the summer phytoplankton bloom and thereafter dropped to the lowest values recorded dur- ing the i.nvestigation period. During thls period of of cyanobacterial bloom breakdown P,, values reached their maximum, indicating that APA synthesis was
Kirschner et a1 : Materlal fluxes th rough the procaryotic compartment 225
suppressed by its end product P,, ( > l 5 pg I- ' ) , as was already shown by Siuda & Chrost (1987) and Chrost & Overbeck (1987) Apparent K, values followed the pattern of V,,,, and this increase in afflnity of the enzyme is explained as an increase in efficiency in blnding substrate in situations when soluble phospho- rus is low in the system (Fig 2E) Thus, the high affin- ity, as reflected by the low K,,, values, could be an indi- cation of efficient substrate binding to the reactive site of the enzyme and consequent hydrolysis, which is seen as a useful strategy during periods of low enzyine activity due to low substrate availability Such a high enzyme affinity is of less importance during periods of high V,,,,,, when enzyme systems of the photosynthetic compartment and the heterotrophic bactena interact in the water column
Phosphorus budget
In the following discussion, we attempted to estimate whether the amount of phosphate liberated by enzy- matic hydrolyzation could cover the bacterio- and phytoplankton demand in the Alte Donau. In this con- text it should be mentioned that enzyme activities measured with the fluorogenic substrate method are probably underestimated because of competitive inhi- bition by the natural substrate. Furthermore, artificial substrates such as those used in our study are not rep- resentatives of all naturally occurring substrates, and it is not clear whether these artificial substrate analogues reflect cleavage under natural conditions. Therefore, estimations of V,,,, and K,,, values have to be consid- ered with caution and are mainly used as comparative values in the discussion above.
In a first step we calculated the P demand for the BSP and for the phytoplanktonic primary production using C:P conversion factors from the available literature. In the most recent publication (Fagerbakke et al. 1996) C:P ratios (wt:wt) for bacteria varying between 11 and 25 (mean: 19), obtained by X-ray analysis of individual seawater bacteria, were reported. Vadstein et al. (1993) found ratios between 2.8 and 27 (mean: 11.6), but did not investigate individual bacterial cells. Only in Vadstein & Olsen (1989) was bacterial P content measured directly in chemostat cultures and C:P ratios were in the range of 25 to 59. As the photosynthetically active compartment in the Alte Donau is dominated by cyanobacteria, we chose a C:P ratio of 41 (wt:wt) for the phytoplankton, which was proposed for Oscillato- na limosa by Pucsko (1985) and which is actually the same as the conventional Redfield ratio of 106, usually expressed as a molar ratio.
In a second step the rate of orthophosphate liberated by the activity of the alkaline phosphatase was esti-
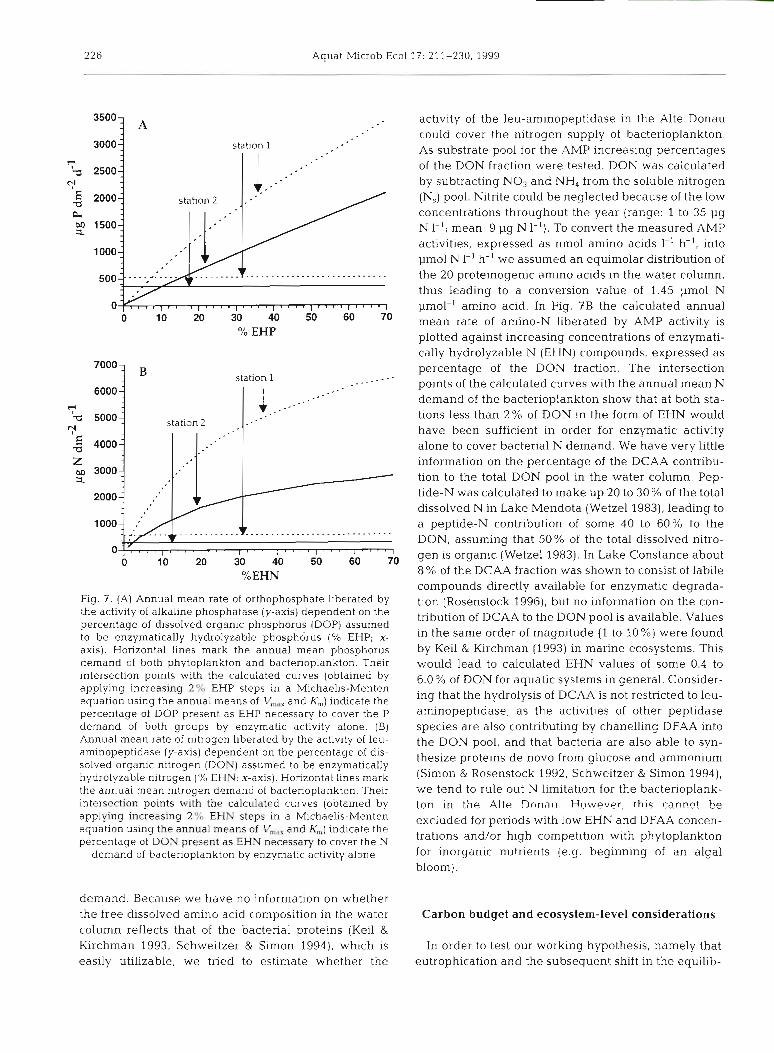
mated according to the Michaelis-Menten equation, as- suming a varying percentage of the dissolved organic phosphorus (DOP) pool as actual substrate concentra- tion ([S]) . DOP was calculated by subtracting the solu- ble reactive P from the dissolved P fraction (Fig. 2E). However, not all forms of the dissolved organic P were available for enzymatic hydrolysis (Chrost et al. 1986). Chrost & Overbeck (1987) found that in Lake PluRsee enzyinatically hydrolyzable P (EHP) compounds com- prised 63% of the DOP pool. In a series of eutrophic lakes Francko (1984) estimated 0 to 65% of the DOP fraction to be EHP. Plotting the average orthophosphate release rates at Stns 1 and 2 against increasing EHP percentages, we came to the conclusion that over the year a mean of only 7.5% (range: 6.5 to 8.5 %) at Stn 1 and 10% (range: 9 to l 1 %) at Stn 2 of the DOP pool would have had to have been made up of EHP in order for enzymatic activity alone to cover both the bacterial and algal P demand (Fig. ?A), indicating that the bacte- noplankton in the Alte Donau is most probably not P limited. Range calculations (not shown in Fig. ?A) were based on the upper and lower C:P conversion factors for bacterioplankton froin Fagerbakke et al. (1996). Since other phosphatases, such as acid phosphatase or 5'-nu- cleotidase (Chrost 1991), are expected to be simultane- ously active, P limitation becomes even less probable.
Nitrogen budget
A nitrogen budget was elaborated in a similar man- ner as the phosphorus budget. Assuming a C:N ratio of 5.0 (wt:wt) for the bacterioplankton (Fagerbakke et al. 1996), and the conventional Redfield ratio of 5.7 (wt:wt) for the phytoplankton, the nitrogen demand of both compartments was calculated. Values ranged from 10 and 7 mg N m-2 d-' in February to 1100 and 750 mg N n1r2 d-' during the cyanobacterial bloom at Stns 1 and 2, respectively. Log-transformed data of phytoplanktonic N demand showed high negative cor- relations to the log-transformed pool of N o 3 and NH, (calculated on an aereal basis) at both stations (R =
-0.84 and -0.75 for Stns 1 and 2, respectively; p < 0.001). Especially during the cyanobacterial bloom the daily phytoplanktonic N demand was much higher than the available NO, and NH, concentrations. How- ever, both ions are known to cycle rapidly within the water column during the growth period and, thus, the low concentrations of the ions are not a n indication for a possible limitation. N fixation seemed unlikely, because of the low frequency of heterocysts observed (Dokulil & Mayer 1996). Bacterial N demand (log- transformed) was not significantly correlated to the pool of NO3 and NH, (p > 0.05), w h c h may indicate the importance of amino acids for the bacterioplankton N
226 Aquat Microb Ecol 17: 211-230, 1999
station 1
% EHP
station 1
I I
Fig. 7. (A) Annual mean rate of orthophosphate liberated by the activity of alkaline phosphatase (y-axis) dependent on the percentage of dissolved organic phosphorus (DOP) assumed to be enzymatically hydrolyzable phosphorus (% EHP; x- axis). Horizontal lines mark the annual mean phosphorus demand of both phytoplankton and bacterioplankton. Their intersection points with the calculated curves (obtained by applying increasing 2% EHP steps in a Michaelis-Menten equation using the annual means of V,,, and K,) indicate the percentage of DOP present as EHP necessary to cover the P demand of both groups by enzymatic activity alone. (B) Annual mean rate of nitrogen liberated by the activity of leu- am~nopeptidase (y-axis) dependent on the percentage of dis- solved organic nltrogen (DON) assumed to be enzymatically hydrolyzable nitrogen (% EHN; x-axis). Horizontal lines mark the annual mean nitrogen demand of bacterioplankton. Their intersection points with the calculated curves (obtained by applying increasing 2% EHN steps in a Mlchaelis-Menten equation using the annual means of V,,,,, and K,) indicate the percentage of DON present as EHN necessary to cover the N
demand of bacterioplankton by enzymatic activity alone
demand. Because we have no information on whether the free dissolved amino acid composition in the water column reflects that of the bacterial proteins (Keil & Kirchman 1993, Schweitzer & Simon 1994), which is easily utilizable, we tried to estimate whether the
activity of the leu-aminopeptidase in the Alte Donau could cover the nitrogen supply of bacterioplankton. As substrate pool for the AMP increasing percentages of the DON fraction were tested. DON was calculated by subtracting NO3 and NH4 from the soluble nitrogen (N,) pool. Nitrite could be neglected because of the low concentrations throughout the year (range: 1 to 35 pg N I-'; mean: 9 pg N I-'). To convert the measured AMP activities, expressed as nmol amino acids I-' h-', into pm01 N 1-' h-' we assumed an equimolar distribution of the 20 proteinogenic amino acids in the water column, thus leading to a conversion value of 1.45 pm01 N pmol-' amino acid. In Fig. ?B the calculated annual mean rate of amino-N liberated by AMP activity is plotted against increasing concentrations of enzymati- cally hydrolyzable N (EHN) compounds, expressed as percentage of the DON fraction. The intersection points of the calculated curves with the annual mean N demand of the bacterioplankton show that at both sta- tions less than 2 % of DON in the form of EHN would have been sufficient in order for enzymatic activity alone to cover bacterial N demand. We have very little information on the percentage of the DCAA contribu- tion to the total DON pool in the water column. Pep- tide-N was calculated to make up 20 to 30 % of the total dissolved N in Lake Mendota (Wetzel 1983), leading to a peptide-N contribution of some 40 to 60% to the DON, assuming that 50% of the total dissolved nitro- gen is organic (Wetzel 1983). In Lake Constance about 8 % of the DCAA fraction was shown to consist of labile compounds directly available for enzymatic degrada- tion (Rosenstock 1996), but no information on the con- tribution of DCAA to the DON pool is available. Values in the same order of magnitude (1 to 10%) were found by Keil & Kirchman (1993) in marine ecosystems. This would lead to calculated EHN values of some 0.4 to 6.0% of DON for aquatic systems in general. Consider- ing that the hydrolysis of DCAA is not restricted to leu- aminopeptidase, as the activities of other peptidase species are also contributing by chanelling DFAA into the DON pool, and that bacteria are also able to syn- thesize proteins de novo from glucose and ammonium (Simon & Rosenstock 1992, Schweitzer & Simon 1994), we tend to rule out N limitation for the bacterioplank- ton in the A1t.e Dona i~ . However, this canncrt be excluded for periods with low EHN and DFAA concen- trations and/or high competition with phytoplankton for inorganic nutrients (e.g. beginning of an algal bloom).
Carbon budget and ecosystem-level considerations
In order to test our working hypothesis, namely that eutrophication and the subsequent shift in the equilib-
Kirschner et al.: Material fluxes through the procdryotlc compartment 227
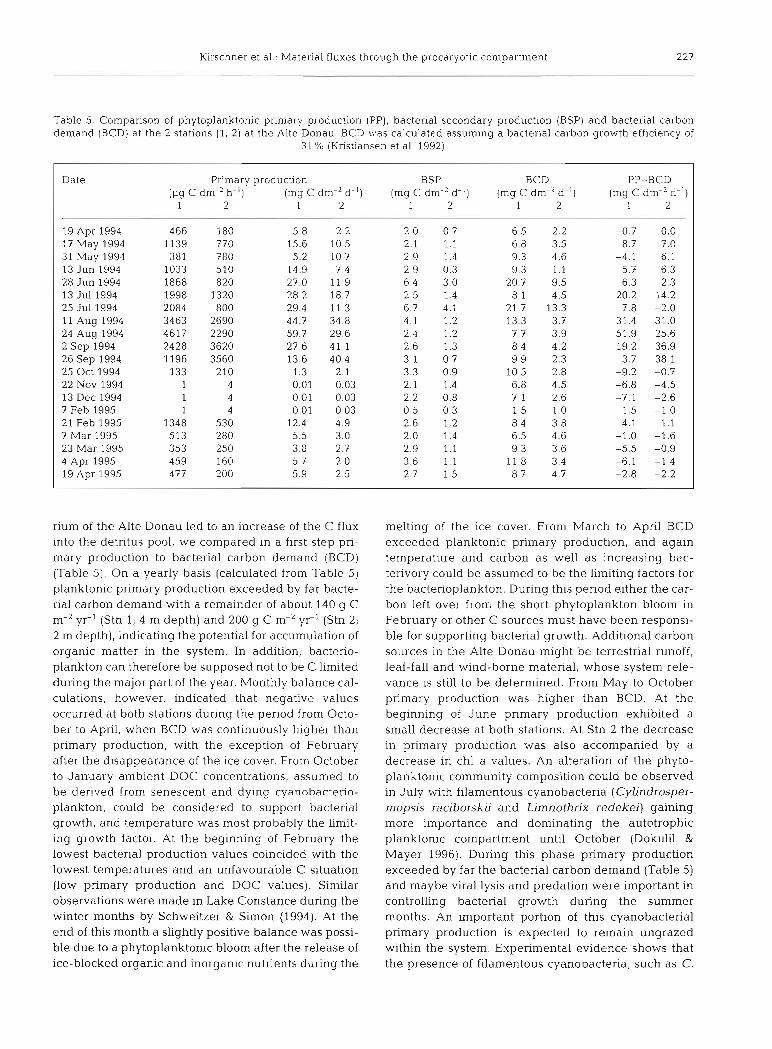
Table 5 Comparison of phytoplanktonic primary production (PP), bacterial secondary production (BSP) and bacterial carbon demand (BCD) at the 2 stations (1, 2) at the Alte Donau. BCD was calculated assuming a bacterial carbon growth efficiency of
31 % (Kristiansen et al. 1992)
Date Primary production BSP BCD PP-BCD (pg C dm-2 h-') (mg C dm-2 d-') (mg C dm-' d-') (mg C dm-' d.') (mg C dm-2 d-')
1 2 1 2 1 2 1 2 1 2 pp P --p
19 Apr 1994 466 180 5.8 2.2 2.0 0.7 6.5 2.2 -0.7 0.0 17 May 1994 1139 770 15.6 10.5 2.1 1.1 6.8 3.5 8.7 7.0 31 May 1994 381 780 5.2 10.7 2.9 1.4 9.3 4.6 -4.1 6.1 13 Jun 1994 1033 510 14.9 7.4 2.9 0.3 9.3 1.1 5.7 6.3 28 Jun 1994 1868 820 27.0 11.9 6.4 3.0 20.7 9.5 6.3 2.3 13 Jul 1994 1998 1320 28.2 18.7 2.5 1.4 8.1 4.5 20.2 14.2 25 Jul 1994 2084 800 29.4 11.3 6.7 4.1 21.7 13.3 7.8 -2.0 11 Aug 1994 3463 2690 44.7 34.8 4.1 1.2 13.3 3.7 31.4 31.0 24 Aug 1994 4617 2290 59.7 29.6 2.4 1.2 7.7 3.9 51.9 25.6 2 Sep 1994 2428 3620 27.6 41.1 2.6 1.3 8.4 4.2 19.2 36.9 26 Sep 1994 1196 3560 13.6 40.4 3 1 0.7 9.9 2.3 3.7 38.1 25 Oct 1994 133 210 1.3 2.1 3.3 0.9 10.5 2.8 -9.2 -0.7 22 NOV 1994 1 4 0.01 0.03 2.1 1.4 6.8 4.5 -6.8 -4.5 13 Dec 1994 1 4 0.01 0.03 2 2 0.8 7 1 2.6 -7.1 -2.6 7 Feb 1995 1 4 0.01 0.03 0 5 0.3 1 5 1.0 -1.5 -1.0 21 Feb 1995 1348 530 12.4 4.9 2 6 1.2 8 4 3.8 4.1 1.1 7 Mar 1995 513 280 5.5 3.0 2 0 1.4 6.5 4.6 -1.0 -1.6 23 Mar 1995 353 250 3.8 2.7 2.9 1.1 9 3 3.6 -5.5 -0.9 4 Apr 1995 459 160 5.7 2.0 3.6 1.1 1 1 8 3.4 -6.1 -1.4 19 Apr 1995 477 200 5.9 2.5 2.7 1.5 8.7 4.7 -2.8 -2.2
rium of the Alte Donau led to an increase of the C flux into the detritus pool, we compared in a first step pri- mary production to bacterial carbon demand (BCD) (Table 5). On a yearly basis (calculated from Table 5) planktonic primary production exceeded by far bacte- rial carbon demand with a remainder of about 140 g C m-' yr-' (Stn 1; 4 m depth) and 200 g C m-' yr-l (Stn 2; 2 m depth), indicating the potential for accumulation of organic matter in the system. In addition, bacterio- plankton can therefore be supposed not to be C limited during the major part of the year. Monthly balance cal- culations, however, indicated that negative values occurred at both stations during the period from Octo- ber to April, when BCD was continuously higher than primary production, with the exception of February after the disappearance of the ice cover. From October to January ambient DOC concentrations, assumed to be derived from senescent and dying cyanohacterio- plankton, could be considered to support bacterial growth, and temperature was most probably the limit- ing growth factor. At the beginning of February the lowest bacterial production values coincided with the lowest temperatures and an unfavourable C situation (low primary production and DOC values). Similar observations were made in Lake Constance during the winter months by Schweitzer & Simon (1994). At the end of this month a slightly positive balance was possi- ble due to a phytoplanktonic bloom after the release of ice-blocked organic and inorganic nutrients during the
melting of the ice cover. From March to April BCD exceeded planktonic primary production, and again temperature and carbon as well as increasing bac- terivory could be assumed to be the limiting factors for the bacterioplankton. During this period either the car- bon left over from the short phytoplankton bloom in February or other C sources must have been responsi- ble for supporting bacterial growth. Additional carbon sources in the Alte Donau might be terrestrial runoff, leaf-fall and wind-borne material, whose system rele- vance is still to be determined. From May to October primary production was higher than BCD. At the beginning of June primary production exhibited a small decrease at both stations. At Stn 2 the decrease in primary production was also accompanied by a decrease in chl a values. An alteration of the phyto- planktonic community composition could be observed in July with filamentous cyanobacteria (Cylindrosper- mopsis raciborskii and Limnothrix redekei) gaining more importance and dominating the autotrophic planktonic compartment until October (Dokulil & Mayer 1996). During this phase primary production exceeded by far the bacterial carbon demand (Table 5) and maybe viral lysis and predation were important in controlling bacterial growth during the summer months. An important portion of this cyanobacterial primary production is expected to remain ungrazed within the system. Experimental evidence shows that the presence of filamentous cyanobacteria, such as C.
228 Aquat Microb Ecol l? : 211-230, 1999
raciborskii, inhibits filtration rates of large cladocerans (Hawkins & Lampert 1989) and that critical filament concentrations exist at which the growth rate of larger grazers is halted (Gliwicz 1990). This ungrazed portion of the primary production is therefore expected to enter the detritus pool and be available for bacterial degradation rather than entering the grazing food web in the water column.
In the macrophyte-dominated Kiihwijrter Wasser the bacterial compartment was shown to be insufficiently fueled by phytoplankton (Kirschner & Velimirov 1997), indicating that macrophytes, benthic algae and import of terrestrial organic matter were subsidizing bacterio- planktonic secondary production during the major part of the year. Therefore, it was surprising that despite the big differences between both systems in the C flux from primary producers to bacterioplankton, the mag- nitude of the main bacterial features like cell numbers, cell volumes, biomass and secondary production was very similar in the mesotrophic macrophyte-dominated Kuhworter Wasser and the hypertrophic phytoplank- ton-dominated Alte Donau (Table 4). From this we conclude that irrespective of the source of organic mat- ter, the quantity of the C flux through the bacterial compartment may not have changed after the shift of the Alte Donau from a macrophyte-dominated to a phytoplankton-dominated system. However, differ- ences between the 2 systems were observed concern- ing the seasonal rhythm of morphotype composition (see above), bacterial numbers and secondary produc- tion. Maximal bacterial numbers in the Alte Donau were recorded in late autumn, at a time when a mini- mum was observed in the Kuhworter Wasser. In con- trast, highest bacterial numbers in the Kiihworter Wasser occurred in early summer, followed by the BSP maximum in August, when aquatic macrophytes and chl a displayed their seasonal maximum. In the Alte Donau, on the other hand, the highest BSP values were registered in early summer and did not coincide with the, summer phytoplankton bloom, which consisted mainly of filamentous cyanobacteria. Until now it remains unclear why the massive bloom of filamentous cyanobacteria did not lead to a bigger and more active bacterial population, although temperature conditions were optimal. We speculate that the cyanobacterial exudates might have consisted only to a small degree of readily utilizable organic matter and/or that inhibit- ing substances may have been excreted by Cylindros- permopsis raciborskii, a species which is known to be able to produce considerable amounts of toxic metabo- lites (Ohtani et al. 1992, Hawkins et al. 1997). Even though no analytical evidence of harmful concentra- tions in the Alte Donau is available, an effect on the microscale and thus the heterotrophic microbial com- partment cannot be ruled out.
Acknowledgements. This study was supported by a grant from the city of Vienna (MA 45; G . Ladinig). Our special thanks are due to J . Mayer, K . Donabaum, M. Schagerl and M. DokuLil for giving access to the information on chemical parameters from the water column as well as for providing the basis for valuable discussions on and insights into the investi- gated ecosystem. Special thanks also to H. Weilguni for his help with the statistical analyses and H. Giide (Institut fur Seenforschung, Langenargen, Germany), M. Simon (Univ. Oldenburg, Germany) as well as 2 anonymous reviewers for valuable comments on an earlier version of the manuscript.
LITERATURE CITED
Amblard C, Carrias JF, Bourdier G, Maurin N (1995) The microbial loop in a humic lake: seasonal and vertical vari- ations in the structure of the different communities. Hydrobiologia 300/301:71-84
Autio RM (1992) Temperature regulation of brackish water bacterioplankton. Ergebn Limnol37:253-263
Bell RT, Ahlgren GM, Ahlgren I (1983) Estimating bacterio- plankton production by measuring 3H-thymidine incorpo- ration in a eutrophic swedish lake. Appl Environ Microbiol 45:1709-1721
Bernard de R, Giussani G (1990) Are blue-green algae a suit- able food for zooplankton? An overview. Hydrobiologia 200/201:29-41
Berninger UG, Wickham SA, Finlay BJ (1993) Trophic cou- p h g within the microbial food web: a study with fine tem- poral resolution in a eutrophic freshwater ecosystem. Freshw Biol30:419-432
BLindow I , Andersson G, Hargeby A, Johansson S (1993) Long-term pattern of alternative stable states in two shal- low eutrophic lakes. Freshw Biol 30:159-167
Boon PI (1991) Bacterial assemblages in rivers and bitlabongs of southeastern Australia. Microb Ecol 22:27-52
Chrost RJ (1989) Characterization and significance of P-glu- cosidase in lake water. Limnol Oceanogr 34:660-672
Chr6st RJ (1991) Environmental control of the synthesis and activity of aquatic microbial ectoenzymes. In: Chrost RJ (ed) Microbial enzymes in the aquatic environment. Springer Verlag, New York, p 29-54
Chr6st RJ, Overbeck J (1987) Kinetics of alkaline phosphatase activity and phosphorus availability for phytoplankton and bacterioplankton in Lake PluDsee. M~crob Ecol 13: 229-248
Chrdst RJ, Overbeck J (1990) Substrate-ectoenzyme inter- action: significance of P-glucosidase activity for glucose metabolism by aquatic bacteria. Arch Hydrobiol Beih Ergebn Limnol34:93-98
Chrost RJ, Rai H (1993) Ectoenzyme activity and bacterial secondary production in nutrient-impoverished and nutri- ent-enriched freshwater mesocosms. Microb Ecol 25: !21-15!2
Chrost RJ, Siuda W, Albrecht D, Overbeck J (1986) A method for determining enzymatically hydrolyzable phosphate (EHP) in natural waters. Lirnnol Oceanogr 31:662-667
Dokulil MT, Janauer GA (1995) Alternative stable states during eutrophicatlon of a shallow urban lake in Vienna, Austria. Proceedings of the 6th international conference on the conservation and management of lakes-Kasumi- gaura, 1995, p 730-733
Dokuhl MT, Mayer J (1996) Population dynamics and photo- synthetic rates of a Cylindrospermopsis-Limnothrix asso- ciation in a highly eutrophic urban lake, Alte Donau, Vienna, Austria. Algol Stud 83:179-l95
firschner et al.. Material fluxes thr rough the procaryotic compartment 229
Fagerbakke KM, Heldal M, Norland S (1996) Content of car- bon, nitrogen, oxygen, sulfur and phosphorus in native aquatic and cultured bacteria. Aquat Microb Ecol 10:15-27
Francko DA (1984) Relationship between phosphorus func- tional classes and alkaline phosphatase activity in reser- voir lakes. J Freshw Ecol 2541-547
Gajewski AJ, Chrost RJ (1995) Production and enzymatic decomposit~on of organic matter by microplankton in an eutrophic lake. J Plankton Res 17:709-728
Gajewski AJ. Chrost RJ, Siuda W (1993) Bacterial lipolytic activity in an eutrophic lake. Arch Hydrobiol 128:107-126
Gajewski AJ, Kirschner AKT, Velimirov B (1997) Bacterial lipolytic activity in a hypertrophic dead arm of the river Danube in Vienna. Hydrobiologia 344:l-10
Gliwicz ZM (1990) Daphnia growth at different concentra- tions of blue-green filaments. Arch Hydrobiol 120:51-65
Gliwicz ZM, Lampert W (1990) Food thresholds in Daphnia species in the absence and presence of blue-green fila- ments. Ecology 7:691-702
Gliwicz ZM, Pijanowska J (1989) The role of predation in zoo- plankton succession. In: Sommer U (ed) Plankton ecology, succession in plankton communities. Springer Verlag, Berlin, p 253-297
Giide H (1989) The role of grazing on bacteria in plankton succession. In: Sommer U (ed) Plankton ecology, succes- sion in plankton communities. Springer Verlag, Berlin, p 337-364
Haney JF, Forsyth DJ, James MR (1994) Inhibition of zoo- plankton filtering rates by dissolved inhibitors produced by naturally occurring cyanobacteria. Arch Hydrobiol 132: 1-13
Hanson MA, Butler MG (1990) Early responses of plankton and turbidity to biomanipulation in a shallow prairie lake. Hydrobiologia 200/201:317-329
Hawkins P, Lampert W (1989) The effect of Daphnia body size on filtering rate inhibition in the presence of a filamentous cyanobacteria. Limnol Oceanogr 34:1084-1089
Hawkins PR, Chandrasena MR, Jones GJ, Humpage AR, Fal- coner IR (1997) Isolation and toxicity of Cj~lindrospermop- sis raciborskii from an ornamental lake. Toxicon 35: 914-919
Hobbie JE, Daley RJ, Jasper S (1977) Use of Nuclepore filters for counting bacteria by epifluorescence microscopy. Appl Environ Microbiol 33:1225-1228
Hoppe HC; (1983) Significance of exoenzymatic activities in the ecology of brackish water: measurements by means of methylumbelliferyl substrates. Mar Ecol Prog Ser 11: 299-308
Hosper SH (1989) Biomanipulation, new perspectives for restoration of shallow, eutrophic lakes in the Netherlands. Hydrobiol Bull 235-10
Irvine K, Moss B, Balls H (1989) The loss of submerged plants with eutrophication. 2. Relationships between fish and zooplankton in a set of experimental ponds dnd cor~clu- sions. Freshw Biol 22:89-107
Jeppesen E, Jensen JP, Knstensen P, Sundergaard M, Mortensen E, Sortkjaer 0, Olrik K (1990) Fish manipula- tion as a lake restoration tool in shallow, eutrophic, tem- perate lakes. 2: Threshold levels, longterm stability and conclusions. Hydrobiologia 200/201:219-227
Jurgens K, Gude H (1994) The potential importance of graz- ing-resistant bacteria in planktonic systems. Mar Ecol Prog Ser 112:169-188
Jurgens K, Stolpe G (1995) Seasonal dynamics of crustacean zooplankton, heterotrophic nanoflagellates and bacteria in a shallow, eutrophic lake. Freshw Biol33:2?-38
Keil RG, Kirchman DL (1993) Dissolved combined amino-
acids: chemical form and utilization by marine bacteria. Limnol Oceanogr 38:1256-1270
Kirschner AKT, V e h i r o v B (1997) Seasonal study of bacterial community succession in a temperate backwater system indicated by variation in morphotype numbers, biomass and secondary production. Microb Ecol34:27-38
Kristiansen K, Nielsen H, Riemann B, Fuhrman JA (1992) Growth efficiencies of freshwater bacterioplankton. Microb Ecol 24:145-160
Leatherbarrow RJ (1987) Enzfitter. A non-linear regression data analysis program for the IBM PC. Elsevier-Biosoft, Cambridge
Legler C (1988) Ausgewahlte Methoden der Wasserunter- suchung, Band 1: chernische, physikalisch-chernische und physikalische Methoden. VEB Gustav Fischer Verlag. Jena
Levontin RC (1969) The meaning of stability. In: National Bureau of Standards, US Department of Commerce, Brookhaven (ed) Diversity and stability in ecological sys- tems. Symp Biol 22:13-24
Mathias CB, Kirschner AKT, Velimirov B (1995) Seasonal variations of virus abundance and viral control of the bac- terial production in a backwater system of the Danube River. Appl Environ Microbiol 61:3?34-3740
May RM (1973) Stability and complexity in model ecosystems. Princeton University Press, Princeton, NJ
May RM (1977) Thresholds and breakpoints in ecosystems with a multiplicity of stable states. Nature 269:471-477
May RM (1981) Models for two interacting populations. In: May RM (ed) Theoretical ecology. Blackwen, Oxford, p 78-105
Mayer J , Dokuhl MT, Salbrechter M, Berger M, Posch T, Pfis- ter G, Kirschner AKT, V e h i r o v B, Steitz A, Ulbricht T (1997) Seasonal successions and trophic relations between phytoplankton, zooplankton, ciliates and bactena In a hypertrophic shallow lake in Vienna, Austria. Hydrobiolo- gia 342/343:165-174
Middelboe M, Sandergaard M, Letarte Y, Borch NH (1995) At- tached and free-living bacteria: production and polymer hydrolysis during a diatom bloom. Microb Ecol29:231-248
Moriarty DJ, Bell RT (1993) Bacterial growth and starvation in aquatic environments. In: Kjelleberg S (ed) Starvation in bacteria. Plenum Press, New York, p 25-53
Moss B (1990) Engineering and biological approaches to the restauration from eutrophication in shallow lakes in which aquatic plant communities are important components. Hydrobiologia 200/201:36?-377
Munster U, Chr6st RJ (1990) Origin, composition and micro- bial utilization of DOM. In: Overbeck J , Chrost RJ (eds) Aquatic microbial ecology: biochemical and molecular approaches. Springer Verlag, New York, p 8-46
Norland S (1993) The relatioship between biomass and vol- ume of bacteria. In: Kemp PF, Sherr EB, Sherr EB, Cole JJ (eds) Current methods in aquatic microbial ecology. Lewis Publ, Boca Raton, p 303-307
Nusch EA (1980) Comparison of different methods for chloro- phyll and phaeopigment determination. Arch Hydrobiol Beih Ergebn Limnol 14:14-36
Nystrom T (1993) Global system approach to the physiology of the starved cell. In: Kjelleberg S (ed) Starvation in bac- teria. Plenum Press, New York, p 25-53
Ohtani I, Moore RE, Runnegar MTC (1992) Cylindrosper- mopsin: a potent hepatotoxin from the blue green alga Cylindrospermopsis raciborskii. J Am Chem Soc 114: 7942-7944
Pace ML, Cole J J (1994) Comparative and experimental approaches to top-down and bottom-up regulation of bac- teria. Microb Ecol28:181-193
230 Aquat Microb Ecol 17: 211-230, 1999
Parsons TR, Maita Y, Lalli CM (1984) A manual of chemical and biological methods for seawater analysis. Pergamon Press, Oxford
Pedr6s-A110 C, Brock TD (1982) Assessing biomass and pro- duction of bacter~a in eutrophic Lake Mendota, Wisconsin. Appl Environ Microbiol 44:203-218
Pucsko R (1985) Phosphorverbindungen im Sediment des Piburger Sees. PhD thesis, Univ. Innsbruck
Riemann B, Jensen LM (1991) Measurement of phytoplank- ton pnmary production by means of the acidification and bubbling method. J Plankton Res 13:853-862
Rosenstock B (1996) BakterieUe Nutzung von gelosten Arninosauren und Proteinen und deren Freisetzung durch Plankton im Bodensee. Konstanzer Dissertationen, Band 527. Hartung Gorre Verlag, Konstanz
Scheffer M (1990) Multiplicity of stable states in freshwater systems. Hydrobiologia 200/201:475-486
Scheffer M, Hosper SH, Meijer ML, Moss B, Jeppesen E (199.7) Alternative equilibria in shallow lakes. TREE 8: 275-278
Schiemer F (1995) Revitalisierungsmal3nahmen fiir Au- gewasser- Moglichkeiten und Grenzen. Arch Hydrobiol Suppl 101 :383-398
Schweitzer B, Simon M (1994) Growth limitation of planktonic bacteria in a large mesotrophic lake. Microb Ecol 28: 89-102
Sirne-Ngando T, Bourdier G, Amblard C, Pinel-Alloul B (1991) Short-term variations in specific biovolumes of dif- ferent bacterial forms in aquatic ecosystems. Microb Ecol 21:211-226
Simon M, Azam F (1989) Protein content and protein synthe- sis rates of planktonic marine bacteria. Mar Ecol Prog Ser 51:201-213
Simon M. Rosenstock B (1992) Carbon and nitrogen sources of planktonic bacteria in Lake Constance studied by the composition and isotope dilution of intracellular amino acids. Limnol Oceanogr 37:1496-1511
Editorial responsibility: David Karl, Honolulu, Ha wail, USA
Siuda W, Chrost RJ (1987) The relat~onship between alkaline phosphatase (APA) activity and phosphate availability for phytoplankton and bacteria in eutrophic lakes. Acta ~ i c r i b i o l Polonica 36:247-257
Somville M, Billen G (1983) A method for determining exo- proteolytic activity in natural waters. Limnol Oceanogr 28. 190-193
Sandergaard M, Hansen B, Markager S (1995) Dynamics of dissolved organic carbon lability in a eutrophic lake. Lim- no1 Oceanogr 40:46-54
Stevenson HL (1978) A case for bacterial dormancy in aquatic systems. Microb Ecol4:127-133
Strickland JD, Parsons TR (1968) A practical handbook of sea- water analysis. Bull Fish Res Board Can 167
Vadstein 0, Olsen Y (1989) Chemical composition and phos- phate uptake hnetics of h n e t i c bacterial communities cultured in chemostates under phosphorus limitation. Limnol Oceanogr 34:939-946
Vadstein 0, Harkjerr BO, Jensen A, Olsen Y, Reinertsen H (1989) C y c h g of organic carbon in the photic zone of a eutrophic lake with special reference to the heterotrophlc bacteria. Limnol Oceanogr 343340-855
Vadstein 0, Olsen Y, Reinertsen H (1993) The role of plank- tonic bacteria in phosphorus cycLing in lakes-sink and link. Limnol Oceanogr 38:1539-1544
Velimlrov B, Walenta-Simon M (1992) Seasonal changes in specific growth rates, production and biomass of a bacter- ial community in the water column above a Mediter- ranean seagrass system. Mat Ecol Prog Ser 80:237-248
Vollenweider RA (1974) Primary production in aquatic envi- ronments. IBP handbook no. 12, 2nd edn. Blackwell Sci., Oxford
Wetzel RG (1983) Limnology, 2nd edn. Sounders College pub- lishing, Philadelphia
Wikner J, Hagstrom A (1991) Annual study of bacterio- plankton community dynamics. Limnol Oceanogr 36: 1313-1324
Submitted: June 30, 1998; Accepted: September 29, 1998 Proofs received from aothorls): June 10, 1999