material waste and changeover efficiency at stonyfield farm · 2008-12-01 · material waste and...
TRANSCRIPT

Project Number:
FN STF1
Material Waste and Changeover Efficiency
At Stonyfield Farm
A Major Qualifying Project Report
Submitted to the Faculty
of the
WORCESTER POLYTECHNIC INSTITUTE
in partial fulfillment of the requirements for the
Degree of Bachelor of Science
By
_________________
Irene Tsai
In cooperation with
Stonyfield Farm
Dated: April 26, 2007
Approved:
______________
Francis Noonan

2
ABSTRACT
This report, prepared for Stonyfield Farm, was focused on identifying work process
standards for the reduction of fruit and flavor usage on the 6 oz yogurt cup assembly lines
during the fruit and flavor changeover process. A series of interviews, observations,
literary research and analysis, led to the identification of a standard quantity of allowable
usage to be generated from the fruit changeover process. Additionally, analysis on the
feasibility of upgrading the current fruit dosing system was performed.
3
EXECUTIVE SUMMARY
This report, prepared for Stonyfield Farm, was focused on identifying methods for
the reduction of fruit and flavor usage on the 6 oz yogurt cup assembly lines during the
fruit and flavor changeover process. A series of interviews, observations, literary
research and analysis, led to the identification of a standard quantity of allowable usage
to be generated from the fruit changeover process at thirty pounds.
In comparing two methods of performing fruit changeovers on the line, a fruit to
fruit push versus a water push, it was determined that the fruit push was the most cost
efficient method. While the water push method took five minutes less to perform than
the fruit push, the value of time the five minutes lost was calculated to be $260.91. The
fruit to fruit push method used an additional twenty five pounds of fruit at the cost of
$34.50.
Additionally, analysis on the feasibility of upgrading the current fruit dosing
system was performed. An investment of approximately $126,000 would see a payback
within a little more than two months. By upgrading the current fruit dosing system,
operators will no longer need to spend as much time concentrating on adjusting the fruit
valves to better control the range of fruit distributed into each cup.

4
Table of Contents
ABSTRACT .................................................................................................................................................. 2
EXECUTIVE SUMMARY .......................................................................................................................... 3
1. INTRODUCTION ................................................................................................................................... 6
2. BACKGROUND ...................................................................................................................................... 8
2.1 HISTORY OF YOGURT ................................................................................................. 8
2.2 STONYFIELD FARM .................................................................................................... 9
2.3 FEDERAL DRUG ADMINISTRATION (FDA) ............................................................... 10
2.4 YOGURT MANUFACTURING...................................................................................... 10
3. METHODOLOGY .................................................................................................................................13
3.1 BACKGROUND RESEARCH ........................................................................................ 14
3.2 FLOW CHART .......................................................................................................... 14
3.3 FISHBONE DIAGRAM- IDENTIFYING AREAS OF WASTE ............................................ 15
3.4 LINE OBSERVATIONS ............................................................................................... 16
3.5 INTERVIEWS ............................................................................................................. 16
3.6 DETERMINING THE BEST PRACTICE ......................................................................... 17
4. RESULTS ................................................................................................................................................19
4.1 BACKGROUND RESEARCH ........................................................................................ 19
4.2 FLOW CHART .......................................................................................................... 23 4.2.1 Receiving ....................................................................................................................................23 4.2.2 Pasteurization .............................................................................................................................24 4.2.3 Hard Yogurt Production ............................................................................................................26 4.2.4 Incubation ..................................................................................................................................28 4.2.5 Cooling Tunnel and Storage ......................................................................................................29
4.3 YOGURT WASTE GENERATED FROM THE MANUFACTURING PROCESS .................... 30
4.4 LINE OBSERVATIONS ............................................................................................... 32 4.4.1 Changeover Cases ......................................................................................................................33 4.4.2 Line Operators ............................................................................................................................33 4.4.3 Changeover Standards ...............................................................................................................35 4.4.4 Line 32 and Line 34 Characteristics ..........................................................................................35 4.4.5 Line Observations Data .............................................................................................................36
4.5 INTERVIEWS ............................................................................................................. 39 4.5.1 Fruit to Fruit Changeover .........................................................................................................39 4.5.2 Fruit to Liquid Flavor or Flavor Syrup Changeover ................................................................40 4.5.3 Liquid Flavor or Flavor Syrup to Fruit Changeover ................................................................41
5. ANALYSIS ...............................................................................................................................................42
5.1 STANDARDIZING CHANGEOVER USAGE ................................................................... 42
5.2 NEW FRUIT DOSE SYSTEM ....................................................................................... 45 5.2.1 Fruit Capabilities Study ............................................................................................................45 5.2.2 No Fill Cups Reported Consumer Complaints..........................................................................46 5.2.3 Description of Fruit Dose System .............................................................................................48 5.2.4 Return on Investment of Fruit Dose System .............................................................................49
5.2.5 Return of Investment of Dosystem .............................................................................................50
6. CONCLUSION .......................................................................................................................................53
5
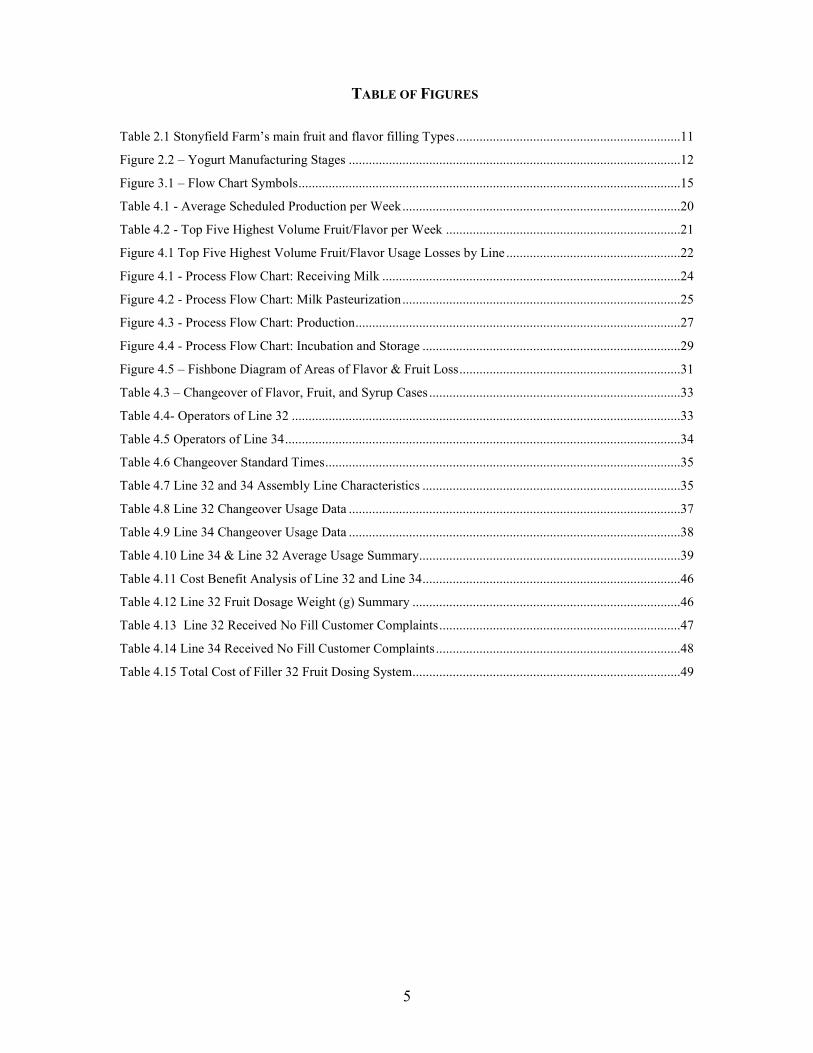
TABLE OF FIGURES
Table 2.1 Stonyfield Farm’s main fruit and flavor filling Types ...................................................................11
Figure 2.2 – Yogurt Manufacturing Stages ...................................................................................................12
Figure 3.1 – Flow Chart Symbols ..................................................................................................................15
Table 4.1 - Average Scheduled Production per Week ...................................................................................20
Table 4.2 - Top Five Highest Volume Fruit/Flavor per Week ......................................................................21
Figure 4.1 Top Five Highest Volume Fruit/Flavor Usage Losses by Line ....................................................22
Figure 4.1 - Process Flow Chart: Receiving Milk .........................................................................................24
Figure 4.2 - Process Flow Chart: Milk Pasteurization ...................................................................................25
Figure 4.3 - Process Flow Chart: Production .................................................................................................27
Figure 4.4 - Process Flow Chart: Incubation and Storage .............................................................................29
Figure 4.5 – Fishbone Diagram of Areas of Flavor & Fruit Loss ..................................................................31
Table 4.3 – Changeover of Flavor, Fruit, and Syrup Cases ...........................................................................33
Table 4.4- Operators of Line 32 ....................................................................................................................33
Table 4.5 Operators of Line 34 ......................................................................................................................34
Table 4.6 Changeover Standard Times ..........................................................................................................35
Table 4.7 Line 32 and 34 Assembly Line Characteristics .............................................................................35
Table 4.8 Line 32 Changeover Usage Data ...................................................................................................37
Table 4.9 Line 34 Changeover Usage Data ...................................................................................................38
Table 4.10 Line 34 & Line 32 Average Usage Summary ..............................................................................39
Table 4.11 Cost Benefit Analysis of Line 32 and Line 34.............................................................................46
Table 4.12 Line 32 Fruit Dosage Weight (g) Summary ................................................................................46
Table 4.13 Line 32 Received No Fill Customer Complaints ........................................................................47
Table 4.14 Line 34 Received No Fill Customer Complaints .........................................................................48
Table 4.15 Total Cost of Filler 32 Fruit Dosing System................................................................................49
6
1. INTRODUCTION
Stonyfield Farm is a manufacturer of dairy-based goods, such as smoothies, ice
creams, and yogurt. It’s headquarter site, located in Londonderry, New Hampshire
produces smoothies and yogurt, the latter being its main product. Stonyfield Farm
competes not only with its domestic sister production sites, but those internationally as
well, which operate under the name Dannon Yogurts of Group Danone based in France.
Stonyfield’s main concern is to comply with FDA guidelines to produce saleable and
quality goods, but at the same time trying to keep the manufacturing costs at a minimum.
Stonyfield differs in its fellow production sites in that 80% of the raw materials
used for the manufacturing process are organic, which cost at least three times as much as
conventional material. The cost per product to produce Stonyfield’s organic yogurt is
greater than what similar yogurt manufacturers face with their use of conventional
ingredients. As a result of the high costs for its raw materials, Stonyfield is interested in
determining methods to reduce its production costs (Petrak, 2006).
As an environmentally-friendly corporation, Stonyfield is interested in reducing
the amount of material waste, specifically fruit and flavor waste, innate in its process of
manufacturing the product. Additionally, Stonyfield’s growth in sales increased by
31.2%, the highest of all yogurt manufacturing brands with the closest brand coming in at
9.6% of growth. Due to this growth, the volume in material waste also increases (Petrak,
2006).
First, background research on the FDA guidelines for proper manufacturing
processes and Stonyfield’s own product requirements will be gathered to compare and
determine the overall goal of both organizations and how they fit together. The method
of changing SKUs will be specifically targeted, as there is a need to perform this
7
procedure both quickly but also with minimal amount of waste. Additionally, there is a
lack of a well defined standard on how this procedure is to be properly performed.
Observations of the changeover process on the lines will be observed and
recorded. The baseline quantity of milk and fruit usage will be established in order to
determine the quantity of waste which must be generated to properly maintain the quality
of the product. From there, interviews with the filler operators on how changeover
procedures were performed and their suggestions for areas of improvement were
gathered. The ideas were then be modeled and evaluated to determine the most feasible,
time and cost-efficient solution, and a well-defined changeover standard will be created.
Ultimately, by optimizing the changeover process through modifying the current
practice will result in greater efficiently and the use of fewer resources. This will be
possible through the development and establishment of a well-defined changeover
procedure based upon the data gathered, Stonyfield will see a reduction in waste
generated in the process in an efficient manner.

8
2. BACKGROUND
It is important to identify the intricate processes required in yogurt manufacturing,
to better understand the fundamental requirements for making a quality cup of yogurt.
This will provide the foundation in understanding the needs of Stonyfield Farm as a
manufacturer of yogurt, combined with its mission as a brand, along with the
requirements of the FDA in producing a quality food product.
2.1 History of Yogurt
Yogurt is a gelatinous-like substance, generated from the fermentation of milk.
The history of yogurt as a food item dates back to the 11th
century, as its origins were
accidental when bacteria in milk began to ferment, producing its dense liquid-
consistency. A Russian biologist, Ilya Mechnikov, believed that a diet heavy in the
consumption of yogurt resulted in the long lifespan of Bulgarian peasants. Mechnikov
believed Lactobacillus, a lactic acid bacterium, was essential for good health and made it
his work to popularize yogurt throughout Europe (Flora, 2002).
The popularization of yogurt blossomed with Isaac Carasso, who in 1919 started a
yogurt plant in Barcelona, Spain. This yogurt plant, named Danone, better known in the
United States as Dannon, industrialized the production of yogurt. Yogurt is a popular
food of “South Asia, Central Asia, Western Asia, South Eastern Europe and Central
Europe”, enjoyed alone as a snack item or used in entrees. In the 1940s, Danone
introduced yogurt with fruit jam at the bottom to slow the process of the yogurt decaying.
Even with its extensive history of existence, it was not until the late 1980’s health craze
when yogurt gained acceptance as a food product in the United States (Flora, 2002).
9
2.2 Stonyfield Farm
Stonyfield Farm is the premiere manufacturer of organic dairy products in the
United States, the bulk of which is yogurt-based goods. Stonyfield differs from its
competitors in the market by using ingredients which are all organic and natural- no
artificial flavors, coloring, sweeteners, nor preservatives. The organic ingredients are
purchased through vendors who do not employ the use of synthetic growth hormones and
pesticides. Stonyfield Farm is currently the largest manufacturer of yogurt goods, and
ranks as the third largest overall yogurt brand name (Petrak, 2006).
In the early 1980s, an organic farming school with the mission of maintaining
agricultural practices began selling its homemade yogurt recipe under the name
Stonyfield Farm to maintain funding for its school. The yogurt was made in small
batches in an ordinary kitchen, and initially sold to just neighbors and local supermarkets
in New Hampshire. However, by the mid 80’s with the ever increasing demand for its
product, its founders realized they had laid the foundations for an even greater plan- they
no longer needed a school to teach and maintain the history of agricultural practices,
instead, producing their yogurt alone would do just that.
In 1988, Stonyfield Farm relocated to Londonderry, New Hampshire and yogurt
making became an industrialized process, replacing handmade batches with yogurt
dispensing machines. By the 90’s, the natural and organic health craze boomed and
demand for Stonyfield’s Stonyfield’s entire organic yogurt product grew (Hirschberg,
1993). Consumers were suddenly interested in all natural and all organic products, ones
without bovine growth hormones in the milk, artificial sugar, and other man-made
additives. The Londonderry plant produces hard yogurt products in cup form with
flavoring and/or fruit pieces, in addition to a liquid flavored yogurt smoothie drink.

10
In tune with its original company mission, Stonyfield is a company committed to
not only producing healthy food products, but having a positive impact on the
environment (Hirschberg, 1993). At least 10% of the company’s profits go towards
protecting or restoring the Earth. Current environmental business practices, such as
recycling and reusing boxes, have supported Stonyfield’s interest in protecting the
environment.
2.3 Federal Drug Administration (FDA)
The United States food manufacturing industry is regulated by the Food and Drug
Administration (FDA). Explicit quality standards are set by the United States
government’s FDA, which derives its authority and jurisdiction from acts of Congress.
The FDA is responsible for regulating “food, dietary supplements, drugs, cosmetics,
medical devices, radiation emitting devices, biologics, and blood products” (Coleman,
2002) in the United States. Food manufacturing sites must comply with FDA standards
in order to produce quality, saleable goods.
One Act which regulates the net quantity of product placed per package may be
found in the Fair Packaging and Labeling Act of 1966, which required that all consumer
products now carry a label. This label was required to state:
The identify of the product
The name and place business of the manufacturer
The net quantity of contents (Coleman, 2002))
2.4 Yogurt Manufacturing
The industrialized process of making yogurt product occurs in five main stages-
receiving, pasteurization, production, incubation, and storage. In the first stage of
receiving, raw materials arrive and are stored until ready to be processed. Dairy products

11
may be stored up to a period of four days without going through the pasteurization
process. Raw materials such as powders may be stored indefinitely and are sampled by
the Quality Department prior to their usage in processing (Stonyfield Farm: SOP for
Quality Control, 2006).
In the second stage, the raw materials are processed. Dairy products go through
the pasteurization process to eliminate harmful bacteria and increase the shelf life of the
product. The product is then blended with powders and other additives to bring it to the
specifications for Stonyfield Farm’s yogurt product, known as the base (Stonyfield Farm:
L. Reuteri Bulk Culture, 2004).
At the production stage, the base is packaged on the assembly lines with over
eighty different fruit and flavor fillings. Figure 2.1 illustrates the three types of fruit and
flavoring types used by Stonyfield for their yogurt product.
Fruit and Flavor Filling Types
Fruit Flavor Syrup Liquid Flavor
Description Fruit pieces Flavor syrup Liquid flavoring
Product Type Bottom of cup Bottom of cup Blend w/base
Examples Strawberry (diced.)
Blueberry (whole pieces) Chocolate, Caramel Vanilla, Key Lime
Table 2.1 Stonyfield Farm’s main fruit and flavor filling Types
Fruit pieces sit at the bottom of each cup, and may either come as whole or diced
pieces. Flavor syrups, such as chocolate and caramel, also sit at the bottom of each cup,
and liquid flavors which are blended with the base prior to being dispensed into cups.

12
From there, each cup is sealed, boxed into cases (each case holds twelve cups), then
conveyed to the incubation room. At the final stage, the base sits in the incubator until
the base ferments into its yogurt form. When this occurs, the yogurt is moved through
the chill tunnel to cool down to 50 degrees (Stonyfield Farm: HACCP, 2004) until it is
finally stored in the shipping room ready to go out the door.
Figure 2.2 – Yogurt Manufacturing Stages
Throughout each stage, the temperature of the product must be maintained to
ensure proper fermentation of the milk to create hard yogurt product. Quality checks are
performed countless number of times through each stage to ensure these specifications
are being met throughout the whole process.
Processing
Production
Receiving
Incubation
Storage
Main Stages of Yogurt Manufacturing

13
3. METHODOLOGY
A number of varying methods will be used to gather information on how the
current changeover process takes place, and how to optimize this process by reducing
waste and time. The objectives in order to complete the goal of identifying best practices
are as follows:
Understand the business (organization, process, products)
Identify the main areas generating waste through the manufacturing
process, specifically in production.
Discover the practice differences amongst the filler operators during the
changeover process.
Achieve an in-depth knowledge of the practices through evaluation
Determine the most optimal changeover process
The first objective is to understand the business of yogurt manufacturing. This
was achieved through background research of how yogurt is manufactured along with
information on Stonyfield itself as a company; its mission statement and the types of
products manufactured onsite.
Following this, line observations were made to see how different filler operators
performed the changeover process. Differences amongst each operator’s method were
being noted. Additionally, interviews with the operators were being conducted in which
the operators explained how the changeover procedure is performed. Analysis of the data
was be performed by modeling the different methods to determine the most optimal
changeover process to save time and decrease waste material.
14
3.1 Background Research
FDA guidelines for proper manufacturing processes were gathered, specifically
for product weights and handling of product. This information was compared with
Stonyfield’s own product requirements. The different factors- such as quality, cost, time,
and efficiency- were then benchmarked. The two were compared to determine the
overall goal of both organizations and how they fit together.
Additionally, data on the quantity of each SKU’s average production and which
of the manufacturing lines they run on were obtained to determine the top two flavors or
fruits produced the most often. Also, data on which of the lines generate the most waste
according to fruit or flavor type were obtained. Through background research, the top
two SKUs and line(s) which produce the most waste were identified, which became the
focus as changes these would generate the most impact.
The capabilities of each assembly line’s output of cups per minute would also be
acquired. This was be used to weigh the values of labor versus waste generated.
Whether it is more important to Stonyfield to produce more product at the cost of
generating more waste through changeovers, or decreasing the changeover waste at the
cost of losing production time were compared.
3.2 Flow Chart
Stonyfield Farm’s yogurt manufacturing process was modeled with a process flow
diagram. This outlined the steps involved through the process of receiving the raw
material until the last stage of producing a final product.
15
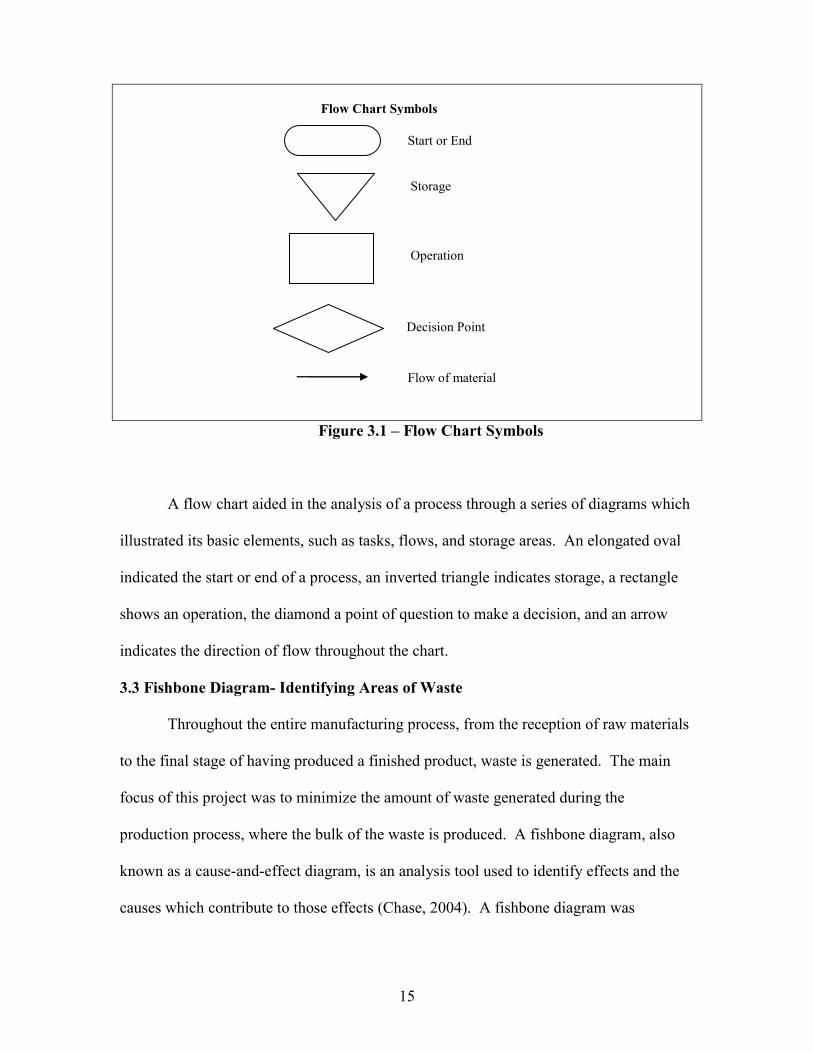
Figure 3.1 – Flow Chart Symbols
A flow chart aided in the analysis of a process through a series of diagrams which
illustrated its basic elements, such as tasks, flows, and storage areas. An elongated oval
indicated the start or end of a process, an inverted triangle indicates storage, a rectangle
shows an operation, the diamond a point of question to make a decision, and an arrow
indicates the direction of flow throughout the chart.
3.3 Fishbone Diagram- Identifying Areas of Waste
Throughout the entire manufacturing process, from the reception of raw materials
to the final stage of having produced a finished product, waste is generated. The main
focus of this project was to minimize the amount of waste generated during the
production process, where the bulk of the waste is produced. A fishbone diagram, also
known as a cause-and-effect diagram, is an analysis tool used to identify effects and the
causes which contribute to those effects (Chase, 2004). A fishbone diagram was
Start or End
Storage
Operation
Decision Point
Flow of material
Flow Chart Symbols

16
generated to identify the main areas and processes where waste is generated during
production and causes as to why this occurs.
3.4 Line Observations
Observations of how the changeover process is performed by operators was done
to gather data on how the procedure is done, and how differently each operator may do
so. Observations of the changeover process was made on the line(s) determined to
manufacture the top two SKUs which generate the most waste, as discovered from the
background research. The steps involved for the changeover process will be outlined.
The amount of time it takes for the operator to perform the changeover and the
amount of waste generated from each operator’s process was recorded with a stopwatch.
At the same time, the waste generated through the changeover process was captured in
buckets to be measured. This was used to determine how much is generated from each
step and how much waste is generated according to each operator’s individual
performance and method.
3.5 Interviews
Organized interviews with line operators, who are the key operators in controlling
the usage of fruit on the lines, were be conducted to further gather information on how
they each individually perform operations related to fruit usage. The interviews were
compared with what each operator what actually observed to be performing out on the
lines. Operators were asked why they perform each procedure the way they do and any
suggestions they may have for improvements was also be noted. Also, information on
how they were trained and why they perform certain operations in their specific manner
was obtained.
17
Additional interviews with individuals outside of production was conducted to
gain further understanding on what is practiced by line operators, as well as the practices
of those in the quality department, which affects production.
3.6 Determining the Best Practice
The final objective of the project is to determine the most efficient practice in
performing a changeover, minimizing both cost from excess waste and time loss for the
operator to perform the procedure. This is possible through the gathering and analysis of
the following:
Background research on the yogurt manufacturing process, modeled with
process flow diagrams
Determining areas where fruit and flavor loss occurred, particularly
through production, modeled with a fishbone diagram
Obtaining data on the average production schedule, indicating the highest
volume SKU and highest quantity of waste generated from each run
(strawberry, blueberry, vanilla, chocolate)
Obtaining data on the lines which produce the highest value of fruit waste
Obtain data on the quantity of cups produced per minute by each line.
Compare with how much waste that is generated cost. Measure the
variables of time and waste according to cost for Stonyfield to determine
which variable should be the most optimal to focus upon.
Obtaining the Standard Operational Procedure for changeovers.
Interviewing line operators on how changeovers were performed. There
are four operators for each line (four operators each line).
18
Observe the operators during the changeover process for the three
specified fruits and flavors on the two specified lines. During the
observation, have waste generated through process contained in buckets so
they may be later used to weigh and measure. Also, outline the steps
involved in the process. Finally, record the amount of time it takes to
perform each step with a stopwatch.
Compare the SOP to the interview and observed procedure performed on
the line.
Determine the most optimal procedure, according to which variable
Stonyfield is more interested in controlling.
In developing the standard to minimize downtime and waste, both factors conflict
with each other. The trade offs between whether the cost of time to perform a
changeover was a more important variable than the cost spent on waste, or vice versa was
be modeled.
Additionally, other areas of improvement to time and cost were noted according
to observations made in correlation to changeovers on the lines.
19
4. RESULTS
The data gathered through the various research methods serve to provide the
foundations of the changeover process. Background research was conducted to
determine the product SKU which was schedule to produce the most volume. This data
was compared along with the highest volume of fruit or flavor usage, and which fruit or
flavor ran the most often on each assembly line.
A flow chart was created to outline the stages of the manufacturing process to
provide an overall picture of how materials move from input of material to its output as a
product. Mention Interviews/Observations/Etc.
4.1 Background Research
Background research on production schedules was obtained through gathering
data from various sources through Stonyfield’s production database. This information
provides as a guide to the average scheduled production of each specific SKU per week.
In Table 4.1, the average scheduled production of each SKU per week is listed in
descending order.

20
Scheduled Production per Week
SKU Milk Fruit/Flavor STNY* TJ* Total */Wk
40 NF French Vanilla 15517 1282 16799
44 NF Blueberry 13302 1462 14764
57 NF Chocolate 11850 1264 13114
41 NF Strawberry 10626 1051 11677
4002 LF Vanilla 9958 878 10836
42 NF Peach 10099 10099
45 NF Black Cherry 8216 1086 9302
4006 LF Strawberry 8425 711 9136
43 NF Raspberry 7595 1125 8720
4001 LF Blueberry 7151 7151
66 NF Key Lime 5036 814 5850
20 NF Plain 4640 807 5447
49 NF Lotsa Lemon 5145 5145
4005 LF Raspberry 4196 706 4902
39 NF Berry Bash 4207 4207
46 NF Apricot 3061 1051 4112
464 WM French Vanilla 3918 3918
65 NF Black Cherry 3843 3843
4008 LF Peach 3219 3219
461 WM Blueberry 3212 3212
468 WM Strawberry 3179 3179
4004 LF Maple 2598 2598
4011 LF Caramel 1524 610 2134
603 Soy Strawberry 2000 2000
604 Soy Blueberry 1959 1959
4003 LF Mocha 1929 1929
4010 LF Lusc. Lemon 1859 1859
67 NF Strawberry 1811 1811
4000 LF Plain 1771 1771
608 Soy Vanilla 1611 1611
605 Soy Raspberry 1488 1488
466 WM Vanilla 1441 1441
606 Soy Peach 1423 1423
78 Light Strawberry 1005 1005
609 Soy Chocolate 1002 1002
77 Light Blueberry 975 975
79 Light Black Cherry 949 949
80 Light Peach 872 872
* Cases (12 cups/case)
STNY= Stonyfield
TJ= Trader Joes
NF= Non-Fat Milk
LF= Low-Fat Milk
WM= Whole Milk
Light = Non-Fat Light Milk
Soy = Soy Milk
Table 4.1 - Average Scheduled Production per Week
21
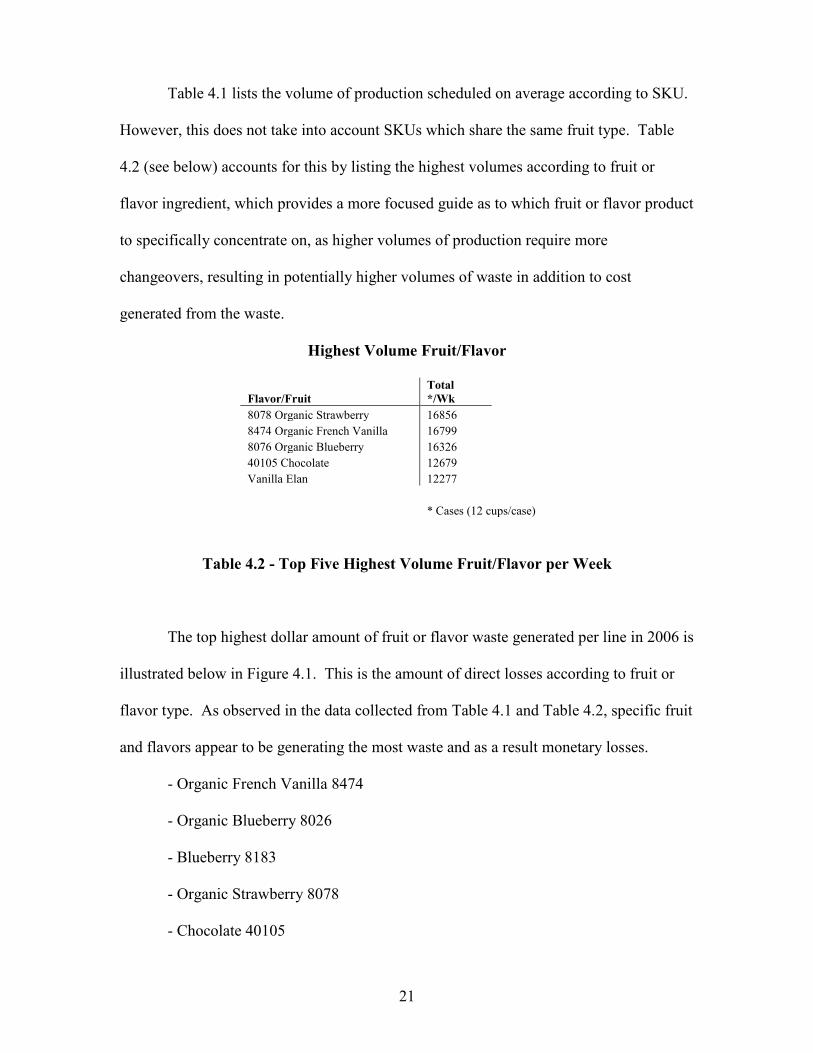
Table 4.1 lists the volume of production scheduled on average according to SKU.
However, this does not take into account SKUs which share the same fruit type. Table
4.2 (see below) accounts for this by listing the highest volumes according to fruit or
flavor ingredient, which provides a more focused guide as to which fruit or flavor product
to specifically concentrate on, as higher volumes of production require more
changeovers, resulting in potentially higher volumes of waste in addition to cost
generated from the waste.
Highest Volume Fruit/Flavor
Flavor/Fruit
Total
*/Wk
8078 Organic Strawberry 16856
8474 Organic French Vanilla 16799
8076 Organic Blueberry 16326
40105 Chocolate 12679
Vanilla Elan 12277
* Cases (12 cups/case)
Table 4.2 - Top Five Highest Volume Fruit/Flavor per Week
The top highest dollar amount of fruit or flavor waste generated per line in 2006 is
illustrated below in Figure 4.1. This is the amount of direct losses according to fruit or
flavor type. As observed in the data collected from Table 4.1 and Table 4.2, specific fruit
and flavors appear to be generating the most waste and as a result monetary losses.
- Organic French Vanilla 8474
- Organic Blueberry 8026
- Blueberry 8183
- Organic Strawberry 8078
- Chocolate 40105

22
Table 3.3 Top Five Highest Volume Fruit/Flavor Usage by Line
Figure 4.1 Top Five Highest Volume Fruit/Flavor Usage Losses by Line
Based upon the data collected, Line 32 and Line 34 will be specifically targeted in
observing the changeover process for areas of improvement due to their high usages in
2006. Organic Chocolate 40105, Organic French Vanilla 8474, and Organic Blueberry
8076 will be the fruit and flavors to observe due to their high production volume and
again, high recorded usages.
The selected flavors and fruit cover the three different types of product which the
assembly lines must handle- the blueberry with a viscose jelly-like texture containing
fruit pieces, the chocolate being a thick viscose liquid distributed to the bottom of each
cup, and the French Vanilla as a pure fluid blended with the base before going into each
Top Fruit/Flavor Usage by Line 2006
$0
$20,000
$40,000
$60,000
$80,000
$100,000
$120,000
$140,000
$160,000
$180,000
BLUEBERRY
8183 TOTE
NMS PEACH
FRUIT 8190
ORG FRENCH
VANILLA 8474
ORGANIC
BLUEBERRY
8076 TOTE
ORGANIC CHOC
VARIGATE
40105 TOTE
ORGANIC
STRAWBERRY
8078 TOTE
21 32 33 34 41

23
cup. Organic Blueberry was selected over the conventional blueberry as the organic
material comes at a cost of at least 50% more than the conventional. Strawberry will not
be observed as generally all fruit products have the same consistency and do not vary as
greatly as that of chocolate and vanilla’s liquid flavoring.
4.2 Flow Chart
The flow chart is used to illustrate the steps involved in the manufacturing
process, from the reception of the raw materials, through its processing methods,
production, incubation, and storage until it is ready to be shipped out to consumers.
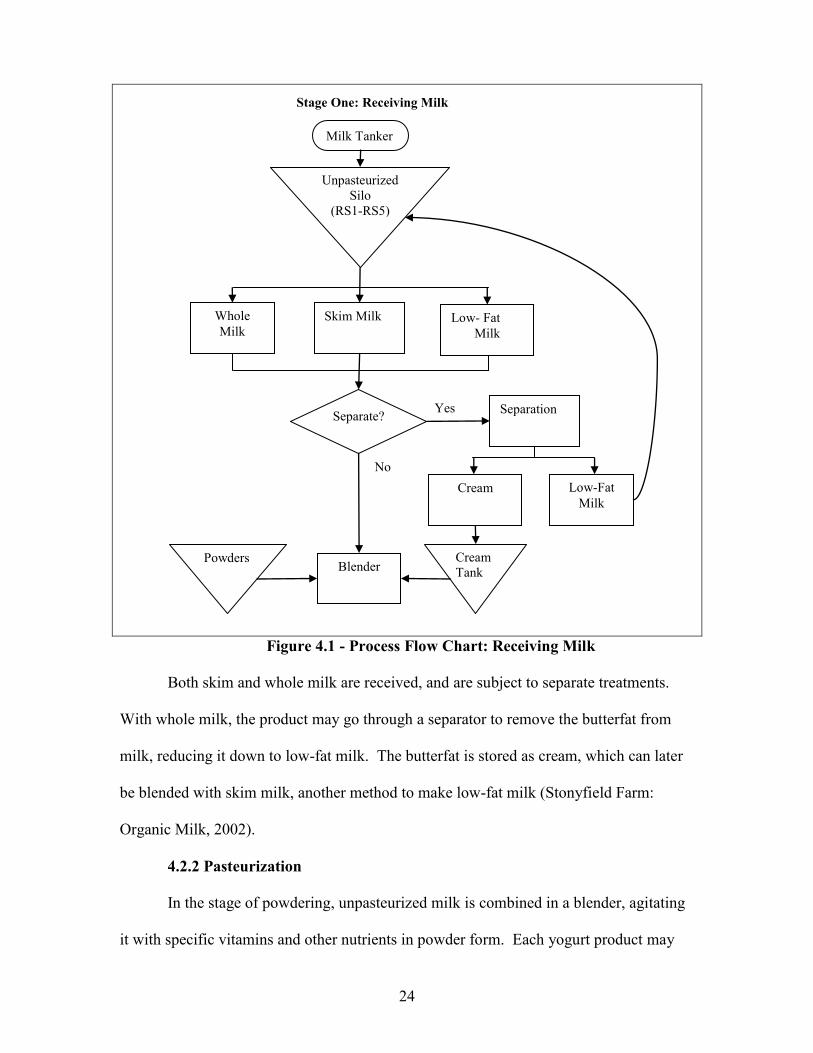
4.2.1 Receiving
Unpasteurized milk is received directly from dairy farmers and stored under a
controlled temperature of a maximum 40 degrees (Stonyfield Farm, Cup Set) inside a
designated silo for raw milk.
24
Figure 4.1 - Process Flow Chart: Receiving Milk
Both skim and whole milk are received, and are subject to separate treatments.
With whole milk, the product may go through a separator to remove the butterfat from
milk, reducing it down to low-fat milk. The butterfat is stored as cream, which can later
be blended with skim milk, another method to make low-fat milk (Stonyfield Farm:
Organic Milk, 2002).
4.2.2 Pasteurization
In the stage of powdering, unpasteurized milk is combined in a blender, agitating
it with specific vitamins and other nutrients in powder form. Each yogurt product may
Milk Tanker
Whole
Milk Low- Fat
Milk
Skim Milk
Blender Cream
Tank
Unpasteurized
Silo
(RS1-RS5)
Separate? Separation
Cream Low-Fat
Milk
Powders
Yes
No
Stage One: Receiving Milk

25
have its own special formulation of milk and powders to create its specific base. The
ingredients are blended, and then fed through to the High-Temperature-Short-Time
(HTST) for pasteurization.
Figure 4.2 - Process Flow Chart: Milk Pasteurization
The process of pasteurization kills harmful organisms and increases the milk’s
shelf life. With the HTST process of pasteurization, the milk is heated for the same
amount of time at a set temperature. The milk passes through metal plates and hot water,
heating it to at least 161 degrees Fahrenheit for at least 15 seconds. For hard yogurt
product, the milk is then subjected to a rapid cooling process and finally stored in a
pasteurized silo. Once the base cycles through the HTST, it gets fed into a pasteurization
silo for storage until it is ready for packaging (Stonyfield Farm: Yogurt Bulk DVS
Cultures, 2004).
Pasteurized
Silo
(PS1- PS6)
Fermentation
Tank
(FT1, FT2)
Filling
Cooling Tube
Pasteurized
Silo (PSD1,
PSD2)
HTST
Yogurt
Smoothie
Stage Two: Milk Pasteurization

26
For yogurt smoothie product, as the base exits the HTST it is inoculated with
cultures then stored in fermentation tanks. Once it is determined that the product has
reached its specifications for the smoothie product, is it cooled through cold tubes then
stored in pasteurized silos, ready for production.
4.2.3 Hard Yogurt Production
From each yogurt manufacturing line, an operator uses a screen to select the silo
to connect his line to in order to receive base for the product. When a silo is selected, the
base travels from the pasteurized silo to the filling room for packaging, through insulated
piping. As soon as it is released from the silo, the base is heated to 108 degrees and
cultures are inoculated into the mixture (Stonyfield: HAACP, 2004). The addition of
cultures into the heated base starts the process of fermentation. When the base reaches
the packaging room, it is held in a bowl located above of the yogurt assembly machine.
There are two operators assigned to the yogurt assembly machine, a filler and a
packer operator. The filler operator works with the actual packaging of the yogurt into
individual cups. The filler is responsible for making sure the yogurt based and fruit and
packaged properly into each cup. Prior to startup, he must prepare stacks of cups in the
Cup Drop, connect the hoses and totes necessary if he is making a product with fruit in
the cup, and sure there are foil seals in place.
27
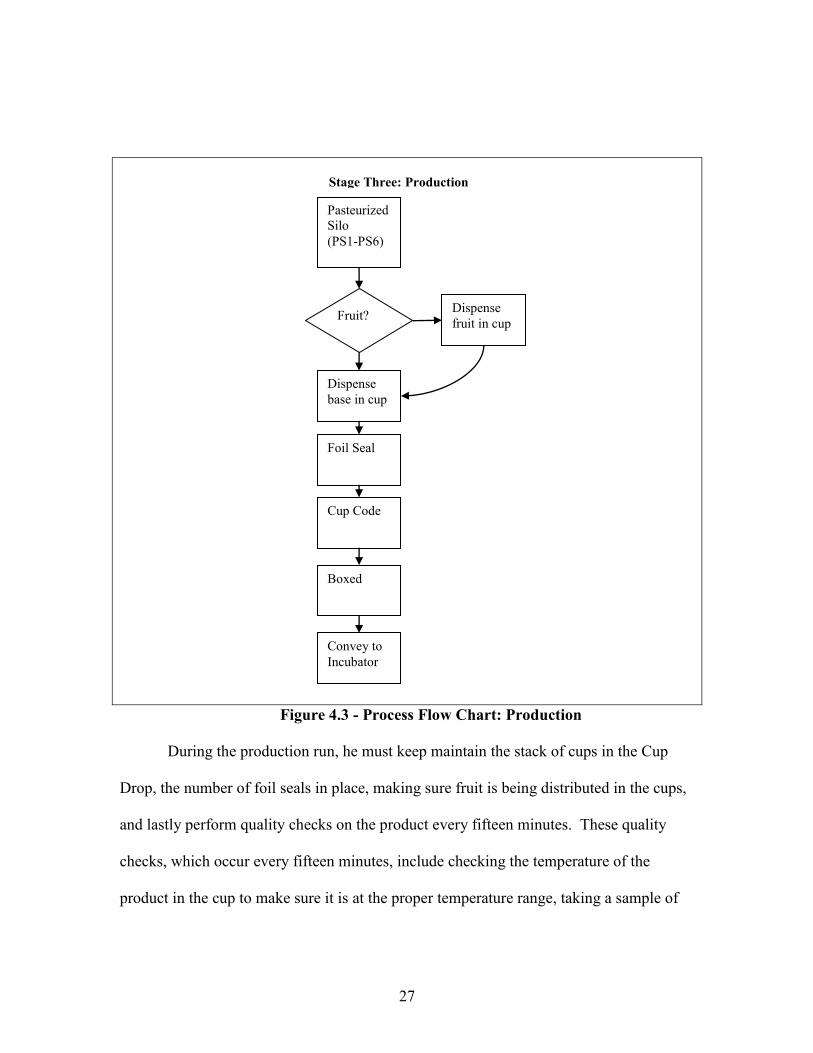
Figure 4.3 - Process Flow Chart: Production
During the production run, he must keep maintain the stack of cups in the Cup
Drop, the number of foil seals in place, making sure fruit is being distributed in the cups,
and lastly perform quality checks on the product every fifteen minutes. These quality
checks, which occur every fifteen minutes, include checking the temperature of the
product in the cup to make sure it is at the proper temperature range, taking a sample of
Pasteurized
Silo
(PS1-PS6)
Dispense
base in cup
Dispense
fruit in cup
Foil Seal
Cup Code
Boxed
Convey to
Incubator
Fruit?
Stage Three: Production

28
cups to weigh on a scale to make sure they are within specifications, and making sure the
foil seals the cup completely.
After the filler operator selects which pasteurized silo he is to pull milk from, he
runs at least 120 gallons of milk out of the bowl and down the drain. This is the quantity
of milk set by the quality department necessary to heat the milk, and ready to be filled in
the cups. If the milk does not meet the minimum required temperature, the product will
not ferment properly, resulting in a cup with hard yogurt but also a clear liquid
consistency. As the yogurt assembly machine runs, yogurt cups are dropped into slots
and carried by a belt, first filled with fruit at the bottom, topped off with the base, sealed,
then conveyed to the packer operator (Stonyfield Farm: Organic Milk, 2002).
The packer operator works with the packaging of cups of yogurt into boxes into
sets of pallets. He is responsible for making fifteen minute checks on the product for
temperature, making sure the foil seals are in place, and ensuring each yogurt cup is
properly coded with an expiration date. When the yogurt is conveyed to the packer
operator from the filler, it goes down a conveyor belt and stamped with an expiration date
prior it being boxed in sets of a dozen. These boxes are conveyed to a palletizer then
these pallets are moved with a fork lift into the incubator.
4.2.4 Incubation
Pallets of yogurt are stored in the incubator. The incubator is a room maintained
at a temperature greater than 104 degrees. Pallets sit in the incubator for at least three
hours until an incubator technician checks the product (Stonyfield Farm: SOP for Quality
Control, 2006). The incubator technician pulls cups of yogurt from each pallet at random
to check the temperature and the consistency. He continues to check each pallet until

29
they reach the appropriate specifications. Once this is reached, the pallet is moved with a
forklift to the cooling tunnel for cooling of the product.
4.2.5 Cooling Tunnel and Storage
The cooling tunnel is the final stage of producing yogurt product. Each pallet
slowly goes through a tunnel, which cools the temperature of the yogurt down to 50
degrees. Once the pallet reaches the end of the cooling tunnel, the yogurt is tested by a
shipping technician to ensure it is of the proper consistency and temperature.
Figure 4.4 - Process Flow Chart: Incubation and Storage
The shipping technician pulls the pallet form the tunnel, and stores it in the
shipping room which is regulated at 50 degrees (Stonyfield: HACCP, 2002). From here,
the cups of yogurt are ready to be shipped and consumed. If a pallet does not meet
quality specifications at any stage of the process, any operator or technician is allowed to
place an orange “Hold” sticker on the pallet, then notify their supervisor to place the
Palletized
Forklift to
incubator
Incubate
(3-5 hrs)
Chill Cell
Storage
Stage Four and Five: Incubation through Storage
30
pallet on the Hold Board. The Hold Board is an Excel sheet accessible to all supervisors
and managers to view and gauge how much of the product produced was placed on hold
for quality issues.
4.3 Yogurt Waste Generated From the Manufacturing Process
As a manufacturer of food products, high quantities of waste are generated to
maintain safe food standards. In the past few years, Stonyfield’s output of product has
tripled. In turn, the amount of waste generated from the manufacturing process has
increased along with this increase in production. Throughout the process of
manufacturing yogurt, waste is generated in varying quantities, from receiving to
incubation. However, the area with the most variables is from the methods of production.
Figure 4.5 is a fishbone diagram showing the cause and effects of flavor and fruit losses.

31
Figure 4.5 – Fishbone Diagram of Areas of Flavor & Fruit Loss
The different ways waste is generated is catalogued in fishbone diagram. The
information illustrated in the fishbone diagram was information acquired through an
eight-month long cooperative opportunity experience, in which the student worked full-
time in the Operations Department of Stonyfield Farm as an industrial engineering intern.
The cause-effect information was generated through observational studies of
operators in various departments- Raw Processing, Production, and Incubation. These
observations involved spending time with an operator of each department for a full day,
noting the physical processes, such as movement of materials, and mental processes, such
as filling out paperwork tracking data, as well. Speaking with the operators on the floor
High Flavor
&
Fruit Usage
MAN METHOD
MACHINE
MATERIAL
Training
Supervision
Moral
Bill of Materials
Meters
Flavor
Hose
Flavor
Pot
Paperwork
End of Run
Start of Run
Changeover
Injection rate
Accuracy
not properly
trained
other line operator filling in
lack of formal
standards
(SOP)
key operator
busy
shift mgr.
busy
product is not
gold
efficiency >
usage
hose diameter
inaccurate weights & measure
scale tare incoming weight
not verified
time
constraints
tote connection
leftover in pot
illegible
handwriting
inaccurate meter
reading
manual flavor
mixing
overflow pressure
spillage
Cause-Effect of Flavor and Fruit Loss

32
was also helpful in gaining insight to operations, how and why certain operations are
performed the way they are done, and the issues, why they may occur and how they are
resolved, which occurred during observations.
In general, there are few standard operational procedures in place for operators to
follow. While there is a changeover standard procedure in existence, there are no
quantified objectives in how to perform this operation. In the packaging department
alone, at least $4000 worth of fruit is disposed of each day through frequent and high
volume flavor changeovers. During a single changeover, one operator may purge 100
gallons of fruit waste, whereas another purges only 30 gallons. Additionally, operators
are more concerned with changing over a product in a timely manner rather than how
much fruit is being wasted, as their production number is the final measurement of their
day’s performance.
Although it is a highly detailed job with varying tasks to keep in mind, there is no
formal training for the position of filler and packer operator. All operators perform their
own procedure for performing an operation, whether it be a changeover or starting up the
line. Different operational procedures results in varying levels of waste generated by
each operator, even though it may be the same process.
4.4 Line Observations
Observations of changeovers on Line 32 and Line 34 were conducted from
February 13 through March 13. The operators of both lines were observed, with each
operator’s operational procedure broken into stages. The time to perform each step was
recorded with a stopwatch. The quantity of waste generated from each step was captured
in a three gallon container, later weighed on a scale.
33
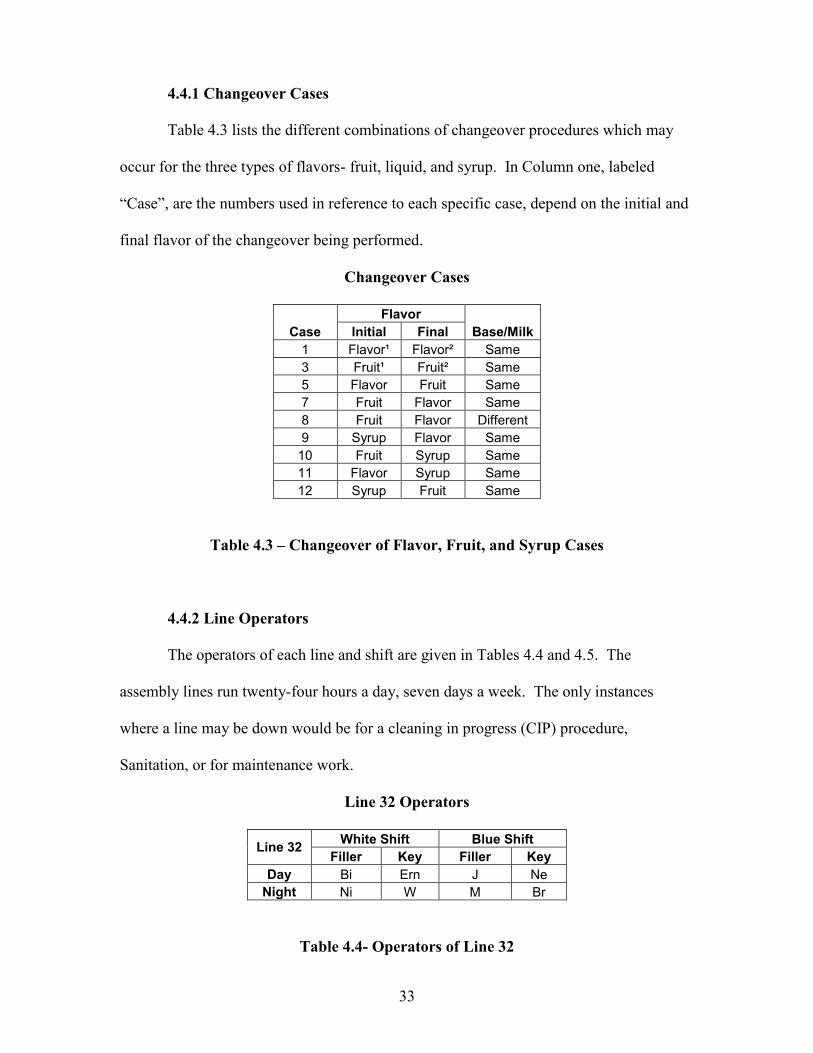
4.4.1 Changeover Cases
Table 4.3 lists the different combinations of changeover procedures which may
occur for the three types of flavors- fruit, liquid, and syrup. In Column one, labeled
“Case”, are the numbers used in reference to each specific case, depend on the initial and
final flavor of the changeover being performed.
Changeover Cases
Case
Flavor
Base/Milk Initial Final
1 Flavor¹ Flavor² Same
3 Fruit¹ Fruit² Same
5 Flavor Fruit Same
7 Fruit Flavor Same
8 Fruit Flavor Different
9 Syrup Flavor Same
10 Fruit Syrup Same
11 Flavor Syrup Same
12 Syrup Fruit Same
Table 4.3 – Changeover of Flavor, Fruit, and Syrup Cases
4.4.2 Line Operators
The operators of each line and shift are given in Tables 4.4 and 4.5. The
assembly lines run twenty-four hours a day, seven days a week. The only instances
where a line may be down would be for a cleaning in progress (CIP) procedure,
Sanitation, or for maintenance work.
Line 32 Operators
Line 32 White Shift Blue Shift
Filler Key Filler Key
Day Bi Ern J Ne
Night Ni W M Br
Table 4.4- Operators of Line 32
34
Every four hours, a sanitation procedure is performed by the operator; each line
automatically shuts down for 10-15 minutes. The operator scrubs the milk and fruit
fillers free from buildup and debris, and then the line automatically rinses itself and starts
running.
The assembly lines go down every twenty-four hours for a period varying from
two to three hours to perform a required procedure, CIP. The operator takes apart pieces
of the line, individually scrubbing and soaking the pieces in a cleansing solution. The
line rinses itself free of buildup and debris before the operator reassembles the pieces
onto the line.
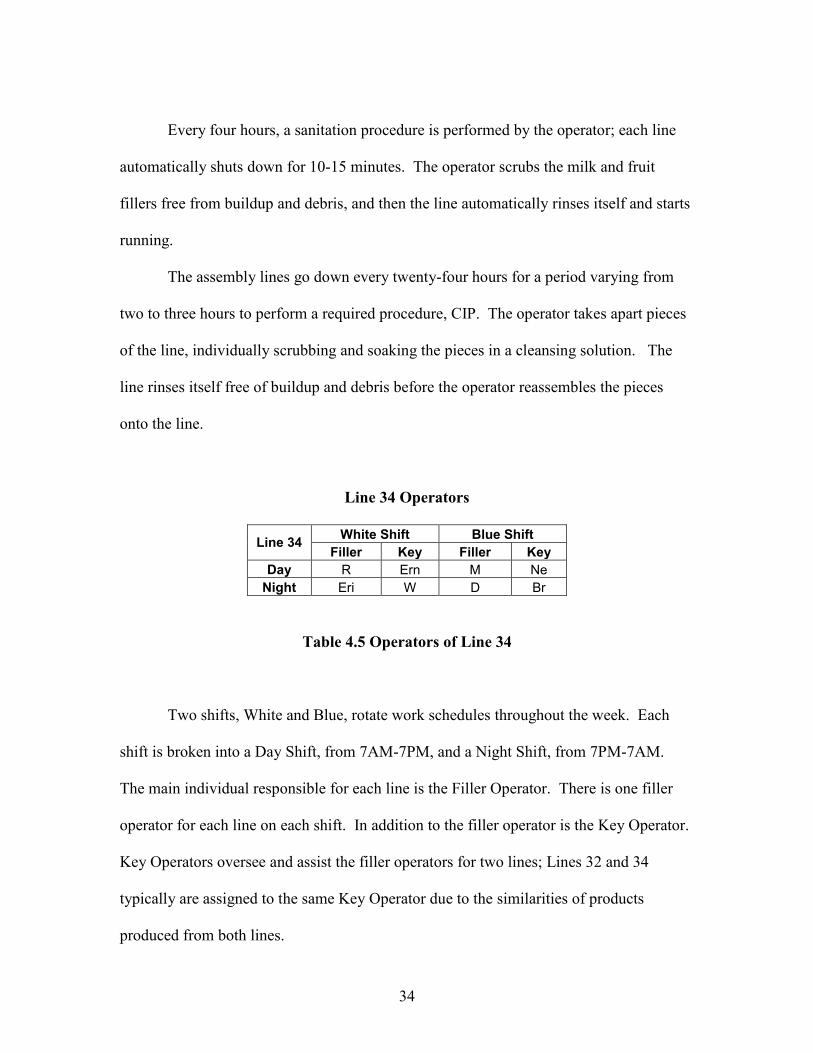
Line 34 Operators
Line 34 White Shift Blue Shift
Filler Key Filler Key
Day R Ern M Ne
Night Eri W D Br
Table 4.5 Operators of Line 34
Two shifts, White and Blue, rotate work schedules throughout the week. Each
shift is broken into a Day Shift, from 7AM-7PM, and a Night Shift, from 7PM-7AM.
The main individual responsible for each line is the Filler Operator. There is one filler
operator for each line on each shift. In addition to the filler operator is the Key Operator.
Key Operators oversee and assist the filler operators for two lines; Lines 32 and 34
typically are assigned to the same Key Operator due to the similarities of products
produced from both lines.

35
4.4.3 Changeover Standards
Operators are given a standard of how much time it should take to perform
specific changeover procedures; this standard is located in the back of the CUTE sheet.
Changeover Standards
Base (min)
Type Same Different
Liquid 10 12
Fruit 11 13
Syrup 12 14
Table 4.6 Changeover Standard Times
If an operator takes more time than is allotted to perform the procedure, only then
are they required to record information to attribute as to why it took more time than
necessary to perform the operation. The lack of a standard when it comes to flavor waste
generated does not hold filler operators accountable to the amount of created.
4.4.4 Line 32 and Line 34 Characteristics
Lines 32 and 34 both manufacture 6 oz cup products; however both lines have
inherently different operating characteristics (see Table 4.7).
Line 32 and Line 34 Assembly Lines
Line 32 34
Description Modern Modern
Model # MP358 MP480
Product 6 oz 6 oz
Installed 1994 1992
per stroke 12 6
strokes/min 22.3 35.1
cups per min 267.6 210.6
Cups per case 12 12
lbs/cup 0.375 0.375
Table 4.7 Line 32 and 34 Assembly Line Characteristics

36
Line 34 was one of the first 6 oz cup assembly lines installed at Stonyfield Farm,
in 1992. It produces six cups per stroke, set at 35.1 strokes per minute. This line is set to
produce up to 210.6 cups per minute when the line is running at its most optimal level of
efficiency with an attentive and responsive operator, and without any maintenance issues.
Line 32, installed in 1994, is set for less strokes per minute, however it produces
12 cups per stroke. As a result, overall this line produces a greater quantity of 6 oz cups
than Line 34. Line 32 produces 267.6 cups per minute, versus line 34 at 210.6 cups per
minute.
Based upon past experiences, syrups such as chocolate run better on Line 34 than
32 in regards to usage. Syrups have been observed to leak out of the fruit valves and
splatter outside of the cup on Line 32. The usage numbers which quantify the amount of
flavor used, per the schedule quantity, frequently indicated the usage of chocolate on
Line 32 was greater than on Line 34. Therefore, Line 34 is always scheduled to run
chocolate and only in rare instances where it cannot be avoided due to scheduling and
demand is chocolate run on Line 32.
While both lines are different, they essentially require the same steps to perform a
changeover.
4.4.5 Line Observations Data
The amount of waste generated during observed changeover processes are shown
for Lines 32 (Table 4.8) and 34 (Table 4.9). The observations were made from the period
of February 13th
through February 28th
. Observations were based operators of the day
shift for both Blue and White Shift.

Line 32 Changeover Usage
LINE 32 START END
Op
era
tor
Case Start Time End Time Total Time (min)
Start Flavor Usage (gal)
End Flavor Usage (gal) Date SKU Base Flavor SKU Base Flavor
2/28 468 WM Strawberry 461 WM Blueberry J 3 2:32PM 2:38PM 6 15 15
2/26 4016 LF Blue/Straw 4002 LF Vanilla Bi 7 3:22PM 3:33PM 11 15 -
2/23 4016 LF Blue/Straw 4001 LF Blueberry J 3 3:03PM 3:07PM 4 15 15
2/22 44 NF Blueberry 49 NF Lemon Bi 7 5:45PM 5:55PM 10 25 -
2/21 41 NF Strawberry 44 NF Blueberry Bi 3 3:10PM 3:15PM 5 25 25
2/19 197 LF Blue/Straw 4004 LF Maple Vanilla J 10 1:45PM 1:54PM 9 15 -
2/19 4004 LF Maple Vanilla 4005 LF Raspberry J 12 5:50PM 5:58PM 8 20 20
2/13 4002 LF Vanilla 198 LF Blue/Straw Bi 5 1:00PM 1:11PM 11 20 20
Table 4.8 Line 32 Changeover Usage Data

38
Line 34 Changeover Usage
Table 4.9 Line 34 Changeover Usage Data
LINE 34 START END
Op
era
t
or Case Start Time End Time
Total Time (min)
Start Flavor Usage (gal)
End Flavor Usage (gal)
Date SKU Base Flavor SKU Base Flavor
2/26 4003 LF Mocha 4002 LF Vanilla Ne 1 4:42PM 4:46PM 4 15 -
2/23 4008 LF Peach 4001 LF Blueberry M 3 5:14PM 5:20PM 6 20 50
2/22 4005 LF Raspberry 4006 LF Strawberry R 3 3:38PM 3:43PM 5 15 20
2/21 468 WM Strawberry 461 WM Blueberry R 3 1:40PM 1:46PM 6 15 20
2/21 461 WM Blueberry 57 LF Chocolate R 10 4:11PM 4:19PM 9 20 20
2/21 57 LF Chocolate 40 LF Fr. Vanilla R 9 6:10PM 6:21PM 11 20 -
2/20 464 WM Vanilla 4001 LF Caramel M 11 6:01PM 6:11PM 10 20 20
2/13 45 LF Blk Cherry 4002 LF Vanilla R 7 3:44PM 3:54PM 10 20 -

The starting flavor and the end flavor are each assigned a specified type according
to whether fruit, flavor, or flavor syrup is being changed; a summary of each operational
type is found on Table 4.3.
The total time the changeover process took was tracked with a stopwatch. The
amount of usage generated from the ending flavor and the start flavor were collected in
buckets and later calculated to determine the usage from each flavor type
Overall Usage Summary
Case Initial Final Base Avg Usage
(lbs) Avg Time
(min)
1 Flavor A Flavor B Same 15 4
3 Fruit A Fruit B Same 30 5.5
5 Flavor Fruit Same 40 11
7 Fruit Flavor Same 30 10
9 Syrup Flavor Same 20 11
10 Fruit Syrup Same 40 9
12 Syrup Fruit Same 40 8
Table 4.10 Line 34 & Line 32 Average Usage Summary
4.5 Interviews
Interviews were conducted with day shift filler operators and key operators of
both blue and white shift. Operators broke down the steps involved for each different
type of changeover process they perform in accordance to the production schedule for
their respective lines.
4.5.1 Fruit to Fruit Changeover
There are two methods to perform a Fruit to Fruit changeover (Case 3, Case 4).
The first method is a fruit push, in which the changeover is performed by replacing the

40
previous fruit tote with the upcoming fruit tote. The old fruit is pushed out of the piping
by the new fruit. The fruit push is performed until all signs of the old fruit are non
existent- color, texture, or fruit seeds if applicable. The second method is a water push,
in which the fruit tote to be change is disconnected and the piping is flushed through with
water until all signs of the old fruit are cleared. From there, the upcoming fruit tote is
connected and the fruit is purged until the flow of the fruit is consistent.
Generally, the fruit push method uses more fruit in the changeover processes and
takes approximately 7 minutes. The water push takes a considerably greater amount of
time at about 10 minutes due to the additional process of connecting and disconnecting
the waterline and other minor setup changes. However, less fruit is used during this
changeover process as it is not as subjective as the fruit push where the operator
determines whether the old fruit has cleared and the new fruit is fit for running on the
line.
4.5.2 Fruit to Liquid Flavor or Flavor Syrup Changeover
The fruit to flavor changeover process is essentially the same as the water push
process. The connections for the fruit tote are removed and the piping is connected to a
waterline to flush remnants of the fruit out until the water appears clear. During the time
the water is running to clear the piping, the operator typically sets up the new flavor by
bringing the flavor tote or pallet of flavor buckets over makes the necessary connections.
A flavor tote is given an attachment in which the operator twists a handle and the flavor
flows into a flavor pot for flavoring. A pallet of flavor buckets, for flavors such as Key
Lime and Maple, is dispensed to the line by the operator opening each individual bucket
and pouring the flavor into the same flavor pot.

41
When the piping is cleared of the old fruit and the connections are made, the
flavor is pumped and blended with the base (milk), and the operator runs the set amount
of 120 gallons of down the drain to heat the milk and ensure the flavor has properly
blended with the base.
4.5.3 Liquid Flavor or Flavor Syrup to Fruit Changeover
The flavor to fruit changeover is similar to the Fruit to Flavor Changeover except
performed backwards, and the amount of usage generated differs. When the line has
produced the amount of cases required for the run, operators are instructed to run the
remaining flavor in the pot until it is empty or reasonably empty; there is no set quantity
for reasonably empty. The connections to the flavor pot are removed and any remaining
flavor goes down the drain. The operator connects the fruit tote to the line and purges the
fruit until a consistent flow is observed.
42
5. ANALYSIS
As a result of interviews with the filler line operators and observations made on
each line during changeovers, a standard for the fruit to fruit changeover usage has been
identified at thirty pounds of fruit. Additionally, the high variance of fruit distributed to
each cup by each filler head as identified with the fruit capabilities study, indicating the
need for an updated filler head distribution system for better control of the dosing of fruit
into individual cup.
5.1 Standardizing Changeover Usage
A standard for the fruit to fruit changeover usage has been identified at thirty
pounds of fruit. The multiple observations on the line during the changeover process
indicated usage from a changeover varied from thirty to fifty pounds. In the observation
where fifty pounds of fruit was used during the fruit to fruit changeover process, the
operator continued to purge fruit into the bucket even though the stage of purging could
have been stopped earlier in the process at thirty pounds. It was observed that thirty
pounds was the average baseline usage in order to properly change the fruit over without
leaving any residue and generating an excessive amount of fruit waste.
5.1.1 Cost Benefit Analysis- Fruit Changeover Procedure
The cost benefit analysis compares the cost of the two most frequently occurring
changeover processes- the fruit push and the water push method. In Table 4.12, data on
both Line 32 and Line 34’s production capabilities are provided to determine the quantity
of cups that may be produced per minute. This is compared to the methods of fruit and or
flavor changeovers via the water push and fruit push method.

43
Cost-Benefit of Line 32 and Line 34
Water Push Fruit Push
Line Speed Cups Cups/Min Fruit Usage
(lbs) Time Usage
(min) Fruit Usage
(lbs) Time Usage
(min)
32 22.3 12 267.6 25 10 75 5
34 25.1 6 150.6 25 10 75 5
4.11 Cost Benefit Analysis of Line 32 and Line 34
A cost benefit analysis of both the fruit push and water push method was done for Line
32 rather than line 34, as it produces the most cups per minute, at 267.6 cups versus 150.6
cups. The formula for calculating the net dollar amount loss due to usage is based upon
each cup set at producing a profit of $0.30 each, with the average operational efficiency
of Line 32 at 65% (Group Danone, 2006) Line 32 is capable of producing 267.6 cups per
minute at 100% operational efficiency.
P [ (OE * R) * T] = Loss due to Time
P = Profit Per Cup
= $0.30
OE = Operational Efficiency
= 65%
= 0.65
R = Production Rate
= 267.6 cups/min
T = Time to perform changeover
(average time based on observations)
Profit Loss Due to Water Push Time
T = 10 minutes
$0.30 [( 0.65 * 267.6 cups/min) * 10 min] = $ 521.82
Profit Loss Due to Fruit Push Time
T = 5 minutes
$0.30 [( 0.65 * 267.6 cups/min) * 5 min] = $ 260.91

44
In performing the water push method over the fruit to fruit push, the loss in production
time, five minutes, results in the loss of $260.91 in potential sales profit.
= Water Push time loss – Fruit Push time loss
= $521.82 - $260.91
= $260.91
The savings in performing the water push over the fruit push, saving 25lbs of fruit per
changeover, results in $34.50.
F = Fruit Push Usage
= 75lbs
W = Water Push Usage
= 50lbs
C = Average Cost of Fruit
= $1.38/lb
= ( F - W ) * C
= (75lbs - 50lbs ) * $1.38/lb
$ 34.50
In comparing both methods, performing the fruit push method over the water push
method is most optimal. The addition of five minutes in performing the water push
results in the loss of $260.91, versus simply performing the fruit to fruit push method and
using an additional twenty five pounds of fruit, or $34.50.
5.1.2 Standard Quantity for Fruit to Fruit Push Changeovers
For fruit to fruit pushes, the standard weight of usage generated from the changeover
process should be at 30lbs. This will set the baseline standard for an acceptable amount
of usage to be generated when a changeover is performed. Filler operators are to purge
the maximum of 30lbs of fruit during a changeover procedure. Variance to this baseline

45
standard must be identified and the root cause for this must be identified in order to
prevent over usage to occur during a subsequent changeover.
5.2 New Fruit Dose System
As a part of their job functions, filler operators check the weight of each cup
every fifteen minutes to obtain the current distribution rate of fruit per cup. The quantity
of fruit or flavor per gram distributed in each cup varies; these variations in fruit
distribution are inherent in the assembly machine itself. If a cup is identified as being not
at the target weight for fruit or flavor, the filler operators manually adjust the fruit valves
to bring the weight up to standard. Typically, operators find themselves adjusting the
valves down, as too much fruit is being distributed into each cup. In order to verify the
variability of fruit distributed into each cup, a study was performed on each filler head on
Line 32.
5.2.1 Fruit Capabilities Study
A fruit capabilities study was performed on Line 32, in which each filler head produced
fifty cups each containing fruit dispensed from the line into the cup. The line ran as is
without any adjustments made to the fruit valves to control the weight. A sample of cups
were weighed to determine the average cup weight of 7.15grams. The data captured on
each cup’s fruit weight distributed by the filler head is summarized in Table 4.11.

46
Line 32 Fruit Dosage Weight (g) by Filler Head
Filler Head
1 2 3 4 5 6 7 8 9 10 11 12
Average
52.3g
53.0g
47.5g
47.6g
45.2g
52.0g
54.1g
56.7g
49.0g
46.8g
48.1g
48.5g
Max
58.0g
74.0g
66.3g
80.0g
66.3g
62.6g
80.0g
110.8g
62.0g
55.7g
65.6g
65.9g
Min
49.0g
3.0g
5.0g
7.0g
9.0g
11.0g
48.2g
39.5g
43.9g
43.6g
44.1g
43.2g
Spread
9.0g
71.0g
61.3g
73.0g
57.3g
51.6g
31.8g
71.3g
18.1g
12.1g
21.5g
22.7g
Table 4.12 Line 32 Fruit Dosage Weight (g) Summary
From the fruit capabilities study, the average weight of fruit distributed into each cup
ranges from 45.2 to 56.7 grams. The average per cup was 50.95 grams, which is
16.95grams greater than the set requirement of 34 grams of fruit per cup. The maximum
and minimum weights overall vary from 3.0 to 110.8 grams.
5.2.2 No Fill Cups Reported Consumer Complaints
In addition to the variation of fruit distributed in each cup by the line are cups in
which no fruit goes into the cup. As with the variation in fruit weights per cup, the lack
of fruit in a cup is an issue inherent in the assembly machine in addition to the machine’s
age.
47
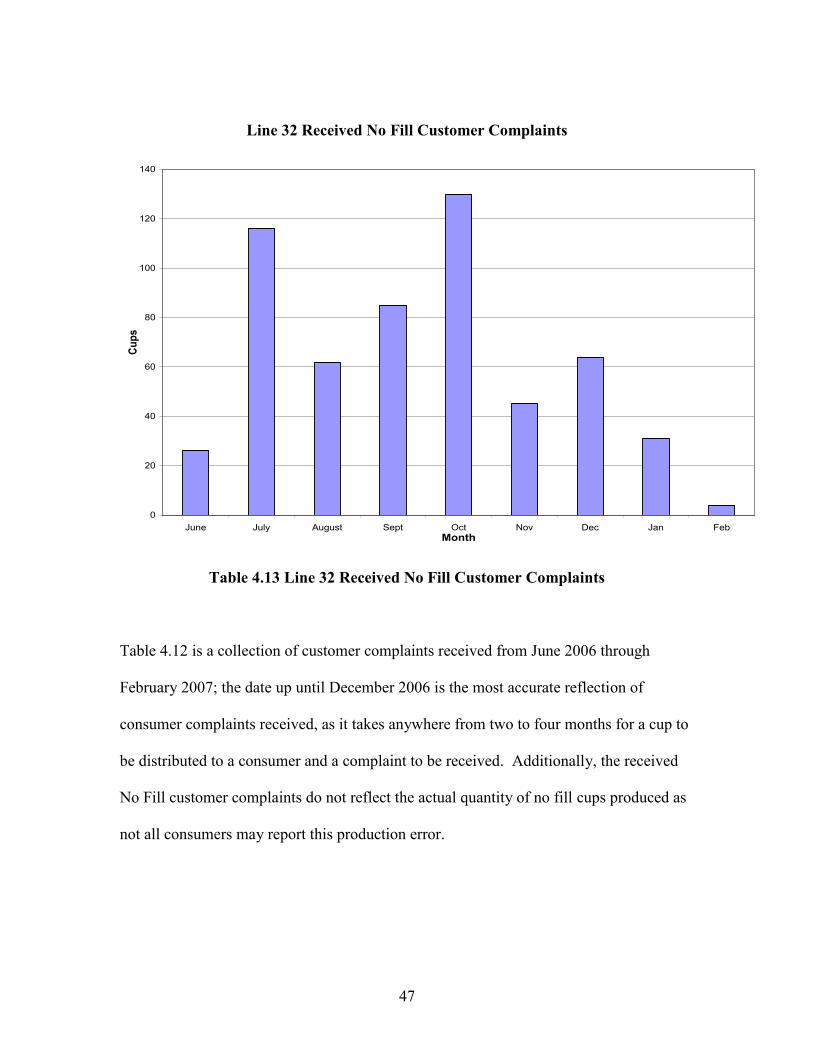
Line 32 Received No Fill Customer Complaints
0
20
40
60
80
100
120
140
June July August Sept Oct Nov Dec Jan Feb
Month
Cu
ps
Table 4.13 Line 32 Received No Fill Customer Complaints
Table 4.12 is a collection of customer complaints received from June 2006 through
February 2007; the date up until December 2006 is the most accurate reflection of
consumer complaints received, as it takes anywhere from two to four months for a cup to
be distributed to a consumer and a complaint to be received. Additionally, the received
No Fill customer complaints do not reflect the actual quantity of no fill cups produced as
not all consumers may report this production error.

48
Line 34 Received No Fill Customer Complaints
0
10
20
30
40
50
60
70
80
90
100
June July August Sept Oct Nov Dec Jan Feb
Month
Cu
ps
Table 4.14 Line 34 Received No Fill Customer Complaints
5.2.3 Description of Fruit Dose System
The Dosys Dosefruit System is “The benchmark for the injection of fruit into
fresh dairy products" (Dosys, 2003). The benefits from the installation of this piece are
plentiful, according to the supplier. Transition phases, such as changeovers, are
improved to reduce fruit waste. Secondly, recipes can be changed without stopping the
machine, and as a result reducing the amount of downtime and loss of production time.
Additionally, Dosys provides more control on the distribution of fruit for various sized
ingredients. Lastly, it is able to detect the bottom of containers; rather than having
operators shake each tote to feel if it is light, Dosystem empties containers.

49
5.2.4 Cost of Fruit Dose System
A return on investment calculation compares the cost of a new feature with its resulting
value; determining if the new feature is worth implementing. The cost for installation of
the Dosystem may be found in Table 4.14
Replacement Fruit Dosing System Costs
Filler 32 Fruit Dosing System Supplier Cost
PROCESS MATERIAL Automatic Process Valves TUCHEN $6,792.05 Pump FRISTAM $19,474.46 Mixers and Others Process Special Equipment ULTRAFILTER $4,180.34 Instrumentation E&H $10,297.45 Piping Labor TIGPRO $14,617.83 Material- Tube ALFA $2,827.80 Equipment storage, rental TIGPRO $1,333.87 Mechanical field supervisor $2,667.73 ELECTRICAL Electrical Studies RICHARDSON $640.26 Electrical labor RICHARDSON $15,206.08 Material RICHARDSON $8,626.33 Equipment rental, consumable … RICHARDSON $1,333.87 Electrical field supervisor $2,667.73 Automation $8,405.80 Design and Engineering $7,222.22 Field Labor- Tests / Commissioning $10,543.80
Transport of Equipment and Logistic for misc. components $1,333.87 Travels- Project Manager, Field Technician, Automation $7,322.86 Others: Training, Highlighted Diagrams, etc. $588.24
Total Cost $126,082.58
Table 4.15 Total Cost of Filler 32 Fruit Dosing System
According to the fruit capabilities study, when Line 32 ran without any
adjustments on the fruit valves made by the line operator, an average of 16.95grams extra
fruit was distributed into each cup. The total value of savings in fruit overfills by
installing the Dosystem- which allows for more control over the dosing of fruit into cups-

50
will be compared with the estimated cost for installing the Dosystem (Table 4.14) over a
period of time to determine the breakeven point and when a return on the investment will
ultimately occur.
Return on Investment= Benefits- Cost
Benefits= savings on fruit over usage (16.95grams/cup)
Cost= $126,082.58 (See Table 4.14)
* 24 hrs/day
-0.5 hrs/day Sanitation
-3 hr/day CIP
20.5 sub total of hrs/day running
13.325 total of hrs/day running at 65% OE
** Average fruit cost of $1.20/lb
*** Usage per day based up on 13.25 hrs/day running at 65% OE
5.2.5 Return of Investment of Dosystem
Table 4.15 and 4.16 contain data on the expected breakeven point in which the savings
from the addition of the Dosystem pays for itself through savings in overfilling cups with
fruit. The cost of fruit per pound was set at the average of $1.38.
Type Cost
Organic Blueberry 8076 $ 1.44/lb
Organic Strawberry 8078 $ 1.33/lb
$ 1.38/lb
51
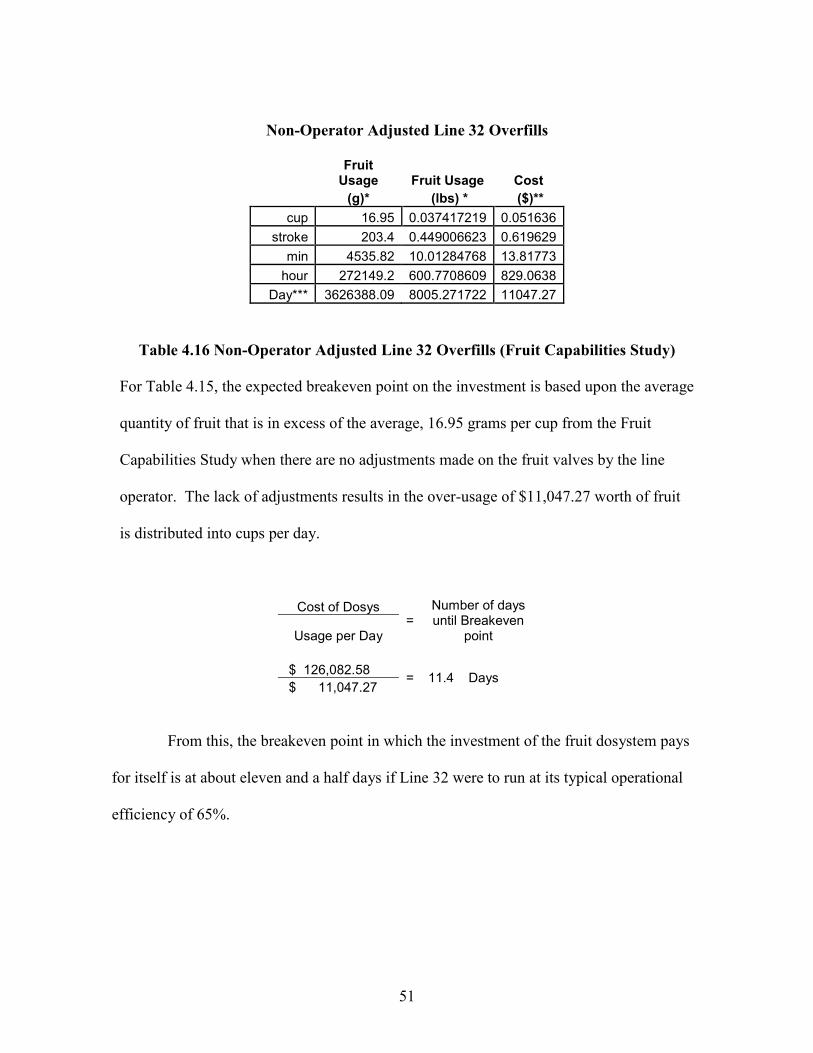
Non-Operator Adjusted Line 32 Overfills
Fruit
Usage Fruit Usage Cost
(g)* (lbs) * ($)**
cup 16.95 0.037417219 0.051636
stroke 203.4 0.449006623 0.619629
min 4535.82 10.01284768 13.81773
hour 272149.2 600.7708609 829.0638
Day*** 3626388.09 8005.271722 11047.27
Table 4.16 Non-Operator Adjusted Line 32 Overfills (Fruit Capabilities Study)
For Table 4.15, the expected breakeven point on the investment is based upon the average
quantity of fruit that is in excess of the average, 16.95 grams per cup from the Fruit
Capabilities Study when there are no adjustments made on the fruit valves by the line
operator. The lack of adjustments results in the over-usage of $11,047.27 worth of fruit
is distributed into cups per day.
Cost of Dosys =
Number of days until Breakeven
point Usage per Day
$ 126,082.58 = 11.4 Days
$ 11,047.27
From this, the breakeven point in which the investment of the fruit dosystem pays
for itself is at about eleven and a half days if Line 32 were to run at its typical operational
efficiency of 65%.

52
Operator Adjusted Line 32 Overfills
Fruit Usage Fruit Usage Cost
(g)* (lbs) * ($)**
cup 3 0.006613873 0.009127
stroke 36 0.079366479 0.109526
min 802.8 1.769872485 2.442424
hour 48168 106.1923491 146.5454
Day*** 641838.6 1415.013051 1952.718
Table 4.17 Operator Adjusted Line 32 Overfills
For Table 4.16, the expected breakeven point on the investment is based upon the average
quantity of fruit that is in excess of the average, three grams per cup when adjustments
made on the fruit valves by the line operator as needed when cups weights are checked
every fifteen minutes. Even with adjustments made by the line operator, an excess of
$1,698.02 worth of fruit is distributed into cups per day.
Cost of Dosys =
Number of days until Breakeven
point Usage per Day
$ 126,082.58 = 64.5 Days
$ 1,952.718
From this, the breakeven point in which the investment of the fruit Dosystem pays
for itself at sixty-four and a half days, or a little over two months of production time, if
Line 32 were to run at its typical operational efficiency of 65%.

53
6. CONCLUSION
The research process conducted for this project resulted in the ability to
determine the baseline standard for purging fruit during a changeover. Additionally, the
best practice for a fruit and or flavor changeover on the 6 oz product lines of 32 and 34
was identified as the fruit to fruit push. The process was selected based upon a series of
criteria set to minimize fruit and flavor waste and changing over in the least amount of
time. Lastly, recommendations were made for updating the current fruit filler heads with
a dosing system able to better control the distribution of fruit into each cup.
The baseline changeover usage quantity of fruit to be purged is thirty pounds.
Changeovers observed on the line indicated a range of thirty to fifty pounds of usage
purged during the process. Thirty pounds was the observed baseline in performing the
changeover process, effectively purging remnants of the old fruit.
In comparing the fruit to fruit push versus water push for changeovers, the fruit
to fruit push is the more time and cost efficient process. While the fruit tote method took
five minutes less to perform than the water push, the value of time the five minutes lost
was calculated to be $260.91. The fruit push method used an additional twenty five
pounds of fruit at the cost of $34.50.
In updating the current fruit dosing system, an initial investment of
approximately $126,000 would be made, seeing a return on its cost in a little over two
months of production time.
The recommendations included in this paper will assist Stonyfield Farm in
keeping its fruit and flavor usage during changeovers to a minimum in both cost of
material and labor.
54
REFERENCES
1. Berne, Steve. Beat the Competition with Agile Manufacturing. Prepared Foods,
Sept. 1995.
2. Chase, Richard, F R. Jacobs, and Nicholas J. Aquilano. Operations Management for
Competitive Advantage. 10th ed. Boston: McGraw Hill Co., 2004. 336.
3. Coleman, Tom, and Terry L. Grimes. NIST Handbook 133: Checking the Net
Contents of Packaged Goods. 4th
ed. National Institute of Standards and Technology,
Jan. 2002.
4. Doganis, Philip. Optimal scheduling in a yogurt production line based on mixed
integer linear programming. Journal of Food Engineering, v 80, n 2, May 2007, p 445-
453
5. Dosys: Dosyfruit. Vanves, France: PCM Pumps. 2003. <http://www.pcm-
pump.com/upload/gestionFichiers/GB-Food-System-Dosyfruit_648.pdf>
6. Flora, Roberto. Yogurt Forever: The Yogurt Encyclopaedia. 2002.
< http://www.yogurtforever.org/download/yogforevuk.pdf>
7. Galsworth, Gwendolyn. The Value of Vision. Industrial Engineer. Aug. 2004, p 44-
49.
8. Groupe Danone. CUTE: Capacity, Utilization, Time & Efficiency, Revision B.
August 2006.
9. Hirschberg, Meg. The Stonyfield Farm Cookbook. Vermont: Cambden House
Publishing. 1993.
10. Metters, Richard, and Madeleine Pullman. Successful Service Operations
Management. Mason, Ohio: Thomson South-Weston. 2003.
11. Nembhard, Harriet B. Controlling Change: Process Monitoring and Adjustment
During Transition Periods. Quality Engineering, v 14, n 2, 2001-2002, 231-44.
12. Personal, Fatigue, and Delay (PF&D) Allowances. July 27, 2004. p 37-46.
13. Petrak, Lynn. Multi-Cultural: The Yogurt Category Continues to Make the Case
with New Flavors and Formats. Dairy Field Magazine. 2006.
14. Silber, Kenneth. Calculating Return-on Investment. Silber Performance. 2002.
<http://www.ispi.org/proComm/resources/ROICalculationsSilber.pdf>
15. Stonyfield Farm: Downtime Sheet Category Definitions. March 7, 2006.
55
16. Stonyfield Farm, HACCP Standard for Cupset Yogurt For B Process Flow Diagram.
Dec. 20, 2004.
17. Stonyfield Farm: Process Flow Diagram L. Reutreri Bulk Culture. Dec. 20. 2004.
18. Stonyfield Farm: Flowchart for Manufacturing Organic Bulk Culture K and Y. May
30, 2003.
19. Stonyfield Farm: Process Flow Diagram, Organic Milk. 2002.
20. Stonyfield Farm: Process Flow Diagram, Yogurt Bulk DVS Cultures. Dec. 20,
2004.
21. Stonyfield Farm: Standard Operating Procedure for Incubating Cold and Water push
Pallets. June 19, 2006.
22. Stonyfield Farm: Standard Operating Procedure for Quality
Control/Troubleshooting. June 19, 2006.