materials and methods - shodhgangashodhganga.inflibnet.ac.in/bitstream/10603/84820/12/12... ·...
TRANSCRIPT
50
CHAPTER – 3
MATERIALS AND METHODS
The details of materials and methods have been carried out under the following
headings:
3.1 Isolation and establishment of microalgae culture under optimum
laboratory condition
3.1.1 Field survey and collection of microalgae samples
The seven sister states of North Eastern Region of India, more particularly Assam is
very rich in biodiversity of freshwater microalgae. For the present study different
locations representing entire Kamrup district of Assam were selected for collection
of microalgae samples. Kamrup district has an area of 4345 square kilometers,
average rainfall of 1717.7 mm and an average humidity of 75%
(http://www.assaminfo.com). Microalgae samples were collected from Jalukbari,
North Guwahati, Sonapur and Chandrapur area of Kamrup district, Assam [Plate-1].
Aquatic sites like ponds, beels, rivers, wet lands, drainage systems, waste water
from factories, industries etc were randomly selected and algal samples were
collected [Plate-2]. In nature microalgae exist in mix forms, as there are number of
aquatic species of them grow together. So to have the desired and pure form of the
microalgae, there are several steps involved in this process. All microalgae do not
show same type of growth in nature, some exist in dominant forms than others, so it
is critical and need intense effort to culture all the collected samples and separate
them from each other. The pH of each aquatic systems were recorded from where
51
algal samples were collected and clean and sterile bottles were used to collect algae
samples so as to avoid any contamination.
3.1.2 Isolation of microalgae strains and pure culture
Collected sample were taken to the laboratory and isolation procedure was initiated
within 24 hours of sample collection because time is a crucial factor for microalgae
isolation procedure, as a few species are unable to grow in presence of some
dominating species and tend to disappear with time (Kaur 2011). The water samples
were gently filtered to remove unwanted aquatic plant species or other filamentous
macroalgae. Microscopic examination may be also carried out whenever necessary.
The collected natural water samples contained many microalgae species like
Chlorella sp., Haematococcus sp., Ankistrofalcatus falcatus, Selenastrum sp.,
Scenedesmus dimorphus, Euglena gracilis, Scenedesmus quadricauda,
Desmodesmus sp., Pediastrum sp., Nostoc sp. etc. which were observed under
optical microscope. Isolation procedure was carried out on the basis of keys
provided by Anderson and Kawachi (2005).
3.1.3 Enrichment of collected samples
Enrichment cultures are used as a preliminary step towards single-cell isolation.
This is performed by adding nutrients to collected samples, which enriches them, so
that algal growth may occur. There is existence of limiting factors in case of natural
algae samples, because they are often deficient in one or more nutrients; but due to
many factors, like bacterial action, grazing, and death of other organisms recycle
those nutrients and algae tend to survive in nature. But after collection, recycling
may be reduced or altered and nutrient stress can cause death of the target alga
species. Hence, minor enrichment can extend life of some algae species needed for
isolation (Anderson and Kawachi 2005).
52
In the present study, pond water containing microalgae samples were collected from
various aquatic sample collection sites; they were enriched and a fraction of pond
water was autoclaved separately for microalgae multiplication. Enrichment was
carried out by adding major nutrients to the naturally collected samples. Natural
pond water samples were enriched with major nutrients like nitrogen source (NO32-
salt) and carbon source (CO32-
salt) to promote growth. Use of soil extracts and pond
water also promotes microalgae growth. Photosynthesis plays the key role in algal
growth and multiplication, so samples were kept under constant illumination of
fluorescent light (2000-2500 lux) at 25oC under laboratory conditions.
3.1.4 Serial dilution and agar plating technique
The serial dilution and agar plating technique are the most widely used procedures,
when attempting to culture random algal species from field samples. Both these
techniques were carried out as per procedure out lined by Anderson and Kawachi
(2005). The enriched pond water with major nutrients were used in serial dilution
process. All the test tubes were placed under fluorescent lights having illumination
of 2000-2500 lux and 25oC of temperature. Samples were regularly observed under
microscope to avoid contamination. A slight change in color indicates algal growth
which can be observed within 12- 24 hours. Agar plating is followed after serial
dilution procedure.
Isolation and purity of microalgal growth was checked by streaking on agar plates
(Anderson and Kawachi 2005). They were prepared by mixing major nutrients
enriched natural pond water with agar (1%). An inoculation loop or micropipette can
be used for streaking the agar plates under laminar hood. Prior to streaking, the loop
was loaded with algal samples and normal streaking was carried out similar to
bacterial streaking. All the plates were kept under fluorescent lights for observation.
53
After 12-24 hours, green colonies appear which can be seen with necked eyes. Each
colony was observed under microscope and marked according to the presence of
microalgal strains. Lastly with the help of a sterile needle or micropipette, colonies
were transferred to suitable algae media for further growth (Kaur 2011; Anderson
and Kawachi 2005).
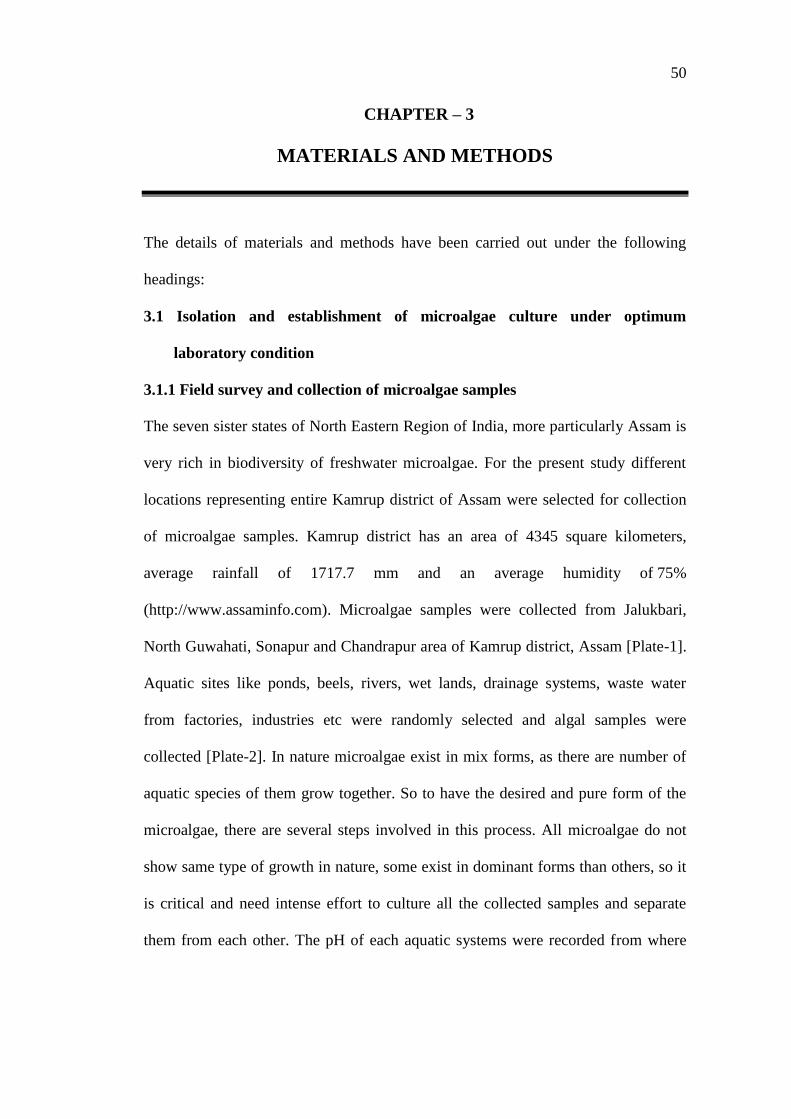
The steps involved in isolation of microalgae pure culture are as follows-
Collection of microalgae samples from its natural habitat (beels, ponds, wetlands,
waste water, paddy fields)
Microscopic examination of samples
Filter the water samples to remove unwanted biological matters, debris, macroalgae
or filamentous algae
Filtrate used as primary inoculums /Filtrate used as pond water enriched media
Serial dilution and agar plating done to isolate and purify the mixed microalgae
cultures
Microscopic examination carried out along with the color change in culture, if
occurs
Colonies were picked with sterile needle and transferred to fresh media
Culture flasks kept under constant illumination in optimum laboratory environments
for further study
54
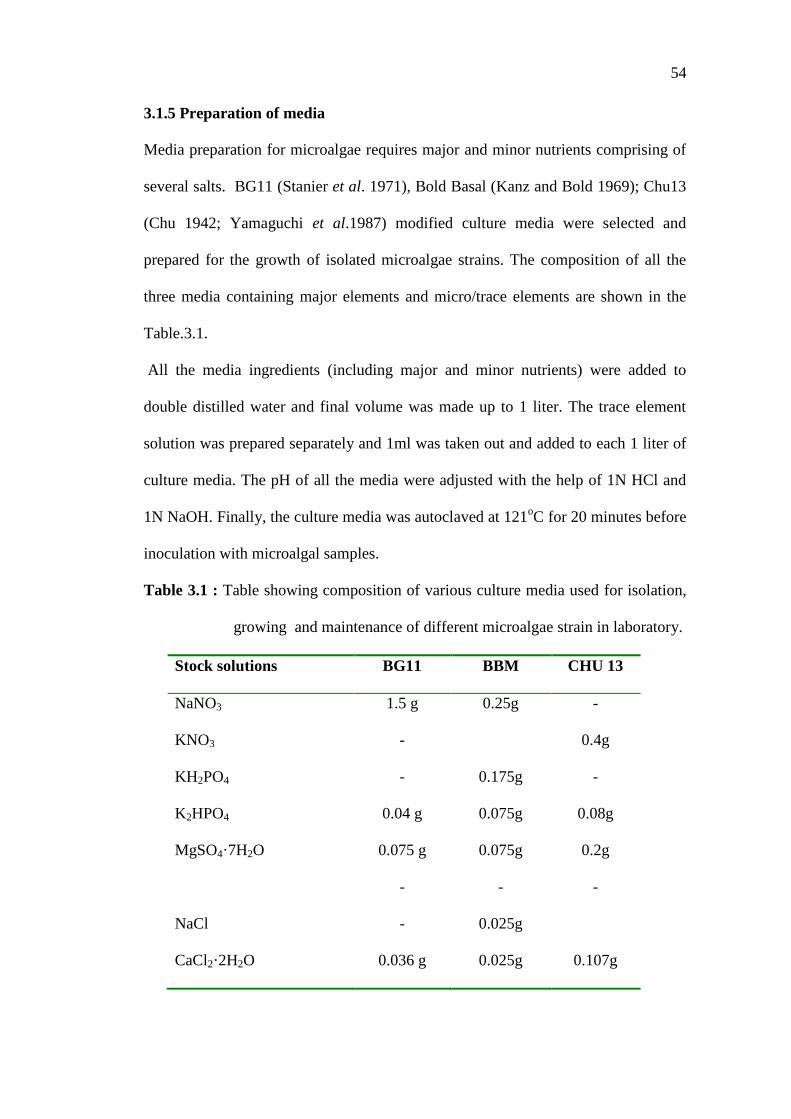
3.1.5 Preparation of media
Media preparation for microalgae requires major and minor nutrients comprising of
several salts. BG11 (Stanier et al. 1971), Bold Basal (Kanz and Bold 1969); Chu13
(Chu 1942; Yamaguchi et al.1987) modified culture media were selected and
prepared for the growth of isolated microalgae strains. The composition of all the
three media containing major elements and micro/trace elements are shown in the
Table.3.1.
All the media ingredients (including major and minor nutrients) were added to
double distilled water and final volume was made up to 1 liter. The trace element
solution was prepared separately and 1ml was taken out and added to each 1 liter of
culture media. The pH of all the media were adjusted with the help of 1N HCl and
1N NaOH. Finally, the culture media was autoclaved at 121oC for 20 minutes before
inoculation with microalgal samples.
Table 3.1 : Table showing composition of various culture media used for isolation,
growing and maintenance of different microalgae strain in laboratory.
Stock solutions BG11 BBM CHU 13
NaNO3 1.5 g 0.25g -
KNO3 - 0.4g
KH2PO4 - 0.175g -
K2HPO4 0.04 g 0.075g 0.08g
MgSO4·7H2O 0.075 g 0.075g 0.2g
- - -
NaCl - 0.025g
CaCl2·2H2O 0.036 g 0.025g 0.107g
55
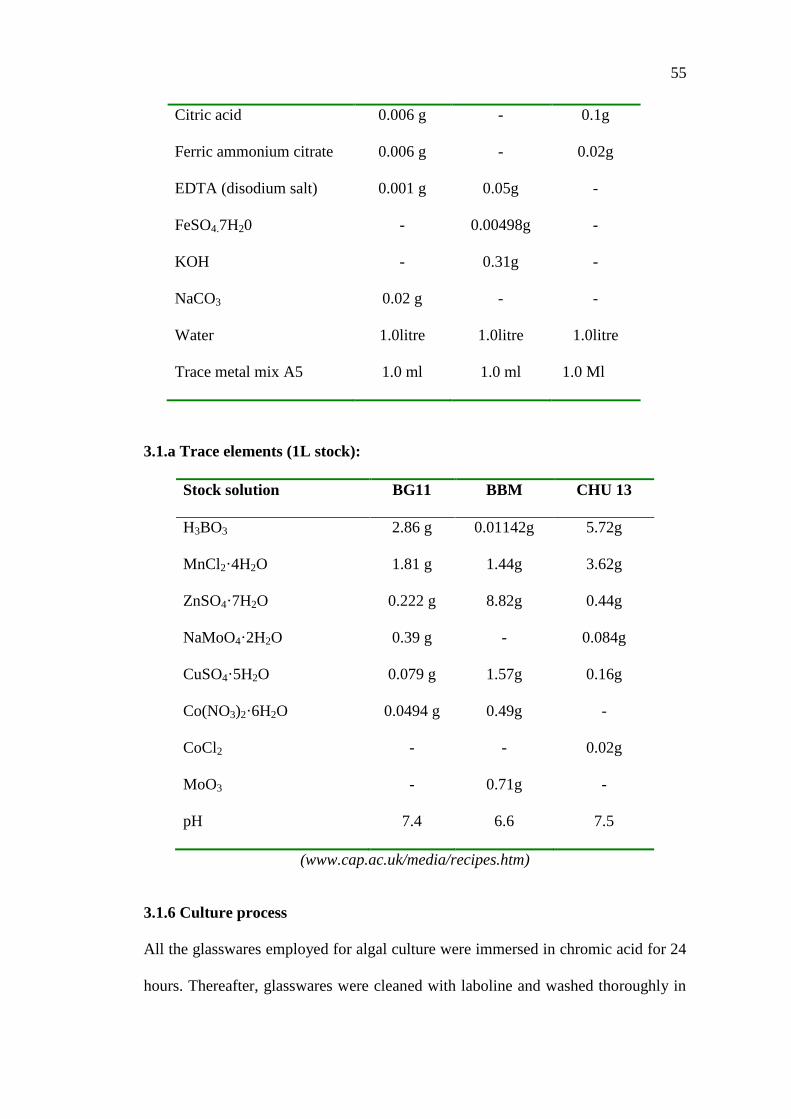
Citric acid 0.006 g - 0.1g
Ferric ammonium citrate 0.006 g - 0.02g
EDTA (disodium salt) 0.001 g 0.05g -
FeSO4.7H20 - 0.00498g -
KOH - 0.31g -
NaCO3 0.02 g - -
Water 1.0litre 1.0litre 1.0litre
Trace metal mix A5 1.0 ml 1.0 ml 1.0 Ml
3.1.a Trace elements (1L stock):
Stock solution BG11 BBM CHU 13
H3BO3 2.86 g 0.01142g 5.72g
MnCl2·4H2O 1.81 g 1.44g 3.62g
ZnSO4·7H2O 0.222 g 8.82g 0.44g
NaMoO4·2H2O 0.39 g - 0.084g
CuSO4·5H2O 0.079 g 1.57g 0.16g
Co(NO3)2·6H2O 0.0494 g 0.49g -
CoCl2
MoO3
-
-
-
0.71g
0.02g
-
pH 7.4 6.6 7.5
(www.cap.ac.uk/media/recipes.htm)
3.1.6 Culture process
All the glasswares employed for algal culture were immersed in chromic acid for 24
hours. Thereafter, glasswares were cleaned with laboline and washed thoroughly in
56
running tap water followed by rinsing in double distilled water. The cleaned glass
wares were then sterilized and dried in hot air oven at 110oC for 6 hours. Culture
tubes and flasks were plugged with non-absorbent cotton. All the isolates of the
microalgae were cultured in different types of media and their growth behaviours
were observed under suitable media.
3.1.7 Light condition
Light intensity is a very important factor for microalgae growth as light energy
drives photosynthesis process, which converts light energy to chemical energy.
Generally light requirement for microalgal growth is relatively lower than that of
higher plants. For the experiment, fluorescent lamps were used as a source of light
and intensity was adjusted to 2000~2500 lux for all the culture flasks and 16 hrs of
light and 8 hrs of dark cycles were repeated for growth of all the cultures (Paasche
1968). The temperature was adjusted to 25oC for all the culture flasks.
3.1.8 Characterization of isolated microalgae and identification
Out of 10 nos. of microalgae strains observed under microscope, among the natural
water samples collected from various sites of Kamrup district, four (Class:
Chlorophyceae) were selected and isolated for the study (Plate: 4 and 5). The
selected strains were-
Chlorella homosphaera,
Selenastrum gracile,
Scenedesmus dimorphus,
Scenedesmus quadricauda,
Identification of micoalgal forms were done with the help of keys provided by Vuuren
et al. 2006; Padovan 1992; Barsanti and Gualtieri 2006; Richmond 2004). In
addition to microscopic examination, SEM analysis, molecular analysis, growth pattern
57
of the algal isolates and up to date journals, published literatures and books provided
many information to identify the collected algal strains.
Microphotographs of the species were carried out from the prepared slides with
appropriate measurements following the accepted methods such as length, breadth,
diameter of cells, cellular arrangement, cell division pattern and cell wall
conformation etc.
Microphotographs and species descriptions available in the web databases also
helped to identify some forms of the isolates. (Such web databases includes, “Soken-
Taxa" project "Fundamental research and development for databasing and
networking culture collection information" at Japan Science and Technology
Corporation; Algae Base, National University of Ireland (Guiry and Guiry 2013))
and at Department of Biotechnology, Gauhati University, Guwahati, Assam.
3.1.9 Scanning electron microscopic (SEM) analysis
Scanning Electron Microscopic analysis provides valuable information about the
systemic studies of algae and their taxonomic positions. Taxonomic study of
microalgae is mainly based on their cell form, cell arrangement and cellular
ornamentations. All the morphological characteristics of microalgae are sometimes
difficult to differentiate using a simple optical microscope, because of their smaller
size. Therefore, electron microscopy is an essential procedure to distinguish and
study cellular features of microorganisms such as microalgae in higher
magnification ranges. All the four strains were studied at their cellular and
morphological level through SEM analysis. Photographs were taken at various
magnification ranges (5000-12000X) to distinguish them up to their species level.
SEM photographs revealed their morphology and cellular changes also during their
growth cycle. The algal isolates were processed and the photographs were taken at
58
Sophisticated Analytical Instrumentation Facility (SAIF), North East Hills
University, Shillong, Meghalaya.
3.1.10 Molecular characterization of microalgae isolates based on ITS4
amplification
3.1.10.1 Genomic DNA extraction
The extraction of genomic DNA from microalgae cell require cell lysis. The
genomic DNA isolation from microalgae samples were carried out using the
procedure reported by Fawley and Fawley (2004) with slight modifications. The
DNA extraction buffer was prepared by mixing 75mM Tris HCl (pH 8.0), 1M NaCl,
30mM EDTA and 0.3% CTAB. Fresh microalgae cultures at their exponential phase
of growth were collected (20ml) and centrifuged at 7000 rpm at 4oC for 20 minutes.
Supernatants were discarded and 3 ml of extraction buffer was added to the pellets
followed by mild vortexing. The suspensions were again centrifuged at 8000 rpm for
5 minutes (Eppendorf rotor F-45-30-11) and again supernatants were discarded.
200µl of extraction buffer along with 75µl of CTAB were then added to each tube
and vortexed using glass beads. 200µl of chloroform was added to the tubes,
followed by vortexing and centrifugation at 2000 rpm for 2 minutes. The aqueous
phases were transferred to fresh tubes and chloroform: isoamyl alcohol mixture
(24:1) were added and mixed by inverting the tubes. The aqueous phases were again
transferred to fresh tubes and sodium acetate (3M) was added till 1/10th
the volume
and mixed by inverting the tubes. The mixtures were then centrifuged at 6000 rpm
to collect the pellets, which were redissolved in 200µl low salt TE buffer (pH 8.0).
1µl of RNAse A (Himedia DS0003, 20mg/ml) was added to each tube and incubated
at 37oC for 1 hour. 200µl of chloroform: isoamyl alcohol mixture (24:1) was then
added followed by centrifuging at 6000 rpm for 10 minutes. The aqueous phases
59
were transferred to fresh tubes and equal volume of ice cold ethanol was added to
each tube followed by mixing by inverting the tubes. The tubes were again
centrifuged and pellets were washed with 70% ethanol. Finally they were allowed to
dry and 50µl of TE buffer added to each tube for future use and storage.
Spectrophotometric quatification and electrophoresis of extracted DNA samples
were carried out for further analysis.
3.1.10.2 Primer
The PCR primer used for molecular characterization of all the four microalgae
isolates is ITS4 region (5´TCCTCCGCTTATTGATATGC 3´) of 18s rRNA gene
sequence.
The sequencing of amplified products were outsourced and sequence analysis was
carried out locally using linux workstation.
3.1.10.3 Sequence analysis and Phylogenetic study
After PCR amplification of ITS4 region, the PCR products were sequenced and they
were obtained in chromate file format as well as in dotseq format. Sequences were
then trimmed, where ever necessary using “Bioedit” program. Multiple alignments
of the processed sequences were carried out using “ClustalX” program. The outputs
from ClustalX analysis were obtained in dotPHY format, which was again used as
input for “Phylip” program for phylogenetic analysis using maximum likelihood
method. ClustalX output in dotPHY format was analyzed by using “Seqboot”
module of Phylip package followed by “Dnaml” for maximum likelihood and
distance calculation. This was further analyzed by “Consense” to generate the map
and lastly the output was visualized by “Treeview” program.

60
The sequence results were also blast for homology search and results were compared
and checked by matching with the elctropherogram using BioEdit software. All the
sequences were submitted to NCBI using Bankit program and accession numbers
were obtained for each sequences.
3.1.11 CHNS analysis: elemental composition of the microalgae samples
Carbon, nitrogen, hydrogen and sulfur analysis was carried out on all the four
microalgae isolates to determine their chemical composition and to distinguish the
strains from each other. The analysis was performed with CHNS EuroVector, EA
3000 Elemental Analyzer. Cells from exponential phase of growth were harvested
and lyophilized. Dried biomass was collected and about 1 gm of the each powdered
samples were processed for the CHNS analysis.
3.1.12 ANALYTICAL METHODS
3.1.12.1 Cell count by haemocytometer
Direct microscopic cell count by Neubour haemocytometer was performed using
optical microscope. About 100µl of microalgae samples were taken out from culture
flasks with the help of a micropipette and cell counts were carried out on
haemocytometer slide using a light microscope (Labomed). Readings were taken at
the interval of 24 hrs, in multiple replicates and their average values were recorded
in increase of cells per milliliter per day.
3.1.12.2 Determining optical density (O.D.)
Optical densities of microalgae cultures were measured at a regular interval of time
(24Hrs) by taking absorbance at 680nm (A680) with the help of a spectrophotometer
(Systronics) in three replicates and average values were recorded. All experiments
were performed under semi continuous mode of cultures. About 10 ml of microalgae
61
culture were taken out from each culture flask, every after 24 hrs for O.D. readings
and again 10ml of fresh media were replaced to make the volume of culture
constant. The spectrophotometer was calibrated every time with blank containing
each medium respectively.
3.1.12.3 Determination of biomass
Biomass increase in milligram per day per milliliter for each of the strains was
recorded daily. Biomass of algae samples were collected by centrifuging the cultures
at 5000 rpm after a period of 24 hrs. For that 10ml of culture were taken out and
centrifuged; the pellets were collected, dried and weight was recorded using a digital
weigh balance.
At the end of the experiments all the culture flasks were harvested, centrifuged and
pellets were lyophilized. The dry weights of biomass were measured, recorded and
stored in freeze at 4oC for further analysis and use.
3.1.12.4 Determination of specific growth rate (µ)
Specific growth rate is calculated by measuring the number of generations or
doublings that occur per unit of time in an exponential phase of growth. The
exponential (straight line) phase of growth was anlyzed and specific growth rate was
calculated using following equation. (Guillard and Ryther 1962)
µ= ln (Nt/No)/Tt-To
Nt= Number of cells at the end of exponantial phase.
No= Number of cells at the start of exponantial phase
Tt= Last day of exponantial phase
To= Initial day of exponantial phase
62
The T is expressed in terms of days and from the specific growth rate (µ), further it
can be converted to obtain doublings or division per day (k) by dividing the specific
growth rate (µ) by the natural log of 2.(0.6931).
K=µ/0.6931
The time needed to attain doubling of the total number of cells which is refered as
doubling time (Tt) and it is calculated by the following formula.
Tt= 0.6931/µ
3.2 Media standardization and optimization for higher biomass production
3.2.1 Media standardization
The four microalgal isolates were grown under different media composition. The
media considered for the growth were BG11 (Stanier et al. 1971), Bold Basal (Kanz
and Bold 1969), Chu13 (Yamaguchi et al.1987; Chu 1942) media. A semi
continuous mode of culture was carried out for all the microalgae strains to evaluate
their growth characteristics in aforementioned three culture media (BG11, Chu13
and BBM media). Culture flasks having equal volume (100 ml each) of different
culture media were prepared and inoculated with constant volume (5 ml) of
inoculums. The inoculum cell density was recorded for each of the isolates using
haemocytometer. Growth study was conducted for 9-11 days of growth period
where O.D. (optical densities) were recorded at 680nm (A680) daily. For each
parameter, average values were considered from the data generated from three
replicates. Specific volume (3 ml each) of algal cells were removed for the study and
replacing it with same volume of fresh media. The specific growth rate, doubling
time, doubling per day were also calculated and recorded for each of the microalgal

63
strains growing in different culture media and finally a graph was plotted by putting
the daily O.D. (680 nm) readings.
3.2.2 Optimization of culture media
Media optimization is an important step in microalgal growth kinetic studies and it
is related to attaining maximum growth rate and biomass production of microalgae
in a short period of time. Microalgal growth depends on factors like light,
temperature, nutrient conditions and pH of media. Major elements which constitute
algal cells are carbon, nitrogen, sulfur and phosphorus (Wang et al. 2008). Only
carbon nutrient source, which may be in inorganic salt form (HCO3-) or in gaseous
form (CO2) do not support microalgal growth. Media must be optimized with a
suitable carbon dioxide concentration to promote maximum microalgal growth and
CO2 fixation rate. Many published literatures indicate that manipulations in the
media level may lead to the achievement of optimum growth and lipid production of
microalgae as the quality and quantity of lipid within the cells can vary with the
change in growing conditions (Mutlu et al. 2011). All these elements present in the
media promote the formation of microalgae biomass, which ultimately produce algal
oil. Therefore, microalgae cultivation holds a great promise in mitigation of green
house gases by generating biomass, which again can be converted to biofuel to
replace fossil fuels. (Illman et al. 2000; Liu et al. 2008; Mutlu et al. 2011; Sostaric
et al. 2009; Kirrolia et al. 2011; Wang et al. 2008).
3.2.2.1 Effect of initial pH on growth of microalgae
The initial pH of the culture media has a very important role in microalgae
cultivation. Every organism has its own pH optima for growth. For pH optimization,
culture flasks were taken in three replicates each having 100 ml normal BG11
media. A difference pH of 6, 7, 8, 9, 10 were adjusted to each of the flasks with

64
0.1N HCl and 0.1 N NaOH with the help of pH meter (L1 120 Elico), just before
inoculating with the microalgal isolates. After inoculation, the Optical Density
(O.D) of each culture flasks were measured at 680nm of wavelength at regular
interval of time (24Hrs) and average values of the three replicates were recorded.
The strains were checked for a growth period of 9 days and at the end of the
experiment, a growth curve was plotted.
3.2.2.2 Growth of microalgae isolates under different concentration of urea.
Among all the factors, nitrogen is known to have the strong influence on microalgae
metabolism and it is one of the major nutrients needed for microalgae growth. In
addition, nitrogen is easy to manipulate and is less expensive when compared to
other nutrients. Therefore, it plays a key role in growth, CO2 mitigation and
enhancing the lipid productivity for bio-fuel production (Takagi et al. 2000). Culture
flasks for all the four strains were prepared in BG11 media by replacing NaNO3 with
urea as nitrogen source. Urea can be used as a very efficient nitrogen source for
microalgae cultivation; as it is very cheap compared to other nitrogenous nutrients
available which ultimately make it economically advantageous for commercial
production of microalgae. (Zhila et al. 2005). Culture flasks each having different
concentrations of urea was prepared separately in three replicates for each of the
strains in semi continuous mode culture. For this purpose, urea at the range of 0.02
g/L, 0.04 g/L, 0.08 g/L, 0.1 g/L, 0.2 g/L were freshly weighed and added to each of
the flasks. Before inoculation, the pH of each flask was adjusted to 7.5 with 0.1N
HCl and 0.1 N NaOH. About 100 ml of media was distributed to each of the flasks
and all were inoculated with 5 ml of inoculums. (cell densities of inoculums for
performing all the experiments Scenedesmus dimorphus=2.25X10⁷, Scenedesmus
quadricauda= 3.5X10⁷,
Selenastrum gracile= 3.72X10⁷ and Chlorella
65
homospheara= 4.1X10⁷ no of cells). The Optical Density (O.D) of each of the
flasks was measured at 680nm of wavelength at regular interval of time (24Hrs) and
average value of three replicate was recorded. The strains were checked after 9 days
of growth period. At the end of the log phase of growth, the cells were harvested and
total lipid content was calculated.
3.2.2.3 Media optimization with carbon nutrient source
Many published literatures reported that carbon source effect growth and fatty acid
compositions of numerous microalgal species (Wood et al. 1999; Wen Chen 2003).
The two ways of providing carbon nutrient sources for microalgae cultivation
system are in salt (carbonate salts like Na2CO3/NaHCO3) and gaseous form (CO2
gas and flue gas), (Wang et al. 2008; Sostaric et al. 2009; Ho et al. 2011). Algae can
able to well utilize the bicarbonate salt because, its cell machinery has the enzyme
called carbonic anhydrase, which is responsible for converting bicarbonate salt into
carbon dioxide, as microalgae can only fix CO2 through their metabolic pathways,
which is carried out by another enzyme called RUBISCO ( ribulose 1,5- bis
phosphate). It is the only enzyme which is solely responsible for fixing CO2 to form
sugar molecules in plant cells through photosynthesis (Ho et al. 2011; Moroney and
Somanchi 1999).
3.2.2.3.1 Growth under different concentrations of bicarbonate salt
An alternative inorganic carbon source, which can be used for cultivation of
microalgae is sodium bicarbonate and sodium carbonate salts. There exists a high
extracellular carbonic anhydrase enzyme (CA) activity in many microalgae species
(EmmaHuertas et al. 2000), which can convert carbonate to free CO2 to initiate CO2
assimilation. In addition, direct uptake of bicarbonate salts by an active transport
system has also been reported in case of some species (Wang et al. 2008; Colman
66
and Rotatore 1995). It was observed previously that NaHCO3 is a better carbon
source than sodium carbonate (Na2CO3) in microalgae cultivation as sodium
bicarbonate (NaHCO3) yielded better growth response in case of various microalgae
strains like Chlorella vulgaris, Scenedesmus sp., Haematococcus sp., Chaetoceros
gracilis etc and found to produce more biomass than in case of using sodium
carbonate (Na2CO3) (Muralinarasimhan 2010; Wang et al. 2008, Yeh et al. 2010;
Devgoswami et al. 2011). Therefore, sodium bicarbonate salt was explored as a
source of carbon nutrient in present investigation. Carbonate salts have solubility of
19.4 g/100 g of H2O at 25oC (Kobe and sheety 1948, Kim and Lee 2009). Addition
of bicarbonate avoids power consumption for bubbling CO2 gas in the aqueous
medium and intends to minimize the carbon loss to the atmosphere by saturating the
bicarbonate concentration in an appropriate pH range for algae culture as well as can
be used for photosynthesis process by algae (Arizawa and Miyachi 1986). Culture
flasks were prepared with BG11 media in three replicates, each having different
concentration of bicarbonate salts, for each of the four strains. NaHCO3 salt at
concentration ranges of 15, 30, 45, 60 and 75 mg/L (1mg/L=1ppm) were freshly
weighed and added to each of the flasks. Prior to the experiment, the pH of all the
culture flasks were maintained at 7.4, because bicarbonate addition lowers the pH as
it leads to the formation of carbonic acid, with water, which is lethal to algae (Kim
and Lee. 2009). About 100 ml of media were distributed to each of the flasks and all
are inoculated with 5 ml of inoculums. (cell densities of inoculums for performing
all the experiments; Scenedesmus dimorphus=2.25X10⁷, Scenedesmus
quadricauda= 3.5X10⁷,
Selenastrum gracile= 3.72X10⁷ and Chlorella
homospheara= 4.1X10⁷no of cells). A 9 days culture period was observed and O.D.
at 680 nm with an average value of three replicate was recorded every after 24hours.
67
At the end of the log phase of growth, the cells were harvested and biomass
production and total lipid content were calculated.
3.2.2.3.2 Growth under different concentrations of CO2 gas
Carbon dioxide is one of the critical factors for photosynthesis in microalgae along
with light, water and nutrients. Culture medium was prepared using BG11 media
excluding the carbon nutrient source. Attempts were made to blow CO2 in the
media, but there is a major loss of CO2 in the air due to its poor solubility. CO2 has a
solubility of 1.45g/L at 25oC under 100 KPa (Weibe and Gaddy 1940, Kim and Lee
2009). This indicates the advantages of bicarbonate salts in media, which minimize
the loss of carbon in the atmosphere (Kim and Lee 2009). To overcome the problem
of CO2 loss, carbon dioxide gas is supplied periodically by maintaining a steady pH
of the cultures. Regular observation of pH is very important because the equilibrium
concentrations of the various carbonate ions in aqueous solution are controlled by
the pH of the solution. The amount of CO2 dissolved in water varies greatly with pH
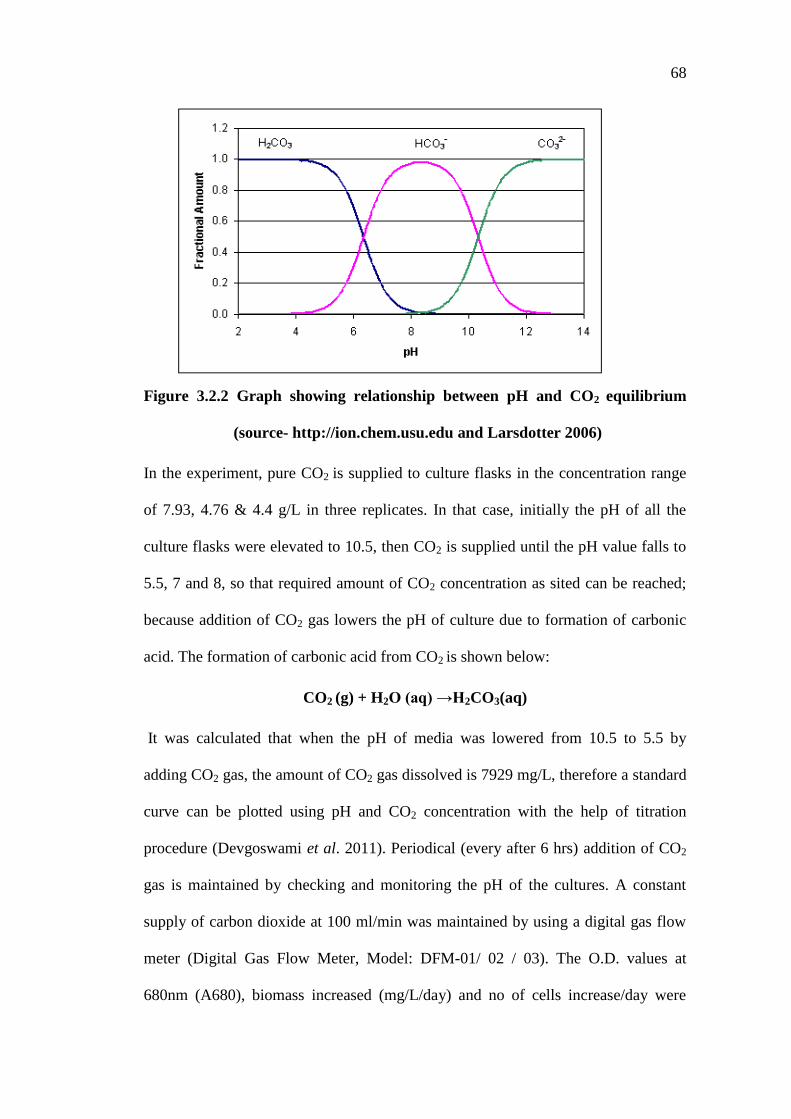
and addition of CO2 results in a pH decrease (Figure 1). At higher pH values, e.g. at
pH greater than 9, most of the inorganic carbon is in form of carbonate (CO3 2–
)
which cannot be assimilated by the algae (Borowitzka 1998). More specifically, at a
pH below about 4.5, the carbonate ion will entirely in the form of carbonic acid
(H2CO3). As the pH is increased to a value of about 8.5, the carbonate ions will
consist entirely of bicarbonate (HCO3 -
) and as the pH is raised above 8.5, the
predominant carbonate species will be carbonate (CO32-
) (Huber et al. 1999; Kim
and Lee. 2009; Devgoswami et al. 2011). (Different concentration of CO2 gas
dissolved in aqueous medium is indicated by different pH values).
68
Figure 3.2.2 Graph showing relationship between pH and CO2 equilibrium
(source- http://ion.chem.usu.edu and Larsdotter 2006)
In the experiment, pure CO2 is supplied to culture flasks in the concentration range
of 7.93, 4.76 & 4.4 g/L in three replicates. In that case, initially the pH of all the
culture flasks were elevated to 10.5, then CO2 is supplied until the pH value falls to
5.5, 7 and 8, so that required amount of CO2 concentration as sited can be reached;
because addition of CO2 gas lowers the pH of culture due to formation of carbonic
acid. The formation of carbonic acid from CO2 is shown below:
CO2 (g) + H2O (aq) →H2CO3(aq)
It was calculated that when the pH of media was lowered from 10.5 to 5.5 by
adding CO2 gas, the amount of CO2 gas dissolved is 7929 mg/L, therefore a standard
curve can be plotted using pH and CO2 concentration with the help of titration
procedure (Devgoswami et al. 2011). Periodical (every after 6 hrs) addition of CO2
gas is maintained by checking and monitoring the pH of the cultures. A constant
supply of carbon dioxide at 100 ml/min was maintained by using a digital gas flow
meter (Digital Gas Flow Meter, Model: DFM-01/ 02 / 03). The O.D. values at
680nm (A680), biomass increased (mg/L/day) and no of cells increase/day were
69
monitored daily for growth kinetics of all the strains. The average values of each of
the replicates for aforementioned parameters were recorded. The strains were
checked for 9 days of growth period.
3.2.2.3.3 Growth of microalgae isolates under supply of CO2 gas with different
flow rate
Amount of CO2 supply in algae culture has a major role on microalgal growth.
Growth study was conducted while growing algae under BG11 media taking CO2 as
carbon source with different flow rates. An optimum flow rate is essential for
microalgae growth as a high flow rate of CO2 is always lethal to algae. The higher
the flow rate the higher CO2 is supplied to microalgae culture and a high CO2
concentration lowers the media pH forming carbonic acid. The study was conducted
to find out the effect of adding pure CO2 to the culture at different flow rates. Firstly
the media pH of all the culture flaks was increased to 10, prior to inoculum addition.
Carbon dioxide was bubbled continuously into the microalgae culture flasks at flow
rates of 10, 20, 50, 100 and 200 ml/min using a digital gas flow meter (Digital Gas
Flow Meter, Model: DFM-01 / 02 / 03), every after 12 hours to maintain a constant
pH of 6.5 as CO2 addition and pH has a direct relations in algal growth. Cultures
were carried out in three replicates in semi continuous mode and were kept under
fluorescent lights under 16 hrs of light and 8 hrs of dark period at 25oC temperature.
A 9 days culture period was observed and biomass increase (mg/L/day) and cell no
increase/day and O.D. readings at 680 nm were taken and average value of each
replicate recorded every after 24hours [Plate 6(B)].
70
3.2.2.3.4 Preparation of culture media utilizing modified Solvay process and
growth of microalgae isolates.
The ability of microalgae to utilize salt form of carbon nutrient more efficiently than
carbon dioxide gas lead to the exploration of the Solvay process. Sostaric et al.
(2009) reported the utilization of Solvay process in microalgae cultivation system.
Different concentration of enriched solutions were prepared by utilizing Solvay
process, where gaseous CO2 is converted into bicarbonate salt in presence of a
catalyst. Further, as mentioned earlier CO2 gas, upon bubbling through media, most
of it tend to lost in the air so it is convenient to convert CO2 gas into bicarbonate
form as microalgae cells have the machinery to convert bicarbonate salt into CO2.
The Solvay process leads to the formation of a bicarbonate salt from gaseous CO2.
Chemical reaction of a Solvay process is represented by the following equation
(Huang et al. 2009; Sostaric et al. 2009)
CO2(g) + NaCl + NH3 + H2O → NaHCO3 + NH4Cl
The ammonium chloride produced in the reaction is also serving as a nutrient for
microalgae cultivation (Sostaric et al. 2009).
For preparing the enriched media, 2 g sodium chloride salt was added to 1 liter of
distilled water, and to it ammonia solution (25%) was added drop wise until the pH
reaches to 10; pure carbon dioxide gas was blown in the alkaline solution using a
gas regulator at a slow flow rate (20ml/min) until the pH value of 6.5 is reached. The
enriched media was prepared by adding the above solution in different proportions
with normal BG11 media, excluding carbon nutrient source (Sostaric et al. 2009).
Culture flasks were prepared each having three replicates with dilutions made in the
ratios of 1:100, 2:100, 4:100, 10:100 and 1:1 with solution from Solvay process and
normal BG11 media keeping the final volume of about 100 ml. All flasks were
71
inoculated with 5 ml of inoculums. (Scenedesmus dimorphus=2.25X10⁷,
Scenedesmus quadricauda= 3.5X10⁷,
Selenastrum gracile= 3.72X10⁷ and Chlorella
homospheara= 4.1X10⁷
no of cell). Cultures were kept under fluorescent light with
16 hrs of light and 8 hrs of dark period at 25oC temperature. A 9 days culture period
was observed and biomass increase (mg/L/day) and cell no increase/day and O.D. at
680 nm were taken and average values of each replicate were recorded every after
24hours. At the end of the log phase of growth, the cells were harvested and biomass
production and total lipid content was calculated.
3.2.2.3.5 Media with only nitrogen and carbon dioxide
Growth study was conducted to check the growth of all the strains under the
influence of two major nutrients. Therefore, culture medium was prepared in three
replicates for each of the four strains with only urea as nitrogen nutrient source and
CO2 as carbon nutrient. About 100 ml of media was prepared by dissolving 0.1
gram of urea as nitrogen nutrient per liter and 4.76 gram/liter CO2. pH of the
cultures was raised to 10.5 prior to addition of CO2. CO2 was supplied periodically
with a flow rate of 100 ml/minute, maintained using a digital gas flow meter. The
pH change is monitored daily. The 9 days growth kinetics for all the microalgal
strains were studied taking O.D. at 680 nm and average value of three replicates was
recorded every after 24hours. A growth curve was plotted at the end of the
experiment.
3.2.2.4 Preparation and formulation of a cheap media with soil and cowdung
extract
The success of the CO2 mitigation technology with microalgae lies on the
formulation of a cheap cultivation media for growth of microalgae as CO2 addition
alone can not support growth of microalgae cells. Owing to the high cost of media
72
ingredients, an alternative of easily available cheap media is an urgent need for algal
technology. Microalgae cultivation, under normal growth medium requires almost
10-14 salts (both major and minor elements), making the culture process a bit
expensive, which is not economically suitable for mass scale culture but use of
waste water, animal manure etc can increase the cost effectiveness of the process
(Agwa et al. 2012; Mulbry and Wilkie 2001). The aim of the present experiment is
to formulate a media which is cost effective, by utilizing garden soil and animal
waste such as cowdung, which contains a considerable amount of nitrogen and
phosphorous which is suitable for algae growth. (Mulbry and Wilkie 2001).
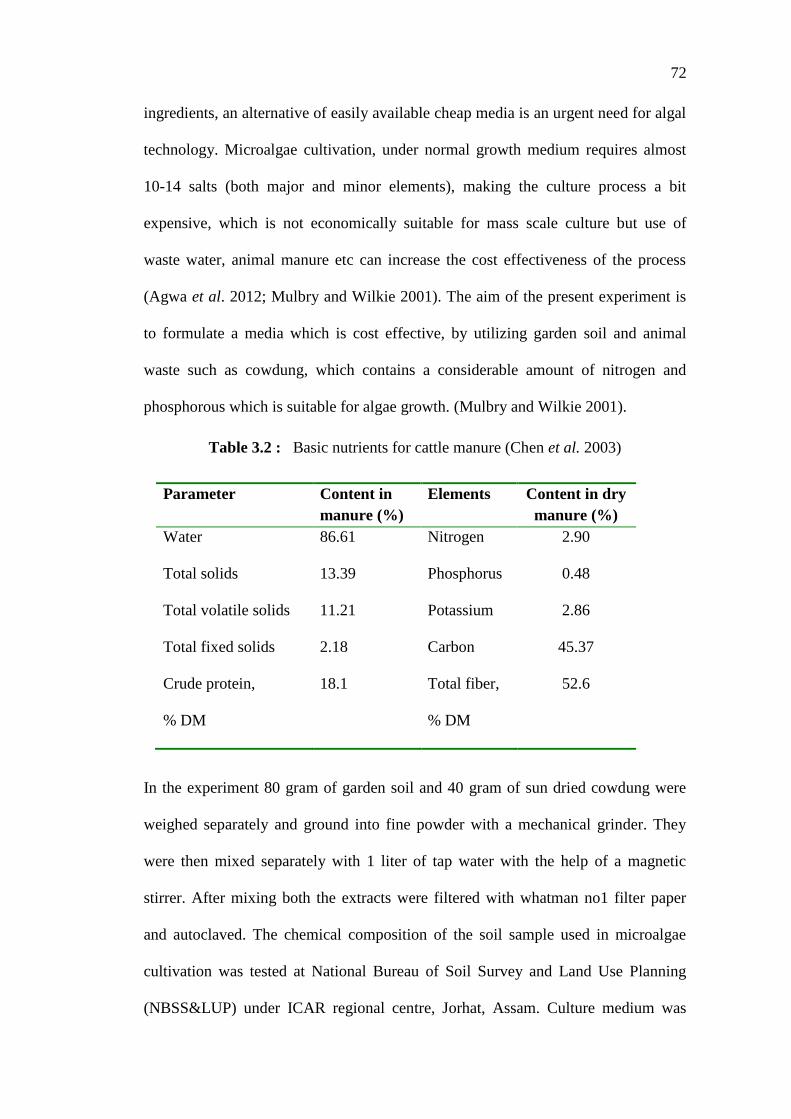
Table 3.2 : Basic nutrients for cattle manure (Chen et al. 2003)
In the experiment 80 gram of garden soil and 40 gram of sun dried cowdung were
weighed separately and ground into fine powder with a mechanical grinder. They
were then mixed separately with 1 liter of tap water with the help of a magnetic
stirrer. After mixing both the extracts were filtered with whatman no1 filter paper
and autoclaved. The chemical composition of the soil sample used in microalgae
cultivation was tested at National Bureau of Soil Survey and Land Use Planning
(NBSS&LUP) under ICAR regional centre, Jorhat, Assam. Culture medium was
Parameter Content in
manure (%)
Elements Content in dry
manure (%)
Water 86.61 Nitrogen 2.90
Total solids 13.39 Phosphorus 0.48
Total volatile solids 11.21 Potassium 2.86
Total fixed solids 2.18 Carbon 45.37
Crude protein,
% DM
18.1 Total fiber,
% DM
52.6
73
prepared by mixing soil extract, cowdung extract with tap water in the ratio of
10:5:85, 20:8:72, 30:10:60, 40:15:45 and 50:18:32 respectively to make up the final
volume up to 100 ml. All flasks were prepared in three replicates. Before
inoculation, the pH of all the culture flasks were raised to 10.5 with the help of 0.1 N
NaOH and an external supply of CO2 gas was made up to 4.76 g/liter until the pH of
all the culture media were fell to 6 with a constant flow rate of 100 ml/minute was
also maintained using a gas flow meter. It was observed that the media pH raises
along with the CO2 consumption and growth of microalgal cells hence CO2 gas was
blown into media periodically to maintain a constant pH of 6. Fluorescent lamps
were used as a source of light and intensity was adjusted to 2500~3500 lux for all
the culture flasks and 16 hrs of light and 8 hrs of dark cycles were repeated for
growth of all the cultures at 25oC temperature. 9 days growth kinetics of all the
microalgal strains were studied taking O.D. at 680 nm and average value of each
replicate was recorded every after 24hours. A growth curve was plotted at the end of
the experiment.
3.2.2.5 Preparation of culture media having different concentrations of
salinity
Salinity plays an important role in growth and biochemical composition in many
algae species (Moisander et al. 2002; Lartigue et al. 2003; Rao et al. 2007). Many
published literatures suggest that salinity induces lipid production in microalgae;
hence growing microalgae in optimum level of salinity stress is beneficial in both
biomitigation and biofuel point of view (Rao et al. 2007; Kalita et al. 2011; Kirrolia
et al. 2011). Culture flasks each having different concentration of sodium chloride
were prepared separately for each of the strains. About 100 ml of autoclaved BG11
media was added separately in conical flasks having three replicates and sodium
74
chloride at the concentration range of 0.02, 0.04, 0.06, 0.08 and 0.17 M was added
individually. pH of all the flasks were set to 7.5 with 0.1N HCl and 0.1 N NaOH
with the help of L1 120 pH meter. A 9 days culture period was observed and O.D.
at 680 nm and average value of each replicate was recorded every after 24hours and
also cell no increase, biomass increase/day and total lipid content in percent (%) dry
cell weight were measured at the end of the experiment.
3.3 Screening of carbon dioxide mitigation potential of microalgal isolates
In the beginning of the study, the microalgal samples were collected from different
sites of Kamrup district, Assam. These were pure cultured and screened to assess
their potential for CO2 mitigation capabilities and production of biomass by
investigating their physiology, lipid production and biochemistry. Further,
optimization of laboratory culture conditions and growth under various nutrient
environments were helpful to enhance the growth and CO2 fixing capabilities. The
microalgae strains observed and collected from various sites represent the diversity
of algae in the environments and water types of Assam. The collection was
narrowed down to four most promising strains. In the present study, parameters like
growth rate and biomass production, carbon dioxide utilization rate, lipid
productivity and biofuel generation was considered to screen out the efficient
microalgal strains. Most of the strains were green algae under theclass:
Chlorophyceae and cultured in Environmental Biotechnology laboratory,
Department of Biotechnology, Gauahati Universty, Assam, India.
3.3.1. Growth rate and biomass production
The growth kinetics of the four microalgal isolates were explored under various
growing conditions. Their biomass productivity under media supplemented with two
75
forms of carbon nutrient source i.e. in salt form (bicarbonate salt), gaseous form
(CO2) and under the modified Solvay process, were used to convert CO2 gas into
bicarbonate salt were assessed. The efficient algal strains were screened based on
their performance in terms of growth rate and biomass production. The success of
CO2 mitigation strategy demands a fast growing as well as high biomass yielding
species.
3.3.2. Carbon dioxide utilization rate
Screening of the microalgae strains were carried out on the basis of their CO2
fixation performance under different cultivation conditions. The biomass
productivity of a microalgal strain depicts the CO2 fixation rate of that strain during
that growth environment, because a major portion of microalgal biomass comprises
of carbon (Chisti 2007), which was found, based on CHNS analysis. The CO2
fixation rate of each of the microalgae isolates were calculated at their optimum
growth conditions.
Carbon dioxide consumption rate was calculated from the biomass productivity
according to the equation:
CO2 fixation rate (PCO2) = 1.88 × biomass productivity (Poverall) (mg L−1
d−1
),
which is derived from the typical molecular formula of microalgal biomass,
CO0.48H1.83N0.11P0.01 (Chisti 2007; Ho et al. 2010)
3.3.3. Lipid productivity
The biomitigation of carbon dioxide through microalgal photosynthesis holds
enormous potential in near future, if the biomass produced because of carbon
dioxide fixation has an application in renewable fuel generation. It will also help to
increase the economy of the process (Wang et al. 2008). It was established from

76
published literatures that, CO2 concentration in media directly affects the internal
lipid content of a microalgae cell (Tsuzuki et al. 1990). The CO2 exposure during
growth of the microalgae may alter the fatty acid compositions too (Yusof et al.
2011). The total lipid content of the all strains after growing under different media
environments supplemented with various carbon sources including bicarbonates,
CO2 gas and salinity were estimated. Cells were harvested after attaining maximum
growth at the end of the experiments and their lipids were extracted by Bligh and
Dyer method.
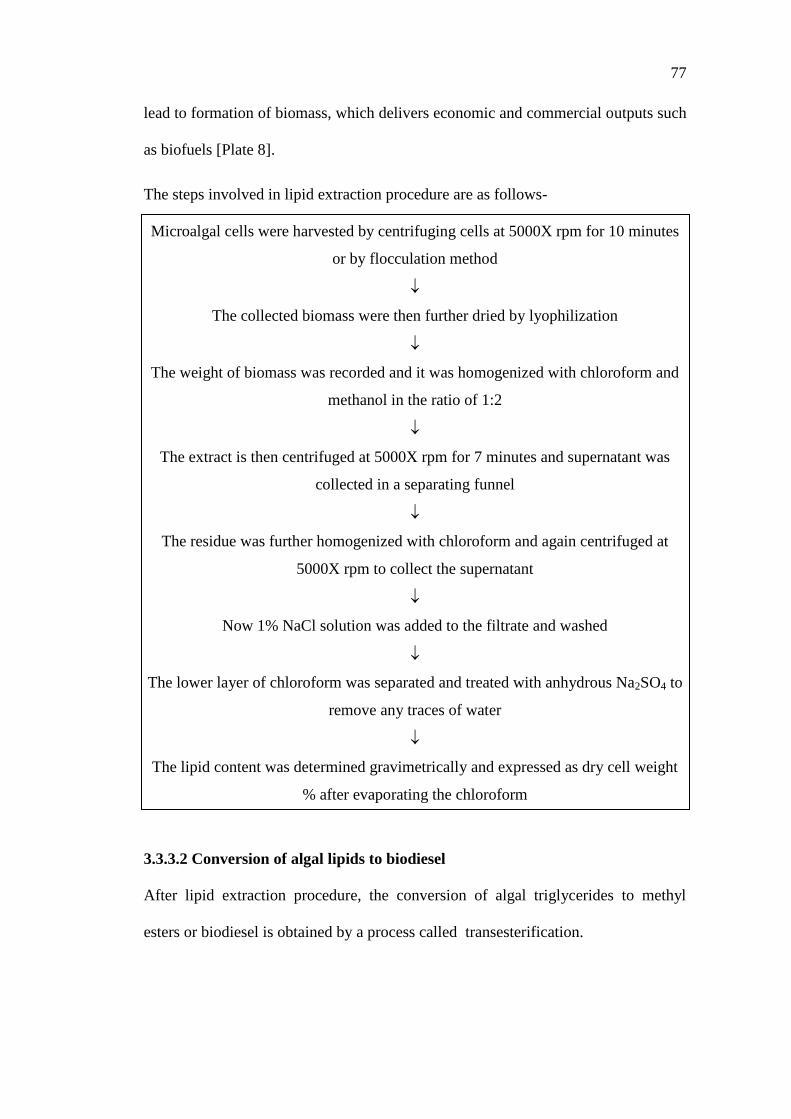
3.3.3.1 Lipid extraction procedure
Microalgal lipid extraction was done by Bligh and Dyer (1959) method with slight
modifications. The microalgal biomass was collected by centrifuging the cells from
exponential phase of growth, at 5000Xg for 10 minutes. The cells were washed with
distilled water and further dried using lyophilizer (Spacvac) and weighed
accordingly. The weight of the biomass was then recorded and homogenized with
chloroform: methanol in the ratio 1:2 at 35oC. Extract was further centrifuged for 10
minutes at 5000Xg and a separating funnel was used to collect the supernatant. The
remains were further homogenized with chloroform and again centrifuged (5000Xg)
to collect the supernatant. 1% NaCl solution was used to wash the filtrate and lower
layer of chloroform was separated and finally, treated with anhydrous Na2SO4 to
remove the traces of water (Kumar et al. 2011).
The lipid content for all the microalgae strains were determined gravimetrically and
expressed as percent dry weight after evaporating the chloroform. The quality and
quantity of extracted lipid depicts the potentiality of a microalgae strain in
biomitigation and biofuel generation, as biomitigation of CO2 through microalgae
77
lead to formation of biomass, which delivers economic and commercial outputs such
as biofuels [Plate 8].
The steps involved in lipid extraction procedure are as follows-
Microalgal cells were harvested by centrifuging cells at 5000X rpm for 10 minutes
or by flocculation method
The collected biomass were then further dried by lyophilization
The weight of biomass was recorded and it was homogenized with chloroform and
methanol in the ratio of 1:2
The extract is then centrifuged at 5000X rpm for 7 minutes and supernatant was
collected in a separating funnel
The residue was further homogenized with chloroform and again centrifuged at
5000X rpm to collect the supernatant
Now 1% NaCl solution was added to the filtrate and washed
The lower layer of chloroform was separated and treated with anhydrous Na2SO4 to
remove any traces of water
The lipid content was determined gravimetrically and expressed as dry cell weight
% after evaporating the chloroform
3.3.3.2 Conversion of algal lipids to biodiesel
After lipid extraction procedure, the conversion of algal triglycerides to methyl
esters or biodiesel is obtained by a process called transesterification.
78
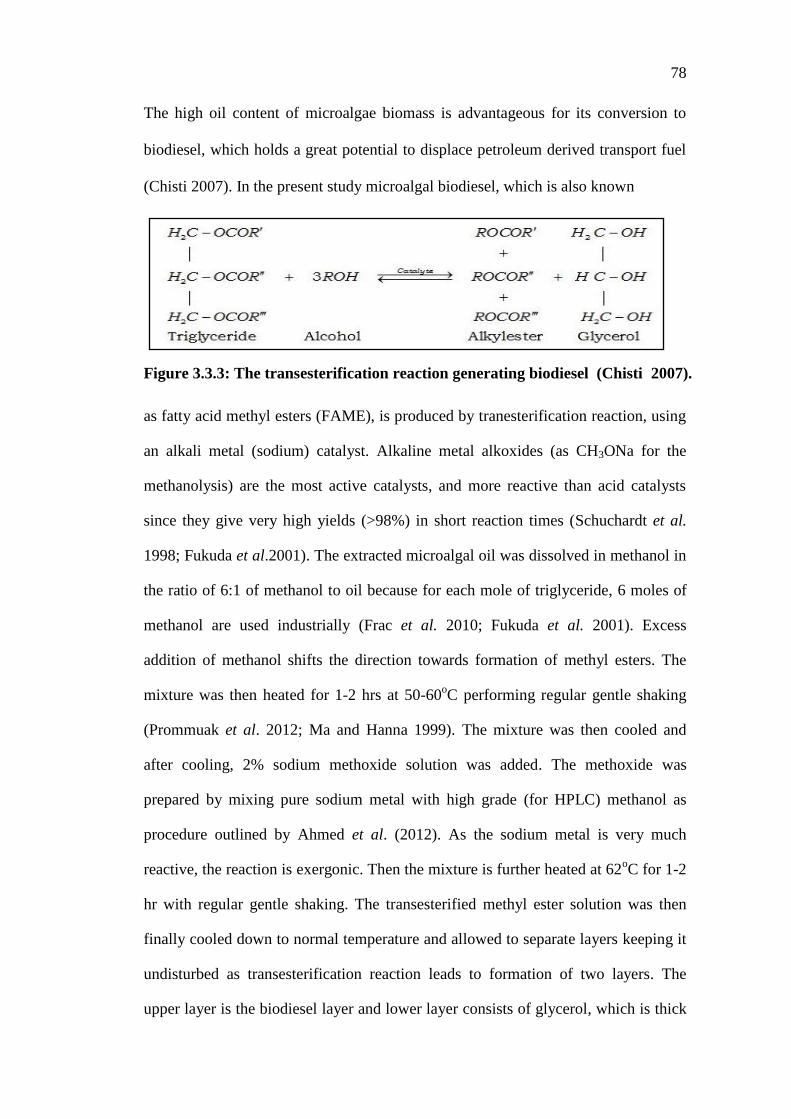
The high oil content of microalgae biomass is advantageous for its conversion to
biodiesel, which holds a great potential to displace petroleum derived transport fuel
(Chisti 2007). In the present study microalgal biodiesel, which is also known
Figure 3.3.3: The transesterification reaction generating biodiesel (Chisti 2007).
as fatty acid methyl esters (FAME), is produced by tranesterification reaction, using
an alkali metal (sodium) catalyst. Alkaline metal alkoxides (as CH3ONa for the
methanolysis) are the most active catalysts, and more reactive than acid catalysts
since they give very high yields (>98%) in short reaction times (Schuchardt et al.
1998; Fukuda et al.2001). The extracted microalgal oil was dissolved in methanol in
the ratio of 6:1 of methanol to oil because for each mole of triglyceride, 6 moles of
methanol are used industrially (Frac et al. 2010; Fukuda et al. 2001). Excess
addition of methanol shifts the direction towards formation of methyl esters. The
mixture was then heated for 1-2 hrs at 50-60oC performing regular gentle shaking
(Prommuak et al. 2012; Ma and Hanna 1999). The mixture was then cooled and
after cooling, 2% sodium methoxide solution was added. The methoxide was
prepared by mixing pure sodium metal with high grade (for HPLC) methanol as
procedure outlined by Ahmed et al. (2012). As the sodium metal is very much
reactive, the reaction is exergonic. Then the mixture is further heated at 62oC for 1-2
hr with regular gentle shaking. The transesterified methyl ester solution was then
finally cooled down to normal temperature and allowed to separate layers keeping it
undisturbed as transesterification reaction leads to formation of two layers. The
upper layer is the biodiesel layer and lower layer consists of glycerol, which is thick

79
and much heavier (Chisti 2007; Ma and Hanna 1999). The upper layer which
contains the biodiesel or fatty acid methyl esters (FAME); were collected, stored and
prepared for gas chromatography (GC-MS) analysis. According to European
Biofuels Technology Platform 2011, FAME should have Specific gravity of 0.88
kg/l, Density at 20 °C of 0.86-0.90 kg/m³, Lower heating value of 33.175 MJ/kg and
Kinematic viscosity at 40°C of 4-6 kPa s [Plate 9].
The steps involved in biodiesel preparation from microalgal oil samples through
transesterification process are as follows-
Microalgal lipid was extracted using Bligh and Dyer method
Total lipid content was estimated and transesterification reaction was carried out
using alkali metal catalyst for microalgae biodiesel preparation
Algal lipid were mixed with HPLC grade methanol in the ratio of 1:6 of oil and
methanol
Mixture was heated for 1-2 hrs at 60o C with gentle shaking
Sodium methoxide solution was prepared separately by mixing sodium metal with
high grade methanol
After cooling sodium methoxide solution was added to oil
Mixture was again heated at 62o C for 1-2 hrs with regular shaking
Transesterified oil was then cooled and allowed to separate layers
The reaction lead to formation of two layers, upper layer formed was fatty acid
methyl esters (FAME) or biodiesel and lower heavier layer formed was glycerol
FAME was collected, purified and finally analyzed using Gas chromatography and
Mass spectrophotometer (GC/MS)
80
3.3.3.3 GC/ MS analysis of microalgae biodiesel
The Fatty acid methyl esters produced as a result of transesterification of microalgal
oil, were analyzed with the help of PerkinElmer Clarus 680/600 PE Auto system
Gas Chromatography system with built-in Auto sampler and mass spectrometer. The
biodiesel samples were dissolved in n-hexane and µl of sample was injected.
Initially, the instrument oven temperature for the microalgal FAME analysis was
programmed from 50oC up to a maximum of 350
oC at a rate of 5
oC / min to 280°
with a detector temperature of 260oC. A hold for 20.00 min was maintained and the
channels were having a Sampling Rate of 1.5625 pts/second. The total run time for
the analysis was 67 minutes.
3.4. Detection of high carbon dioxide tolerant microalgae strains
3.4.1 Detection on the basis of growth kinetics
Efficient microalgae strains were detected on the basis of their growth behavior
under different culture environments. A fast growing, strain which have good
tolerance to bicarbonate as well as CO2 gas is considered suitable candidate for CO2
mitigation technology, and can be detected on the basis of its growth characteristics
and survivability at low pH and high temperature conditions. A microalga, which
can grow under high CO2 concentration and has high CO2 utilization, must show a
good growth rate and rapid multiplication with a lesser doubling time.
3.4.2 Detection on the basis of oil productivity
The algal strains used for CO2 fixation should also have high oil yielding potential.
Owing to the economy of the CO2 mitigation technology and to cope up with rising
demand to replace fossil fuels, a microalgae having potential to deliver good
quantity lipid as a result of CO2 utilization will always be the best choice for
commercial application of the technology. In the present study, lipid productivity of
81
all the four isolates was explored to detect a suitable strain for CO2 mitigation
technology. The extracted oil for all the isolates were transesterified to biodiesel and
GC/MS analysis was carried out for each samples. Blending practice in biofuel
industry is very common and particularly, B20 blend with petroleum diesel (20%
biodiesel and 80% petroleum diesel) is very widely used in countries like U.S and
many literatures supports the use of B20 biodiesel in agriculture tractors and
irrigation power units (Kulkarni et al. 2011; Al-lwayzy and Yusaf 2013). B20
biodiesel is prepared for the present study, against the microalgae strain with best
lipid accumulation behavior and biofuel properties.
3.4.3 Detection on the basis of physiological study
Microalgae physiology and growth characteristics changes along with the change in
their culture environments. Under high CO2 environment, some algal strains
undergo lag phase of growth and could not survive, because a low pH condition is
often encountered by microalgae growing in the CO2 dissolved culture media. An
efficient strain must show a good survival rate under the influence of extreme
conditions. A clear microscopic examination including SEM analysis was carried
out for all the four isolates under stress conditions. The strains which were able to
overcome the stress conditions and survive for further growth are considered as
suitable candidate for CO2 mitigation technology. The four isolates were studied on
basis of their morphological and physiological changes
.3.4.4 Detection on the basis of biomass productivity
The algal biomass produced as a result of biomitigation of CO2 depicts the CO2
fixation rate during the process (Chisti 2008). The amount of biomass produced per
day per liter of media is used to calculate the CO2 fixation rate. Hence, higher the
biomass productivity, higher is the CO2 consumption rate.
82
Biomass productivity = ΔX/ΔT;
ΔX= biomass production (mg L−1
)
ΔT=Time
CO2 fixation rate (PCO2) =1.88 × biomass productivity (P overall) (mg d−1
),
Which is derived from the typical molecular formula of microalgal biomass,
CO0.48H1.83N0.11P0.01 (Chisti 2007; Ho et al. 2010)
3.5 Optimization of in vitro mass culture technique
3.5.1 Mass culture of microalgae with normal culture media
In vitro mass cultivation of microalgae was carried out in light transparent plastic
culture tanks of 25 liter capacity. In the experiment, normal BG11 media was
prepared (20 liter), using tap water with urea as nitrogen source (0.1 g/L). The pH
of the tanks were adjusted to 7.4 with 0.1N HCl and 0.1 N NaOH with the help of
L1 120 pH meter. The culture tanks were inoculated with 20 ml of inoculums
having cell densities of Scenedesmus dimorphus=2.25X10⁷, Scenedesmus
quadricauda=3.5X10⁷,
Selenastrum gracile= 3.72X10⁷ and Chlorella
homospheara= 4.1X10⁷ cells/ml respectively. The tanks were kept under the
illumination of artificial light of 2000 lux intensity and temperature between 25-
35oC. Optical densities of microalgae cultures were measured at a regular interval of
time (24Hrs) by taking absorbance at 680nm (A680) with the help of
spectrophotometer (Systronics) in three replicates and average value was recorded.
About 10 ml of microalgae culture were taken out for O.D. and cell counts daily
from each culture flask and again 10ml of fresh media were replaced to make the
volume of culture constant. [Plate 8]

83
3.5.1.1 Mass culture of microalgae isolates with constant aeration under normal
culture media
In the experiment, mass culture was carried out in 20 liter tanks under the influence
of continuous aeration with air pumps having air flow rate of 50 ml/minute, under
normal BG11 media. O.D. and cell counts were taken daily. This procedure needs
electric energy to run air pump, but it has the advantages of cell agitation and
nutrition uniformity and light availability to the cells in the media. It prevents cells
from settling down at the bottom.
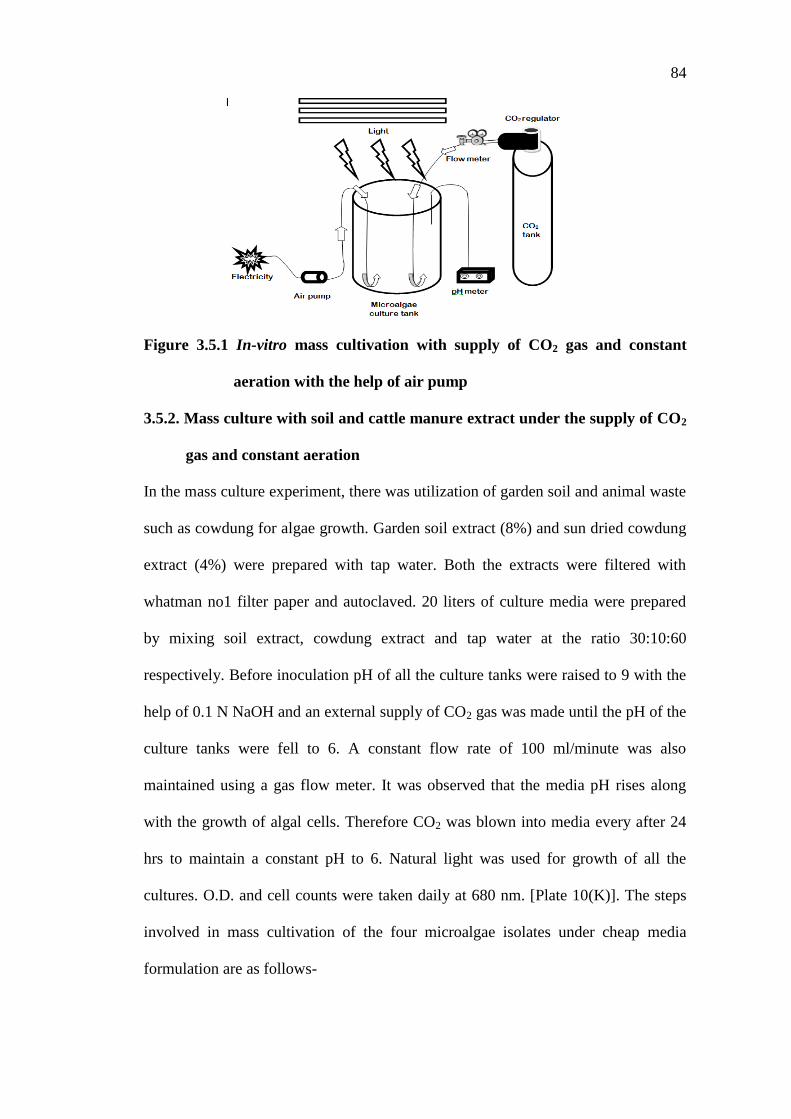
3.5.1.2 Mass culture with supply of CO2 gas and constant aeration
Mass cultivation of microalgae strains were carried out with BG11 media under
constant aeration and supply of carbon dioxide gas. Creswell (2010) mass cultured
phytoplanktons in 20 liter (carboys) tanks under continuous aeration with air
diffusers and he used to maintain the pH of cultures by addition of CO2 gas through
air delivery system. Similarly, in the present study, for CO2 addition, the pH of the
culture tanks were raised to 10.5 before inoculation, because bubbling CO2 gas
through the culture tanks tend to lower media pH by forming carbonic acid, which is
not suitable for algal growth. The supply of CO2 gas to the tanks was carried out till
the media pH falls to 6. A steady flow rate of 100 ml/minute was maintained using
a digital gas flow meter and during addition, media pH was constantly monitored by
a pH meter for CO2 utilization. CO2 gas was supplied every after 12 hours as the
media pH change along with CO2 utilization by microalgae cells for their growth.
Aeration was done through an air sparger with the help of an air pump. Aeration
improves growth and media availability to the microalgae cells and nutrient
uniformity during their growth. O.D. and cell counts were taken daily. [Plate 10(A)
&(C)].
84
Figure 3.5.1 In-vitro mass cultivation with supply of CO2 gas and constant
aeration with the help of air pump
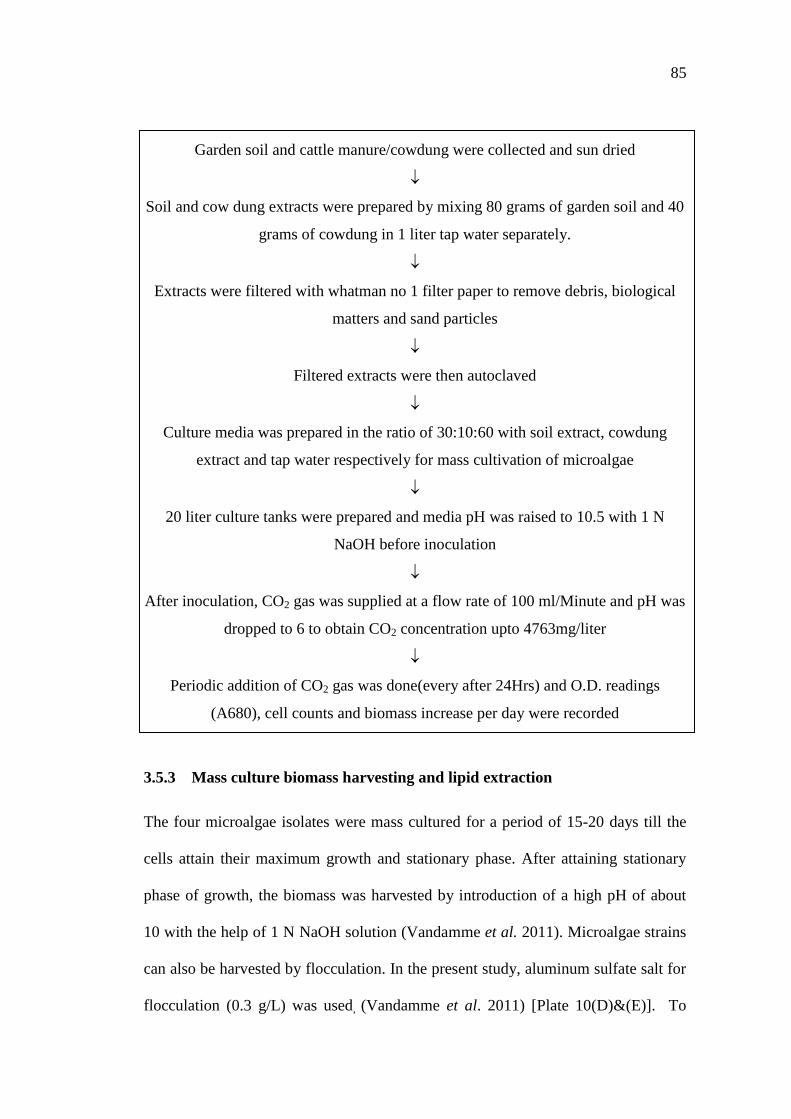
3.5.2. Mass culture with soil and cattle manure extract under the supply of CO2
gas and constant aeration
In the mass culture experiment, there was utilization of garden soil and animal waste
such as cowdung for algae growth. Garden soil extract (8%) and sun dried cowdung
extract (4%) were prepared with tap water. Both the extracts were filtered with
whatman no1 filter paper and autoclaved. 20 liters of culture media were prepared
by mixing soil extract, cowdung extract and tap water at the ratio 30:10:60
respectively. Before inoculation pH of all the culture tanks were raised to 9 with the
help of 0.1 N NaOH and an external supply of CO2 gas was made until the pH of the
culture tanks were fell to 6. A constant flow rate of 100 ml/minute was also
maintained using a gas flow meter. It was observed that the media pH rises along
with the growth of algal cells. Therefore CO2 was blown into media every after 24
hrs to maintain a constant pH to 6. Natural light was used for growth of all the
cultures. O.D. and cell counts were taken daily at 680 nm. [Plate 10(K)]. The steps
involved in mass cultivation of the four microalgae isolates under cheap media
formulation are as follows-
85
Garden soil and cattle manure/cowdung were collected and sun dried
Soil and cow dung extracts were prepared by mixing 80 grams of garden soil and 40
grams of cowdung in 1 liter tap water separately.
Extracts were filtered with whatman no 1 filter paper to remove debris, biological
matters and sand particles
Filtered extracts were then autoclaved
Culture media was prepared in the ratio of 30:10:60 with soil extract, cowdung
extract and tap water respectively for mass cultivation of microalgae
20 liter culture tanks were prepared and media pH was raised to 10.5 with 1 N
NaOH before inoculation
After inoculation, CO2 gas was supplied at a flow rate of 100 ml/Minute and pH was
dropped to 6 to obtain CO2 concentration upto 4763mg/liter
Periodic addition of CO2 gas was done(every after 24Hrs) and O.D. readings
(A680), cell counts and biomass increase per day were recorded
3.5.3 Mass culture biomass harvesting and lipid extraction
The four microalgae isolates were mass cultured for a period of 15-20 days till the
cells attain their maximum growth and stationary phase. After attaining stationary
phase of growth, the biomass was harvested by introduction of a high pH of about
10 with the help of 1 N NaOH solution (Vandamme et al. 2011). Microalgae strains
can also be harvested by flocculation. In the present study, aluminum sulfate salt for
flocculation (0.3 g/L) was used, (Vandamme et al. 2011) [Plate 10(D)&(E)]. To
86
measure the effectiveness of the flocculent in the harvesting process, O.D. at 680 nm
every after 15 minutes of time interval, from the time of addition, was recorded
accordingly. After settlement of all the cells at the bottom, the clear media was
decanted and cells were sun dried and used further use and oil extraction. The dry
biomass was weighed out prior to lipid extraction process using chloroform and
methanol and total lipid content in terms of % dry cell weight were calculated for
each set of experiments.
3.5.4 Mass culture with recycled harvested media
After a fresh batch of mass culture under BG11 media, the cells were harvested,
separated and the cells free spent media was collected and recycled for growth of
next batch of culture. Only two major elements, nitrogen nutrient (urea) and carbon
nutrient in the form of CO2 gas were added in the used media and checked for
microalgal growth. Prior to inoculation the volume was adjusted to 20 liters by
adding deficit amount of water and pH was adjusted and lowered to a value of 6
with 0.1 N HCl. Optical densities of microalgae cultures were measured at a regular
interval of time (24Hrs) by taking absorbance at 680nm (A680) with the help of
spectrophotometer (Systronics) in three replicates and average values were recorded.
A growth curve was plotted to record the daily growth behavior of the strains.
3.5.5 Construction of a simple hypothetical experimental design for microalgae
culture
In the experimental design CO2 gas (100%) may be supplied to microalgae culture
tank using regulators of the CO2 cylinder for controlling the inflow and out flow of
gas. (Dianursanti et al. 2010). To maintain a steady and optimum flow rate, the CO2
gas input is controlled through a flow meter and when CO2 gas is bubbled through

87
the culture tank, there is noticeably change/fall of pH which inhibit microalgae
growth. Hence, prior to the addition of CO2 gas, the culture pH was increased to
10.5 initially, which become lowered, when CO2 gets dissolved in media forming
carbonic acid with media. Again, most of the CO2 gas tend to loss in air due to use
of open cultivation systems, but in the design the undissolved CO2 gas can again be
collected by providing an out let and closing the culture tank. The out let is
connected to a vessel containing NH3 solution and NaCl salt, which reacts with
escaped CO2 gas to form bicarbonate salt and ammonium chloride salt (Solvay
process), which are again good nutrients for microalgae (Sostaric et al. 2009). The
pH of this Solvay solution, which is formed by escaped CO2 is also monitored using
another pH meter. The Experimental design has the advantage of forming nutrient
salts from CO2 gas, which can again be used to feed microalgae.
Figure-3.5.5: A simple hypothetical experimental design for microalgae
cultivation in-vitro employing conversion of CO2 gas into
bicarbonate as reported by Sostaric et al. (2009).
88
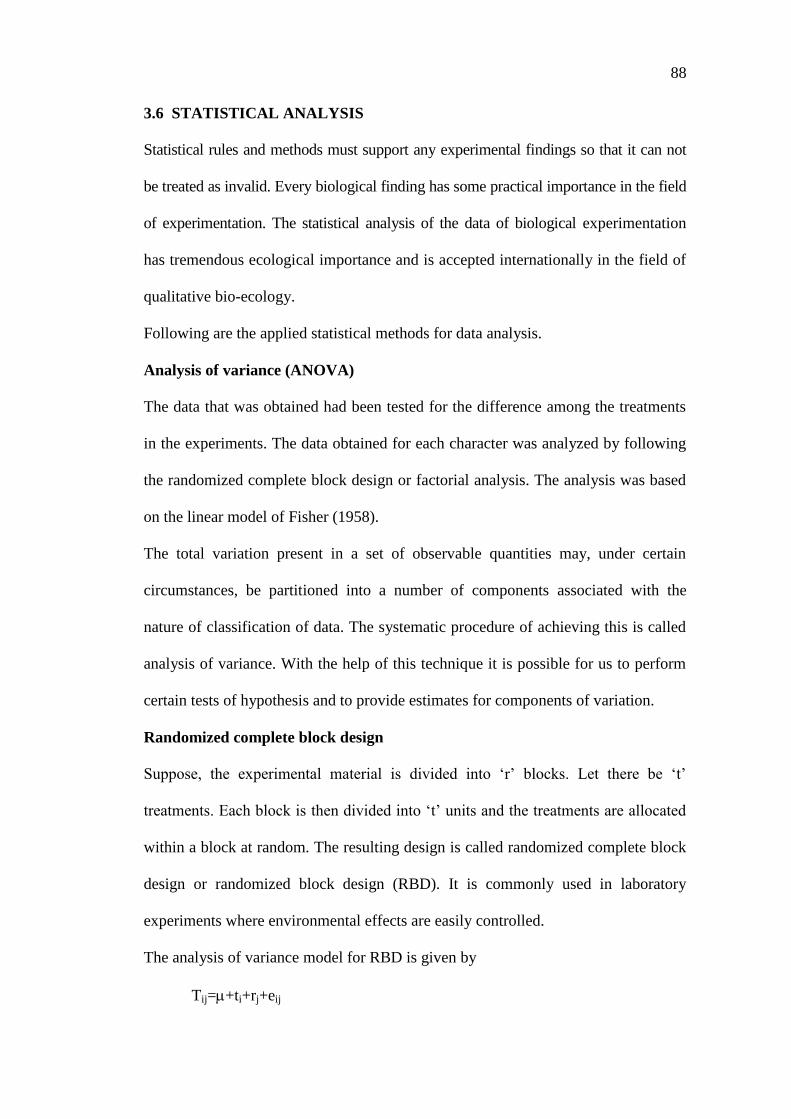
3.6 STATISTICAL ANALYSIS
Statistical rules and methods must support any experimental findings so that it can not
be treated as invalid. Every biological finding has some practical importance in the field
of experimentation. The statistical analysis of the data of biological experimentation
has tremendous ecological importance and is accepted internationally in the field of
qualitative bio-ecology.
Following are the applied statistical methods for data analysis.
Analysis of variance (ANOVA)
The data that was obtained had been tested for the difference among the treatments
in the experiments. The data obtained for each character was analyzed by following
the randomized complete block design or factorial analysis. The analysis was based
on the linear model of Fisher (1958).
The total variation present in a set of observable quantities may, under certain
circumstances, be partitioned into a number of components associated with the
nature of classification of data. The systematic procedure of achieving this is called
analysis of variance. With the help of this technique it is possible for us to perform
certain tests of hypothesis and to provide estimates for components of variation.
Randomized complete block design
Suppose, the experimental material is divided into „r‟ blocks. Let there be „t‟
treatments. Each block is then divided into „t‟ units and the treatments are allocated
within a block at random. The resulting design is called randomized complete block
design or randomized block design (RBD). It is commonly used in laboratory
experiments where environmental effects are easily controlled.
The analysis of variance model for RBD is given by
Tij=+ti+rj+eij
89
where, = the overall mean, ti = the ith
treatment effect
rj = the jth
replication effect, and eij = the error term.
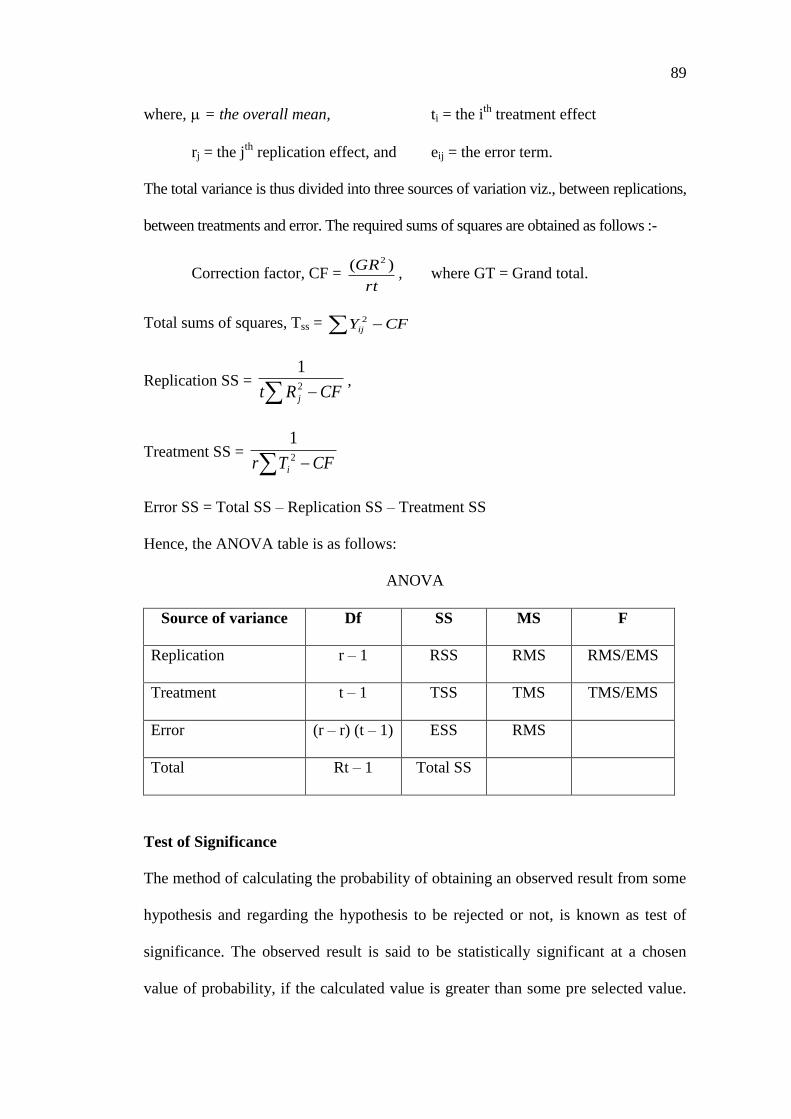
The total variance is thus divided into three sources of variation viz., between replications,
between treatments and error. The required sums of squares are obtained as follows :-
Correction factor, CF = rt
GR )( 2
, where GT = Grand total.
Total sums of squares, Tss = CFYij
2
Replication SS = CFRt j
2
1,
Treatment SS = CFTr i
2
1
Error SS = Total SS – Replication SS – Treatment SS
Hence, the ANOVA table is as follows:
ANOVA
Source of variance Df SS MS F
Replication r – 1 RSS RMS RMS/EMS
Treatment t – 1 TSS TMS TMS/EMS
Error (r – r) (t – 1) ESS RMS
Total Rt – 1 Total SS
Test of Significance
The method of calculating the probability of obtaining an observed result from some
hypothesis and regarding the hypothesis to be rejected or not, is known as test of
significance. The observed result is said to be statistically significant at a chosen
value of probability, if the calculated value is greater than some pre selected value.
90
If the calculated value is more than the tabulated value at 1% probability then it is
said to be highly significant and if the calculated value is lower than the tabular
value at 1% but higher than tabular value at 5% probability it is said to be
significant. In biological experiments, generally probability of 0.05 is also referred
to as 5% level of significance. From the calculations, the result is compared with the
standard values for different probability distributions from statistical tables.
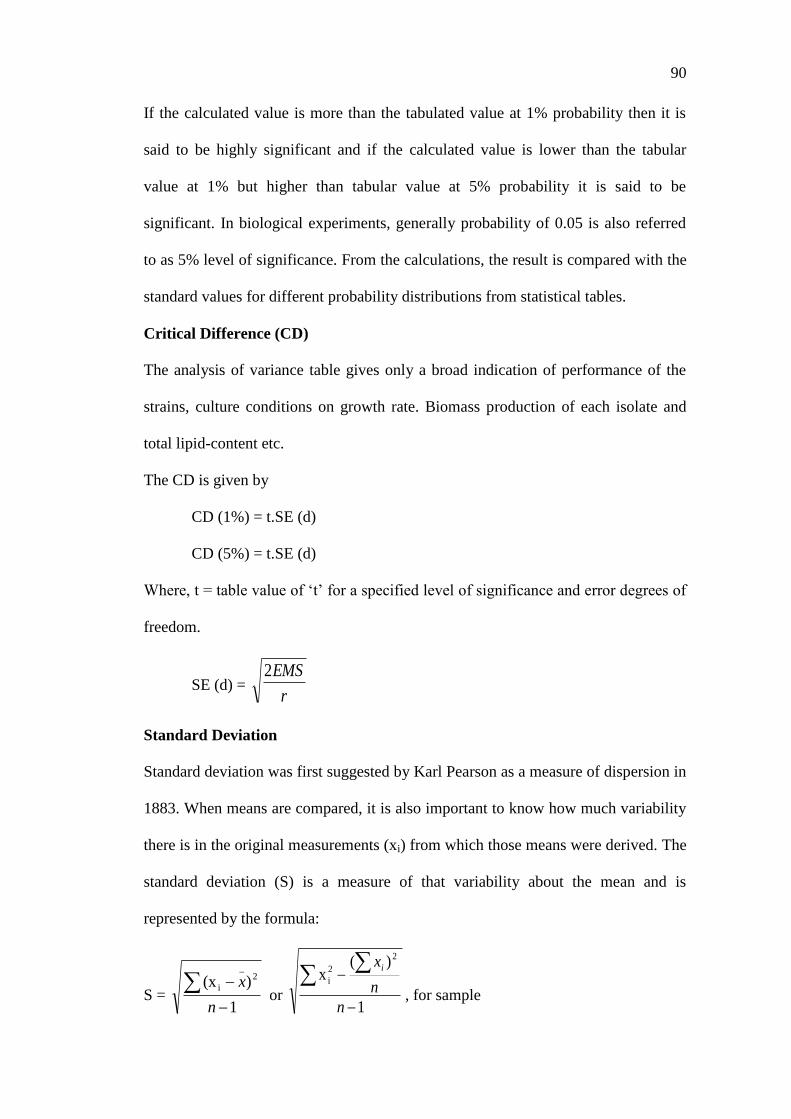
Critical Difference (CD)
The analysis of variance table gives only a broad indication of performance of the
strains, culture conditions on growth rate. Biomass production of each isolate and
total lipid-content etc.
The CD is given by
CD (1%) = t.SE (d)
CD (5%) = t.SE (d)
Where, t = table value of „t‟ for a specified level of significance and error degrees of
freedom.
SE (d) = r
EMS2
Standard Deviation
Standard deviation was first suggested by Karl Pearson as a measure of dispersion in
1883. When means are compared, it is also important to know how much variability
there is in the original measurements (xi) from which those means were derived. The
standard deviation (S) is a measure of that variability about the mean and is
represented by the formula:
S = 1
)(x 2_
i
n
x or
1
)(x
2
2
i
n
n
xi
, for sample
91
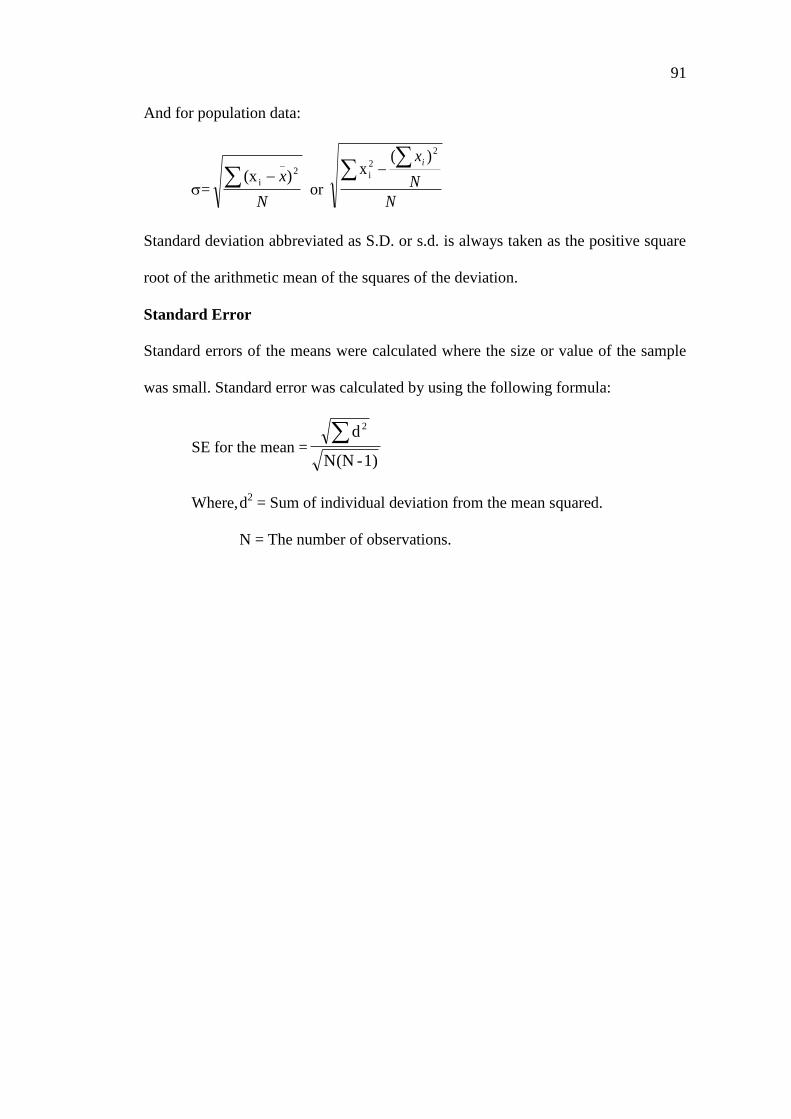
And for population data:
=N
x 2_
i )(x or
N
N
xi
2
2
i
)(x
Standard deviation abbreviated as S.D. or s.d. is always taken as the positive square
root of the arithmetic mean of the squares of the deviation.
Standard Error
Standard errors of the means were calculated where the size or value of the sample
was small. Standard error was calculated by using the following formula:
SE for the mean =1)-N(N
d 2
Where, d2 = Sum of individual deviation from the mean squared.
N = The number of observations.
92
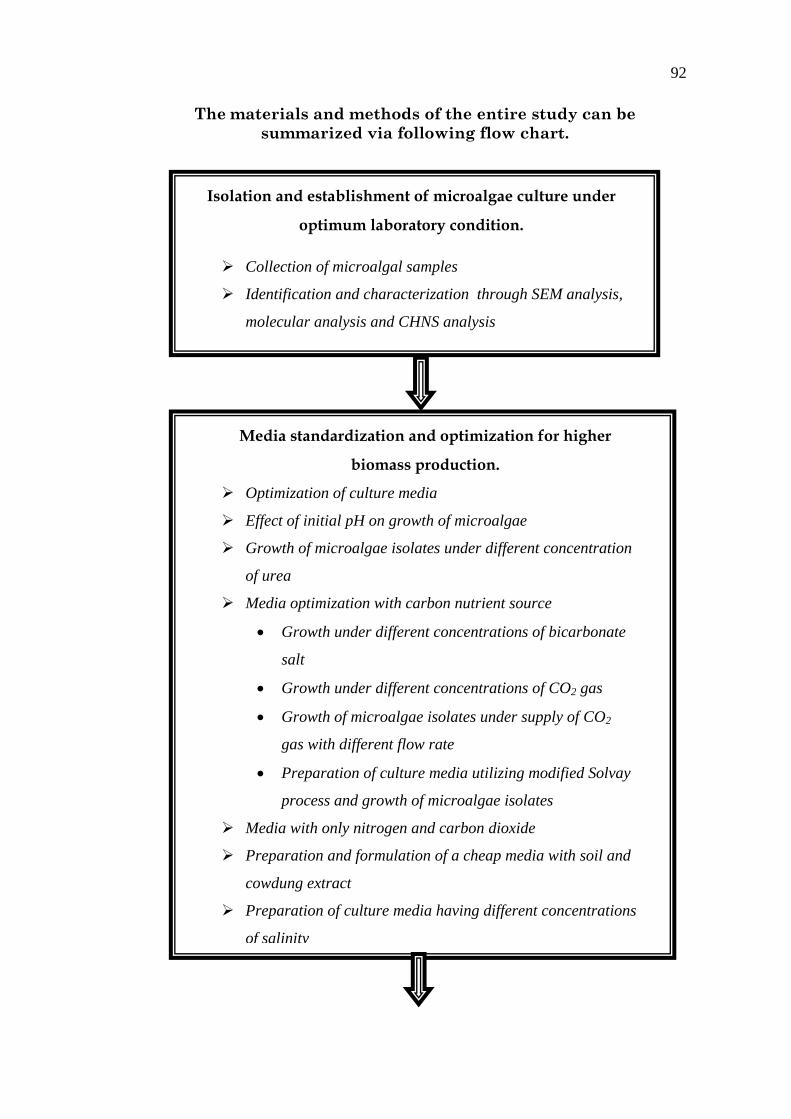
The materials and methods of the entire study can be
summarized via following flow chart.
Isolation and establishment of microalgae culture under
optimum laboratory condition.
Collection of microalgal samples
Identification and characterization through SEM analysis,
molecular analysis and CHNS analysis
Media standardization and optimization for higher
biomass production.
Optimization of culture media
Effect of initial pH on growth of microalgae
Growth of microalgae isolates under different concentration
of urea
Media optimization with carbon nutrient source
Growth under different concentrations of bicarbonate
salt
Growth under different concentrations of CO2 gas
Growth of microalgae isolates under supply of CO2
gas with different flow rate
Preparation of culture media utilizing modified Solvay
process and growth of microalgae isolates
Media with only nitrogen and carbon dioxide
Preparation and formulation of a cheap media with soil and
cowdung extract
Preparation of culture media having different concentrations
of salinity
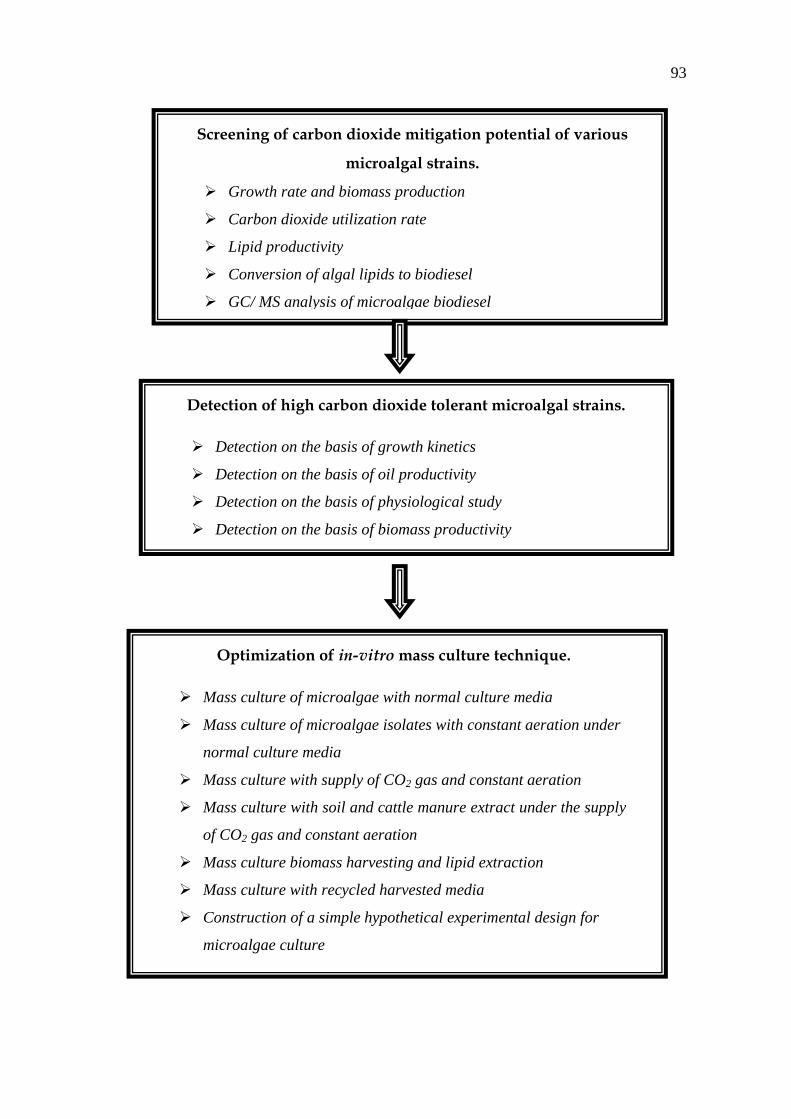
93
Screening of carbon dioxide mitigation potential of various
microalgal strains.
Growth rate and biomass production
Carbon dioxide utilization rate
Lipid productivity
Conversion of algal lipids to biodiesel
GC/ MS analysis of microalgae biodiesel
Detection of high carbon dioxide tolerant microalgal strains.
Detection on the basis of growth kinetics
Detection on the basis of oil productivity
Detection on the basis of physiological study
Detection on the basis of biomass productivity
Optimization of in-vitro mass culture technique.
Mass culture of microalgae with normal culture media
Mass culture of microalgae isolates with constant aeration under
normal culture media
Mass culture with supply of CO2 gas and constant aeration
Mass culture with soil and cattle manure extract under the supply
of CO2 gas and constant aeration
Mass culture biomass harvesting and lipid extraction
Mass culture with recycled harvested media
Construction of a simple hypothetical experimental design for
microalgae culture