materials of cement science primer
TRANSCRIPT

Materials of Cement Science Primer
Principal Investigators: Professors Hamlin Jennings and Jeffery Thomas
A final report submitted to the Infrastructure Technology Institute for TEA-
21 funded projects designated A474 DISCLAIMER: The contents of this report reflect the views of the authors, who are responsible for the facts and accuracy of the information presented herein. This Document is disseminated under the sponsorship of the Department of Transportation University of Transportation Centers Program, in the interest of information exchange. The U.S. Government assumes no liability for the contents or use thereof.

1
The Science of Concrete
Jeffrey J. Thomas
Department of Civil and Environmental Engineering
Northwestern University, Evanston, IL 60208
Table of Contents
Chapter 1. Introduction 2
Chapter 2. Concrete Basics 7
Chapter 3. The Concrete Construction Process 19
Chapter 4. Manufacture and composition of Portland cement 24
Chapter 5. Hydration and microstructure of Portland cement paste 45
Chapter 6. The pore structure and surface area of cement paste 71
Acknowledgment 93
References 93
1

1 Introduction to this web site
1.1 Some motivation to start: Is concrete a scientifically interesting material?
Few would argue that concrete is an important and useful material: after all, concrete is the backbone of the world’s infrastructure, used in vast amounts to make roads, buildings, bridges, and other structures. But sometimes familiarity breeds contempt. To most people, concrete is simply that boring grey stuff that we see all around us, about which everything important must be known by now. Not true! Concrete may be somewhat boring when viewed at the macroscopic scale (meaning what you see with your unaided eyes), but at the microscopic scale (i.e., features too small to be seen without a microscope) it is both interesting and complex. And surprisingly enough, due to its complexity there are still many things that scientists do not fully understand about the chemistry and microscopic structure of concrete. This web site will provide an overview of the complex structure of concrete, the chemical reactions that form this structure, and the resulting properties – both good and bad. Along the way we will point out the things that aren’t fully understood, even by the scientists who study concrete.
In the discipline of Materials Science, the key rule can be summed up as “knowledge is power” – the more knowledge you have about the structure of a material and how to alter it, the more power you have to improve the properties of the material to make it perform better and in a wider range of applications. The best example of this is steel. While steel has been used for hundreds of years, only in last few decades have materials scientists come to fully understand exactly what happens when various alloying elements and processing methods are used to make steel. As a result, the properties of steel (such has strength and toughness) and the range of applications for steel have both improved more in the last 20 years than in the preceding century. Concrete, on the other hand, has not reached that point. We understand the basics, but we have not reached that elegant and powerful state of knowledge where we can predict exactly what will happen to the properties of concrete when we add certain chemicals or cure it in a specific way. However, important advances are being made, and the next 20 years may well become the “renaissance” period for concrete as the last 20 years has been for steel. If this happens, we will not only have better and longer-lasting concrete structures, but we will see concrete used in completely new applications. So the answer to the question in the title of this section is yes!
1.2 Why did we make this web site, and what is in it?
Concrete is the world’s most widely used man-made material, but the average person knows very little about it. In the previous section we mentioned that there were many things that remain to be learned about concrete, and while this is true it also cannot be denied that there is a great deal that is known. For the engineers, architects, contractors and other professionals who design and build with concrete there is a huge database of empirical knowledge on how to mix, place, and cure concrete for specific applications that has been collected into published volumes called standards. There is also an active community of scientists (including the authors of this site) who conduct research related to cement and concrete and publish their findings in scientific journals. As you might expect, neither of these sources is ideal for the
2
average person who wants to learn more about concrete. Published standards [e.g. i]. have the specific purpose of ensuring that concrete has the required strength, durability, and other properties needed to fit a specific application, and as such they deal only with the “how” and not with the “why”. This means that the professional who works with concrete generally has little detailed understanding of (and may not even be aware of) the fundamental chemical processes that give concrete its useful properties. On the other hand, the scientific literature on cement and concrete, while perhaps not as arcane as that of genetics or particle physics, is really only comprehensible to those who already know enough about the subject to contribute to it themselves.
So there seems to be a need for a source of information on the scientific aspects of concrete for the non-expert, and that is the motivation for this web site. To be fair, we should mention that there are books on cement and concrete [e.g. ii,iii,iv] that fulfill this role to some extent, and that some of them are more comprehensive than this web site. However, these books are not inexpensive and are not generally found in bookstores. The great advantage of a web site is that it is (usually) free and widely accessible. A web site has other advantages as well – we can add to it and update it to reflect new findings and theories, and we can reconfigure it in response to feedback from users.
As to the contents of this web site, we aim to answer the following basic questions, posed in order of complexity
• What is the difference between cement and concrete?
• What are the ingredients in cement powder, and how is it made?
• Why does cement get hard when it is mixed with water?
• How are the properties of cement and concrete related to its structure?
The first question is quite simple and is dealt with below at the start of the next section. The second and third questions are a bit more complex, requiring a chapter or so each to answer. The fourth question is the most important and difficult – in fact, this is where we don’t have all of the answers – and most of the later topics covered in this web site are related to this question.
The focus of the web site is on the most common type of cement, known as Portland cement. Cements of this type, also called calcium silicate cements, are by far the most widely used type of cement. We will also discuss so-called “blended” cements, which are formed by replacing some of the Portland cement with other reactive materials such as silica fume, blast furnace slag, and fly ash. Blended cements are used in a large and growing fraction of world’s concrete, and the chemical reactions and reaction products associated with the additive materials are similar to those of Portland cement itself.
It is probably also useful to mention what will not be covered in much detail. As the title suggests, the focus is on the science, and thus the practical engineering aspects of concrete will be covered only sparingly and in general terms. Thus there will be little discussion of detailed recipes for making concrete, of reinforced concrete, or of the design of concrete structures, except as needed to motivate the scientific topics. A minor exception to this is Chapter 3, which gives a brief overview of how concrete is used in the construction industry.
For those who have a scientific background and who want even more detail than this web site provides about the chemistry of cement manufacture, the details of the hydration process,
3
and other types of cement, we can confidently recommend the standard and excellent book by Taylor [v].
1.3 The materials science of cement – a quick overview
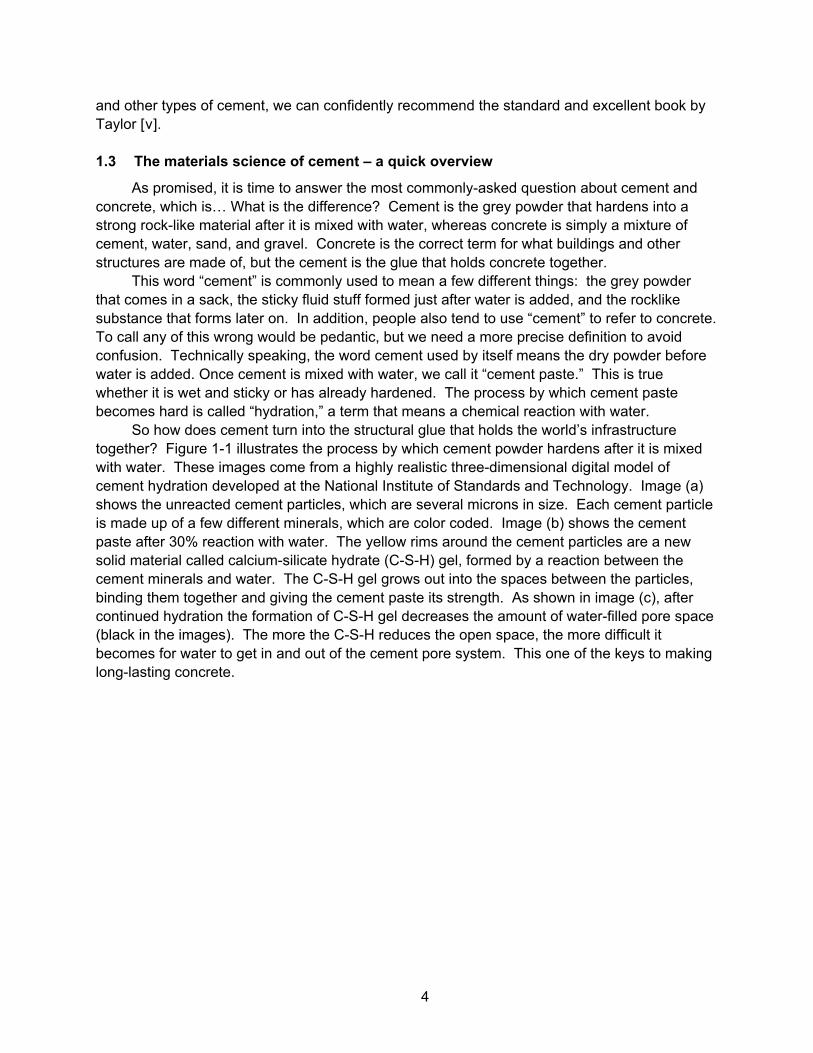
As promised, it is time to answer the most commonly-asked question about cement and concrete, which is… What is the difference? Cement is the grey powder that hardens into a strong rock-like material after it is mixed with water, whereas concrete is simply a mixture of cement, water, sand, and gravel. Concrete is the correct term for what buildings and other structures are made of, but the cement is the glue that holds concrete together.
This word “cement” is commonly used to mean a few different things: the grey powder that comes in a sack, the sticky fluid stuff formed just after water is added, and the rocklike substance that forms later on. In addition, people also tend to use “cement” to refer to concrete. To call any of this wrong would be pedantic, but we need a more precise definition to avoid confusion. Technically speaking, the word cement used by itself means the dry powder before water is added. Once cement is mixed with water, we call it “cement paste.” This is true whether it is wet and sticky or has already hardened. The process by which cement paste becomes hard is called “hydration,” a term that means a chemical reaction with water.
So how does cement turn into the structural glue that holds the world’s infrastructure together? Figure 1-1 illustrates the process by which cement powder hardens after it is mixed with water. These images come from a highly realistic three-dimensional digital model of cement hydration developed at the National Institute of Standards and Technology. Image (a) shows the unreacted cement particles, which are several microns in size. Each cement particle is made up of a few different minerals, which are color coded. Image (b) shows the cement paste after 30% reaction with water. The yellow rims around the cement particles are a new solid material called calcium-silicate hydrate (C-S-H) gel, formed by a reaction between the cement minerals and water. The C-S-H gel grows out into the spaces between the particles, binding them together and giving the cement paste its strength. As shown in image (c), after continued hydration the formation of C-S-H gel decreases the amount of water-filled pore space (black in the images). The more the C-S-H reduces the open space, the more difficult it becomes for water to get in and out of the cement pore system. This one of the keys to making long-lasting concrete.
4

a) Unreacted cement reacted reacted
b) 30% c) 70%
Figure 1-1: A realistic model of cement reacting with water and becoming hard. a) Digitized image of a real cement powder just after it is combined with water. The various cement minerals are color coded and the water is black. b) Cement paste that is 30% reacted and has set (about 1 day after mixing). c). Cement paste that is 70% reacted and has become much stronger and less porous (about 1 month after mixing). (Images courtesy of NIST).
The configuration of solid phases and pore space illustrated in the images of Fig. 1-1 is
called the microstructure, a word that simply means the structure at the scale of microns (there are 1000 microns in a millimeter). Microstructural features are generally too small to be seen without a microscope, but on the other hand they are much larger than the atoms or molecules that make up the fundamental chemical structure. In general, both the chemical structure and the microstructure of a material control its properties. An important difference between the two is that while the chemical structure is relatively fixed, the microstructure depends strongly on how the material is made and can be controlled. Thus the microstructure provides a link between processing (how a material is made) and properties (how a material behaves). These relationships are the basis of the growing field of materials science (see Fig. 1-2).
Figure 1-2: The paradigm of materials science. The microstructure of a material depends on the way that it is processed, and the properties depend on the
5
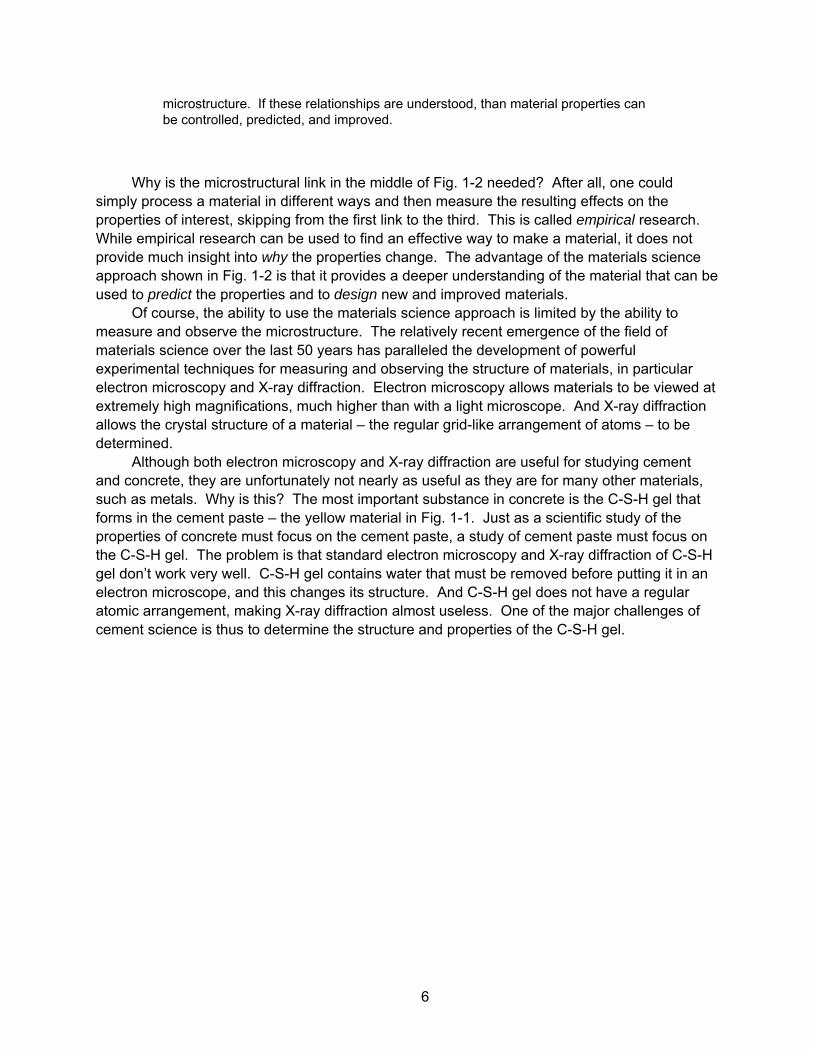
microstructure. If these relationships are understood, than material properties can be controlled, predicted, and improved.
Why is the microstructural link in the middle of Fig. 1-2 needed? After all, one could
simply process a material in different ways and then measure the resulting effects on the properties of interest, skipping from the first link to the third. This is called empirical research. While empirical research can be used to find an effective way to make a material, it does not provide much insight into why the properties change. The advantage of the materials science approach shown in Fig. 1-2 is that it provides a deeper understanding of the material that can be used to predict the properties and to design new and improved materials.
Of course, the ability to use the materials science approach is limited by the ability to measure and observe the microstructure. The relatively recent emergence of the field of materials science over the last 50 years has paralleled the development of powerful experimental techniques for measuring and observing the structure of materials, in particular electron microscopy and X-ray diffraction. Electron microscopy allows materials to be viewed at extremely high magnifications, much higher than with a light microscope. And X-ray diffraction allows the crystal structure of a material – the regular grid-like arrangement of atoms – to be determined.
Although both electron microscopy and X-ray diffraction are useful for studying cement and concrete, they are unfortunately not nearly as useful as they are for many other materials, such as metals. Why is this? The most important substance in concrete is the C-S-H gel that forms in the cement paste – the yellow material in Fig. 1-1. Just as a scientific study of the properties of concrete must focus on the cement paste, a study of cement paste must focus on the C-S-H gel. The problem is that standard electron microscopy and X-ray diffraction of C-S-H gel don’t work very well. C-S-H gel contains water that must be removed before putting it in an electron microscope, and this changes its structure. And C-S-H gel does not have a regular atomic arrangement, making X-ray diffraction almost useless. One of the major challenges of cement science is thus to determine the structure and properties of the C-S-H gel.
6

2 Concrete Basics
2.1 Introduction
In this chapter we will introduce and discuss the various ingredients that can be used to make concrete. Many of the scientific issues that are discussed in detail in later chapters will be introduced and discussed briefly to motivate their importance and to give you a idea of what is to come in later chapters.
Lets start by reviewing some basics. Concrete is a composite material, meaning that it is made up of more than one type of material. While concrete can contain a wide variety of different materials, the simplest view divides concrete into just two components: the filler and the binder. Cement paste is the binder component of concrete, the glue that holds the filler together to create a uniform, strong material. The filler in concrete consists primarily of aggregate particles. These can be made out of lots of different materials, but the vast majority of aggregate is just sand, gravel, and rocks, which are cheap, plentiful, and easily obtained from nature. Cement, on the other hand, is a man-made material that requires high-temperature processing, grinding, and other costly and energy-intensive steps (these are discussed in Chapter 4). Pure cement paste would not only be much more expensive to use than concrete, but would not perform nearly as well. This is primarily because cement paste has a tendency to shrink and crack when it dries, and the aggregate helps prevent this. So unless you mix it up yourself, or hang around a cement research lab, you will rarely come across pure cement paste, just concrete. Figure 2-1 shows the basic ingredients of concrete.
Figure 2-1: The basic ingredients of concrete. From left to right: fine aggregate (sand), coarse aggregate (gravel or rocks), water, and cement. (Image courtesy of the Portland Cement Association). MK5-019
2.2 The language of concrete - some basic terms
As is true of any complex topic, those who work with cement and concrete have developed some specific terminology. Many of these terms and concepts will be introduced and
7

defined as they are first needed, but it will probably be helpful to go over some of them now. Here are some of the most basic terms:
Concrete: A mixture of sand, gravel, and rocks held together by cement paste. The world’s most widely used man-made material.
Cement: The active ingredient used to make concrete. Cement is a grey, powdery mixture of oxide minerals of calcium and silicon, and to a lesser extent aluminum and iron, that have been processed at a high temperature and ground to a fine powder to make it reactive with water. Once cement has been mixed with water, we call it “cement paste”
Portland cement: The most common general category of cement, the main subject of this web site. Often abbreviated OPC, for Ordinary Portland Cement.
Cement paste: Dry cement powder (see above) that has been mixed with water. While is still fluid and sticky, it is called “fresh” cement paste. After that it is called “hardened” cement paste.
Aggregate: The inert filler material that makes up the bulk of concrete. Usually sand, gravel, and rocks. Fibers and reinforcing bars are not considered aggregate.
Mortar: A mixture of cement paste and sand used in thin layers to hold together bricks or stones. Mortar is technically just concrete with a small maximum aggregate size.
Mineral admixture: A reactive, finely ground material that can be used to replace some of the cement in concrete, in order to reduce cost, improve the properties, or both. Mineral admixtures are usually byproducts of other industrial processes that have undergone some further processing.
Blended cement: A mixture of Portland cement and mineral admixtures.
Mix water: the water that is added to concrete in order to hydrate the cement.
Fresh: Refers to cement paste or concrete that has been recently mixed and is still fluid. This is what those big trucks with the rotating container on the back are full of. (These are often called “cement mixers” but now you know why they should be called “concrete mixers”).
Workability: How easy it is to mix, pour, and otherwise manipulate fresh concrete. An important consideration for most types of on-site construction.
Water/cement ratio: The weight of the water added to concrete divided by the weight of the cement. Often abbreviated w/c. The higher the w/c, the more workable the concrete will be while fresh, but the lower the final strength.
Water/binder ratio: Same as the water/cement ratio, except other reactive components such as mineral admixtures are included. Often abbreviated w/b.
Hydration: The chemical reactions between cement and water that cause cement paste and concrete to become hard and strong.
Set: The transition from fresh cement paste (or concrete) to hardened cement paste (or concrete), caused by hydration of the cement. “Initial set” is the time when the paste can no longer be poured or mixed, and “final set” is the time when the paste is completely rigid and can bear some load, such as walking on it.
8
Hardened: Refers to cement paste or concrete that has achieved final set – that is, gained enough strength to bear some load.
Curing/Hardening: Essentially interchangeable terms that refer to the process of continued strength gain after the cement paste has set. Both setting and curing are caused by the hydration reactions between cement and water.
Young: Refers to cement paste or concrete that has recently set and is now actively hardening. What constitutes “young” in terms of time is variable; the term implies that the paste has undergone a only fraction of its full reaction and is thus relatively weak and vulnerable to damage. This could be anywhere from a few hours to weeks depending on the mix design and the temperature.
Mature: Refers to cement paste or concrete that has reached, or nearly reached, its full strength and is reacting very slowly, if at all. An age of 28 days is a rough rule of thumb for reaching maturity.
Chemical admixture: A chemical added in relatively small amounts to concrete to change the rate of hydration, improve the workability, or change the final properties. Also called a chemical additive.
Hydration products: The new solid phases in cement paste that are formed by hydration of the cement. The most important of these is the C-S-H gel.
Heat of hydration: The heat released by the chemical reactions between cement and water. Large volumes of concrete can warm up considerably during the first few days when hydration is rapid. This is generally a bad thing, for reasons that will be discussed.
Placing: The process of transferring fresh concrete from the mixer to the formwork that defines its final location and shape
Segregation: An undesirable process of the aggregate particles becoming unevenly distributed within the fresh cement paste while the concrete is being placed or consolidated.
Bleeding: An undesirable process of mix water separating from the fresh cement paste or concrete after it is mixed and appearing as a layer on top of the concrete.
2.3 The composition of a typical concrete
As discussed above, the filler in concrete (the aggregate) is quite inexpensive in comparison to the binder phase (the cement paste). This is because cement is manufactured using an energy-intensive process, while aggregate undergoes only a small amount of processing, if any. Fortunately, there is a lot more aggregate then cement in concrete. Table 2.1 below lists the weight and volume of the various components that must be combined to make one cubic meter or one cubic yard of a typical medium-quality concrete. This information is called a “mix design.”
Table 2.1. A typical concrete mix design.
lb/yd3 kg/m3 Percent by weight Percent by volume
9
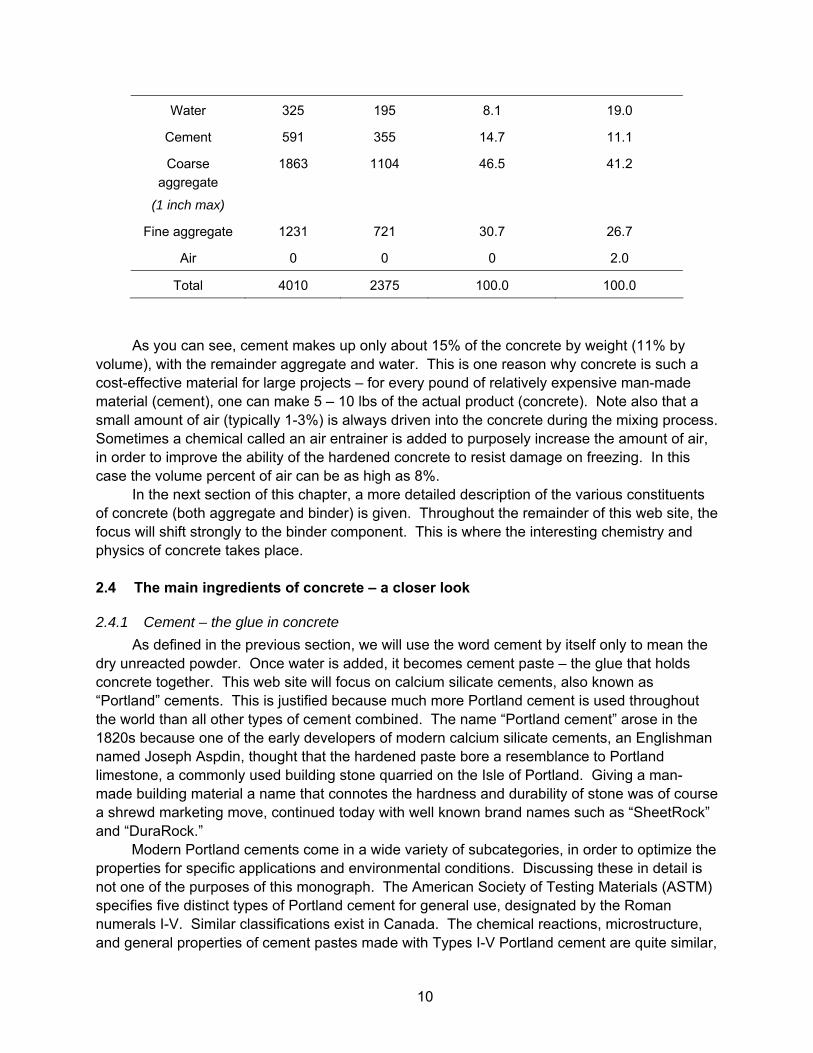
Water 325 195 8.1 19.0
Cement 591 355 14.7 11.1
Coarse aggregate
(1 inch max)
1863 1104 46.5 41.2
Fine aggregate 1231 721 30.7 26.7
Air 0 0 0 2.0
Total 4010 2375 100.0 100.0
As you can see, cement makes up only about 15% of the concrete by weight (11% by volume), with the remainder aggregate and water. This is one reason why concrete is such a cost-effective material for large projects – for every pound of relatively expensive man-made material (cement), one can make 5 – 10 lbs of the actual product (concrete). Note also that a small amount of air (typically 1-3%) is always driven into the concrete during the mixing process. Sometimes a chemical called an air entrainer is added to purposely increase the amount of air, in order to improve the ability of the hardened concrete to resist damage on freezing. In this case the volume percent of air can be as high as 8%.
In the next section of this chapter, a more detailed description of the various constituents of concrete (both aggregate and binder) is given. Throughout the remainder of this web site, the focus will shift strongly to the binder component. This is where the interesting chemistry and physics of concrete takes place.
2.4 The main ingredients of concrete – a closer look
2.4.1 Cement – the glue in concrete As defined in the previous section, we will use the word cement by itself only to mean the
dry unreacted powder. Once water is added, it becomes cement paste – the glue that holds concrete together. This web site will focus on calcium silicate cements, also known as “Portland” cements. This is justified because much more Portland cement is used throughout the world than all other types of cement combined. The name “Portland cement” arose in the 1820s because one of the early developers of modern calcium silicate cements, an Englishman named Joseph Aspdin, thought that the hardened paste bore a resemblance to Portland limestone, a commonly used building stone quarried on the Isle of Portland. Giving a man-made building material a name that connotes the hardness and durability of stone was of course a shrewd marketing move, continued today with well known brand names such as “SheetRock” and “DuraRock.”
Modern Portland cements come in a wide variety of subcategories, in order to optimize the properties for specific applications and environmental conditions. Discussing these in detail is not one of the purposes of this monograph. The American Society of Testing Materials (ASTM) specifies five distinct types of Portland cement for general use, designated by the Roman numerals I-V. Similar classifications exist in Canada. The chemical reactions, microstructure, and general properties of cement pastes made with Types I-V Portland cement are quite similar,
10

and from this point forward the term “cement” should be understood to mean one of these basic types unless otherwise indicated. These types are called the “ordinary” portland cements, widely abbreviated “OPC”. The primary differences between the various OPC types are the relative proportions of the four main cement minerals and the fineness to which the cement is ground. These factors will be discussed specifically in Chapter 4 when we cover the manufacture of cement. The different formulations of Portland cement exist for two main reasons: to control the rate of early hydration (either to make it faster or slower), and to provide cement suitable for use in locations where the soil and groundwater contain sulfates that can cause a durability problem called sulfate attack. Issues associated with the rate and heat of hydration are discussed in detail in Section 5.6, and sulfate attack is covered in Section 12.3.
2.4.2 Water – the activator in concrete Most people know that water is needed to make concrete, but there is a lot of confusion as
to why. There is a general misconception that the water is added just to start the cement reacting, and that once the concrete is in place the hardening process will be “helped along” by drying it out. Nothing could be further from the truth! Water is an integral part of the reaction products that give cement paste and concrete its strength, and just about the worst thing that can happen to young concrete for it to be dried. In fact, cement paste and concrete will harden and gain strength underwater.
There are two primary reasons that drying is bad for concrete. First, the reactions between cement and water (hydration) continue for many days and weeks after initial mixing. If the water is removed by drying, these reactions stop and the concrete can’t gain any more strength. Second, concrete shrinks when it dries. More specifically, the cement paste component of concrete shrinks, due to its pore system. This shrinkage is related primarily to the surface tension of water, and a similar process is easily observed when a kitchen sponge dries out and shrinks to half its wet size.
Why is shrinkage so bad for concrete? A large section of concrete cannot dry out uniformly - the exposed surface dries out first while the interior remains moist. Due to the tendency for drying to cause shrinkage, the drier surface layer is put into a state of tension, like a stretched rubber band. But concrete cannot stretch like a rubber band, so the tension tends to make it crack. Cracks reduce the strength of concrete, make it less durable by offering easy access to water and corrosive ions, and of course are unsightly. For this reason, good contractors take careful steps to keep the surface of freshly placed concrete moist, often by covering it with plastic or moist burlap. This is particularly important on hot, windy days. Once concrete is older and stronger, it is able to resist the stress of drying without cracking. However, concrete at any age is better off moist than dry. Drying of cement paste, and the associated shrinkage, are an important aspect of the science of concrete and are discussed in Chapter 11.
Another important issue associated with the mix water is the amount that is added in relation to the amount of cement. This important parameter is called the water/cement ratio, or “w/c”, and it always refers to the weights of water and cement. (When the binder phase contains things other than cement it may be abbreviated “w/b”). For the mix design given in the previous section, the w/c is 0.6, which is pretty typical. Although there are many aspects of the concrete mix design and the curing process that affect the final properties of the concrete, the w/c is probably the most important. If the w/c is too low, the concrete will be stiff and clumpy and will be difficult to place. However, the lower the w/c, the stronger and more durable the final
11
concrete. This is easy to understand when one realizes that any space in the fresh concrete that is originally occupied by the mix water will end up as porosity in the hardened concrete. Porosity lowers the intrinsic strength and makes it easier for the concrete to be damaged by drying, freezing weather, and other environmental stresses. For this reason, the w/c should be a low as possible, meaning just high enough so that the concrete can be placed properly. This will depend on many factors, such as the amount, size, and shape of the aggregate (see next section), the fineness of the cement, the type of form or mold the concrete is being placed into, and the type of reinforcement. There are also special chemicals called water-reducers or plasticizers that can be added to the mix that will improve the workability and thus reduce the amount of water needed.
2.4.3 Aggregate – the filler in concrete The focus of this monograph is the chemical reactions and microstructure of cement
paste. We won’t be talking very much about aggregate, which mostly just sits around in the concrete taking up space. The most important properties of concrete are its strength (how much load it can support) and its durability (how long it will last in its environment). To a first approximation, these are both controlled by the cement paste rather than by the aggregate. In the case of strength, this is because the aggregate particles are normally much stronger than the cement paste, so the cement paste fails (breaks) first. A similar situation occurs with durability. Cement paste is inherently more susceptible to environmental damage than the aggregate due to its pore system, which allows water and dissolved ions to enter and leave the paste.
However, there are some ways that the properties of concrete are affected by the aggregate, and these will be discussed in this web site. The workability (consistency) of the fresh concrete, which determines how easy it is to pour and place the concrete, depends on the shape and size distribution of the aggregate particles. The structure of the cement paste in a narrow region surrounding the aggregate particles is more porous than the bulk cement paste, which affects several properties. This region is called the interfacial transition zone (ITZ). Finally, in some cases the aggregate reacts with the cement paste, resulting in cracking, expansion, and deterioration.
2.4.4 Mineral admixtures If you want to make concrete that is as inexpensive and eco-friendly as possible, what
could be better than throwing in sand, gravel and rocks? Well, it would be better to throw in something that is actually a nuisance material in order to get rid of it. Many industrial processes, such as the burning of coal, the manufacture of iron and steel, and even the semiconductor industry, create large amounts of waste byproducts that must be transported away and stored in landfills. So why not put them in concrete instead? Here is the best part: these materials are not just inert fillers, they actually react (hydrate) along with the cement. This means that they don’t replace the aggregate (the particles are generally too fine (small) for that), they replace the cement, which is better. By using less cement in the concrete, the total energy cost and carbon dioxide emissions associated with the concrete are decreased. And, assuming that the cost of the byproduct materials is nominal, there is a cost savings as well. Perhaps best
12
of all, the final properties of the concrete such as its strength and durability are actually better than normal concrete! In Europe, blended cements are almost always used, and the term “Portland cement” actually means a blended cement. In the U.S. the use of admixtures must be specified, and blended cements are less common
Is there a down side to blended cements? Unfortunately, yes. Some byproduct materials work better than others, and none of them react as fast as the cement that they replace. This means that it takes longer for the cement to initially set and harden. The construction industry is a impatient one: time is money on a job site. Contractors want to be able to remove the wooden forms that surround the fresh concrete, or drive their trucks across a newly poured road, as soon as possible, so anything that slows down the early reaction is undesirable. Another issue is cost. Because the beneficial aspects of these admixtures are now well known, the ones that work best, such as silica fume, are now more expensive than cement. The admixtures that are still less expensive (e.g. fly ash) are the ones that react more slowly, or have undesirable contaminants such as sulfur. Mineral admixtures and blended cements are discussed in Chapter 6.
2.4.5 Reinforcement and fibers Concrete is much stronger in compression than it is in tension. What does this mean?
Imagine putting a block of concrete on the floor and then pushing straight down on the top surface. This is compressive loading. Now imagine attaching the block to the ceiling and pulling straight downwards on the bottom surface. This is tensile loading. Measuring the amount of stress (the amount of force divided by the cross-sectional area of the block) needed to break the block in these two situations would give the compressive strength and the tensile strength. You would find that the compressive strength of the block was something like ten times greater than the compressive strength. In fact, to be on the safe side, engineers normally assume that concrete has zero tensile strength!
Why is this? Concrete is a brittle material, and when brittle materials have cracks or other flaws in them these flaws will quickly grow as the material is stretched in tension. Compressive loading does not encourage flaws to grow, and thus they don’t affect the compessive strength very much. If a brittle material does not contain any flaws, it will be approximately as strong in tension as it is in compression. (It is still not a good idea to use brittle materials in tension, though). However, it is virtually impossible to make concrete that does not contain some large flaws such as cracks or air bubbles. So engineers design structures in such a way that the concrete is only expected to support compressive loads. This presents problems however, because horizontal members such as beams are subjected to bending forces. When a beam bends it assumes a slightly curved shape, and the inner part of the curve is put into compression and the outer part of the curve is put into tension.
This brings us to reinforced concrete. In order to allow concrete to support bending loads, steel rods are put inside the concrete in the areas that are expected to be in tension. In most cases the loads are applied downward so this is the lower half of a horizontal member. When the beam bends, the concrete supports the compressive loads and the steel bars support the tensile loads. Steel reinforcement also helps the concrete resist the tensile forces associated with drying shrinkage. We will not talk much about steel reinforcing bars (rebar) in this monograph. Technically the rebar is not part of the concrete, and the correct use of reinforcement is an engineering issue. However, there are some scientific issues associated
13

with rebar. One is corrosion (rusting) of the steel by chloride ions, which diffuse rather easily through the cement paste to reach the internal reinforcement. Chloride ions are primarily associated with de-icing salt put onto roads, but are also present in sea water. The rusting of the steel is an expansive reaction that leads to cracking and weakening of the concrete.
One way to make concrete less brittle and prone to cracking is to add fibers. Because fibers are strong in tension, they help prevent crack growth and stabilize the concrete against shrinkage. They also increase the impact and abrasion resistance of the concrete. They don’t help much with the compressive strength, however. Fiber-reinforced concrete (FRC) is an example of a fiber-reinforced composite, a class of materials that also includes fiberglass and high-performance carbon fiber composites used for aerospace applications and sporting goods. A variety of different types of fibers can be used in concrete, including steel, glass, plastic, and cellulose. Asbestos fibers work very well with concrete but are no longer used because of the health risks associated with processing the fibers.
The two downsides of adding fibers are reduced workability and the cost. FRC is more difficult to mix, pour, and place because the fibers prevent the concrete from flowing easily. Fibers also tend to be expensive compared to the other materials used on concrete. In some cases the improved properties that result from the addition of fibers can be achieved at a lower cost by changing the mix design, for example by using a lower w/c. At present FRC is used primarily for high-wear applications such as pavements and industrial floors, and for specially applications such as repair patches.
2.4.6 Chemical admixtures Chemical admixtures are water-soluble chemicals that are added in relatively small
amounts to concrete in order to change certain properties. Understanding how chemical admixtures work and designing new and improved admixtures is an important aspect of cement research. As with fibers and other engineered materials that may be added to concrete, a major consideration is cost. There is a large and profitable industry devoted to the development and manufacture of chemical admixtures, with profit margins much larger than those for Portland cement, and they are typically sold as proprietary brand-name formulations. Below are some of the more common categories of chemical admixtures. Their mode of action and effect on the properties of cement paste and concrete will be discussed in more detail throughout this monograph.
Accelerators: These are chemicals that increase the rate of early cement hydration so that the cement sets faster. The most common reason for using accelerators is speed up the pace of construction by reducing the time required for the concrete to have some minimum load-bearing capacity. This is particularly helpful in cold weather, when the early rate of hydration can be two or three times slower than in warm weather. Accelerators tend to have a negative effect on the long term strength and other properties, however. A very cheap and effective accelerator is calcium chloride.
Retarders: These are the opposite of accelerators; they slow the rate early hydration. They are used primarily to extend the period of workability of the fresh concrete. This is desirable in a variety of situations. When multiple layers of concrete are being poured on top of each other, it is better that the first layer not set until the last layer is poured. In some cases, the transport of the concrete from the ready-mix plant to the construction site is longer than the normal period of
14

workability. Unlike accelerators, the use of retarders does not tend to harm the long-term properties of the concrete. Sugars (including sucrose, table sugar) is a very cheap and effective retarder.
Air entraining agents: These are chemicals that make the concrete less susceptible to damage caused by freezing of the water in the pores. They promote the formation of very small air bubbles in the concrete during mixing, resulting in a system of approximately spherical voids that are evenly distributed throughout the hardened cement paste. This is called an air-void system, although the voids may also be filled with pore fluid depending on the moisture conditions. When the pore fluid freezes, it expands. The air void system provides extra space for the ice to enter, so that it does not generate large stresses that damage the concrete. Air entraining agents should not adversely affect the strength of concrete because the air voids that are created are smaller than the normal air voids that always form in smaller numbers during mixing. Their use is standard practice in any environment that may experience freezing weather, and they are probably the most commonly used chemical admixture.
Water reducers/plasticizers: These are chemicals that improve the workability of the paste. This allows a lower w/c to be used for a given workability, resulting in higher-quality concrete. These chemicals also tend to have retarding and air-entraining effects as well, which limits the concentrations at which they can be used (and thus their effect). The conventional versions of these chemicals, sometimes called low-range water reducers, allow w/c reductions of 5-15% before excessive retardation and air entrainment occur. Another version of these chemicals, called superplasticizers or high-range water reducers, can be used at higher concentrations and allow larger reductions in w/c of up to 30%. When superplasticizers are used to obtain a very large reduction in w/c, the strength is increased by such a large amount that the concrete is specifically referred to as “high-strength” concrete. If the w/c is not greatly reduced, the result is concrete that is so highly flowable that it requires no mechanical consolidation. In this case the special names “self leveling” or “self consolidating” concrete are used.
2.5 Units and some basic scientific terminology
Since we are going to be exploring the science of cement, we won’t be able to avoid the use of scientific units and some scientific terms. As with the concrete terminology, we will try to define things as we go along but it is useful to get some of the basic stuff out of the way first. If you have a good scientific background you can safely skip or skim this section.
All scientists around the world use the scientific version of the metric system, which is known as SI units (for System of International units). In this system, lengths are given in units based on meters, masses (or weights) are given in units based on kilograms (abbreviated kg), and temperatures are given in units of degrees Kelvin (K) or degrees Celsius (˚C). Although Kelvin is more scientifically correct, we will use the more familiar and user-friendly Celsius units.
Since a meter (abbreviated m) is a huge length compared to most of the things we will be describing, we will use the related units of millimeters (mm), micrometers (µm), and nanometers (nm). Note that micrometers are often shortened to “microns.” There are 1000 mm in 1 m, 1000 µm in 1 mm, and 1000 nm in 1 µm. These uniform relationships make it easy to convert between units. For those of us who are more used to English units, it is useful to remember that there are 25.4 mm in 1 inch. A millimeter is only about the width of the tip of a sharpened pencil. Objects smaller than about 10 micrometers in size cannot be seen with the unaided eye,
15
while at the scale of nanometers one is dealing with objects not much larger than individual atoms. To convert a temperature given in Celsius to a temperature in Fahrenheit (˚F), first multiply by 1.8 and then add 32. For example, 30˚C = 86˚F, 100˚C = 212˚F, and 1400˚C = 2552˚F. Here are some basic scientific terms and concepts we will be using: Microstructure: One of the most common and widely used words in all of science. The precise definition is the structure of a material at the length scale of micrometers. The features at this scale are too small to be seen with the unaided eye, but are still much larger than atoms. However, the word microstructure is sometimes used more loosely to include all structural features of a material that affect its properties except for the chemical bonds between atoms. Nanostructure: As you can probably guess, refers specifically to features at the length scale of nanometers. The C-S-H gel phase of cement paste has a nanostructure that is very important for the properties of concrete. Morphology: The shape of an object, rather than the size. For example, spherical, needle-like, sheet-like, etc. Pore: A small hole, or void, in a solid material. Cement paste is filled with tiny, interconnected pores, where the space occupied by the mix water was not replaced by solid hydration products. This is called the “pore system.” Permeability: A measure of how easily water can move through a pore system. The lower the permeability of concrete, the less it will tend to degrade over time. Element: Every atom belongs to a particular element according to the number of protons in its nucleus. The elements are described and arranged in the Periodic Table of the Elements, familiar to anyone who has taken a chemistry course. While there are over 200 elements, only a small fraction of these are relevant to the study of cement and concrete. These include (but are not limited to) calcium (Ca), silicon (Si), oxygen (O), hydrogen (H), aluminum (Al), iron (Fe), sulfur (S), magnesium (Mg), carbon (C), sodium (Na), and potassium (K). Ion: An atom that has gained or lost at least one electron so that it is no longer electrically neutral. When a solid substance (such as table salt) dissolves in a liquid (such as water), the tightly bound atoms of the solid become ions that are free to roam the liquid. This is what happens when cement is mixed with water. Solution: A liquid containing dissolved ions. After cement and water are mixed, the mix water is sometimes referred to as the “pore solution” because it is filled with ions formerly bound into the cement. (the term “pore” refers to the fact that it exists inside the pore system of hardened paste). Alkalis: A group of chemical elements with similar properties, which includes lithium, sodium, and potassium. The alkalis dissolve very easily, forming small, positively charged ions that can
16

exist in solutions in high concentrations. Cement and cement pore solutions contain high levels of alkalis (sodium and potassium). Mineral: A solid material with a fixed atomic composition. Usually refers to a material that occurs naturally, but is also used to refer to the solid constituents of cement. Phase: This common term is tricky to define accurately. We will describe it as a collection of atoms with a uniform composition and chemical bonding scheme. Each of the cement minerals and hydration products is a phase, as is the pore solution. Exothermic: describes a chemical reaction that releases heat, such as the hydration of cement. Some reactions absorb heat, and are called endothermic. Relative humidity: The amount of moisture (water vapor) in the air, expressed as a percentage of the maximum amount of water vapor the air can hold at the particular temperature. This latter value increases with temperature. 2.6 Cement chemistry notation
To manufacture cement, the raw ingredients are heated to extremely high temperatures in a large oven called a kiln. As a result, all of the elemental constituents of the raw ingredients are either driven off as a gas or react with oxygen in the air to form oxide compounds. (This is covered in more detail in Chapter 4). To make the formulas of cement minerals, compounds, and reactions shorter and easier to read, it is traditional to use a shorthand notation that leaves out the oxygen. This system, called cement chemistry notation, is listed in Table 2.2.
Table 2.2: Cement chemistry notation based on oxides.
Element Oxide form Notation
Calcium CaO C
Silicon SiO2 S
Aluminum Al2O3 A
Iron Fe2O3 F
Sulfur SO3 S
Hydrogen H2O H Note that the abbreviation for the oxide of sulfur has a line over it to distinguish it from that
of silicon. Other abbreviations are also in use, such as MgO=M and Na2O = N, but only those listed above will be used in this web site. While cement chemistry notation has definite advantages, it can also be confusing, since, for example, C normally stands for carbon and H normally stands for hydrogen. To avoid this type of confusion, and to remind you of this notation system, we will put cement chemistry notation in boldface type [vi].
17

Another potential source of confusion is the multiple ways of describing a mineral or chemical compound. As shown in Table 2.3, many common compounds and cement minerals can be described five different ways! The chemical name of a solid compound (column 1) is simply the word version of the chemical formula, for example “calcium hydroxide”. The chemical formula can be written in the traditional format (column 2) or in oxide form (column 3), or in the cement chemistry notation based on oxides (column 4). Finally, there are mineral names (column 5) that often identify a specific crystal structure or an impure form of the phase. So “portlandite” is the slightly impure version of calcium hydroxide that forms in cement paste.
In this web site we will use primarily the chemical name (e.g. calcium hydroxide) and the cement chemistry notation (e.g. CH). In the case of the cement minerals, this is actually a bit inaccurate. Names such as “alite” and “belite” (see Table 2.3) indicate a particular crystal structure as well as the fact that these phases contain a variety of impurities when found in cement.
Table 2.3: Summary of the different ways to represent some cement minerals and products.
Chemical Name Chemical Formula
Oxide Formula Cement Notation
Mineral Name
Tricalcium Silicate Ca3SiO5 3CaO.SiO2 C3S Alite
Dicalcium Silicate Ca2SiO4 2CaO.SiO2 C2S Belite
Tricalcium Aluminate Ca3Al2O6 3CaO.Al2O3 C3A Aluminate
Tetracalcium Aluminoferrite Ca2AlFeO5 4CaO.Al2O3.Fe2O3 C4AF Ferrite
Calcium Hydroxide Ca(OH)2 CaO.H2O CH Portlandite
Calcium Sulfate Dihydrate CaSO4.2H2O CaO.SO3.2H2O C S H2 Gypsum
Calcium Oxide CaO CaO C Lime
18

3 The concrete construction process
3.1 Introduction
The focus of this monograph is the chemistry, microstructure, and properties of cement
and concrete, not the nuts and bolts of how to mix and pour the stuff. However, the majority of concrete is mixed and put into its final form in one continuous process, in contrast to materials like steel which are manufactured first and then assembled later (some concrete, called “precast concrete” is also made this way). For this reason it is not a good idea to completely separate the science of concrete from the more mundane process of making it. No one expects contractors and construction workers to manufacture plate glass, extrude pipe, or press drywall, but they are regularly expected to make good quality concrete.
What follows is a very brief summary of the most common process of making a concrete structure. A good source for more detailed information is the very readable handbook “Design and Control of Concrete Mixtures” published by the Portland Cement Association [vii].
3.2 Designing the concrete mix
The first and most important step in the process is to determine the ingredients that will make up the concrete and their proportions. As should be apparent from the previous section, there are many variables to consider including cement type, aggregate size and type, amount of water, and mineral and chemical admixtures. While a good mix design can still result in inadequate or poor quality concrete if it is not executed correctly, a bad mix design will always give poor results. Who is responsible for designing the mix depends on the type of project. For large, publicly funded projects the responsibility for the final design falls to a licensed civil engineer. For residential projects such as foundations and driveways it is the private contractor, whose professional reputation is generally his only credential.
How does one go about generating an appropriate mix design? This is done by first determining the properties that the fresh and hardened concrete must have and then working backwards to find the most economical mix design that gives these properties. Here are some of the main things to consider:
Loads that must be supported: Concrete can be made with a wide variety of strengths, so this is often the starting place for the mix design. Since the cost of concrete scales rather closely with its strength, one does not want to make the concrete stronger than it needs to be. However, if the application will only be supporting relatively small loads, it is usually not a good idea to specify weak concrete, because weak concrete almost always lacks durability. For low load applications the quality of the concrete is determined by other factors such as the ability to resist freezing or surface wear.
Workability: The workability that is required depends primarily on how the concrete is to be placed. Concrete can be poured, pumped, and even sprayed into place, and this will affect the workability that is needed. Other factors such as the shape of the molds, the rebar spacing, and the equipment available at the site for consolidating the fresh concrete after it is placed must
19

also be considered. Workability is usually defined by the slump, which is the tendency for the fresh concrete to spread out under its own weight when placed onto a flat surface.
Environmental conditions: If the concrete will be exposed to severe conditions, then this may well determine the necessary concrete quality rather than the applied loads. In cold-weather locations the concrete must be able to resist freezing. Roads and must be able to withstand the corrosive effects of salt. Underground applications must be able to resist the ingress of moisture and aggressive species from the soil. For almost any type of conditions or mode of attack, the most effective defense is to keep the w/c low.
Surface wear: For some applications the physical loads tend to wear away the concrete instead of breaking it. For roads, parking garages, driveways, and industrial floors the hardness and wear resistance of the top layer of concrete will determine how long the structure lasts.
3.3 From batching to curing - how concrete is made 3.3.1.1 The ready-mix (batching) plant
Most concrete is batched and mixed in a central location called a ready-mix plant and then trucked to the desired location (see Figure 3-1). This is often the best solution even for fairly small jobs. Ready-mix plants have a wide variety of aggregate and cement that are stored under controlled conditions, as well as good equipment for weighing and mixing. As a result, the quality of the concrete should be high and consistent. Concrete mixing trucks can be used to transport already-mixed concrete, or the mixing can actually be performed by the truck as it is traveling to the site. One potential disadvantage of ready-mixed concrete is that the time required to transport the concrete to the site may use up too much of the early period of good workability. This can generally be handled through the use of retarding admixtures.
Figure 3-1: Left: A ready-mix plant surrounded by piles of stored aggregate (40-4A). Right: A concrete truck being filled with fresh premixed concrete. (Images courtesy of the Portland Cement Association).
20

3.3.1.2 Mixing
Mixing of concrete is a very important step for achieving good final properties, and one that can be quite difficult without the right equipment. This is one of the best reasons for using ready-mixed concrete. Mixing distributes the aggregate evenly throughout the cement paste, ensures that all of the cement has been fully saturated in water, and removes large air voids. In addition, mixing breaks up agglomerated clusters of cement particles and allows air entraining admixtures to generate the correct air void system. Undermixing leaves large flaws and thus results in inferior strength, while overmixing wastes time and energy and can destroy entrained air voids. The lower the workability, the more mixing energy and mixing time is required.
3.3.1.3 Placing
Once the concrete has been adequately mixed, it must be placed into the formwork that defines its final shape. If the concrete is to be reinforced, the rebar must already be in place so the concrete can flow around it (see Figure 3-2).
Figure 3-2: Fresh concrete being poured into a framework containing steel rebar. (Image courtesy of the Portland Cement Association).
If the concrete mixing truck can be located close to (and higher than) the site, then the
concrete can be poured directly into the forms. In cases where this is not possible, the concrete can be transferred in buckets by a crane or by wheelbarrow. When this is impractical due to the distance required or the size of the job, the fresh concrete can be pumped through a system of pipes or hoses to the site by special concrete pumps. Concrete that is to be pumped has more stringent requirements for workability. If the concrete is too dry, it will not pump well, while if it is too wet it will tend to segregate. Segregation can also occur if the concrete falls into the formwork too quickly, as larger aggregate particles will tend to be driven downward.
21

3.3.1.4 Consolidation
Once the concrete is in place, it should be consolidated to remove large air voids developed during placement and to make sure that the concrete has flowed into all of the corners and nooks of the formwork. This process is also called compacting. Overconsolidation can lead to segregation and bleeding, but underconsolidation is more common, resulting in less-than optimal properties. The two most common methods of consolidation are vibration and roller compacting. Vibration is a mechanical process that transfers pulses of shear energy to the concrete, usually by a probe that is inserted several inches into the concrete. Each pulse of shear energy momentarily liquefies the concrete, allowing it to flow very freely. Air bubbles that are trapped in the concrete move upwards and can be seen “popping” out at the surface. This is the standard consolidating method for general construction projects with the exception of roads. The shear energy will only travel through a limited thickness of concrete, so when a thick concrete structures is being placed the fresh concrete is poured in layers, with each layer consolidated before the next is poured over it. Vibration is a noisy and labor-intensive step, requiring expensive and specialized equipment. For this reason, there is growing use of self-consolidating concrete which flows so freely (through the use of chemical admixtures) that mechanical consolidation is not needed (This is discussed in Chapter 13).
Roller compaction is a simpler and more cost-effective technique that is suitable for roads and very large mass concrete structures such as dams. A specialized vehicle with a heavy roller on the front (a familiar sight in roadside construction zones) is driven over the fresh concrete to drive it into place and remove excess air. The fresh concrete used is very stiff so that it can support the weight of the machine as it passes over.
3.3.1.5 Finishing
For concrete floors and pavements, the appearance, smoothness, and durability of the surface is particularly important. Finishing refers to any final treatment of the concrete surface after it has been consolidated to achieve the desired properties. This can be as simple as pushing a wide blade over the fresh concrete surface to make it flat (screeding). Floating and troweling is a process of compacting and smoothing the surface which is performed as the concrete is starting to harden – this is a standard finishing procedure for driveways and sidewalks. After concrete has hardened, mechanical finishing can be used to roughen the surface to make it less slippery or to polish the surface as a decorative step to bring out the beauty of a special aggregate such as marble chips. A recently developed process which is growing in popularity involves the use concrete dyes and surface molds to emulate the appearance of bricks, decorative pavers, or even ceramic tile. When done properly this type of decorative concrete is almost indistinguishable from the real thing.
3.3.1.6 Curing
Once concrete has been placed and consolidated it must be allowed to cure properly to develop good final properties. As the concrete hardens and gains strength it becomes less and less vulnerable, so the critical time period is the first hours and days after it is placed. Proper curing of concrete generally comes down to two factors, keeping it moist and keeping it supported. Hydration of cement, as the word itself implies, involves reaction with water. To cure properly, the internal porosity of cement paste must be fully saturated. If the relative humidity level inside the concrete drops to near 90% the hydration reactions will slow, and by
22

80% they will stop altogether. Not only will this prevent the concrete from gaining its full strength, but it will also generate internal stresses that can cause cracking. To keep young concrete moist, it can be covered with plastic or damp fabric to prevent evaporation, or sprayed periodically with water. Spraying is particularly helpful when the w/c of the concrete is low, because the original mix water is not enough for the cement to hydrate fully. The additional water will not penetrate through a thick concrete structure, but it will help create a stronger surface layer. Pools of water should not be allowed to form on the surface, however, as this will leach and degrade the concrete underneath.
When concrete is placed using formwork, there is generally a desire to remove the formwork as quickly as possible to continue the construction process. However, if this is done too soon the fresh concrete will deform under its own weight. This will lead to a loss of dimensional tolerances, cracking, or even a complete collapse. Similar problems occur if loads are applied to the surface of a floor or slab too early.
The weather plays an important role in the curing process. Hot windy weather leads to rapid evaporation and thus particular care must be taken to keep the concrete moist. Cold weather causes the concrete to harden much more slowly than hot weather. This delays the construction process, but leads to better concrete in the long run, because the hydration products develop differently at different temperatures. If fresh concrete freezes, however, it will likely be damaged beyond repair.
23

4 Manufacture and composition of Portland cement
4.1 Introduction
This chapter starts with a description of how Portland cement is manufactured, and discusses the resulting properties of the cement, including the composition and structure of the four main cement minerals, the composition of various types of Portland cement, and the particle size distribution (fineness) of cement. At the end of the chapter there are some additional optional topics.
4.2 Raw materials for cement manufacture
The first step in the manufacture of Portland cement is to combine a variety of raw ingredients so that the resulting cement will have the correct chemical composition. These ingredients are ground into small particles to make them more reactive, blended together, and then the resulting powder, called the raw mix, is fed into a cement kiln which heats its to extremely high temperatures.
Since the final composition and properties of Portland cement are specified within rather strict bounds, it might be supposed that the requirements for the raw mix would be similarly strict. As it turns out, this is not the case. While it is critical to have the correct proportions of calcium, silicon, aluminum, and iron, the overall chemical composition and structure of the individual raw ingredients can vary considerably. The reason for this is that at the very high temperatures present inside the kiln, many chemical components in the raw ingredients simply burn off and disappear. Table 4.1 lists just some of the many possible raw ingredients that can be used to provide each of the main cement elements.
Table 4.1: Examples of raw materials for Portland cement manufacture (adapted from ref. [viii], Table 2.1). The headings indicate the main cement element that is supplied.
Calcium Silicon Aluminum Iron
Limestone Clay Clay Clay
Marl Marl Shale Iron ore
Calcite Sand Fly ash Mill scale
Aragonite Shale Aluminum ore refuse Shale
Shale Fly ash Blast furnace dust
Sea Shells Rice hull ash
Cement kiln dust Slag
24

The ingredients listed above include both naturally occurring materials, such as limestone and clay, and industrial byproduct materials, such as slag and fly ash. From Table 4.1 it may seem as if just about any material that contains one of the main cement elements can be tossed into the kiln, but this is not quite true. Materials that contain more than minor (or in some cases trace) amounts of metallic elements such as magnesium, sodium, potassium, strontium, and various heavy metals cannot be used, as these will not burn off in the kiln and will negatively affect the cement. Another consideration is the reactivity, which is a function of both the chemical structure and the fineness. For example, quartz is a readily available mineral that contains silicon, but it is rarely used because it is unreactive even at the maximum kiln temperature. Clays are ideal because they already consist of small particles and thus need little processing prior to use, and are the most common source of silica and alumina. Calcium is most often obtained from quarried rock, particularly limestone (calcium carbonate), which must be crushed and ground before entering the kiln.
Grinding and blending prior to entering the kiln can be performed with water added to the raw ingredients to form a slurry (the wet process) or with the ingredients in dry form (the dry process). The addition of water facilitates grinding. However, the water must then be removed by evaporation as the first step in the burning process, which requires additional energy. The wet process, which was once standard, has now been rendered obsolete by the development of efficient dry grinding equipment, and all modern cement plants use the dry process. When it is ready to enter the kiln, the dry raw mix has 85% of the particles less than 90 µm in size [ix].
4.3 Burning in a kiln – formation of cement clinker
The rotary cement kiln The key step in the cement manufacturing process is to heat the blended mixture of raw
ingredients (the raw mix) so that its chemical constituents react with each other and with oxygen from the air to form the cement minerals that make up Portland cement. This step, called “burning,” requires maximum temperatures that are high enough to partially melt the raw mix. Burning converts the raw mix into a granular material called cement clinker. Because the raw mix does not completely melt, it must be agitated as it is burned to ensure that the clinker forms with a uniform composition. This is accomplished by using a long cylindrical kiln that slopes downward and rotates slowly (see Figure 4-1).
Figure 4-1: Artist’s rendering of a rotary kiln for cement manufacture. (Image courtesy of the Portland Cement Association (14079)).
To heat the kiln, a mixture of fuel and air is injected into the kiln and ignited at the bottom
end (see Figure 4-2). The hot gases travel up the kiln to the top, through a dust collector, and out a smokestack. A variety of fuels can be used, including pulverized coal or coke, natural gas, lignite, and fuel oil. These fuels create varying types and amounts of ash as they burn, which tend to have compositions similar to some of the aluminosilicate ingredients in the raw mix. Since the ash combines with the raw mix inside the kiln, this must be taken into account in order to correctly predict the resulting cement composition. There is also an increasing trend of using combustible waste products as part of the fuel, for example old tires. In the best-case scenario,
25

this saves money on fuel, reduces carbon dioxide emissions, and provides a safe method of disposal.
4.3.1.1 The burning process
The description in this section refers to a standard dry-process kiln as illustrated in Figure 4-2. Such a kiln is typically about 180 m long and 6 m in diameter, has a downward slope of 3-4%, and rotates at 1-2 revolutions per minute. The temperature varies considerably along it length, decreasing with distance away from the fuel source.
(After Mindess and Young, Fig. 3.2)
Figure 4-2: Diagram of the reactions occurring in a typical dry process cement kiln without a preheater.
The raw mix enters at the upper end of the kiln and slowly works its way downward to the
hottest area at the bottom over a period of 60-90 minutes, undergoing several different reactions as the temperature increases. It is important that the mix move slowly enough to allow each reaction to be completed at the appropriate temperature. Because the initial reactions are endothermic (energy absorbing), it is difficult to heat the mix up to a higher temperature until the lower-temperature reactions are complete. The general reaction zones (see Figure 4-2) are as follows:
Dehydration zone (up to ~ 450˚C): This is simply the evaporation and removal of the free water. Even in the “dry process” there is some adsorbed moisture in the raw mix. Although the temperatures required to do this are not high, this requires significant time and energy. In the wet process, the dehydration zone would require up to half the length of the kiln, while the dry process requires a somewhat shorter distance.
Calcination zone (450˚C – 900˚C): The term “calcination” refers to the process of decomposing a solid material so that one of its constituents is driven off as a gas. At about 600˚C the bound water is driven out of the clays, and by 900˚C the calcium carbonate is decomposed, releasing carbon dioxide. By the end of the calcination zone, the mix consists of oxides of the four main (C, S, A, and F) that are ready to undergo further reaction into cement minerals. Because calcination does not involve melting, the mix is still a free-flowing powder at this point.
Solid-state reaction zone (900˚ - 1300˚C): This zone slightly overlaps, and is sometimes included with, the calcination zone. As the temperature continues to increase above ~ 900˚C there is still no melting, but reactions between different oxidized components of the raw mix begin to occur. Calcium oxide (C) and reactive silicon dioxide (S) combine to form small crystals of C2S (dicalcium silicate), one of the four main cement minerals. In addition, intermediate calcium aluminates and calcium ferrite compounds form. These play an important role in the clinkering process as fluxing agents, in that they melt at a relatively low temperature of ~ 1300˚C, allowing a significant increase in the rate of reaction. Without these fluxing agents, the formation of the calcium silicate cement minerals would be slow and difficult. In fact, the primary reason that Portland cements contain aluminum and iron at all is their role as fluxing agents: the final aluminum- and iron-containing cement minerals (C3A and C4AF) in a Portland
26

cement contribute little to the final properties. As the mix passes through the solid-state reaction zone it becomes “sticky” due to the tendency for adjacent particles to fuse together.
Clinkering zone (1300˚C – 1550˚C): This is the hottest zone where the formation of the most important cement mineral, C3S (tricalcium silicate), occurs. The clinkering zone begins as soon as the intermediate calcium aluminate and ferrite phases melt. The presence of the melt phase causes the mix to agglomerate (clump together) into relatively large nodules about the size of marbles, consisting of many small solid particles bound together by a thin layer of liquid (see Figure 4-3). Inside the liquid phase, C3S forms by reaction between C2S crystals and calcium oxide. Crystals of solid C3S grow within the liquid, while crystals of C2S formed earlier decrease in number but grow in size. The clinkering process is complete when all of the S is in the C3S and C2S crystals and the amount of unreacted C (known as “free lime”) is reduced to a minimal level (<1%).
Figure 4-3: A nodule in the clinkering zone.
Cooling zone: As the clinker moves past the heat source at the bottom of the kiln the temperature drops rapidly and the liquid phase solidifies, forming the other two cement minerals C3A (tricalcium aluminate) and C4AF (tetracalcium aluminoferrite). In addition, alkalis (primarily potassium) and sulfate dissolved in the liquid combine to form the alkali sulfate compounds K2SO4 and Na2SO4. The nodules formed in the clinkering zone become fully solid, and the resulting product is called cement clinker (see Figure 4-4). The rate of cooling from the maximum temperature down to about 1100˚C is important, because it actually affects the composition properties of the resulting solid phases. In general, rapid cooling gives a more reactive cement, which desirable. It is thus typical to blow air or spray water onto the clinker to cool it more rapidly as it exits the kiln.
Figure 4-4: Nodules of Portland cement clinker after cooling (Image courtesy of the Portland Cement Association (12434)).
4.3.1.2 Suspension preheaters and calciners
As mentioned previously, the chemical reactions that occur in the dehydration and calcination zones are endothermic, meaning that a continuous input of energy to each of the particles of the raw mix is required to complete the reaction. When the raw mix is piled up inside a standard rotary kiln, the rate of reaction is limited by the rate at which heat can be transferred into a large mass of particles. To make this process more efficient, suspension preheaters are used in modern cement plants to replace the cooler upper end of the rotary kiln (see Figure 4-5). Raw mix is fed in at the top, while hot gas from the kiln heater enters at the bottom. As the hot gas moves upward it creates circulating “cyclones” that separate the mix particles as they settle down from above. This greatly increases the rate of heating, allowing
27

individual particles of raw mix to be dehydrated and partially calcined within a period of less than a minute.
Alternatively, some of the fuel can be burned directly within the preheater to provide even more heating to the suspended particles. The area of the preheater where fuel is burned is called a precalciner. With a precalciner, the particles are nearly completely calcined as they enter the rotary kiln. Preheaters and precalciners save on fuel and increase the rate at which the mix can travel through the kiln.
Figure 4-5: Suspension preheater/precalciner at a cement plant in Texas. (Image courtesy of the Portland Cement Association (14884)).
4.4 The fineness and particle size distribution of Portland cement
Once the nodules of cement clinker have cooled, they are ground back into a fine powder in a large grinding mill. The resulting cement particles have a variety of angular shapes, and a wide range of sizes (see Figure 4-6 below). Most of the individual cement particles will contain regions of each of the four main cement minerals. As the clinker is ground, a small amount of calcium sulfate such as the mineral gypsum (calcium sulfate dihydrate) is blended into the cement. The calcium sulfate is added to control the rate of early reaction of the cement, as will be discussed in Section 5.3.
At this point the manufacturing process is complete and the cement is ready to be bagged or transported in bulk away from the plant. In practice, the cement is usually stored in large silos at the cement plant for a while so that various batches of cement can be blended together to even out small variations in composition that occur over time. Cement manufacturers go to considerable lengths to maintain consistent behavior in their products over time, with the most important parameters being the time to set, the early strength development, and the workability at a given water content.
Figure 4-6: SEM micrograph of a Portland cement showing the wide range of particle sizes and shapes (Image courtesy of the Portland Cement Association (12459)).
The size of a cement particle has an important effect on the rate at which it will hydrate
when exposed to water. As it reacts, a layer of hydration product forms around the outside of the particle, separating the unreacted core of the particle from the surrounding water. As this layer grows thicker, the rate of hydration slows down. Therefore, a small particle will react much more quickly than a large particle. A particle that has a diameter of 1 µm will react completely in about 1 day, whereas a particle with a diameter of 10 µm will react completely in about 1 month. Particles larger than about 50 µm will probably never become fully reacted, even if there is a sufficient source of water. Clearly, the particle size distribution is critical for controlling the rate at which a cement sets and gains strength. There must be a certain amount of small particles to
28
ensure that the cement sets in a reasonable amount of time, but if there are too many small particles the cement will set too quickly, leaving no time for mixing and placing. Fortunately, the grinding process has a natural tendency to produce a wide range of particle sizes, so this is not a problem.
Figure 4-7 shows the particle size distribution for a typical Portland cement. About 10 wt% of the cement is made of particles larger than 50 µm, and only a few wt% is particles larger than 90 µm. On the fine end, less than 10% of the cement is particles smaller than 2 µm. Such a distribution is traditionally measured by a sedimentation process, in which the size of the particles is determined from the rate at which they sink in a column of liquid. A faster and more precise method is laser particle analysis. A small amount of powder is dispersed in a solvent such as methanol and then pumped through a clear tube in front of a laser. The particle size distribution is calculated from the diffraction pattern generated by the scattering of the laser light off of the particles.
Figure 4-7: The particle size distribution of a typical Portland cement. Left: the cumulative distribution, where the y axis value is the wt% of the particles that are smaller than the x-axis value. Right: a histogram showing the wt% of particles in different size ranges.
The average particle size, defined as the size for which 50 wt% of the cement consists of
larger particles, is sometimes used to characterize the overall fineness of the cement (in Figure the average particle size is ). However, this is only one aspect of the particle size distribution, the other being its breadth. If two cements have the same average particle size but different distributions, the cement with the broader distribution will have more fine particles and thus will exhibit a faster rate of early hydration.
A better parameter for describing the fineness of the cement (at least in terms of knowing how reactive it will be at early times) is the specific surface area, because most of the surface area comes from the smallest particles. The most common method for characterizing the surface area of a cement is the Blaine air permeability test, which is described by an ASTM standard [x]. This test is based on the fact that the rate at which air can pass through a porous bed of particles under a given pressure gradient is a function of the surface area of the powder. A chamber of known cross sectional area and volume is filled with a known mass of cement, and then the time required to pass a known volume of air through the powder is measured. While the surface area can in theory be calculated explicitly from this data, in practice the surface area is determined through an empirical equation developed by measuring powders of a known surface area using the same instrument. The resulting value, called the Blaine fineness, is today expressed in units of m2/kg, although in previous times it was expressed in cm2/g. The Blaine fineness of OPC usually ranges from 300 – 500 m2/kg (3000 – 5000 cm2/g).
It should be noted that the specific surface area is a notoriously difficult parameter to pin down because most materials have features at many different length scales, so that the more sensitive the measurement, the more surface area will be found. Thus different measuring techniques give different values. When the surface area of a cement is measured using gas sorption, a technique that measures how many gas molecules can fit on the surface of a solid, the resulting value is 2-3 times higher than the Blaine value [ix]. This occurs because the cement particles have a rough, irregular surface with internal cracks and pores.
29

The specific surface area of a hydrated cement paste is much higher than that of the dry cement powder, because the main hydration product, the C-S-H gel, has a system of very small (in fact, nanometer-scale) internal pores. This extremely important aspect of the microstructure of cement paste will be discussed in detail in Chapter 7. As a final note, the specific surface area of a cement powder tells little about the size of the largest particles or the breadth of the particle size distribution. These parameters affect the workability of the cement at a given water/cement ratio and the degree of hydration and strength development over long periods of time, among other factors. No single parameter can substitute for a full particle size distribution.
4.5 Environmental issues in cement manufacturing
4.5.1.1 Cement kiln dust
As the hot kiln gas moves through the kiln, it carries with it the smallest particles of the raw mix as well as volatilized inorganic substances such as alkalis (sodium and potassium) and chlorides. As the gas cools, the volatiles condense back round the small particles, and the resulting powder is called cement kiln dust (CKD). In the old days, the CKD was simply vented out of the smokestack, after which it would continuously settle out of the air to create a thin coating of grey dust on the surrounding countryside. This is no longer allowed. In fact, environmental restrictions even prevent CKD from being buried in landfills because of the tendency for the alkalis and chlorides to leach into groundwater. In modern cement plants, the CKD is removed in the suspension preheater and by and electrostatic precipitators located near the base of the smokestack.
Approximately 30 million tons of CKD are produced worldwide each year [xi], and finding a way to use or dispose of this material has become a rather urgent problem for the cement industry (See Figure 4-8).
Figure 4-8: A compacted field of cement kiln dust (CKD) outside a cement plant. (Image courtesy of the Portland Cement Association (12561)).
Some CKD can be returned to the kiln as raw mix, but this is limited by the tendency for
the recycled CKD to increase the alkali and chloride contents of the cement clinker to unacceptable levels. High alkali contents can promote deleterious reactions with aggregate particles that damage the concrete, while chloride ions corrode reinforcing steel. Up to 15% of the total input of raw mix can be lost as CKD.
Because CKD contains a high proportion of soluble alkali chlorides and sulfates, an obvious use is as an activator for blended cements, pozzolans, and hydraulic slags. At present, the drawbacks of CKD as a cement additive seem to outweigh the advantages, although research in this area is ongoing. This is expanded a bit in the optional Section 4.9 at the end of this chapter.
The release of carbon dioxide gas during cement manufacture
The manufacture of Portland cement generates large amounts of carbon dioxide (CO2) gas. This is due both to the decomposition of carbon-containing minerals in the raw mix, such
30

as limestone (calcium carbonate), and also to the burning of the fuel used to heat the kiln. Although carbon dioxide is a non-toxic gas that exists naturally in the atmosphere, recent increases in the atmospheric concentration of CO2 are considered the main cause of the global warming trend that has been observed over the past few decades, and which is predicted to cause changes to global weather patterns and sea levels throughout the 21st century. Why are CO2 levels increasing? Millions of years ago the amount of CO2 in the air was much higher than it is today. Much of that CO2 was gradually removed from the air as it was used to form plants and animals. Over time this biomass was gradually turned into hydrocarbons such as oil and rocks such as limestone. Today, the burning of fossil fuels and other man-made industrial processes are rapidly returning the trapped CO2 back into the atmosphere.
According to one estimate [xii], Portland cement manufacture is responsible for 5% of the man-made release of CO2. While this is significantly less than other sources such as vehicle engines and electricity generation, it is high enough to put economic and political pressure on the cement industry. Over the past three decades, the development of more advanced manufacturing technologies, such as the suspension preheaters discussed earlier, have cut the amount of energy required to make a ton of cement clinker in half, resulting in a similar reduction in CO2 emissions. Much of this modernization was actually prompted by the energy crisis of the 1970s rather than by worries over global warming, but the trend toward modern, efficient plants can be expected to continue.
One way to reduce the emission of CO2 is to use less Portland cement in concrete, by replacing some of the cement with mineral admixtures generated as byproduct materials of other industrial processes. This is discussed in detail in Chapter 6. This strategy is so successful that at present almost all of the good-quality byproduct materials, such as blast furnace slag and silica fume, are used for this purpose already.
4.6 Properties of the major cement minerals
About 90-95% of a Portland cement is comprised of the four main cement minerals, which are C3S, C2S, C3A, and C4AF, with the remainder consisting of calcium sulfate, alkali sulfates, unreacted (free) C, MgO, and other minor constituents left over from the clinkering and grinding steps. The four cement minerals play very different roles in the hydration process that converts the dry cement into hardened cement paste. The C3S and the C2S contribute virtually all of the beneficial properties by generating the main hydration product, C-S-H gel. However, the C3S hydrates much more quickly than the C2S and thus is responsible for the early strength development. The C3A and C4AF minerals also hydrate, but the products that are formed contribute little to the properties of the cement paste. As was discussed in the previous section, these minerals are present because pure calcium silicate cements would be virtually impossible to produce economically.
The crystal structures of the cement minerals are quite complex, and since these structures do not play an important role in the properties of cement paste and concrete we will only present the most important features here. More detailed information can be found in the book by Taylor [ix]. The hydration reactions of the cement minerals are covered in Section 5.3.
31
4.6.1.1 Tricalcium Silicate (C3S)
C3S is the most abundant mineral in Portland cement, occupying 40–70 wt% of the cement, and it is also the most important. The hydration of C3S gives cement paste most of its strength, particularly at early times.
Pure C3S can form with three different crystal structures. At temperatures below 980˚C the equilibrium structure is triclinic. At temperatures between 980˚C – 1070˚C the structure is monoclinic, and above 1070˚C it is rhombohedral. In addition, the triclinic and monoclinic structures each have three slightly different versions, called polymorphs, so there are a total of seven possible structures. However, all of these structures are rather similar and there are no significant differences in the reactivity. The most important feature of the C3S structure is an awkward and asymmetric packing of the calcium and oxygen ions that leaves large “holes” in the crystal lattice. Essentially, the ions do not fit together very well, causing the crystal structure to have a high internal energy. As a result, C3S highly reactive.
The C3S that forms in a cement clinker contains about 3-4% of oxides other than C and S. Strictly speaking, this mineral should therefore be called alite rather than C3S. However, to avoid confusion we will continue to call it C3S. In a typical clinker the C3S would contain about 1 wt% each of MgO, A, and F, along with much smaller amounts of Na2O, K2O, P2O5, and S [ix]. These amounts can vary considerably with the composition of the raw materials used to make the cement, however. Of the three major impurities, Mg and Fe replace Ca, while Al replaces Si.
One effect of the impurities is to “stabilize” the monoclinic structure, meaning that the structural transformation from monoclinic to triclinic that would normally occur on cooling is prevented. Most cements thus contain one of the monoclinic polymorphs of C3S.
4.6.1.2 Dicalcium Silicate (C2S)
As with C3S, C2S can form with a variety of different structures. There is a high temperature α structure with three polymorphs, a β structure in that is in equilibrium at intermediate temperatures, and a low temperature γ structure. An important aspect of C2S is that γ-C2S has a very stable crystal structure that is completely unreactive in water. Fortunately, the β structure is easily stabilized by the other oxide components of the clinker and thus the γ form is never present in Portland cement. The crystal structure of β−C2S is irregular, but considerably less so than that of C3S, and this accounts for the lower reactivity of C2S. The C2S in cement contains slightly higher levels of impurities than C3S. According to Taylor [ix], the overall substitution of oxides is 4-6%, with significant amounts of A, F, and K2O.
4.6.1.3 Tricalcium Aluminate (C3A)
Tricalcium aluminate (C3A) comprises anywhere from zero to 14% of a Portland cement. Like C3S, it is highly reactive, releasing a significant amount of exothermic heat during the early hydration period. Unfortunately, the hydration products of formed from C3A contribute little to the strength or other engineering properties of cement paste. In certain environmental conditions (i.e., the presence of sulfate ions), C3A and its products can actually harm the concrete by participating in expansive reactions that lead to stress and cracking.
Pure C3A forms only with a cubic crystal structure. The structure is characterized by Ca+2 atoms and rings of six AlO4 tetrahedra. As with C3S, the bonds are distorted from their equilibrium positions, leading to a high internal energy and thus a high reactivity. Significant
32

amounts of C and the A in the C3A structure can be replaced by other oxides, and at high levels of substitution this can lead to other crystal structures. The C3A in Portland cement clinker, which typically contains about 13% oxide substitution, is primarily cubic, with smaller amounts of orthorhombic C3A. The C3A and C4AF minerals form by simultaneous precipitation as the liquid phase formed during the clinkering process cools, and thus they are closely intermixed. This makes it difficult to ascertain the exact compositions of the two phases. The cubic form generally contains ~4% substitution of S, ~5% substitution of F, and about 1% each of Na2O, K2O, and MgO. The orthorhombic form has similar levels, but with a greater (~5%) substitution of K2O.
4.6.1.4 Tetracalcium Aluminoferrite (C4AF)
A stable compound with any composition between C2A and C2F can be formed, and the cement mineral termed C4AF is an approximation that simply the represents the midpoint of this compositional series. The crystal structure is complex, and is believed to be related to that of the mineral perovskite. The actual composition of C4AF in cement clinker is generally higher in aluminum than in iron, and there is considerable substitution of S and MgO. Taylor [ix] reports a typical composition (in normal chemical notation) to be Ca2AlFe0.6Mg0.2Si0.15Ti0.5O5. However, the composition will vary somewhat depending on the overall composition of the cement clinker. C4AF is the least reactive of the cement minerals and thus its influence on the properties of cement and concrete is relatively low. 4.7 The oxide and mineral composition of Portland cement
When considering the composition of a Portland cement, the most important factors are the relative amounts of each of the cement minerals, the amount of calcium sulfate, and the total amount of alkalis (Na and K). However, when performing a direct chemical analysis of the cement, what is actually determined is the relative concentrations of each of the elements in the cement. These values are then converted to the weight fraction of each element in oxide form, since the cement always contains an amount of oxygen sufficient to charge balance the other elements. This, along with a few other measurements, is then reported as the oxide composition of the cement (see Table 4.2). It should be noted that only a very small fraction of a cement consists of independent oxides of the form shown in Table 4.2.
Table 4.2. Oxide composition of a Portland cement. Ranges in column 2 are for OPC Types I-V, as given in ref. [viii]. Values in column 3 are averaged results from 125 laboratories, from a study conducted by the Cement and Concrete Research Laboratory (CCRL) at NIST in 2000 (proficiency cement #135).
Oxide Range (wt%)
Cement #135 (wt%)
C 60.2 – 66.3 63.81
S 18.6 – 23.4 21.45
33

A 2.4 – 6.3 4.45
F 1.3 – 6.1 3.07
MgO 0.6 – 4.8 2.42
P2O5 -- 0.11
TiO2 -- 0.22
Na2O 0.20
K2O
0.05 – 1.20
(Na2O equiv) 0.83
S 1.7 – 4.6 2.46
Loss on Ignition -- 0.81
Insoluble residue -- 0.16
Free CaO -- 0.64
The loss on ignition reported in Table 4.2 is the weight lost when the cement was heated
to 1000˚C. At this temperature any water or CO2 present in the cement specimen is driven off. The insoluble residue is the mass of material that is not dissolved in a strong acid. This material generally consists of mineral crystals such as quartz, and a rule of thumb used by cement chemists is that the insoluble reside is 2/3 S and 1/3 A. The free C (often called the “free lime”) is the amount of mineral calcium oxide present, that is, not bound into the cement minerals. The free C is already counted in the weight fraction of C, so the total amount of cement mass accounted for in Table is the sum of all the rows except for the last, which is 99.9%. The remaining 0.1% is likely in the form of other trace elements that were not tested for.
As was noted above, the mineral composition of the cement is more useful than the oxide composition. However, the mineral composition is more difficult to determine accurately. The options are to measure the mineral composition directly using techniques such as light microscopy, powder X-ray diffraction, or SEM X-ray analysis, or to estimate it by performing a calculation based on the oxide composition. According to a summary by Taylor [ix], powder XRD analysis is difficult because of the dominance of the C3S peaks and the extensive amount of peak overlap, and accurate results are obtained only when very careful procedures and analysis are followed. Microscopy, which involves a point-count method, tends to be operator dependent and unreliable for separating the C3A and C4AF phases, not to mention time consuming.
Probably the best experimental method for directly measuring the mineral composition of cement is quantitative scanning electron microscope (SEM) imaging [xiii,xiv]. With this method, the cement is dispersed in a hardened resin which is then polished to evenly expose all of the minerals within the cement particles. The SEM is focused on the specimen at a relatively low magnification (250-500X), and then an automated program scans over the selected image taking thousands of s-ray measurements in a regular grid pattern. The result is a set of “dot map” images representing the intensity of the x-ray signal for each of elements of interest (typically Ca, Si, Al, Fe, S, K, and Mg). A computer program then determines which mineral (if any) is present at each pixel from the relative elemental intensities at that location. An added
34

advantage of this technique is that the mineral information can be combined with the original SEM backscattered image to create a color-coded image of the cement showing the distribution of minerals (see Figure 4-9). Such an image is particularly useful as a realistic starting microstructure for a digital model of cement hydration [xiii].
QuickTime™ and aTIFF (Uncompressed) decompressor
are needed to see this picture.
Figure 4-9: SEM/X-ray image of a Portland cement with each solid phase assigned a different color. Image is 256 µm by 200 µm. Colors correspond to the following phases: red-C3S, aqua-C2S, green-C3A, orange-C4AF, pale green-calcium sulfates, yellow-K2SO4, and white-free C. Image taken from ref. [xiii].
Because this technique requires a significant amount of time on a good-quality SEM
instrument, it is clearly not ideal for routine analysis. Although not as accurate as a careful experimental measurement, the most attractive option in terms of time and expense is to calculate the mineral composition from the measured oxide composition. This is discussed below.
4.7.1.1 The Bogue calculation of cement mineral composition
A simple estimate of the phase composition of a Portland cement can be obtained from the oxide composition if one assumes that the four main cement minerals occur in their pure form (i.e. no impurities). With this assumption, all of the F is assigned to C4AF and the remaining A is assigned to C3A. This leaves a set of two linear equations to be solved for the amounts of C2S and C3S. This method is named after the cement chemist R.H. Bogue. A standardized version of this simple method is given in ASTM C 150 [xv]. There are two sets of equations, based on the ratio of A/F in the cement (both inputs and outputs are in weight percent):
If A/F > 0.64
35
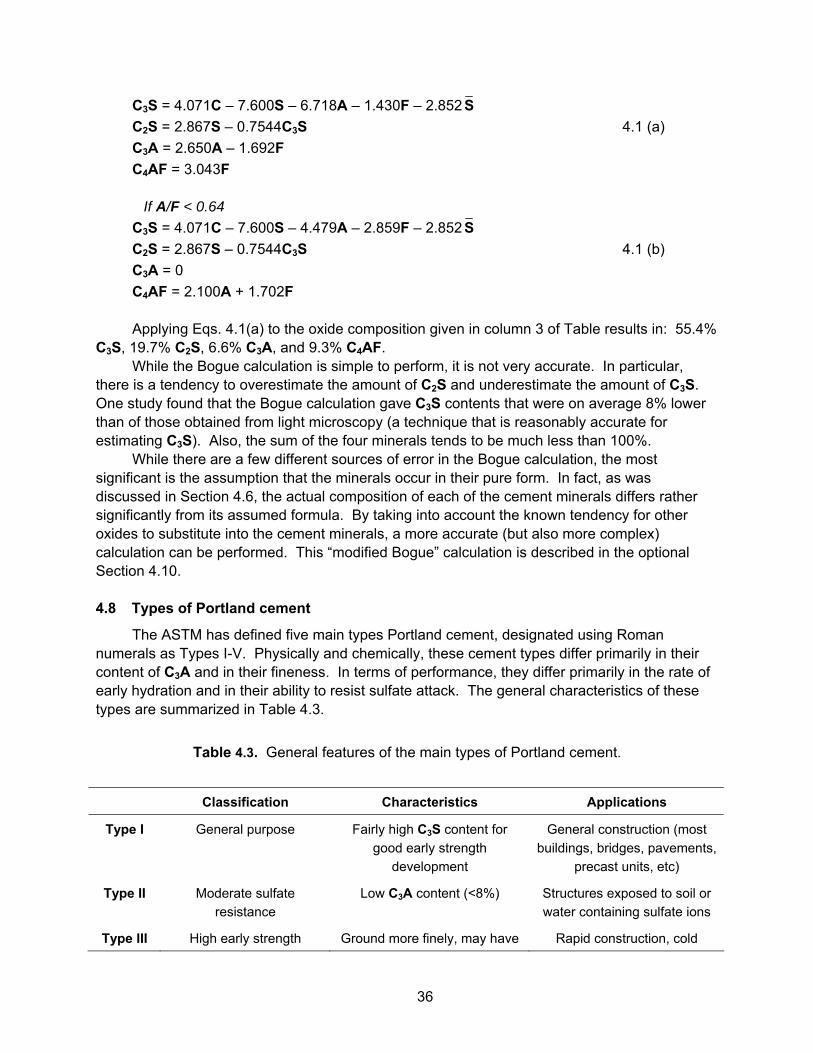
C3S = 4.071C – 7.600S – 6.718A – 1.430F – 2.852 S C2S = 2.867S – 0.7544C3S 4.1 (a) C3A = 2.650A – 1.692F C4AF = 3.043F If A/F < 0.64 C3S = 4.071C – 7.600S – 4.479A – 2.859F – 2.852 S C2S = 2.867S – 0.7544C3S 4.1 (b) C3A = 0 C4AF = 2.100A + 1.702F Applying Eqs. 4.1(a) to the oxide composition given in column 3 of Table results in: 55.4%
C3S, 19.7% C2S, 6.6% C3A, and 9.3% C4AF. While the Bogue calculation is simple to perform, it is not very accurate. In particular,
there is a tendency to overestimate the amount of C2S and underestimate the amount of C3S. One study found that the Bogue calculation gave C3S contents that were on average 8% lower than of those obtained from light microscopy (a technique that is reasonably accurate for estimating C3S). Also, the sum of the four minerals tends to be much less than 100%.
While there are a few different sources of error in the Bogue calculation, the most significant is the assumption that the minerals occur in their pure form. In fact, as was discussed in Section 4.6, the actual composition of each of the cement minerals differs rather significantly from its assumed formula. By taking into account the known tendency for other oxides to substitute into the cement minerals, a more accurate (but also more complex) calculation can be performed. This “modified Bogue” calculation is described in the optional Section 4.10.
4.8 Types of Portland cement
The ASTM has defined five main types Portland cement, designated using Roman numerals as Types I-V. Physically and chemically, these cement types differ primarily in their content of C3A and in their fineness. In terms of performance, they differ primarily in the rate of early hydration and in their ability to resist sulfate attack. The general characteristics of these types are summarized in Table 4.3.
Table 4.3. General features of the main types of Portland cement.
Classification Characteristics Applications
Type I General purpose Fairly high C3S content for good early strength
development
General construction (most buildings, bridges, pavements,
precast units, etc)
Type II Moderate sulfate resistance
Low C3A content (<8%) Structures exposed to soil or water containing sulfate ions
Type III High early strength Ground more finely, may have Rapid construction, cold
36

slightly more C3S weather concreting
Type IV Low heat of hydration (slow reacting)
Low content of C3S (<50%) and C3A
Massive structures such as dams. Now rare.
Type V High sulfate resistance Very low C3A content (<5%) Structures exposed to high levels of sulfate ions
White White color No C4AF, low MgO Decorative (otherwise has properties similar to Type I)
The differences between these cement types are rather subtle. All five types contain
about 75 wt% calcium silicate minerals, and the properties of mature concretes made with all five are quite similar. Thus these five types are often described by the term “ordinary Portland cement,” or OPC.
Types II and V OPC are designed to be resistant to sulfate attack. Sulfate attack is an important phenomenon that can cause severe damage to concrete structures. It is a chemical reaction between the hydration products of C3A and sulfate ions that enter the concrete from the outside environment. The products generated by this reaction have a larger volume than the reactants, and this creates stresses that force the concrete to expand and crack. Although the hydration products of C4AF are similar to those of C3A, they are less vulnerable to expansion, so the designations for Type II and Type V cement focus on keeping the C3A content low. There is actually little difference between a Type I and Type II cement, and it is common to see cements meeting both designations labeled as “Type I/II”. The phenomenon of sulfate attack will be discussed in much more detail in Sections 5.3 and 12.3, but it should be noted here that the most effective way to prevent sulfate attack is to keep the sulfate ions from entering the concrete in the first place. This can be done by using mix designs that give a low permeability (mainly by keeping the w/c ratio low) and, if practical, by putting physical barriers such as sheets of plastic between the concrete and the sulfate-containing soil.
Type III cement is designed to develop early strength more quickly than a Type I cement. This is useful for maintaining a rapid pace of construction, since it allows cast-in-place concrete to bear loads sooner and it reduces the time that precast concrete elements must remain in their forms. These advantages are particularly important in cold weather, which significantly reduces the rate of hydration (and thus strength gain) of all Portland cements. The downsides of rapid-reacting cements are a shorter period of workability, greater heat of hydration, and a slightly lower ultimate strength.
Type IV cement is designed to release heat more slowly than a Type I cement, meaning of course that it also gains strength more slowly. A slower rate of heat release limits the increase in the core temperature of a concrete element. The maximum temperature scales with the size of the structure, and Type III concrete was developed because of the problem of excessive temperature rise in the interior of very large concrete structures such as dams. Type IV cement is rarely used today, because similar properties can be obtained by using a blended cement.
White Portland cement (WPC) is made with raw ingredients that are low in iron and magnesium, the elements that give cement its grey color. These elements contribute essentially nothing to the properties of cement paste, so white Portland cement actually has quite good properties. It tends to be significantly more expensive than OPC, however, so it is
37

typically confined to architectural applications. WPC is sometimes used for basic research purposes instead of OPC because the lack of iron improves the resolution of nuclear magnetic resonance (NMR) measurements.
Optional sections 4.9 The use of cement kiln dust as a cement additive
This section contains a short discussion of the possibility of using cement kiln dust (CKD) as a cement additive or as an activator for reactive byproduct materials such as slag and fly ash. The best results have been achieved with ternary blends of CKD, slag, and OPC [xi,xvi]. The OPC offers early strengths while the slag, which is activated by the CKD, improves durability. These blends can absorb 10-15% by weight of CKD while still generating strengths equal to that of a neat OPC paste. However, the advantages of such an approach seem to be outweighed by the drawbacks associated with the CKD. These drawbacks include:
• At levels higher than 10-15%, CKD reduces the strength of concrete. • The high alkali content of CKD presents potential problems with alkali-silica reaction
between the pore fluid and the aggregate. This issue affects all alkali-activated cementitious materials, and is an important reason why alkali-activated slag (AAS) concrete, which has excellent early and ultimate strength and durability, has seen limited application [xvii].
• The chloride in CKD presents increased risk for corrosion of reinforcing steel, making CKD concretes inappropriate for reinforced concrete.
• Concrete containing CKD has a lower workability at a given water/cement ratio. [xvi]. While this can be addressed by using water reducing admixtures, this adds cost.
• CKD is a variable product. The CKD from different kilns and from different times can have very different compositions. This makes it difficult to design a concrete mixture with CKD. This problem is compounded by the fact that careful design of the mix has been shown to be needed to generate good properties with CKD concrete [xi,xvi].
Table 4.4 summarizes the reported oxide composition of CKD used in recent published studies (six varieties from four publications).
Table 4.4. Chemical oxide composition of six varieties of CKD (wt%) reported in refs [xi,xvi,xviii, xix].
Component Range (wt%) Average (wt%)
S 12.0 – 34.3 17.3
A 1.1 – 6.9 4.0
F 1.8 – 4.5 2.65
C 34.3 – 57.0 46.3
38

MgO 0.8 – 2.4 1.5
S 1.7 – 10.6 6.9
Na2O 0.3 – 3.9 1.6
K2O 1.2 – 8.2 4.0
Cl- 0.4 – 8.1 4.2
Loss on ignition 8.0 – 21.0 16.5
The variation in the composition shown in Table 4.4 is even greater than is suggested by
the oxide composition, because the mineral composition cannot be assumed from the oxide composition as it can with a cement. For example, Dyer et al. [xi] used two types of CKD with nearly identical C contents. They performed X-ray and Rietfeld analysis to determine the minerals, and found that one contained 9% calcite (a form of calcium carbonate) and 27% calcium hydroxide, while the other contained 53% calcite and 8% calcium hydroxide. Since calcium hydroxide is consumed in the pozzolanic reaction while calcite is not, the results obtained with the two CKDs in a blended cement will clearly differ greatly. Other minerals reported by Dyer et al [xi] include free lime, anhydrite, quartz, thenardite, Friedel’s salt, halite, and syngenite. One way to improve the cementing properties of CKD is to calcine it at temperatures above about 600˚C to decompose the calcite. Amin et al. [xx] calcined CKD for 2 hrs at 800, 900, and 1000˚C, and found that calcite X-ray peaks disappeared in all cases, that the chloride was nearly fully removed at 1000˚C, the alkali content was unchanged, and that there was an increase in the amount of β-C2S. The hydraulic properties of a CKD/ slag cement mixture improved with the CKD calcining temperature. It is not clear whether it would be economically viable to perform an additional calcining step on CKD, however.
One way to reduce the negative effects of CKD variability is through precasting, where the composition and reactivity of the material can be measured and controlled at the production facility to ensure consistent results. Another advantage of precasting is that elevated temperature curing can be used to accelerate the hydration process. A logical place to locate a manufacturing plant would be adjacent to a cement plant where the CKD is produced, because excess heat from the kilns could be reused for the elevated temperature curing.
4.10 Modified Bogue calculation for determining the mineral composition of OPC
To accurately calculate the mineral composition of a cement from the oxide composition it is necessary to estimate the true composition of the cement minerals in the clinker and to account for phases other than the main four cement minerals such as gypsum. A more complete description of this useful technique is given in ref. [xxi]. To perform this type of calculation requires an accurate and detailed oxide composition, such as that shown in Table. The process can be divided into the following steps:
39

4.10.1.1 1) If the oxide composition is for a cement (i.e., clinker ground with gypsum), subtract the
contribution of gypsum from the oxide composition.
As an example, assume that 2 wt% gypsum (C S H2) was added to the clinker to make the cement. Gypsum consists of 33% C and 47% S by weight, so we would subtract 0.66% from the total C content and 0.94% from the total S content (the remaining 20 wt% of gypsum is bound water, which would be lost on ignition). If the amount of gypsum added to the cement is not known, then a reasonable estimate must be made. A typical clinker S content of 0.5% could be assumed, so the remaining S would be in gypsum. Clearly this will add a possible source of error to the calculation.
4.10.1.2 2) Estimate the amount of C, S, A, and F in the clinker that is present in phases other than the
main cement minerals, and subtract these amounts from the overall oxide compositions.
The S content of the clinker (having subtracted the gypsum in step 1, if the oxide composition is for a cement) can be distributed in a few different phases, including K2SO4, Na2SO4, Ca2K(SO4)3, and as impurities in the cement minerals. The only concern at this point is the amount of C bound into phases such as Ca2K(SO4)3. If the ratio S /(N+K) in the clinker is less than about 1, this will be a small correction that can probably be safely ignored. If not, a procedure for estimating this amount is given in ref. [xxi].
The insoluble residue of the clinker or cement should be considered 67% S and 33% A, and these amounts subtracted from the total amounts of S and A. If the insoluble residue is not known, a value of 0.3 wt% can be assumed [xxi]. The amount of free C should be subtracted from the total C content. Finally, if there is any CO2 in the cement or clinker, it should be assumed to be in the form of calcium carbonate (CaCO3); this means that 48% of the CO2 content should be subtracted from the total amount of C.
After these corrections, all of the remaining C, S, A, and F can be assumed to reside in the main cement minerals.
4.10.1.3 3) Estimate the true compositions of the four main cement minerals.
These compositions can be measured directly using an x-ray microanalysis technique similar to that used to generate Figure 4-9. However, this obviously negates all of the advantages of performing a calculation. As noted by Taylor [ix] modern OPCs are processed in such a way that the compositions of the minerals in the clinker are fairly constant, and thus average compositional values give a good approximation. Table 4.5 lists the typical compositions reported by Taylor [xxi], along with the theoretical compositions of the pure minerals.
Table 4.5. Typical compositions of the cement minerals as found in Portland cement clinker and cement (after [xxi], and also given in [ix]). The numbers in parentheses are the values for the pure minerals. All values are wt%.
C S A F
C3S 71.6 (73.7) 25.2 (26.3) 1.0 (0) 0.7 (0)
40

C2S 63.5 (65.1) 31.5 (34.9) 2.1 (0) 0.9 (0)
C3A 56.6 (62.3) 3.7 (0) 31.3 (37.7) 5.1 (0)
C4AF 47.5 (46.2) 3.6 (0) 21.9 (21.0) 21.4 (32.9)
4.10.1.4 4 ) Set up and solve a system of four equations and four unknowns to find the mineral
composition of the cement.
Once the total amount of C, S, A, and F residing in the cement minerals has been calculated by adjusting the total oxide composition of the cement or clinker (steps 1 and 2) and the ratio of the oxides within each of the main cement minerals has been estimated (step 3), a system of four equations in four unknowns can be set up and solved for the amount (in wt%) of each cement mineral. Using the cement oxide composition for proficiency cement #135 given in Table and the mineral oxide compositions given in Table results in the following set of equations:
0.716C3S + 0.635C2S + 0.566C3A + 0.475C4AF = 62.52 (C) 0.252C3S + 0.315C2S + 0.037C3A + 0.036C4AF = 21.34 (S) 4.2 0.010C3S + 0.021C2S + 0.313C3A + 0.219C4AF = 4.40 (A) 0.007C3S + 0.009C2S + 0.051C3A + 0.214C4AF = 3.07 (F) Eqs. 4.2 can be solved using a computer program or spreadsheet or a programmable
calculator (or by hand if you have the patience!). Table 4.6 compares the mineral compositions for cement #135 calculated using the standard Bogue calculation (Eqs. 4.1(a)) and the modified calculation of Eqs. 4.2, along with an experimental determination using SEM/X-ray microanalysis [xiv].
Table 4.6. The calculated and measured mineral composition of cement #135 (see Table for the oxide composition).
Mineral Standard Bogue
Modified Bogue
SEM/X-ray (ref. [xiv]a)
C3S 55.4 64.7 62.1
C2S 19.7 14.4 16.4
C3A 6.6 3.47 6.2
C4AF 9.3 10.8 8.6
Total 91.0 93.3 93.3
a Values reported in ref. [xiv] were converted from vol% to wt% and renormalized to a total of 93.3%
Comparison of the values shown in Table 4.6 indicates that the modified Bogue gives much higher C3S content and a lower C2S content than the standard Bogue, and that these values are in better agreement with the SEM/X-ray analysis. For the C3A and C4AF phases the agreement is not as good. It is difficult to draw any conclusions on this, because it is difficult to
41

distinguish the C3A and C4AF experimentally. In any case, the C3S content of the cement is the most important aspect of the mineral composition, and this is certainly more accurate with the modified Bogue.
According to the modified Bogue calculation, the total weight percent occupied by the cement minerals is 93.3%. From Table we can see that the free lime, loss on ignition, and insoluble reside account for 1.6%. Other phases and their estimated amounts are: 2% calcium sulfate (i.e. added gypsum), 1.2% K2SO4, 0.8% MgO (the mineral periclase), and 0.2% Na2SO4.
4.11 Synthesizing pure cement minerals for research purposes
The hydration of Portland cement is a complicated process because all of the cement minerals are hydrating at the same time, forming a wide variety of hydration products. Like all scientists who study complex systems, cement chemists often prefer to study simpler systems consisting of one or perhaps two minerals. The advantage of this is that the results are much easier to analyze and interpret. The disadvantage, of course, is that the behavior of the simple system may or may not be characteristic of the full system. Fortunately, the pure mineral C3S is in many respects a good model system for Portland cement. The development of strength, the early hydration kinetics, and the main hydration products in a C3S paste are all very similar to those of Portland cement. Pure cement minerals cannot be obtained by separating them out from a cement, but must be manufactured separately. This is not particularly difficult, but it can be time consuming and labor intensive, and the amount of material formed is generally quite small.
The starting materials should be reagent grade CaCO3, SiO2, Al2O3, and Fe2O3 with low impurity levels and a small particle size to enhance reactivity. Silica fume and colloidal silica are good sources of SiO2, but quartz will also work as long as the particles are smaller than about 40 µm. These reactants should be combined in the correct mole ratio for the mineral being synthesized. The formation of the pure minerals is by solid-state reaction, which requires close contact between the reactants. Therefore the reactants should be well mixed in the form of slurry made with a solvent such as ethanol. The solvent should then be fully evaporated and the resulting well-mixed powder pressed into a pellet to bring the reactants closer together.
To fire the pellets, they should be placed in a platinum crucible and heated in a high-temperature electric furnace. The heating rate should be slow, with a 1 hour hold near 900˚C to fully decompose the CaCO3. The hold time at the highest temperature should be about 2 hours; longer times do not noticeably increase the conversion. The conversion of the reactants into minerals does not occur as readily as it does during the clinkering process, because of the lack of a liquid phase. Usually it is necessary to grind and repress the pellet and fire it a second or even a third time before all of the starting material reacts. The degree of reaction can be evaluated by performing X-ray diffraction scans to see if there are peaks corresponding to unreacted material or intermediate compounds.
In some cases it will be desirable to include impurity components in order to stabilize a high-temperature polymorph or to more closely simulate the composition of the minerals as found in cement clinker. As reported in ref. [xxii], there are two issues to watch out for. Some components, including boron, sodium, potassium, sulfur, uranium, and fluorine will volatilize at high temperatures, meaning that they may end up condensed on the inside of the furnace rather
42

than in the solid product. Covering the crucible will help but the composition of the product should be measured independently. Also, phosphorous, iron, nickel, cobalt, and other p-block elements and transition metals in their elemental form can damage the platinum crucible [xxii]. This may not be a problem if the conditions are oxidizing and the concentrations are low, but should be kept in mind if you are using someone else’s crucible.
Here are some additional instructions and suggestions for making each of the main four cement minerals, taken from references xxii and xxiii.
4.11.1.1 Tricalcium silicate (C3S)
To make pure triclinic C3S, fire pellets at 1450-1500˚C. Grind up and refire at least once, using XRD to ensure that no unreacted CaO remains. To form the monoclinic form of C3S found in cement requires stabilizing impurities. One possibility is to add up to 1 wt% of MgO and Al2O3 in place of SiO2.
4.11.1.2 Dicalcium silicate (C2S)
Use of pure reactants will result in the unreactive gamma form of C2S. To stabilize the beta form found in cement requires impurities such as MgO and Al2O3 in amounts generally < 1 wt%. B2O3 is an excellent stabilizer but is not found in cement. The firing procedure is the same as for C3S, but lower temperatures (down to ~1350˚C) may be used. Regrind as needed, checking for free CaO. Rapid cooling by removing the crucible from the furnace will help stabilize the beta form. See the section below on the Pechini process for making a highly reactive form of β-C2S using a different method.
4.11.1.3 Tricalcium aluminate (C3A)
The firing temperature should be ~ 1425˚C, and multiple grindings may be needed. Impurities are not needed for stabilization.
4.11.1.4 Tetracalcium aluminoferrite (C4AF)
Note that the stoichiometry of the cement mineral tends to be rather different than the formula suggests (see Section 4.6). The ratio of A to F can be varied, but C/(A+F) should be equal to 2. Impurities are not needed for stabilization. The firing temperature should be ~ 1370˚C and more than one grinding may be needed.
4.11.1.5 Formation of fine powders (Pechini process)
As discussed above, the formation of solid compounds by solid-state reaction is limited by the need for the individual reactants to be in close proximity. If the reactants can be mixed on an atomic scale prior to firing, it is possible to form solid compounds at much lower temperatures than those listed above. This can be accomplished by forming intermediate chemical compounds. An important side effect of a lower firing temperature is a higher surface area product, since there is less opportunity for finely divided material to sinter. A high surface area product is particularly useful for investigating C2S, because its reactivity with water is limited by its relatively low solubility. The solubility of a powder is proportional to its surface area. Another advantage of this method is that pure β-C2S can be formed, i.e. with no
43
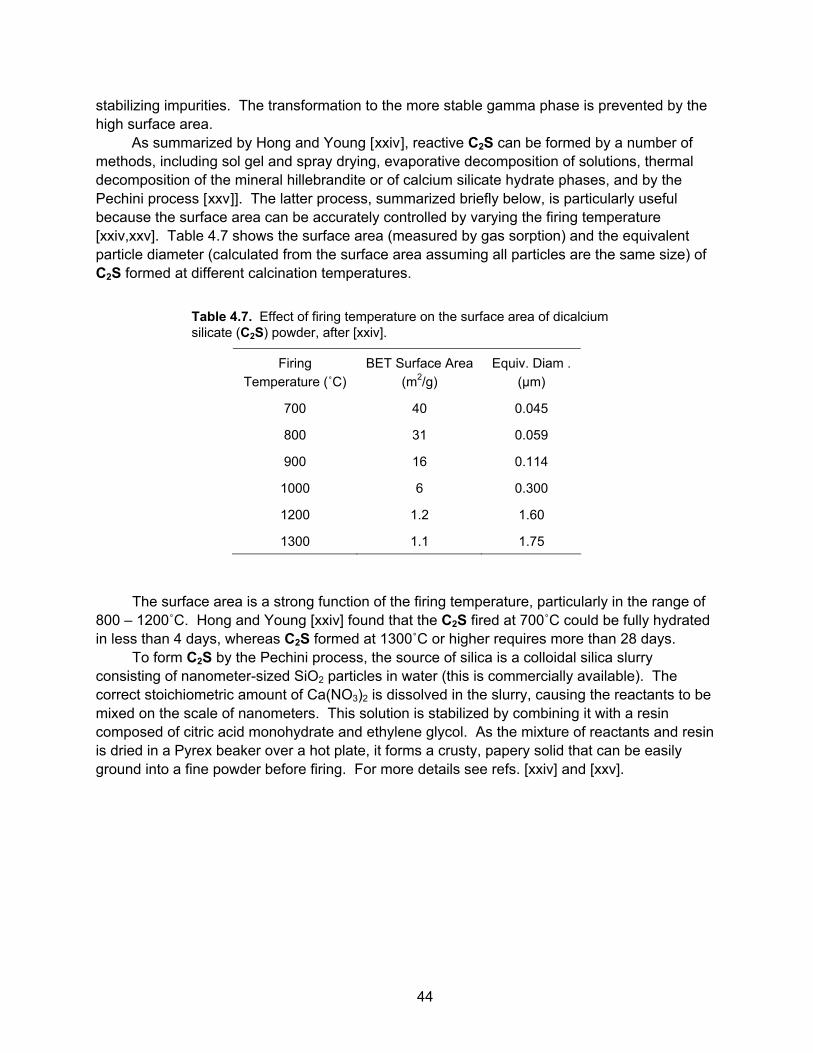
stabilizing impurities. The transformation to the more stable gamma phase is prevented by the high surface area.
As summarized by Hong and Young [xxiv], reactive C2S can be formed by a number of methods, including sol gel and spray drying, evaporative decomposition of solutions, thermal decomposition of the mineral hillebrandite or of calcium silicate hydrate phases, and by the Pechini process [xxv]]. The latter process, summarized briefly below, is particularly useful because the surface area can be accurately controlled by varying the firing temperature [xxiv,xxv]. Table 4.7 shows the surface area (measured by gas sorption) and the equivalent particle diameter (calculated from the surface area assuming all particles are the same size) of C2S formed at different calcination temperatures.
Table 4.7. Effect of firing temperature on the surface area of dicalcium silicate (C2S) powder, after [xxiv].
Firing Temperature (˚C)
BET Surface Area (m2/g)
Equiv. Diam . (µm)
700 40 0.045
800 31 0.059
900 16 0.114
1000 6 0.300
1200 1.2 1.60
1300 1.1 1.75
The surface area is a strong function of the firing temperature, particularly in the range of
800 – 1200˚C. Hong and Young [xxiv] found that the C2S fired at 700˚C could be fully hydrated in less than 4 days, whereas C2S formed at 1300˚C or higher requires more than 28 days.
To form C2S by the Pechini process, the source of silica is a colloidal silica slurry consisting of nanometer-sized SiO2 particles in water (this is commercially available). The correct stoichiometric amount of Ca(NO3)2 is dissolved in the slurry, causing the reactants to be mixed on the scale of nanometers. This solution is stabilized by combining it with a resin composed of citric acid monohydrate and ethylene glycol. As the mixture of reactants and resin is dried in a Pyrex beaker over a hot plate, it forms a crusty, papery solid that can be easily ground into a fine powder before firing. For more details see refs. [xxiv] and [xxv].
44
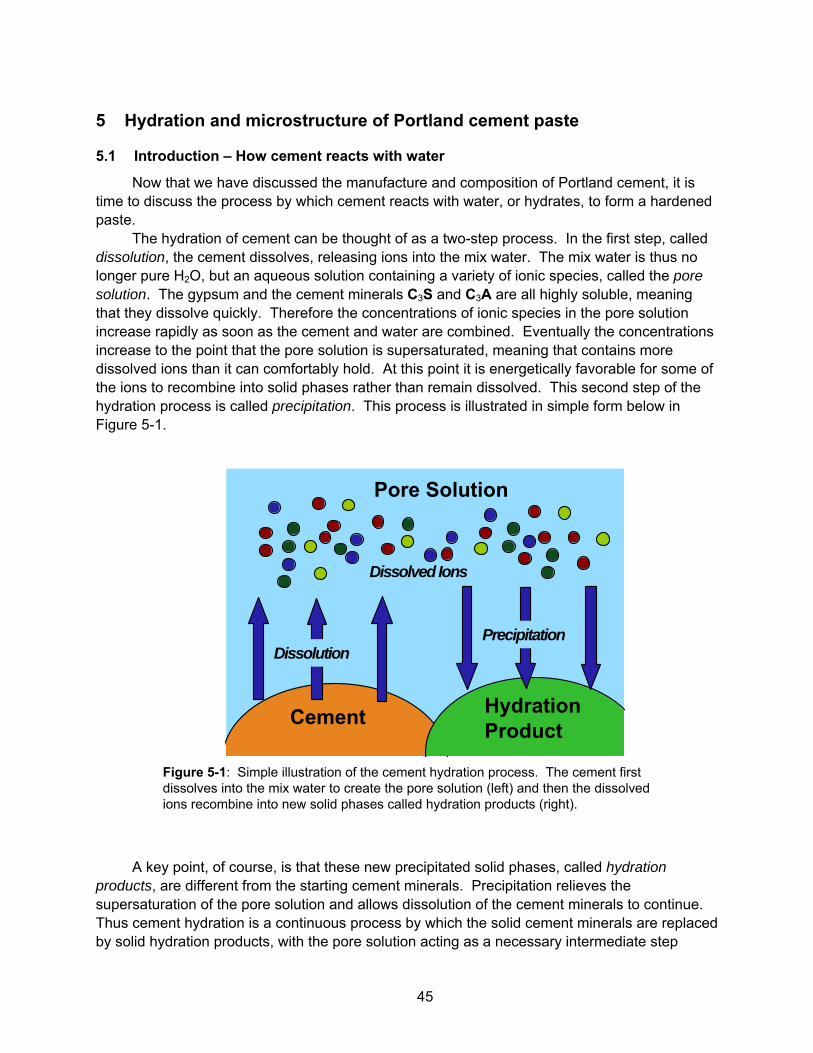
5 Hydration and microstructure of Portland cement paste
5.1 Introduction – How cement reacts with water
Now that we have discussed the manufacture and composition of Portland cement, it is time to discuss the process by which cement reacts with water, or hydrates, to form a hardened paste.
The hydration of cement can be thought of as a two-step process. In the first step, called dissolution, the cement dissolves, releasing ions into the mix water. The mix water is thus no longer pure H2O, but an aqueous solution containing a variety of ionic species, called the pore solution. The gypsum and the cement minerals C3S and C3A are all highly soluble, meaning that they dissolve quickly. Therefore the concentrations of ionic species in the pore solution increase rapidly as soon as the cement and water are combined. Eventually the concentrations increase to the point that the pore solution is supersaturated, meaning that contains more dissolved ions than it can comfortably hold. At this point it is energetically favorable for some of the ions to recombine into solid phases rather than remain dissolved. This second step of the hydration process is called precipitation. This process is illustrated in simple form below in Figure 5-1.
Cement HydrationProduct
Pore Solution
DissolutionPrecipitation
Dissolved Ions
Figure 5-1: Simple illustration of the cement hydration process. The cement first dissolves into the mix water to create the pore solution (left) and then the dissolved ions recombine into new solid phases called hydration products (right).
A key point, of course, is that these new precipitated solid phases, called hydration products, are different from the starting cement minerals. Precipitation relieves the supersaturation of the pore solution and allows dissolution of the cement minerals to continue. Thus cement hydration is a continuous process by which the solid cement minerals are replaced by solid hydration products, with the pore solution acting as a necessary intermediate step
45

between the two solid states (see Figure 5-1). The reactions between Portland cement and water have been studied for more than a hundred years, and the fact that hydration proceeds by a dissolution-precipitation process was first elaborated by the famous chemist Le Chatelier [xxvi].
There are two reasons that the hydration products are different from the cement minerals. One reason is that there is a new reactant in the system: water. Not only does the water facilitate the hydration process by dissolving the cement minerals, but it also contributes ions, in the form of hydroxyl groups (OH-), to the hydration products. The second reason is the tendency for all processes to approach thermodynamic equilibrium. This dictates that the solid phases that precipitate out of the pore solution are the ones that are the most stable under the current conditions.
The stability of a phase is defined by a parameter called the free energy, which can be roughly defined as the amount of chemical and thermal energy contained in the phase. The lower the free energy, the more stable the phase. As discussed in Chapter 4, the cement minerals are formed at very high temperatures exceeding 1400˚C, because they have the lowest free energy under those extreme conditions. At the much lower temperatures present during cement hydration, the cement minerals are actually quite unstable, meaning that there are many other solid phases that will form preferentially from the same atoms once they dissolve. In fact, the whole point behind the high-temperature cement manufacturing process is to create solid phases that will readily dissolve in water, allowing new phases to form. When one phase is converted into another phase with a lower free energy, there is usually a release of excess energy in the form of heat. Such a reaction is termed exothermic, and the exothermic heat associated with cement hydration has already been defined as the heat of hydration.
5.2 Overview of the hydration process
Figure 5-2 shows a graph of the rate of cement hydration over time, with the hydration process divided into four somewhat arbitrary stages. Information about the rate of a reaction is called kinetics, and the kinetics of cement hydration are covered in detail in Chapter 9. Here we will use the general behavior shown in Figure 5-2 to discuss the various processes that occur during hydration.
46

0
1
2
3
4
5
0 10 20 30 40 50 6Time (hours)�
1
2
3
4
Rat
e (m
W/g
)
0
Figure 5-2: Graph of the rate of hydration of an OPC paste at 30˚C as measured by the rate of heat evolution using a thermal calorimeter. Stages 1-4 are explained in the text.
As noted above, some of the cement minerals and constituents are very soluble, and thus
when cement and water are first combined there is a short period of fast reaction and heat output as the cement dissolves, lasting for less than one minute (Stage 1). Stage 1 is brief because of the rapid formation of an amorphous layer of hydration product around the cement particles, which separates them from the pore solution and prevents further rapid dissolution. This is followed by the induction period, during which almost no reaction occurs (Stage 2). The precise nature of the induction period, and in particular the reason for its end, is not fully known, or perhaps it should be stated that it is not fully agreed upon, as there are strongly held but differing opinions among cement chemists. The induction period is discussed further in Chapter 9.
During Stage 3, the rapid reaction period, the rate of reaction increases rapidly, reaching a maximum at a time that is usually less than 24 hours after initial mixing, and then decreases rapidly again to less than half of its maximum value. This behavior is due almost entirely to the hydration of the C3S. Both the maximum reaction rate and the time at which it occurs depend strongly on the temperature and on the average particle size of the cement. This reaction period is sometimes divided into two stages (before and after the maximum rate) but as the rate-controlling mechanism is the same throughout (nucleation and growth) it is preferable to treat this as single stage.
At the end of Stage 3 about 30% of the initial cement has hydrated, and the paste has undergone both initial and final set. Stage 3 is characterized by a continuous and relatively rapid deposition of hydration products (primarily C-S-H gel and CH) into the capillary porosity, which is the space originally occupied by the mix water. This causes a large decrease in the total pore volume and a concurrent increase in strength. The microstructure of the paste at this point consists of unreacted cores of the cement particles surrounded by a continuous layer of
47

hydration product, which has a very fine internal porosity filled with pore solution, and larger pores called capillary pores.
In order for further hydration to take place, the dissolved ions from the cement must diffuse outward and precipitate into the capillary pores, or water must diffuse inward to reach the unreacted cement cores. These diffusion processes become slower and slower as the layer of hydration product around the cement particles becomes thicker and thicker. This final period (Stage 4) is called the diffusion-limited reaction period.
Figure 5-3 shows the microstructure of a cement paste at it hydrates, as simulated by a realistic digital image based model [xxvii] (you may recall seeing this figure in Chapter 1). The yellow phase is the main hydration product, C-S-H gel. At the end of Stage 3, the yellow rims if hydration product have become interconnected, causing final set and giving paste some minimal strength. By 28 days the image is dominated by C-S-H gel and the porosity has noticeably decreased. The final amount of porosity depends strongly on the initial w/c of the paste.
Figure 5-3: Results of a realistic digital model of cement hydration. Phases are color coded: Black=water (pores), Red = C3S, Blue = C2S, Yellow = C-S-H gel. a) Cement particles dispersed in water just after mixing. (Stage 1). b) 30% hydration, ~ 1 day (end of Stage 3). c) 70% hydration, ~ 28 days (Stage 4). (Images courtesy of NIST).
The overall progress of the hydration reactions is described by the degree of hydration, α,
which is simply the fraction of the cement that has reacted. Complete hydration of all the cement gives α = 1. The degree of hydration can be measured in a few different ways, including x-ray measurements to determine how much of the minerals remain and loss on ignition measurements to determine how much bound water the paste contains. Another common method is to sum the amount of heat given off by the paste (as measured by thermal
a) Unreacted cement reacted
c) 70% reacted
b) 30%
48

calorimetry) and divide this value by the total amount of heat given off for complete hydration. The latter value will depend on the mineral composition of the cement. Another parameter that can be used to monitor the progress of hydration is the compressive strength. This is not a precise measure, since the strength depends on many factors other than the progress of the chemical reactions, but it is very practical since the development of strength is the primary reason for using cement and concrete in the first place. Figure 5-4 shows the degree of hydration (α), and the strength of a Type I OPC paste plotted as a function of time on the same graph. Note that the time is plotted on a log scale.
From Figure 5-4 it can be seen that the degree of hydration and the strength track together, particularly at later times. This is because the strength of cement paste depends primarily on the amount of capillary porosity, and the amount of capillary porosity decreases in proportion to the amount of hydration that has taken place. This decrease occurs because the C-S-H gel phase (including its internal gel pores) occupies significantly more volume than the cement minerals it forms from.
0
0.2
0.4
0.6
0.8
1
0
10
20
30
40
0.1 1 10 100
Deg
ree
of h
ydra
tion
Com
pressive strength (MPa)
Time (days)
Figure 5-4: Typical development of the degree of hydration and compressive strength of a Type I Portland cement over time.
In Figure 5-4 alpha has reached a value of 1 (complete hydration) after one year, but this
will not always be the case, as many cement pastes will never hydrate completely. Depending on why hydration terminates, incomplete hydration may or may not be a bad thing. The final degree of hydration will depend on the w/c of the paste, the cement particle size, and the curing conditions. Hydration will continue at a slow rate during Stage 4 until one of the three following criteria is met: 1) All of the cement reacts. This is the situation shown in Figure 5-4. This indicates that the paste has a moderate or high w/c and was cured correctly. While it is the best possible outcome for the given mix design, it does not guarantee high quality concrete as the w/c may
49

have been too high. If the cement contains some large particles, full hydration of these particles may not occur for years. However this is generally not the case with modern cements. 2) There is no more liquid water available for hydration. If the cement has a w/c less than about 0.4, there will not be enough original mix water to fully hydrate the cement. If additional water is supplied by moist curing or from rainfall, hydration may be able to continue. However, it is difficult to supply additional water to the interior of large concrete sections. If the cement is improperly cured so that it dries out, hydration will terminate prematurely regardless of the w/c. This is the worst-case scenario, as the strength will be lower (perhaps significantly) than the value anticipated from the mix design. 3) There is no more space available for new reaction product to form. When the capillary porosity is reduced to a certain minimal level, hydration will stop even if there is unreacted cement and a source of water. This is the best possible outcome, and it is only possible if the w/c is less than about 0.4. Not only will the cement paste or concrete have a high strength, but it will also have a low permeability and thus be durable. 5.3 Volume changes associated with hydration
One of the characteristics of concrete that make it such a useful material is the fact that there is almost no net change in volume as the cement paste hydrates. If this were not the case, it would be almost impossible to cast concrete structures in place since the size of the structure would change over time. Given the mechanism of cement hydration, which is that a layer of hydration product grows outward from the surface of each cement particle, one might expect that wherever two of these growing layers came into contact they would push the particles apart, causing the paste to expand. Fortunately, when the layers of hydration product from two adjacent cement particles come into contact, the C-S-H and CH phases stop growing in that particular direction. Thus hydration fills up the capillary pore space without expanding the paste.
While there are no major volume changes, there are a few different mechanisms that cause small volume changes, generally less than 1% in any direction. Even such relatively small changes can be important, however. These mechanisms are discussed below. Note that drying shrinkage and creep, which create volume changes unrelated to hydration, are discussed later in Chapter 10.
5.3.1.1 Chemical shrinkage
When liquid water reacts with cement to form phases such as C-S-H, CH, and ettringite, the water molecules occupy less space. Put another way, the effective density of water in the hydration products is higher than the density of liquid water (1 g/cm3). So the water in cement paste takes up less and less space as the cement hydrates, and this causes a small decrease in the total volume of the paste, called chemical shrinkage. Because chemical shrinkage occurs uniformly throughout the concrete, it does not generate large internal stresses, and is generally not harmful.
The mechanism of chemical shrinkage may be confusing because we have previously made the point that the hydration products have a greater volume than the cement from which they form. This is only true if one includes the liquid water in the C-S-H gel pores, however.
50
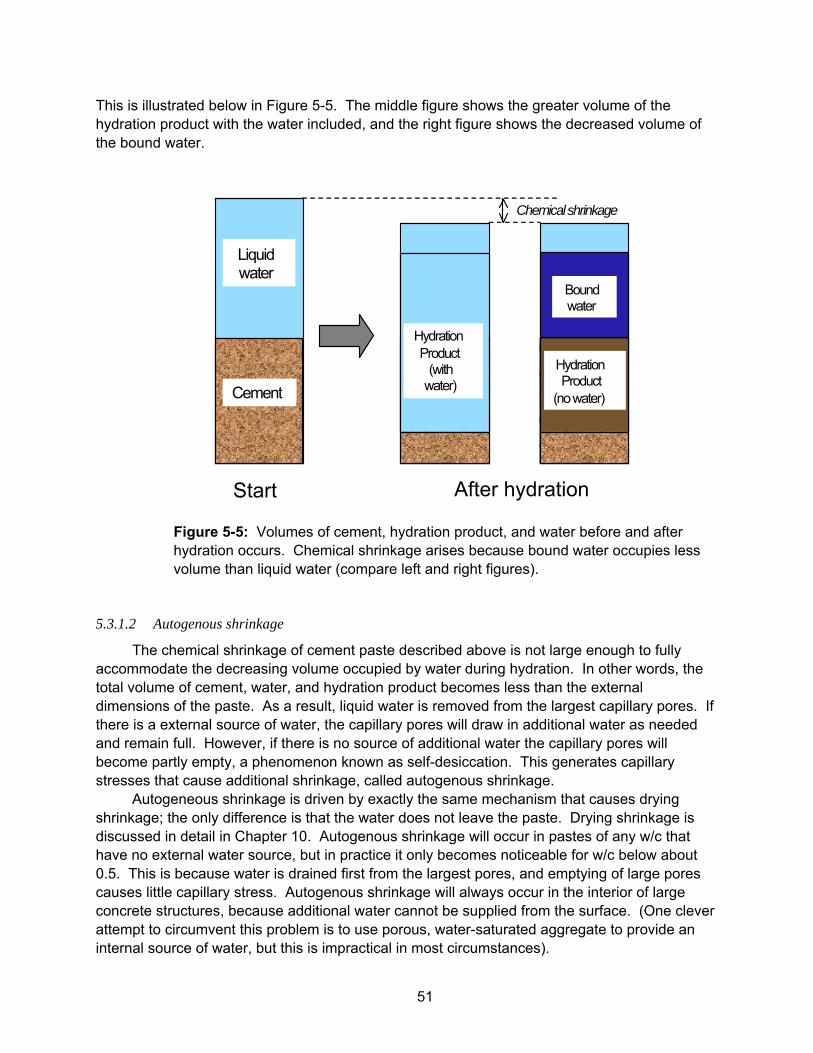
This is illustrated below in Figure 5-5. The middle figure shows the greater volume of the hydration product with the water included, and the right figure shows the decreased volume of the bound water.
Cement
Liquidwater
HydrationProduct
(withwater)
HydrationProduct
(no water)
Boundwater
Start After hydration
Chemical shrinkage
Figure 5-5: Volumes of cement, hydration product, and water before and after hydration occurs. Chemical shrinkage arises because bound water occupies less volume than liquid water (compare left and right figures).
5.3.1.2 Autogenous shrinkage
The chemical shrinkage of cement paste described above is not large enough to fully accommodate the decreasing volume occupied by water during hydration. In other words, the total volume of cement, water, and hydration product becomes less than the external dimensions of the paste. As a result, liquid water is removed from the largest capillary pores. If there is a external source of water, the capillary pores will draw in additional water as needed and remain full. However, if there is no source of additional water the capillary pores will become partly empty, a phenomenon known as self-desiccation. This generates capillary stresses that cause additional shrinkage, called autogenous shrinkage.
Autogeneous shrinkage is driven by exactly the same mechanism that causes drying shrinkage; the only difference is that the water does not leave the paste. Drying shrinkage is discussed in detail in Chapter 10. Autogenous shrinkage will occur in pastes of any w/c that have no external water source, but in practice it only becomes noticeable for w/c below about 0.5. This is because water is drained first from the largest pores, and emptying of large pores causes little capillary stress. Autogenous shrinkage will always occur in the interior of large concrete structures, because additional water cannot be supplied from the surface. (One clever attempt to circumvent this problem is to use porous, water-saturated aggregate to provide an internal source of water, but this is impractical in most circumstances).
51
5.3.1.3 Expansive reactions
5.4 Hydration reactions of the cement minerals
Each of the four main cement minerals reacts at a different rate and tends to form different solid phases when it hydrates. The behavior of each of these minerals has been studied by synthesizing it in its pure form and hydrating it under controlled conditions, and these reactions are discussed in this section. It should be noted that during the actual cement hydration process all the minerals dissolve into the same pore solution, and thus the solid hydration products are associated with the pore solution as a whole rather than a particular cement mineral. However, the individual reactions provide a good approximation of the overall hydration behavior of cement.
5.4.1.1 Hydration of the calcium silicate minerals (C3S and C2S)
Tricalcium silicate (C3S) is the most abundant and important cement mineral in Portland cements, contributing most of the early strength development. The hydration of C3S can be written as:
C3S + (1.3+ x)H ⇒ C1.7SHx + 1.3CH 5.1
where H is liquid water, C1.7SHx is the calcium silicate hydrate (C-S-H) gel phase and CH is calcium hydroxide, which has the mineral name Portlandite. The variable x in eq. 5.1 represents the amount of water associated with the C-S-H gel, which varies from about 1.4 to 4 depending on the relative humidity inside the paste and on how much of the water associated with the C-S-H is considered to be part of its actual composition. The state of water in cement paste and in C-S-H gel is discussed further in Section 5.6. The kinetics of hydration of C3S are substantially similar to those of Portland cement as a whole (see Figure 5-2). Much of the reaction occurs during the first few days, leading to substantial strength gains and reduction in capillary porosity.
The dicalcium silicate phase (C2S) reacts according to:
C2S + (0.3+ x)H ⇒ C1.7SHx + 0.3CH 5.2
The hydration products are the same as those of C3S, but the relative amount of CH formed is less. C2S is much less soluble than C3S, so the rate of hydration is much slower. C2S hydration contributes little to the early strength of cement, but makes substantial contributions to the strength of mature cement paste and concrete. 5.4.1.2 Hydration of the calcium aluminate and ferrite minerals (C3A and C4AF)
The hydration of the aluminate and ferrite minerals is somewhat more complex than that of the calcium silicate minerals, and the reactions that take place depend on whether sulfate ions are present in the pore solution. C3A is highly soluble, even more so than C3S. If C3A is hydrated in pure water, calcium aluminate hydrates form. The reaction sequence is:
52

2C3A + 21H ⇒ C4AH13 + C2AH8 ⇒ 2C3AH6 + 9H 5.3
where the first reaction is very rapid and the second reaction occurs more slowly. The final reaction product, C3AH6, is called hydrogarnet. The initial reaction is so rapid that if it is allowed to occur in a Portland cement paste it would release large amounts of heat and could cause the paste to set within a few minutes after mixing, an undesirable condition known as flash set. The purpose of adding gypsum (C S H2) to Portland cement is to prevent this from happening. The gypsum is also highly soluble, rapidly releasing calcium and sulfate ions into the pore solution. The presence of the sulfate ions causes the C3A to undergo a different hydration reaction. The reaction of C3A and gypsum together is:
C3A + 3CSH2 + 26H ⇒ C6AS3H32 5.4
where C6A S 3H32 is the mineral ettringite. Since all Portland cements contain gypsum, eq. 5.4 is the main hydration reaction for C3A. Small amounts of hydrogarnet formed by eq. 5.3 can sometimes be found in cement pastes, however.
If the gypsum in the cement reacts completely before the C3A, then the concentration of sulfate ions in the pore solution decreases drastically and the ettringite becomes unstable and converts to a different solid phase containing less sulfate:
2C3A + C6AS3H32 + 4H ⇒ 3C4ASH12 5.5
where the new reaction product, C4A S H12, is called monosulfoaluminate. Most cements do not contain enough gypsum to react with all of the C3A, and as a result most or all of the ettringite is converted to monosulfoaluminate within the first day or two of hydration via the reaction of eq. 5.5.
Reactions 5.4 and 5.5 are both exothermic and contribute to the heat of hydration of cement. The early hydration of C3A to form ettringite via eq. 5.4 is quite rapid; this is a major contributor to the stage 1 kinetics shown in Figure 5-2. As with the early C-S-H formation, this separates the C3A particles from the pore solution, slowing their dissolution. After a period of several hours the early-forming ettringite converts to monosulfoaluminate via eq. 5.5, allowing the C3A to undergo renewed rapid hydration, with kinetics that are roughly similar to the main hydration peak of C3S (stages 3 and 4). When the C3A is hydrating within a cement paste, this second period of reaction often creates a shoulder in the decelerating rate period just after the main peak (see Figure 5-2).
The ferrite phase (C4AF) reacts in a similar fashion to the C3A (eqs. 5.3 - 5.5), but more slowly. One important difference is that the reaction products contain both aluminum and iron, which can occupy the same sites in the crystal lattice. The relative amounts of A and F depend on many factors including the composition of the C4AF and the local conditions in the paste. A convenient way to represent these reactions is [xxviii]
0.75 C4AF( ) + 3CSH2 + 27.5H ⇒ C6 (A,F)S3H32 + 0.5(F,A)H3 5.6
1.5 C4AF + C6 (A,F)( ) S3H32 + 7H ⇒ 3C4 (A,F)SH12 + (F,A)H3 5.7
53

where (A,F) indicates a single site containing mostly aluminum with variable substitution of iron, and (F,A) indicates mostly iron with variable substitution of aluminum. The (F,A)H3 is an amorphous phase that forms in small amounts to maintain the correct reaction stoichiometry.
Because of the substituted iron, the main reaction products are not pure ettringite and monosulfoaluminate, although they have the same crystal structure. Instead, cement chemists have given them the names AFt and AFm, respectively, where the m indicates monosulfate (one sulfate ion) and the t indicates trisulfate (three sulfate ions). In a Portland cement paste where the C3A and C4AF are intimately mixed together, it can be safely assumed that the aluminum-bearing reaction products are never completely free of iron, and so the terms AFm and AFt are more correct. However, as with the terms alite (impure C3S) and belite (impure C2S), this is a bit more confusion than many people are willing to deal with, and thus the terms ettringite and monosulfoaluminate are commonly used to refer to these phases in cement pastes. 5.4.1.3 Reaction with additional sulfate ions
As noted above, most Portland cements do not contain enough added gypsum to fully hydrate the C3A and C4AF via reactions 5.4 and 5.6 to form ettringite. Once the gypsum is consumed, the ettringite reacts with the remaining C3A and C4AF to form a new lower-sulfate phase called monosulfate (reactions 5.5 and 5.7). Thus in a mature Portland cement paste it is normal to find monosulfate and little or no ettringite.
However, if a new source of sulfate ions becomes available in the pore solution, then it becomes thermodynamically favorable to form ettringite again, just as it was during the early stages of hydration. This will occur at the expense of the existing monosulfate:
C4ASH12 + 2CSH2 + 16H ⇒ C6AS3H32 5.8
where it is understood that the A sites will contain some F. The gypsum on the left side of eq. 5.8 represents the equivalent amount of dissolved ion, as no solid gypsum need form in the paste.
Reaction 5.8 is more than just a theoretical point: in fact, it is all too common for sulfate ions present in ground water, sea water, and soil to diffuse into concrete, allowing the reformation of ettringite to proceed. This occurs primarily, but not exclusively, in concrete below ground level, such as building foundations. The problem with this phenomenon is that reaction 5.8 is expansive, meaning that the ettringite occupies a larger volume than the monosulfate it replaces. Thus expansive stresses are created that can cause cracking and other deterioration. Unfortunately, this is actually only the first step in the sulfate attack process, as once all of the monosulfate is consumed other chemical reactions can occur that further weaken the cement paste (assuming a continued ingress of sulfate ions). We will discuss sulfate attack further in Chapter 12, and conclude this discussion by mentioning that the best way to minimize the damaging effects of sulfate attack and similar chemical attack processes is to use a low w/c to keep the permeability of the concrete low.
54

5.5 Distribution of phases in Portland cement paste
The distribution of phases in a cement paste will depend primarily on the composition of the cement clinker, the total amount of sulfate (including added gypsum), the w/c ratio, and the length of time the cement has been hydrating. Table 5.1 lists some phase data for a typical type I OPC paste made at a w/c of 0.45. The oxide composition of such a cement was given in Chapter 3. For the mature paste, it was assumed that the C3S and C2S reacted to near completion, the C3A was completely consumed, and half of the C4AF had reacted. The phase distribution in the mature paste was estimated based on the reactions given in the previous section, assuming that the conversion of ettringite into monosulfate was complete. In this case, the total amount of sulfate was such that some ettringite remained in the paste. Note the low volume percent of capillary porosity in the mature paste (~11%), which is a result of the relatively low w/c of 0.45. This indicates that the paste will be relatively impermeable, and thus resistant to many forms of degradation. At a slightly higher w/c of 0.5, the capillary porosity would increase to about 17%, making the paste considerably more vulnerable.
Table 5.1: Phase data for a Type I OPC paste made with a w/c of 0.45.
Volume %
Phase Density (g/cm3) At Mixing Mature Paste
C3S 3.15 23.40 1.17
C2S 3.28 7.35 0.78
C3A 3.03 4.42 0.00
C4AF 3.73 2.87 1.39
Gypsum (C S H2) 2.32 3.47 0.00
C-S-H (solid)a 2.65 0 29.03
C-S-H (with gel pores)b 1.90 0 49.99
Calcium hydroxide (CH) 2.24 0 13.96
Ettringite (AFt) 1.78 0 6.87
Monosulfoaluminate (AFm)
2.02 0 15.12
Water 1.00 58.49 31.69
Gel porosity -- 0 20.96
Capillary porosity -- 58.49 10.73
a Formula 1.7C-S-1.6H. b Formula 1.7C-S-4.
5.5.1.1
Whereas the values in the last column of Table 5.1 were determined from a relatively complex series of calculations that took into account the specific cement composition and reactions, it is possible to estimate the overall volumes of hydration product, gel porosity, and
55
capillary porosity for any Portland cement paste using a few simple equations. This approach, called the Powers-Brownyard model of hydration, is described in the optional Section 5.9.
5.6 Morphology of the main hydration products
The morphology of a solid phase can be defined as its shape, form, or structure at the microscopic scale, that is, the scale of nanometers and microns. The morphology of a material often has a greater impact on its macroscopic properties than its chemical composition; this is certainly true of cement paste and concrete. The combined morphology of the solid phases in a porous material such as cement paste is one of the major components of its microstructure, with the other being the pore system itself. The morphology of a particular solid phase will depend on many factors, including the crystal structure, the mechanism of formation, the temperature, and the space available for the phase to form, to name just a few that are particularly relevant to cement paste. In addition, the morphology of a solid phase can change over time in response to changes in its surrounding environment.
One of the major reasons that the science of cement and concrete is so complex is that the morphology of the hydration products are both complex and highly variable. The standard approach for studying a complex material or process is to break it down into individual phases or steps and to study each of these in isolation. This is difficult to do with cement, because the morphology of the phases depends strongly on the complex local conditions that exist during the hydration process. This is particularly true of the C-S-H gel phase, which is by far the most important hydration product. The C-S-H gel is discussed in detail in Chapter 8, and only an overview of its properties is given here.
Calcium-silicate-hydrate (C-S-H) gel The C-S-H gel is not only the most abundant reaction product, occupying about 50% of
the paste volume, but it is also responsible for most of the engineering properties of cement paste. This is not because it is an intrinsically strong or stable phase at the atomic level (it isn’t!) but because it forms a continuous layer that binds together the original cement particles into a cohesive whole. All the other hydration products form as individual crystals that are intrinsically strong but do not form strong connections to the solid phases they are in contact with and so cannot contribute much to the overall strength. The ability of the C-S-H gel to act as a binding phase arises from its nanometer-level structure. Because of its importance and complexity, an entire chapter (Chapter 8) is devoted to the structure and properties of C-S-H. Here we will discuss two of its most important general features: the internal pore system and the two morphologies.
As C-S-H gel grows outward from the cement particles, it does not take the form of a monolithic solid phase but instead develops an internal system of tiny pores, called gel pores, which are hundreds or thousands of times smaller than the original capillary pores. Although the liquid water in the gel pores is not part of the solid C-S-H phase in a chemical sense, it is physically isolated and thus cannot undergo further chemical reaction with the cement minerals. This is the main reason for the range of water contents of C-S-H gel (the variable x in eqs. 5.1 and 5.2). The C-S-H gel, including its internal gel pores, occupies significantly more volume than the original C3S and C2S mineral that it replaces. This causes the layers of C-S-H gel to expand outward and interconnect into a continuous phase, causing the cement paste to first set
56

and then harden into a strong solid. Because the overall volume of the cement paste does not change significantly after mixing, the increase in the volume of solid phases causes the capillary pore system to decrease in volume and, if the w/c is reasonably low, to become discontinuous. This greatly decreases the permeability of the cement paste, meaning that it is more difficult for liquid water and dissolved ions to move through the pore system.
When a hydrated cement paste is viewed in a microscope at moderate magnifications, two apparently different types or morphologies of C-S-H gel can be seen. One of these is less dense (more porous) and appears to occupy space that was originally water-filled, while the other appears more dense and is found primarily in areas originally occupied by the cement particles. The less dense morphology forms rapidly during the early hydration period surrounding setting (Stage 3), while the denser morphology fills in more slowly over days and weeks during Stage 4 (see Figure 5-6). Based on these characteristics, the two types have been given a variety of distinguishing labels, including “early” and “late” and “outer” and “inner”. We prefer the terms “low-density” and “high-density” C-S-H, because the other terms are only approximately correct (i.e., some low-density C-S-H can form at later times and some high-density C-S-H is found outside of the original particle boundaries). Since the most important characteristic of C-S-H gel is its tendency to grow outward into the porosity, the low-density C-S-H is much more important than the high-density C-S-H.
0
1
2
3
4
5
0 10 20 30 40 50 60Time (hours)�
Rat
e (m
W/g
)
Low-Density C-S-H Gel
High-Density C-S-H Gel
QuickTime™ and aTIFF (Uncompressed) decompressor
are needed to see this picture.
Figure 5-6: Left: Rate of hydration vs. time, showing when the low-density and high-density morphologies form. Right: Backscattered SEM image of a 28 d old cement paste (courtesy of Paul Stutzmann, Concrete Microscopy Library). The white area is unreacted cement. The surrounding smooth grey area is high-density C-S-H. The multiphase areas are a mixture of capillary pores (black), low-density C-S-H, and other solid hydration products. The image is approximately 100 µm wide.
57
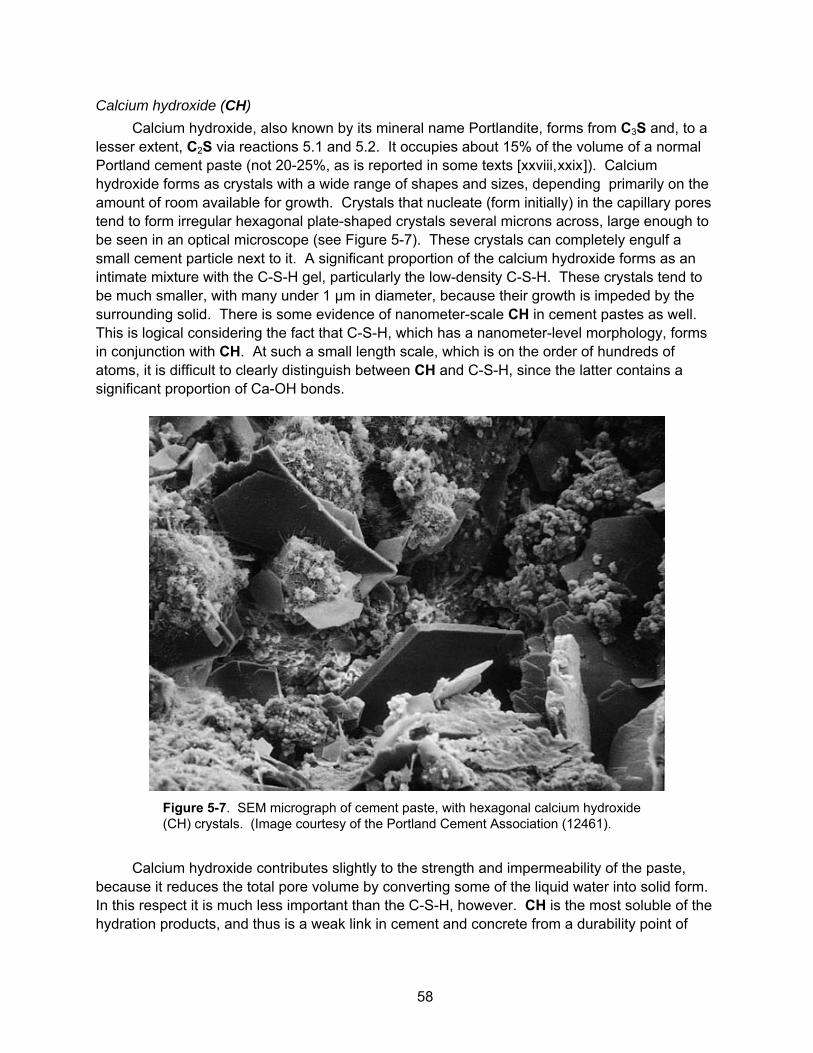
Calcium hydroxide (CH) Calcium hydroxide, also known by its mineral name Portlandite, forms from C3S and, to a
lesser extent, C2S via reactions 5.1 and 5.2. It occupies about 15% of the volume of a normal Portland cement paste (not 20-25%, as is reported in some texts [xxviii,xxix]). Calcium hydroxide forms as crystals with a wide range of shapes and sizes, depending primarily on the amount of room available for growth. Crystals that nucleate (form initially) in the capillary pores tend to form irregular hexagonal plate-shaped crystals several microns across, large enough to be seen in an optical microscope (see Figure 5-7). These crystals can completely engulf a small cement particle next to it. A significant proportion of the calcium hydroxide forms as an intimate mixture with the C-S-H gel, particularly the low-density C-S-H. These crystals tend to be much smaller, with many under 1 µm in diameter, because their growth is impeded by the surrounding solid. There is some evidence of nanometer-scale CH in cement pastes as well. This is logical considering the fact that C-S-H, which has a nanometer-level morphology, forms in conjunction with CH. At such a small length scale, which is on the order of hundreds of atoms, it is difficult to clearly distinguish between CH and C-S-H, since the latter contains a significant proportion of Ca-OH bonds.
Figure 5-7. SEM micrograph of cement paste, with hexagonal calcium hydroxide (CH) crystals. (Image courtesy of the Portland Cement Association (12461).
Calcium hydroxide contributes slightly to the strength and impermeability of the paste,
because it reduces the total pore volume by converting some of the liquid water into solid form. In this respect it is much less important than the C-S-H, however. CH is the most soluble of the hydration products, and thus is a weak link in cement and concrete from a durability point of
58

view. If the paste is exposed to fresh water, the CH will leach out (dissolve), increasing the porosity and thus making the paste more vulnerable to further leaching and chemical attack.
Calcium hydroxide is believed to play a role in limiting the amount of shrinkage that occurs when a cement paste is dried. As water is removed from the pore system, the C-S-H gel phase collapses causing an overall shrinkage, while other crystalline phases such as CH are unaffected. As the C-S-H starts to shrink the CH that is in contact with it acts as a restraint, so that the overall shrinkage is less than it would be if the CH were not present.
Blended cement pastes, which are discussed in the next chapter, have little or no CH, as the CH that forms from cement hydration is consumed along with the mineral admixtures to form additional C-S-H gel. This has beneficial effects on the strength and permeability, but tends to increase the tendency for drying shrinkage for the reasons mentioned above.
Calcium sulfoaluminate phases The hydration products that form from the C3A and C4AF minerals occupy about 15-25%
of the volume of a mature Portland cement paste. As with CH, they do not contribute much to the engineering properties of concrete, except in a negative sense when a cement paste undergoes sulfate attack. The main calcium sulfoaluminate phases have very different morphologies. Ettringite forms as distinctive clusters of prismatic needles (see Figure 5-8), whereas monosulfate forms as hexagonal-plate crystals similar to CH, but smaller. In most cases, the individual crystals of both phases are too small to be seen with optical microscopy.
Figure 5-8. Cluster of needle-shaped ettringite crystals deposited in a cement paste void. (Image courtesy of the Portland Cement Association (12494)).
59

Other phases The most important phase not discussed above is the capillary porosity, which can occupy
anywhere from a few percent to 20% or more of the paste volume, depending on the degree of hydration and the initial w/c. The morphology of the pore system of cement paste is discussed in Section 5.8. Under most conditions, the pore system of concrete will be at least partially filled with the aqueous pore solution. This important phase acts as a link between the solid hydration products and the outside environment. The composition of the pore fluid is also covered in Section 5.8.
Most cement pastes will contain some unreacted cement, in the form of cores of the largest original particles. These do not contribute to the engineering properties, but neither do they detract from them, except for the potential loss of hydration product. High strength concrete is made by using such low w/c values that a significant fraction of the cement must remain unhydrated due to a lack of space for hydration products to form.
Other solid phases that may be found in normal cement pastes include hydrogarnet, which is a calcium aluminate phase with a cubic structure, brucite (Mg(OH)2), which has the same structure and morphology as CH, and syngenite (KCS2H), which is found only in very high-alkali pastes. None of these have any engineering importance, although their presence or absence can provide important information about the original cement composition to a cement scientist or petrographer (a person who analyzes samples taken from existing concrete structures).
5.7 The microstructure of cement paste
General features The hydration products in cement paste do not exist in isolation, but are entangled with
one another at the scale of microns and even nanometers. The possible exception to this is the high-density C-S-H phase that forms within the boundaries of the original cement grains. Thus in describing the microstructure of cement paste the structure of the individual solid phases is not as relevant as the overall distribution of solid phases and porosity. With this in mind, a basic but useful description of cement paste microstructure is comprised of just three “phases” (see Figure 5-9).
60

Figure 5-9: Backscattered SEM image of a mature cement paste showing the main microstructural features. (Image courtesy of Paul Stutzmann, Concrete Microscopy Library).
Pores
Hydrated particles
Outer product
Hydrated cement particles: These consist of high-density C-S-H, and in some cases an interior core of unhydrated cement. These behave as individual solid particles within a continuous matrix analogous to the aggregate particles in concrete. These features are sometimes called “phenograins”, which simply refers to the fact that they are distinctly visible in a microscope.
Outer hydration product: This is the continuous phase that grows within the capillary pore space and binds the cement together. Following the analogy used above, it plays a role similar to cement paste in concrete. It consists of solid C-S-H gel, gel pores, calcium hydroxide, and calcium sulfoaluminate phases. This “phase” appears as various shades of speckled grey in an optical or electron microscope, and is sometimes referred to as “groundmass.” By far the most important individual phase is, of course, the low density C-S-H gel (and its gel pores), because its high surface area gives this phase its strength.
Large pores: These consist of true capillary pores, entrapped air voids, and the entrained air system. These features appear as discrete black voids in a microscope. The large pore system can be continuous or discontinuous, depending on the degree of hydration and starting w/c, but this cannot be determined from microscopy.
The interfacial transition zone (ITZ) Concrete is made up of two distinctly different constituents, the cement paste and the
aggregate, and there is a tendency to assume that the properties of each of these is unaffected by the presence of the other. In the previous section we discussed how the cement paste can affect the aggregate by causing a chemical reaction between the highly alkaline pore solutions and reactive silica in the aggregate. The presence of the aggregate also affects the cement paste. The cement particles in fresh concrete, which are suspended in the mix water, cannot
61
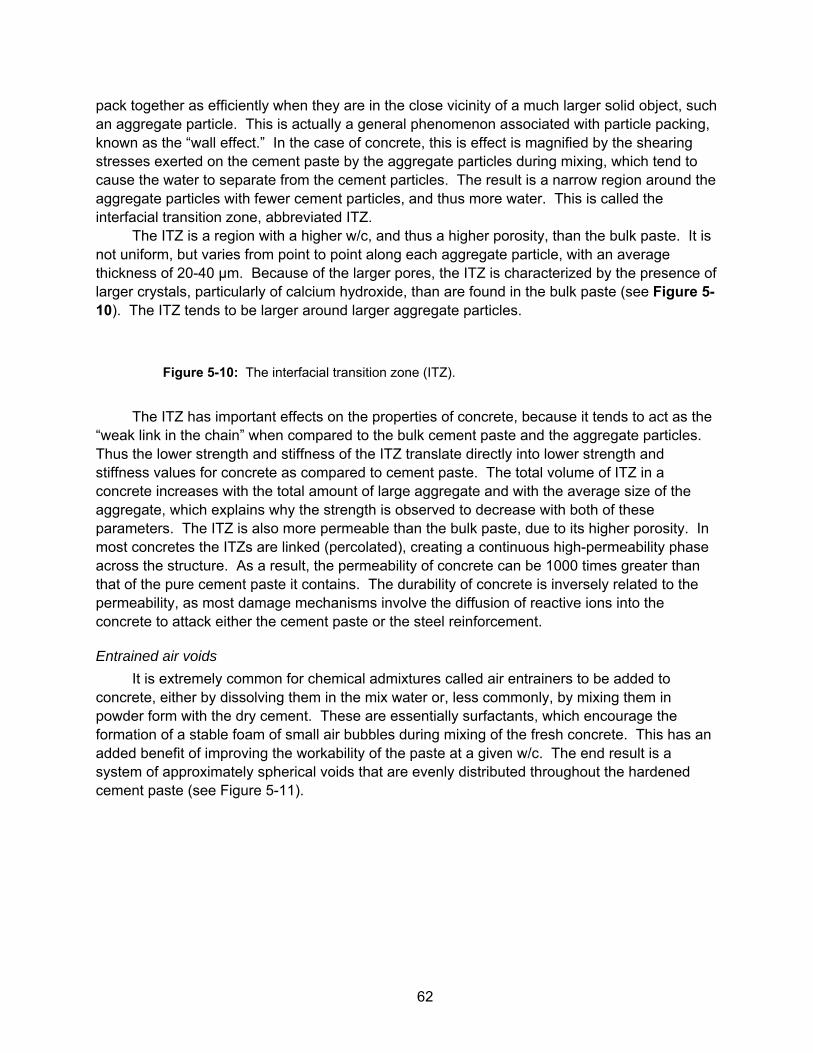
pack together as efficiently when they are in the close vicinity of a much larger solid object, such an aggregate particle. This is actually a general phenomenon associated with particle packing, known as the “wall effect.” In the case of concrete, this is effect is magnified by the shearing stresses exerted on the cement paste by the aggregate particles during mixing, which tend to cause the water to separate from the cement particles. The result is a narrow region around the aggregate particles with fewer cement particles, and thus more water. This is called the interfacial transition zone, abbreviated ITZ.
The ITZ is a region with a higher w/c, and thus a higher porosity, than the bulk paste. It is not uniform, but varies from point to point along each aggregate particle, with an average thickness of 20-40 µm. Because of the larger pores, the ITZ is characterized by the presence of larger crystals, particularly of calcium hydroxide, than are found in the bulk paste (see Figure 5-10). The ITZ tends to be larger around larger aggregate particles.
Figure 5-10: The interfacial transition zone (ITZ).
The ITZ has important effects on the properties of concrete, because it tends to act as the
“weak link in the chain” when compared to the bulk cement paste and the aggregate particles. Thus the lower strength and stiffness of the ITZ translate directly into lower strength and stiffness values for concrete as compared to cement paste. The total volume of ITZ in a concrete increases with the total amount of large aggregate and with the average size of the aggregate, which explains why the strength is observed to decrease with both of these parameters. The ITZ is also more permeable than the bulk paste, due to its higher porosity. In most concretes the ITZs are linked (percolated), creating a continuous high-permeability phase across the structure. As a result, the permeability of concrete can be 1000 times greater than that of the pure cement paste it contains. The durability of concrete is inversely related to the permeability, as most damage mechanisms involve the diffusion of reactive ions into the concrete to attack either the cement paste or the steel reinforcement.
Entrained air voids It is extremely common for chemical admixtures called air entrainers to be added to
concrete, either by dissolving them in the mix water or, less commonly, by mixing them in powder form with the dry cement. These are essentially surfactants, which encourage the formation of a stable foam of small air bubbles during mixing of the fresh concrete. This has an added benefit of improving the workability of the paste at a given w/c. The end result is a system of approximately spherical voids that are evenly distributed throughout the hardened cement paste (see Figure 5-11).
62

Figure 5-11: Optical micrograph of concrete, showing air-entrained voids (black circles). (Image courtesy of the Portland Cement Association (12328)).
The purpose of this entrained air void system is to make the concrete less susceptible to
damage caused by freezing of the water in the pores. When the pore fluid freezes, it expands. The air void system provides extra space for the ice to enter, so that it does not generate large expansive stresses that damage the concrete.
Entrained air voids are smaller than the normal entrapped air voids that always form in smaller numbers during mixing, and this minimizes their effect on the strength of the concrete. Ideally, entrained air voids should be closely spaced, but isolated from each other and from large capillary pores. This maximizes the protection against freezing, and reduces the tendency for the voids to fill with water, which would render them ineffective. In a typical air void system the void size range is 10-250 µm, and the average distance from any point in the paste to the nearest void is about 150 µm. The total volume percentage of entrained air ranges from 2-6%, as compared to about 1.5% of entrapped air in a non-air-entrained concrete. The use of air-entrained concrete is standard practice in any environment that may experience freezing weather, and air entrainers are probably the most commonly used chemical admixture.
Effect of hydration temperature The temperature at which cement paste or concrete is cured affects not only the rate of
hydration but also the morphology of the hydration products. At higher temperatures the C-S-H gel phase contains fewer gel pores and thus occupies less volume within the paste. This increases the capillary porosity, since the capillary porosity is essentially the volume of the mix water not filled in by the hydration products. This has a negative effect on the properties, for example a higher permeability and a lower strength. These effects only become important when the temperature exceeds about 40˚C (104˚F). This happens more frequently than might be expected, because the exothermic nature of cement hydration causes the interior of large concrete structures to be significantly hotter than the environment around them. It is well
63

established that concrete cured in hot summer weather is inferior to concrete made in cooler weather.
Carbonation of cement paste In any concrete structure exposed to the air, the cement paste will react with carbon
dioxide to form a new solid phase, calcium carbonate. This reaction, called carbonation, usually does not directly harm the cement paste, but under some circumstances it can lead to degradation of concrete by encouraging the reinforcing steel inside the concrete to corrode (i.e. rust). The carbonation reaction occurs between dissolved ions in the pore fluid, and can be written as:
2CO3- +Ca+2 ⇒ Ca(CO3)2
Dissolved ions Solid 5.9
The source of the CO3
- ions is atmospheric CO2 gas, while the Ca+2 ions come from the CH and the C-S-H. Since calcium carbonate is less soluble than CH and C-S-H, and there is an unlimited supply of CO2 in the air, reaction 5.9 could theoretically consume all of the CH and remove all the calcium from the C-S-H. In practice this does not happen because not all of the hydration products are exposed to the pore solution. In addition, the calcium carbonate densifies the cement paste near the exposed surfaces, sealing off the capillary pore system. This prevents dissolved CO2 from penetrating deeper into the concrete, and increases the strength of the concrete at the surface. Thus a concrete structure in the field will typically have a carbonated surface layer with a thickness ranging from a few mm to a few cm, but little carbonation in the interior. The depth of carbonation is greater when the capillary porosity is greater, since the pore system takes longer to seal off.
Another effect of carbonation is to remove alkalis from the pore fluid, causing the pH of the paste to decrease. If the carbonated region penetrates far enough into the concrete to reach the reinforcing steel, then this decrease in pH allows the steel to rust, causing serious problems with the entire concrete structure. Thus it is critical to always ensure that the reinforcing steel in concrete is placed deep enough to protect it from carbonation.
When scientists perform research on cement and concrete they often use very small specimens, sometimes less than 1 mm in thickness. Specimens of this size will carbonate rapidly if exposed to the air, often negatively affecting the experiment. Carbonation can be minimized by storing specimens in tightly sealed containers filled with pure nitrogen instead of air.
5.8 The pore system of cement paste
The pore system of cement, which can be defined as the space within the paste that is not occupied by a solid phase, is, along with the C-S-H gel, the most important phase in terms of controlling the properties of concrete. Cement paste contains pores with a wide range of sizes, and different properties are controlled by pores in different size ranges. These relationships are summarized in Table 5.2. An important thing to keep in mind is that the pores
64

in cement paste can be filled with either pore fluid or with air, depending on their size and on the relative humidity of the surrounding environment. The smallest pores remain saturated except under extremely dry conditions, while the largest voids and pores are easily emptied, and may empty and refill on a daily basis as the relative humidity of the air fluctuates.
One of the most important roles of the pore system is a negative one: it provides an access route for dissolved ions to enter or leave the concrete. This can result in a variety of chemical reactions that weaken and damage the concrete over time. The best way to avoid or minimize these damaging reactions is to reduce the porosity, by using a low w/c ratio to mix the concrete and by curing the concrete fully. 5.8.1.1 Classification of pores
A typical pore size distribution for hardened cement encompasses a large range, extending from about 10 µm to as small as 0.5 nm or less in diameter (see Table 5.2). The larger pores, ranging from 10 µm to 10 nm, are the residual unfilled spaces between cement grains, earlier defined as capillary pores. The finest pores, ranging from approximately 10 nm to 0.5 nm, are called gel pores since they constitute the internal porosity of the C-S-H gel phase. While this is certainly a useful distinction, it should be kept in mind that the sizes of capillary and gel pores overlap, and the spectrum of pore sizes in a cement paste is continuous.
Internal features with dimensions of 0.5 nm or smaller are formed by the interlayer spaces of C-S-H gel. Water located in these features is not in the liquid, so these are not true pores as defined for cement paste. Voids greater than 10 μm often exist in concrete, either from the unintentional entrapment of air during the mixing procedure, or from intentional air-entrainment, which purposefully disperses air voids of approximately 50 μm in diameter throughout the paste to relieve pressures induced from the freezing of water in pores.
Table 5.2. Classification of pores and features in concrete (with data taken from [xxx]).
Type of Pore
Description Size Water Techniquea Properties
Large 10 μm – 50 nm Evaporable
Bulk water SEM, OM
Permeability, strength
Capillary Pores
Medium 50 – 10 nm Evaporable
Moderate menisci SEM
Permeability, strength, shrinkage
(high RH)
Small 10-2.5 nm Evaporable
Strong menisci
Adsorption/
MIP/IS
Shrinkage (to 50% RH)
Gel Pores
Micropores 2.5-0.5 nm
Non-evaporable
-No menisci
-Intermolecular interactions
Adsorption/
MIP/IS
Shrinkage, creep
(35-11% RH)
65

Interlayer Spaces
Structural < 0.5 nm Non-evaporable
-Ionic/covalent bond
Adsorption/
Thermal
Shrinkage, creep
(< 11% RH)
ITZ 20-50 μm Bulk Water SEM/OM Permeability, strength Other
Features Microcracks 50 - > 200 μm Bulk Water SEM/OM Permeability,
strength
a SEM: scanning electron microscopy; OM: optical microscopy; IS: impedance spectroscopy.
5.8.1.2 Composition of the pore fluid
Once cement is mixed with water and starts to hydrate, every element that is present in the cement can also be found in the form of dissolved ions in the pore solution. The concentrations of these dissolved elements vary widely. Table 5.3 lists the measured concentrations of different elements in the pore solution of an OPC paste. This data was generated by squeezing the pore fluid out of the paste using a hydraulic press and then analyzing it with a sensitive instrument called a plasma spectrometer. Other elements, such as iron and magnesium, would also have been present in very low concentrations but were not measured.
Table 5.3. Elemental concentrations in the pore solution of a 7 day old OPC paste.
Concentrations are given in mM = millimoles per liter. (Data taken from [xxxi]).
Element Concentration (mM)
Sodium (Na) 271
Potassium (K) 125
Sulfur (S) 10
Calcium (Ca) 1.8
Silicon (Si) 0.25
Aluminum (Al) 0.21
One might expect that the concentrations in the pore solution would reflect the relative
abundance of the elements in the cement, but, as can be seen from Table 5.3, this is not the case at all. Once the solid hydration products start to precipitate out of the solution (a few minutes after mixing), the concentrations of the elements will depend on the intrinsic solubility of these new phases, not on the total amount of the element that is present in the paste. Thus, for example, silicon, aluminum, and iron are all significant components of cement but are found only in very low concentrations in the solution since the solubilities of the hydration products containing these elements are rather low.
66

On the other hand, the alkalis (sodium and potassium), are present in very high concentrations in the pore fluid (see Table 5.3) because solid phases containing these elements have a very high solubility. In fact, in most cement pastes no hydration products containing alkalis ever precipitate, so the concentration of alkalis just keeps increasing over time. As a result, a cement pore solution is, to a first approximation, just a strong alkaline solution. Because the dissolved alkali ions have a positive charge (i.e. Na+ and K+), the water in the pore solution must generate hydroxyl ions (OH-) in order to maintain charge balance. This causes the pore solution to be very basic (the opposite of acidic), with a pH of about 13. By keeping the pH of the pore solution high, the alkalis in cement prevent the main hydration products, particularly CH and C-S-H, from dissolving and thus help to protect concrete from deterioration.
While the non-alkali elements in the pore solution do not play an important role in the performance of concrete, their relative concentrations can be analyzed to provide information about the solid phases present in cement paste under different conditions. This is discussed in the optional Section Error! Reference source not found.. 5.8.1.3 Physical state of water in cement paste
The process of hydration can be thought of as the progressive conversion of free (liquid) water in the capillary pores into bound water in the solid hydration products. If all of the hydration products were in the form of relatively large crystals, then to a good approximation the water could simply be divided into bulk liquid water and structural (chemically bound) water. However, the case for cement paste is much more complicated. While all of the hydration products do contain chemically bound water, the C-S-H gel phase also contains significant amounts of free and adsorbed water in its gel pores, and holds more tightly bound water within its interlayer or interparticle spaces. The water in cement paste that is not bound into the solid phases is an important phase in its own right that is involved in important properties such as ionic transport, drying shrinkage, and creep. At least four physical states of water in cement paste can be defined:
Chemically bound water: This is “water” that has undergone a change in chemical bonding as it is incorporated the hydration products and is no longer in the form of H2O. A good example is the calcium hydroxide (CH) phase. Chemically bound water cannot be removed by drying the cement paste, only by heating the paste to a high temperature to decompose these phases.
Interlayer/Interparticle water: The C-S-H gel contains a certain fraction of water that is tightly bound into its structure, but is still in the form of H2O molecules. This water can only be removed by severe drying, such as vacuum drying.
To more fully describe the location of this water within the C-S-H gel requires a description of the nanometer-level structure of C-S-H gel, but this structure is not completely agreed on at present. The C-S-H gel was originally hypothesized to have layered microstructure, analogous to naturally occurring C-S-H minerals such as tobermorite, and “interlayer” water molecules would be tightly held between these layers. More recent analysis of C-S-H gel has indicated that the structure is actually based on very small particles about 5 nm in size that are randomly agglomerated into larger structures. Models based on these observations consider interlayers to be present within these tiny particles but not at larger scales. However, “interparticle” water held between closely packed C-S-H particles would have
67

the same physical characteristics as interlayer water. Aspects of the various models of C-S-H gel will be discussed in Chapter 8. Adsorbed water: The water within a few molecular distances of a pore surface has very different properties than bulk liquid water. The first layer of molecules is physically adsorbed on the surface, while the next few layers are aligned in a non-random way due to the polar nature of the water molecule. In the larger capillary pores the fraction of this “surface water” is negligible and on average the water maintains the properties of the bulk liquid. As the pore size decreases to the order of nanometers (as with gel pores) the surface water becomes a significant fraction of the total water content. As a result, the average physical properties of gel water such as density, viscosity, dielectric constant, and conductivity often differ from those of bulk water. Perhaps most importantly, the rate of diffusion of surface water is significantly lower than that of bulk water. This reduced mobility has been postulated to play important roles in the mechanisms of creep and of drying shrinkage at low humidity.
Bulk liquid water: Only the remaining water not described above, which exists away from the pore surfaces, has the characteristics of bulk water. This water exists primarily in the capillary pore system. Bulk water can move in and out of the paste rather easily in response to changes in the relative humidity of the environment. 5.9 The Powers-Brownyard volumetric model of cement hydration
This model for determining the general distribution of solid and pore phases in a hydrated paste was developed by Powers and Brownyard, who were leading cement researchers, in the 1940s [xxxii,xxxiii]. The individual hydration products are not distinguished, but are considered as a single phase with a characteristic density and internal gel porosity. This is clearly a simplification, but it is justified on the basis of the relatively small differences in the mineral composition of ordinary Portland cements. The model also assumes that the initial and final volumes of a cement paste are equal, which is close enough to true to make no difference. In order for a cement paste to hydrate fully to α = 1, there must be enough water to react all of the cement, and there must be enough space for the hydration product to form. The Powers-Brownyard model can be used to estimate the minimum w/c value required for complete hydration based on each of these two criteria.
The first step is to determine the degree of hydration of the cement, which varies between 0 initially and 1 for complete hydration of the cement. The degree of hydration is proportional to the amount of water that has been chemically combined into the hydration products, which can be determined by measuring the “non-evaporable water”. A small sample of hardened paste (not concrete) is crushed into small pieces and then dried to remove the liquid or “evaporable” water. After weighing, the sample is ignited by heating it to 1050˚C and then weighed again. At this temperature the hydration products decompose and the non-evaporable water is driven off, essentially returning the specimen to the original cement composition. The degree of hydration, α, is estimated as
α =wn
0.24 5.8
68

where wn is the weight of non-evaporable water divided by the weight of the ignited sample. As a paste hydrates, the volume of hydration product (including gel porosity) increases
and the volume of capillary porosity decreases. The w/c of the paste determines the amount of space available for hydration product to form. At higher w/c the cement can completely hydrate leaving residual capillary porosity. At lower w/c the capillary porosity will fill up before all of the cement has reacted, stopping hydration prematurely. Separating these conditions is a critical w/c value that provides just enough space for all of the cement to react with no leftover capillary porosity. This value was determined experimentally by Powers and Brownyard to be w/c = 0.38 [xxxii]. At this w/c, the fully hydrated specimen consists of only hydration product, and so the volume of hydration product is equal to the initial volume of cement and water. Assuming that the specific volume of Portland cement is 0.32 cm3/g, this gives a value of vhp= 0.70 cm3 of hydration product per gram of starting cement. This value of vhp is independent of the w/c of the paste, and will scale linearly with the degree of hydration, giving the following general formulas:
vhp = 0.70α cm3
g starting cement or vhp =
0.70α0.32 + w /c( )
cm3
cm3 paste 5.9
In the original model, the amount of gel water was defined as the amount of evaporable water in a fully hydrated specimen of w/c = 0.38, which was measured to be vgel = 0.21 g/g starting cement. Assuming that the gel pore water has a specific volume of 1 cm3/g, this gives the formulas
vgel = 0.21α cm3
g starting cement or vgel =
0.21α0.32 + w /c( )
cm3
cm3 paste 5.10
It should be noted that vacuum or oven drying a paste removes not only liquid water but also some of the water held in the structure of the C-S-H gel and aluminate phases. Thus eq. 5.10 will give gel pore volumes that are somewhat larger than the amount of liquid water trapped inside the C-S-H gel phase. The volume of unreacted cement in a paste is:
vcem = 0.32 1−α( ) cm3
g starting cement or
vgel =
0.32 1−α( )0.32+ w /c( )
cm3
cm3 paste 5.11
By definition, the volume of capillary porosity is vcap = vtot – vhp – vcem. Using eqs. 5.9 – 5.11 gives:
vcap = w /c − 0.38α cm3
g starting cement or
vcap =
w /c − 0.38α0.32+ w /c( )
cm3
cm3 paste 5.12
Using a value of α = 0.95, we can compare the results of the Powers-Brownyard model with the calculated phase distributions for a specific cement composition shown in Table 5.1. Using the versions of eqs. 5.9 – 5.12 on the right (normalized to paste volume) gives:
vhp = 86.4% vgel = 25.9% vcem = 2.1% vcap = 11.6%
69

The corresponding values given earlier in Table 5.1 are: vhp = 85.9% vgel = 21.0% vcem = 3.3% vcap = 10.7%
Agreement is reasonable, with the exception of the gel porosity. In Table 5.1 the gel porosity includes only liquid water trapped in the C-S-H gel, so this is expected.
70

6 The pore structure and surface area of cement paste
6.1 Overview
All of the engineering properties of cement and concrete are related in some way to the porosity, and characterization of the pore system is often a better predictor of performance than characterization of the solid phases. However, characterizing the porosity of hydrated cement paste is difficult. Because of the large range of pore sizes (from a few nanometers to tens of micrometers), no single technique can adequately characterize all of the important components of the pore system. Most standard techniques require that the pore fluid be removed, but such a drying pretreatment can sometimes significantly alter a porous structure. Therefore, measurements performed on dry paste may give an inaccurate picture of the porosity of cement paste under the conditions of its actual use.
There are three general parameters of interest in the pore system: the total porosity, the pore size distribution, and the specific surface area. The specific surface area, which is the area of the interface between solid phases and the pore system per unit amount of material, is of particular importance for cement research because it arises almost entirely from the low-density C-S-H gel, the most important (and difficult to analyze) phase in cement paste. Experimental techniques for characterizing the pore system can be divided into two categories: those that involve the intrusion of a fluid into the pore system (pyknometry, mercury intrusion, gas sorption), and those that use particles or fields to probe the material (small-angle scattering, NMR). The latter category has a significant advantage, in that the specimen does not need to be dried. However, these "modern" techniques require highly specialized equipment and the data are more difficult to interpret.
Measurement of the specific surface area is by far the most commonly performed analysis of cement paste pore systems. Values reported for surface area in the literature vary over two orders of magnitude, depending on the technique used and the interpretation of the results. Despite this variability, surface area measurements are still performed. This fact attests to the utility of having a single parameter such as surface area that describes the overall fineness of the microstructure on a nanometer scale, and that correlates closely to important properties such as durability and drying shrinkage. Thomas et al. [xxxiv] have reviewed the application of different techniques to measuring cement paste surface area.
The variability of the specific surface area is related to a number of factors, some of which are listed below in approximate descending order of importance: 1) Difficulties with data analysis. Modern techniques, namely small angle scattering and NMR,
provide important insights into the microstructure and pore system of cement-based materials. However, obtaining quantitative surface area values from these techniques is difficult due to the many models and assumptions needed to convert the raw data. The first reported surface area values for small-angle x-ray scattering and for NMR were both extremely high (several hundred m2g-1). Refinements of the data analysis and improved experimental calibration methods have brought more recently published values into better agreement with other techniques.
2) Specimen preparation. As noted above, gas sorption requires that the paste be dried, and this affects the pore system. The difference in values for the surface area obtained (1) by
71
nitrogen sorption (SN2) after severe drying (such as oven drying) and (2) after solvent
exchange, which preserves the pore structure, can approach an order of magnitude. 3) Normalization of the surface area value. Gas sorption results are reported as surface area
per weight of dried paste, the unit for small-angle scattering is area per sample volume, and NMR results are generally reported as area per weight of starting cement powder. Results from any technique are occasionally reported as area per weight of ignited paste. This can generate numerical differences of up to a factor of two, making comparisons difficult. It is possible to make an approximate conversion from one type of units to another using hydration models and known properties of cement paste. Results reported here are converted to area per grams of D-dried paste where needed, following the approach of Thomas et al. [xxxiv].
4) Analytical sensitivity. Some techniques may probe features of the internal C-S-H structure not associated with the surface area, while others do not measure the full surface. It is difficult to deconvolute these effects from issues associated with data analysis (factor 1 above). On the other hand, these real differences in measured surface area have provided important clues regarding the C-S-H gel phase. When the above factors are taken into account, surface area measurements are a useful
way to characterize cement. The specific surface area varies with the age of the paste, the water/cement ratio, the cement composition, and other processing variables, which determine the amount of finely divided hydration product in the material. Due to the above issues, these effects are best observed using a single measurement technique and method of sample preparation.
Another, more philosophical difficulty associated with surface area measurements of cement paste is defining what exactly is meant by the cement surface. The C-S-H phase has an extremely high specific surface area, and the total surface area of cement paste is essentially equal to that of its C-S-H component. In addition to the liquid water within the internal gel pores, the C-S-H in cement also contains strongly adsorbed and interlayer/interparticle water as part of its internal structure. This creates a basic uncertainty in defining the boundary between solid and pores. A satisfactory measurement of surface area for cement paste would include the gel pores, which contribute to the transport of reactive species through cement paste, and would exclude any features of the internal solid C-S-H structure that do not contribute to ionic transport. It is not clear, however, that there is a distinct structural separation between these types of features. As noted above, differences in the specific surface area that arise from different curing conditions, different sample preparation methods, and different measurement techniques all provide important information about the nature of the C-S-H gel in cement paste.
6.2 The physical state of water in cement paste
6.2.1 Drying procedures and the water content of C-S-H gel A good measure of how tightly a water molecule is bound into a structure is how difficult it
is to remove by drying. If the water vapor pressure above liquid water with a flat surface is maintained below 100% RH, then by definition the water will evaporate. However, when liquid water is contained in a small pore the surface is no longer flat but forms a curved meniscus, and the water will not evaporate until the humidity above its surface reaches a lower RH. The smaller the pore, the lower the RH required to empty it. Water held in the C-S-H gel pores will
72

only evaporate at RH values on the order of 50% or lower, and this is a justification for considering this water to be part of the solid hydration products in some sense.
The C-S-H gel in a fully saturated state is generally assumed to have the composition 1.7C . S . 4H, including water in the gel pores. This water content can also be described as a molar H/S ratio of 4. This composition must necessarily vary, however, because the low-density form of C-S-H gel has much more gel porosity than the high density form, and different pastes have different ratios of the two forms. For example, the relative amount of gel water would be expected to decrease with the age of the paste and with decreasing w/c.
The water in a cement paste is commonly separated into “evaporable” (water that is removed by a standard drying treatment) and “non-evaporable” (water or hydroxyl groups still present after drying). As was discussed in Section 5.4, the non-evaporable water content can be determined by first removing the evaporable water and then heating the specimen to a temperature high enough to decompose the bound water (typically 1050˚C) and measuring the resulting weight loss. From this, the degree of hydration of a portland cement paste can be estimated from eq. 5.8. The same type of procedure can be used to determine the water contents of a specimen of pure C-S-H gel. Such a specimen can be obtained by removing the CH from a fully hydrated C3S paste.
The standard drying procedure for removing the evaporable water from a specimen is “D-drying,” which is vacuum drying to the equilibrium vapor pressure above ice at –79˚C (~ 6.7 x 10⁻² Pa). D-drying is performed by crushing the paste and then placing it into a sealed vessel that is evacuated by a rotary vacuum pump. The line connecting the pump to the vessel passes through a glass tube that contains water ice and is packed in dry ice (solid CO2) to reach the specified low temperature. This procedure was developed as a slightly less severe treatment than straight vacuum drying that would leave some of the most tightly-bound water. After D-drying, C-S-H gel has a composition of 1.7C . S . 1.4H (H/S = 1.4). D-drying removes all of the gel water and also some of the interlayer and interparticle water.
D-drying can be approximated by the simpler and more rapid procedure of oven drying at 105°C if the only purpose is to measure the amount of evaporable water. Oven drying has other effects on the sample, such as internal reactions and carbonation, that make it inappropriate if any chemical or microstructural analysis of the dried specimen is to be performed.
A less severe drying procedure is to equilibrate the specimen to 11% RH. This is an accepted method of removing most or all the pore water while leaving more tightly bound water in place. There is no special physical meaning associated with the precise value of 11%; it is simply the humidity level above a saturated solution of a common salt, LiCl. After drying to 11% RH the composition of C-S-H gel is 1.7C . S . 2.1H (H/S = 2.1). Some of the water remaining at this composition is probably adsorbed within the smallest gel pores.
6.2.2 Direct measurement of the state of water in hydrating paste Because of the microstructural changes that occur on drying, there are considerable
advantages to techniques that can analyze cement paste in a saturated state. Two important categories of these are neutron scattering techniques and nuclear magnetic resonance (NMR) techniques. Recently, a technique called quasi-elastic neutron scattering (QENS) has been used to analyze the physical state of water in hydrating cement and C3S pastes [xxxv,xxxvi]. While the equipment and data analysis are rather complex, the basic idea is actually quite simple. When a beam of neutrons passes through a specimen, some of the the neutrons collide
73
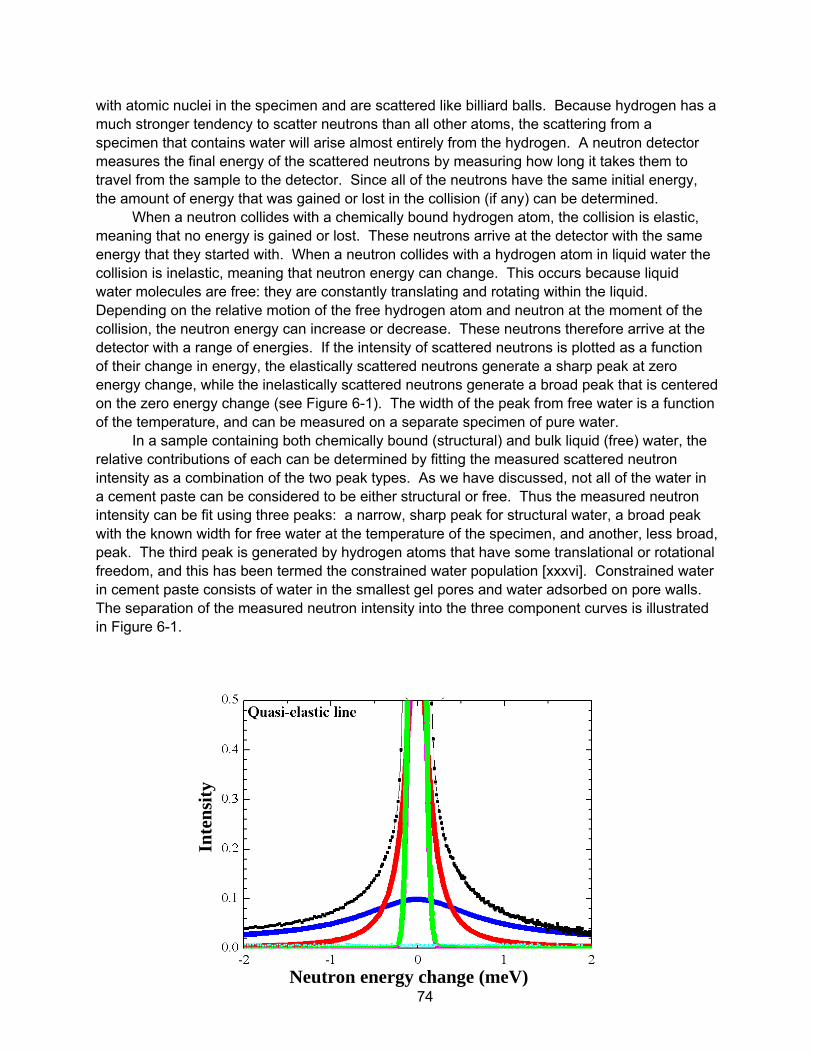
with atomic nuclei in the specimen and are scattered like billiard balls. Because hydrogen has a much stronger tendency to scatter neutrons than all other atoms, the scattering from a specimen that contains water will arise almost entirely from the hydrogen. A neutron detector measures the final energy of the scattered neutrons by measuring how long it takes them to travel from the sample to the detector. Since all of the neutrons have the same initial energy, the amount of energy that was gained or lost in the collision (if any) can be determined.
When a neutron collides with a chemically bound hydrogen atom, the collision is elastic, meaning that no energy is gained or lost. These neutrons arrive at the detector with the same energy that they started with. When a neutron collides with a hydrogen atom in liquid water the collision is inelastic, meaning that neutron energy can change. This occurs because liquid water molecules are free: they are constantly translating and rotating within the liquid. Depending on the relative motion of the free hydrogen atom and neutron at the moment of the collision, the neutron energy can increase or decrease. These neutrons therefore arrive at the detector with a range of energies. If the intensity of scattered neutrons is plotted as a function of their change in energy, the elastically scattered neutrons generate a sharp peak at zero energy change, while the inelastically scattered neutrons generate a broad peak that is centered on the zero energy change (see Figure 6-1). The width of the peak from free water is a function of the temperature, and can be measured on a separate specimen of pure water.
In a sample containing both chemically bound (structural) and bulk liquid (free) water, the relative contributions of each can be determined by fitting the measured scattered neutron intensity as a combination of the two peak types. As we have discussed, not all of the water in a cement paste can be considered to be either structural or free. Thus the measured neutron intensity can be fit using three peaks: a narrow, sharp peak for structural water, a broad peak with the known width for free water at the temperature of the specimen, and another, less broad, peak. The third peak is generated by hydrogen atoms that have some translational or rotational freedom, and this has been termed the constrained water population [xxxvi]. Constrained water in cement paste consists of water in the smallest gel pores and water adsorbed on pore walls. The separation of the measured neutron intensity into the three component curves is illustrated in Figure 6-1.
Neutron energy change (meV)
Inte
nsity
74
Figure 6-1: QENS signal from a hydrating cement paste, along with the three fitted curves for bound, liquid, and constrained water.
The water content of the C-S-H gel in C3S pastes hydrated for 2 days was determined
from the QENS water distribution [xxxvi]. If only the structural water is considered, the formula is 1.7C . S . 1.6H ( H/S=1.6). This is slightly higher than the value of H/S = 1.4 measured for C-S-H gel after D-drying, suggesting that the structural water measured by QENS includes both interlayer and chemically bound water. When the constrained water population is included, the H/S ratio increases to 2.7. This is higher than the value of H/S = 2.1 measured for C-S-H dried to 11% RH, which may indicate that the constrained water population measured by QENS includes more of the water in small gel pores.
Because QENS measurements can be conducted in situ, without disturbing the reaction process, changes occurring during the early, rapid hydration stage can be monitored. Since the hydration process proceeds by converting liquid (free) water into structural and constrained water, the progress of hydration can be measured using a bound water index (BWI) that will be proportional to the degree of hydration:
BWI = HS + HC
HS + HC + HF
6.1
where HS, HC, and HF are the amounts of structural, constrained, and free water. Figure 6-2 shows the BWI of a C3S paste during the first 48 hours of hydration at three different temperatures. The accelerating effect of temperature on the early hydration rate is clear. Results were also obtained for Portland cement paste (not shown). The kinetics were similar, but the BWI was slightly higher due to water bound into the calcium sulfoaluminate phases.
0
0.2
0.4
0.6
0.8
40oC
30oC
0 10 20 30 40 5
Bou
nd W
ater
Inde
x
Hydration time (hours)
20oC
0
Figure 6-2: BWI of C3S pastes with w/c = 0.5 hydrated at 20˚C, 30˚C, and 40˚C, after [xxxvi].
75
It also interesting to compare the kinetics of formation of the individual populations of structural and constrained water. As shown in Figure 6-3, these are quite different. The constrained water population increases rapidly during the first 10 hours and then levels off, while the structural water exhibits a more gradual and continuous increase. The formation of structural water follows the same kinetics as the heat of hydration measured by thermal calorimetry (also shown in Figure 6-3).
0.0
0.2
0.4
0.6
0.8
1.0
0 10 20 30 40 50
Structural water
Constrained water
Heat evolved
Frac
tion
of 2
-day
val
ue
Hydration time (hrs) Figure 6-3: Normalized plots of structural water, constrained water, and cumulative heat of hydration as a function of hydration time for cement paste hydrated at w/c = 0.5 and 30˚C, after [xxxvi].
Why do constrained and structural water form with different kinetics? The constrained
water is located in the gel pores so it can be associated almost exclusively with the low-density C-S-H, whereas both low- and high-density C-S-H contain structural water. Thus the relative kinetics of formation of the constrained and structural water shown in Figure 6-3 reflect the different kinetics of formation of the two types of C-S-H gel. This indicates that the H/S molar ratio for bound water in the C-S-H gel, which was determined to be 2.7 after 2 days of hydration, would be expected to decrease with further hydration, perhaps dropping to near the value of 2.1 associated with drying C-S-H gel to 11% RH.
6.3 Pyknometry (pore volume) measurements of cement paste
Pyknometry measures the porosity of a specimen by simply measuring the volume of fluid that will intrude into the material. The resulting value will account for all porosity that the particular fluid can enter. The measurement will not include pores with entrances that are too small or constricted for the particular molecule, pores that are not connected to the surface through other pores, and pores that are not empty. For cement paste, the porosity is most easily obtained by measuring the loss of mass when a saturated paste is dried by heating to 105°C or vacuum drying, and then assuming that all of the water in the paste had a volume of 1
76
g/cm3. A true pyknometric measurement, obtained by resaturating a dried specimen with water, gives the same result. However, this measurement (previously defined as the evaporable water content), is known to overestimate the true porosity. This is because some of the water that is removed is bound into the internal structure of the C-S-H gel and, to a lesser extent, the aluminate phases, and therefore does not represent true porosity.
When other fluids, such as helium, nitrogen, or methanol, are intruded into well-dried specimens the measured porosity results are lower than with water. This occurs because these molecules do not replace the most tightly bound evaporable water that is lost at the end of the drying treatment. This is verified by the fact that when pyknometry is performed after partial drying, water, helium, and alcohols all give the same result [xxxvii]. For example, the pore volume obtained on original drying to 11% RH and that obtained by the subsequent ingress of water or other suitable fluids is the same, and is called the “free water porosity” [xxxviii]. This parameter should be interpreted with caution, however, as some of the water left in the specimen at 11% RH may be in liquid form, i.e. in very small pores. It is probably best to consider the evaporable water content and the free water porosity defined above to be upper and lower bounds, with the true pore volume somewhere in between.
At the time of mixing, the evaporable water content and the free water porosity are both equal to the sum of the mix water volume and the volume of entrained air. As would be expected, both parameters decrease with the age of the paste and increase with the w/c ratio. Table 6.1 lists reported values for mature cement pastes with different w/c.
Table 6.1. Free water porosity and evaporable water content of mature OPC pastes with different w/c [xxxvii].
w/c
Porosity at mixinga
(vol%)
Free Water Porosity
(vol%)
Evaporable water (vol%)
0.4 56.0 23.3 37.8
0.5 61.4 34.5 44.8
0.6 65.6 42.1 51.0
0.8 71.8 53.4 58.7 a Calculated from w/c, ignoring entrained air.
6.4 Application of mercury intrusion porosimetry to cement paste
Mercury intrusion porosimetry (MIP) is one of two methods commonly used to measure a pore size distribution in cement paste, the other being gas sorption. As with pyknometry, MIP measures porosity by entering into the (dried) pore system. However, pyknometry uses liquids that wet the surface of cement and thus enter the pore system spontaneously, whereas mercury does not wet the paste and will only enter the pore system if it is forced in by an external pressure. The advantage of this is that the pressure required increases as the size of the pore decreases. A plot of intruded volume of mercury as a function of the external pressure thus gives an indication of the pore size distribution (how the total porosity is distributed among
77
different size pores). MIP is complimentary to gas sorption (discussed in the next section) in the sense that MIP measures more of the large (capillary) porosity while gas sorption measures the finest pores more accurately. The two techniques do not agree within their region of overlap, however. As summarized by Taylor [xxxviii] there are serious problems with the application of MIP to cements:
1) The method measures the size of the pore entrances, not the pore itself. When a large pore can only be accessed through a small opening, the entire volume accessed is registered as small porosity. This has been shown to generate serious errors for cement paste [xxxix,xl].
2) Data analysis assumes cylindrical pores and a constant contact angle; these assumptions are not strictly correct for cement paste.
3) The drying treatment changes the pore structure. This is also true for other techniques, notably gas sorption. As with gas sorption, exchange with alcohol prior to drying preserves the structure to some extent.
4) The fine structure is damaged by the large stresses needed to intrude the mercury.
5) The coarsest part of the porosity (the largest capillary pores) is not fully registered.
Because of these issues, the pore-size distribution measured by MIP is very different from the true value for a saturated pore system, particularly at the coarsest and finest ends of the distribution. MIP does provide self-consistent results, however, registering useful differences for pastes of different ages and w/c ratios. The total intruded volume decreases with age and the distribution shifts sharply to smaller pore sizes during the first 7 days of hydration. MIP has also been used to measure differences in the pore systems of cement and concrete arising from a more porous interfacial transition zone (see Section 5.6.5) surrounding individual aggregate particles [xli].
6.5 Application of gas sorption to cement paste
6.5.1 Introduction Gas sorption is the oldest and most widely used technique for measuring the surface area
of cement paste, and it is by far the technique with the most published results. Gas sorption can also provide a pore size distribution of the finer pores (<30 nm). Issues associated with drying of cement paste are particularly important for gas sorption, and methods of drying cement paste are discussed in this section as well. The physics and applications of gas sorption techniques are covered in a book by Gregg and Sing [xlii]. Rarick et al. [xliii] reviewed the application of the gas sorption method to cement paste.
The basic concept behind the gas sorption technique is to adsorb a monolayer of gas molecules onto the internal surface of a material. The surface area is then given by
S = Nmσm 6.2
where S is the specific surface area, Nm is the number of gas molecules in one monolayer, � is the cross-sectional area of a gas molecule, and m is the mass of the specimen. An important
78
characteristic of this technique is that the pores must be empty of liquid and the specimen must be pretreated to remove adsorbed gas molecules before starting the measurement. For cement paste, this requires removing the water from the C-S-H gel pores - a major disadvantage because of the resulting changes to the C-S-H gel structure.
A gas sorption measurement is conducted by introducing increasing amounts of the sorptive gas into a chamber containing the dried specimen, which is initially under vacuum. The amount of gas that is adsorbed onto the internal surface of the specimen is measured by measuring either the increase in the specimen weight due to the adsorbed molecules or the decrease in pressure as the adsorbed molecules leave the gas phase. The resulting data, in the form of a plot of gas adsorbed as a function of chamber pressure, is called a sorption isotherm. The sorption isotherm is analyzed to determine the amount of adsorbed gas corresponding to a monolayer, from which the specific surface area is readily calculated using eq. 6.2. In some cases the corresponding desorption isotherm is also measured by removing the gas from the chamber until the pressure drops back to the vacuum state. Differences between the sorption and desorption isotherms, called hysteresis, provide information about how the adsorption process is occurring.
Most published gas sorption measurements of the surface area of cement paste have used either water vapor or nitrogen as the sorptive gas. To perform the measurement using water vapor requires a series of sealed vessels, each containing a reservoir of a saturated solution of a different salt and thus a characteristic RH (water vapor pressure) inside. The dried specimen is placed into the sealed vessels (above the salt solution) in order of increasing RH and allowed to equilibrate, and the adsorption of water is measured by weighing the specimen. This is called the gravimetric method. Equilibrium is approached very slowly, and thus this procedure can take several weeks. Surface area measurements using nitrogen sorption are performed using automated equipment that measures the change in pressure when a known amount of gas enters the specimen chamber. This volumetric method provides much faster results with less labor. Recently it has also become possible to perform water vapor measurements using the volumetric method. However, these measurements give lower values than the gravimetric method suggesting that equilibrium is not obtained [xliv].
As is the case with the total pore volume measured by pyknometry (Section 6.2), the surface area values obtained with water vapor are generally much higher than the values obtained using nitrogen or other gases. This is discussed in Section 6.5.2, following a short discussion of how cement paste is prepared for a gas sorption measurement.
As mentioned above, one of the limitations of the gas sorption technique for application to cement paste is the requirement that the specimen be dried. There are two general problems associated with the drying pretreatment. First, any pores that remain filled with water due to incomplete drying will not be accessed by the adsorbate molecules and will not be included in the surface area measurement. This can be a more serious issue than it first appears, because the smallest pores, which have the highest surface area per unit volume, are the last to empty during drying. The last few percent of the porosity to empty might account for half the surface area. Nevertheless, complete drying can be ensured through proper experimental procedure, so this is generally not a problem.
The second, and more serious, problem is that the drying process changes the C-S-H structure. Different drying techniques cause different changes to the C-S-H, and surface area results from gas sorption vary rather widely depending on the drying treatment. For cement paste, the simplest techniques for removing the water in preparation for a gas sorption
79
measurement are oven drying at 105°C and vacuum drying using a rotary pump. Although these techniques effectively remove all of the evaporable water, they also damage the specimen. To minimize this damage gentler drying techniques have been developed. The most common of these is D-drying, which involves equilibrating the specimen to the pressure of water vapor at the temperature of dry ice. This is the standard preparation procedure for gas sorption, but the effects of D-drying on the C-S-H gel are still quite important.
A final point regarding specimen preparation is that the sorption measurement should be performed as soon as possible after drying is complete. If dried cement paste is stored for a long period of time before measurement, exposure to even small amounts of CO2 leads to carbonation of the C-S-H gel and significant decreases in the measured surface area.
6.5.2 Effects of specimen preparation and sorptive gas It is worth repeating at the start of this section that almost all of the specific surface area of
cement paste arises from the C-S-H gel. Small-angle scattering measurements suggest that all other phases contribute less than 5%, most of which come from the calcium hydroxide.
The surface areas of cement paste measured by sorption of nitrogen and of water vapor are usually quite different, with water vapor giving higher values. For well hydrated cement dried rapidly and completely to a D-dried state, water vapor gives about 200 m2 g-1, while nitrogen gives 50-140 m2 g-1, depending primarily on the w/c ratio [xxxiv]. Clearly water vapor is able to reenter extremely fine areas of the dried C-S-H gel structure that nitrogen cannot. Whether or not such areas represent true surface area (or true porosity) depends on the precise nature of the nanometer-scale morphology of the C-S-H gel, making this a highly relevant question.
The difference between nitrogen and water vapor surface areas was the subject of a vigorous debate in the literature in the 1960s and early 1970s. One point of view was that only the smaller water molecule could fully penetrate the smallest pores and thus measure the full surface area. Proponents of this theory hypothesized that the C-S-H gel contained many "ink-bottle" pores with entrances much smaller than their diameter, and that these entrances tended to be of a size that allowed water molecules to enter while excluding nitrogen. Others argued that water vapor was chemically or structurally re-incorporated into the C-S-H gel phase during the measurement, causing the water vapor results to be too high. The importance of these measurements and their interpretation to cement science can hardly be overstated. All of the influential models of the C-S-H gel structure that have ever been proposed, including quite recent models, are based at least in part on gas sorption data. These are covered in the next chapter (Chap. 8).
In trying to differentiate between the surface area values measured by water vapor and by nitrogen, it is useful to look at the pore volume that is accessed in each case, which can also be determined from a gas sorption measurement. Pore volume results for mature C3S, C2S, and OPC pastes obtained by gas sorption after D-drying are listed in Table 6.2. The total pore volume increases significantly with w/c in both cases, as would be expected. The apparent pore volumes accessed by nitrogen are significantly lower in all cases, and it is reasonable to conclude that this difference also accounts for difference in surface area. If the pore volumes in Table 6.2 (reported per gram of dry paste) are converted to volume percent by estimating the paste density, the values can be compared to the pyknometry values listed in Table 6.1. The water vapor values are in good agreement with the evaporable water content in Table 6.1
80

(which is essentially the same measurement). Interestingly, the nitrogen values from Table 6.2 are roughly similar to the free water porosity, which is obtained by drying to 11% RH.
Table 6.2 Pore volume of mature pastes as measured by water vapor sorption (VH2O) and nitrogen sorption (VN2), after [xlv,xlvi].
Type of Paste
w/c
VH2O
(cm3/g)
VN2
(cm3/g)
C3S 0.45 0.229 0.147
0.57 0.271 0.189
C2S 0.45 0.271 0.161
0.57 0.330 0.197
0.70 0.411 0.219
OPC 0.40 0.184 0.118
0.45 0.225 0.136
0.70 0.385 --
So why does water vapor penetrate the dried C-S-H gel so much better than nitrogen? It
is sometimes pointed out that a nitrogen molecule is larger than a water molecule, so the latter can fit into smaller pores. However, nitrogen gas sorption is widely used with good success to characterize many other colloidal and microporous materials that have surface areas comparable or greater than that of cement paste [xlii], so there is no general inability of nitrogen to penetrate fine structure. In addition, for many materials the surface areas measured by water vapor and nitrogen are similar, and for some materials the nitrogen value is higher. All of this suggests that water vapor has a special ability to penetrate into the C-S-H gel that is not just related to its size. This is supported by the data in Table 6.3, which lists the surface area of cement paste measured using different sorptive gases, along with their molecular size. Clearly, the surface area measured with water vapor is much higher than the trend observed with other molecules based on their size.
Table 6.3. Effect of the molecular size of the sorptive gas on the BET surface area of a mature OPC paste with w/c=0.4, after Mikhail and Selim [l].
Sorptive Gas Formula Cross-sectional Area (nm2)
Surface Area (m2 g-1 of dry paste)
Water vapor H2O 0.114 202.6
Nitrogen N2 0.162 79.4
Methanol CH3OH 0.181 62.5
81

C3H7OH 0.277 45.0
C6H12 0.390 44.5
At this point we should revisit the very important issue of the effects of drying on the
cement paste structure. When a liquid is removed from a porous solid, the interface between the liquid and air creates curved interfaces, called menisci, that exert stresses on the solid material. These so-called capillary stresses are proportional to the intrinsic surface tension of the liquid and inversely proportional to the radius of the pore being emptied. As drying proceeds, the stresses increase as the menisci enter smaller and smaller pores, until the menisci becomes unstable and collapse, relieving the stress. With water, this collapse occurs at 50% RH, when the menisci are in pores about 10 nm nanometers across. In cement paste. the capillary stresses occur primarily in the C-S-H gel phase, causing its fine pore system to collapse and decreasing the surface area measured by nitrogen. This effect is not constant, but depends on how the paste is dried. Of particular importance is the rate of drying. Faster drying, particularly in the relative humidity range near 50% where capillary tension forces are greatest, results in a higher measured surface area, whereas storage of the paste at RH values near 50% has the opposite effect [e.g. xlvii,xlviii]. The effect of drying rate created significant unexplained variability in the reported nitrogen surface area of cement paste in the early years of its application, contributing to the perception that nitrogen BET was an intrinsically variable technique.
Another step that is sometimes employed during preparation of cement paste specimens is solvent exchange. Before drying, the specimen is placed in a bath of a solvent having a low surface tension, thus allowing the pore water to exchange with the solvent. This removes the water with no stress. The solvent itself is then removed (using a standard method such as D-drying) generating little capillary stress due to the low surface tension and preserving the fine structure of the C-S-H gel. Cement paste specimens that are solvent exchanged have significantly higher surface area values measured with nitrogen [e.g. xlix,l], equal to that of water vapor in some cases. From this one might conclude that all measurements shouperformed following solvent exchange, thus eliminating confusion. In practice, however, solvent exchange generates a significant amount of experimental variation, and questions have been raised about chemical interactions between the solvent and the specimen. Furthermore, it will be shown that the standard nitrogen measurement is actually the most useful gas sorption measurement despite “missing” some surface area.
ld be
The difference in nitrogen and water vapor surface area can thus safely be attributed to the inability of nitrogen to enter the collapsed C-S-H gel structure. Why can water vapor go where nitrogen cannot? One important difference between the nitrogen and water vapor measurements is that the nitrogen measurements are conducted at 77 K and the water vapor measurements are conducted at room temperature (295 K). If the pore system of the solid is open enough for the gas to enter by normal gaseous diffusion, then the temperature is not important as this type of diffusion is nearly temperature independent. However, if the pore openings are close to the size of the gas molecules, then they must travel by activated diffusion. Activated diffusion is based on the kinetic energy of the gas molecule and is thus highly temperature dependent. Odler [xliv] has recently argued that any pores that must be entered by activated diffusion are essentially impassable by nitrogen molecules at 77 K.
82

The above discussion presents a satisfactory rationale for the difference in the surface area values measured by nitrogen and water vapor, but does not answer the question of which value is more correct. This depends on the definition of surface area. A defensible definition of surface area is the area of all solid features into which a gas molecule can fit. In this case water vapor is clearly more correct. However, in the case of cement paste this definition includes features that are not really pores. If one defines the specific surface area as the surface area of the pore system, and one further defines a pore in cement paste as something that is large enough to contain liquid water, then the bulk of the evidence indicates that nitrogen (performed after standard specimen preparation) underestimates the surface area by failing to enter some true pores, and that water vapor overestimates the surface area by entering all of the true porosity plus internal spaces in the C-S-H gel that are not true pores.
As discussed in the next section, it turns out that nitrogen sorption provides the more useful results, by varying in a sensible way with important curing parameters such as the w/c.
6.5.3 Effect of w/c, age, and curing conditions As previously discussed, the measured surface area value depends strongly on how the
specimen is prepared. In this section results are for crushed, D-dried paste unless otherwise specified.
6.5.3.1 Effect of w/c
Other than the absolute magnitude of the surface area value, the most important and striking difference between BET surface area values measured with nitrogen and water vapor is the effect of w/c (see Table 6.4). The surface area value measured by nitrogen increases dramatically, while that measured by water vapor is essentially constant. Table 6.4 also lists values measured by small angle neutron scattering, which increase with w/c but less dramatically than the nitrogen values.
Table 6.4. Effect of w/c on the surface area of cement paste, as measured by BET gas sorption with nitrogen and water on mature paste [l] and by small-angle neutron scattering (SANS) on 28 d old paste [li].
w/c H2O BET
(m2 g-1)
N2 BET
(m2 g-1)
w/c SANS
(m2 g-1)
0.35 208.0 56.7 0.35 99
0.40 202.6 79.4 0.40 100
0.50 194.6 97.3 0.45 106
0.57 193.8 132.2 0.5 123
0.70 199.6 139.6 0.55 132
0.60 147
The values are normalized to the mass of dry paste, meaning that the differences in pore
volume and paste density resulting from the different w/c values do not affect the results. In
83

addition, the starting w/c does not affect the overall stoichiometry of the hydration reactions, so the phase distribution should be relatively independent of w/c. Thus surface area differences with w/c must be related to the morphology of the C-S-H gel, with higher w/c giving a more open C-S-H morphology that is more accessible to nitrogen. Since water vapor can access all of the fine structure regardless of how open it is, the values are constant. The increase in the relative amount of fine pore structure with w/c (and with other variables such as chemical and mineral admixtures) is an important aspect of the microstructure of cement paste, and the insensitivity of water vapor to these variables limits its usefulness.
6.5.3.2 Effect of curing time
The surface area measured with nitrogen (SN2) increases with hydration time until it
plateaus at a maximum value. The maximum surface area as well as the time to reach this plateau increases with the w/c. Figure 6-4 shows typical results for the variation in SN
2 with age for cement pastes with different w/c. The lower w/c specimen reaches a maximum surface area value by 28 days, while the higher w/c specimen continues to increase in surface area out to 180 days. The increase in surface area of mature pastes with w/c was shown in Table 6.4. The surface area measured by water vapor (not shown) increases continuously with the degree of hydration.
20
40
60
80
100
120
0 30 60 90 120 150 180 210
Surf
ace
Are
a (m
2/g
)
Hydration time (days)
w/c=0.33
w/c=0.50
Figure 6-4: Nitrogen BET surface area as a function of age, at two different w/c, after
Hunt [13]. A logical interpretation of these results is that the C-S-H gel forms with a high surface area
measurable to nitrogen until it fills a certain fraction of the available capillary porosity. Further hydration then forms C-S-H with a more constricted pore system that is inaccessible to nitrogen.
84

6.5.3.3 Effect of curing temperature
Curing temperature is an important variable that affects cement paste in more than one way. This makes surface area results for different curing temperatures difficult to interpret. Higher curing temperatures accelerate the rate of early hydration, which would be expected to increase the surface area at equivalent ages. On the other hand, higher temperatures create a denser C-S-H gel morphology, which would be expected to lower the accessibility to nitrogen. Finally, high temperatures increase the silicate polymerization within the C-S-H gel, potentially making it less prone to collapse on drying. Garci [lii] measured the nitrogen surface area for pastes hydrated at 2˚C, 20˚C, and 40˚C, and plotted the results as a function of degree of hydration, thus eliminating kinetic effects. She found that the 20˚C and 40˚C pastes had nearly the same surface area, but the 2˚C pastes had a significantly higher surface area. Microstructural investigations have shown that the effects of elevated temperature curing are not significant until above 40˚C. Other researchers investigating temperatures as high as 90˚C [liii] and 100˚C [liv] found that the nitrogen surface area decreased with increasing temperature. No data for water vapor appear to be available.
6.5.4 Surface area of two C-S-H morphologies Many of the results presented in previous sections of this chapter have been interpreted
using the assumption that there are two morphologies of C-S-H and that only the low-density C-S-H has a high surface area. A full argument supporting this has not yet been presented, however. While two morphologies of C-S-H have long been directly observed at the scale of microns using microscopy, the high surface area of cement paste is generated by much finer features at the nanometer scale that are difficult to see with microscopy. A simpler hypothesis that could be used to explain most of the gas sorption results discussed above is as follows: the C-S-H structure at the nanometer scale is continuously variable, and will change depending on the amount of space available. Thus once the capillary porosity is filled, further hydration compresses the existing C-S-H, reducing the amount of fine porosity accessible to nitrogen.
When two hypotheses can be used to explain a given set of data, the simpler one is generally preferable, so this needs to be addressed. An important clue resides in the total pore volumes measured by nitrogen and water vapor. Since water vapor can be assumed to measure the entire pore volume, the difference between the nitrogen and water pore volumes is a measure of the porosity that is missed (inaccessable to) nitrogen. Now consider two specimens that have equal amounts of C-S-H gel but different nitrogen BET surface areas. It would be logical to expect that the specimen with the lower surface area would also have a greater amount of porosity missed by nitrogen. However, as was first pointed out by Tennis and Jennings [lv], exactly the opposite is true. The greater the surface area measured by nitrogen, the greater the amount of porosity missed by nitrogen. This observation is difficult to reconcile with the simpler hypothesis mentioned above.
In a later publication [lvi] the same authors analyzed a large amount of data for surface area, capillary porosity, and total porosity as measured by nitrogen and showed that the data could only be explained by postulating two types of C-S-H gel with different and well-defined densities. Their results are summarized in Table 6.5.
Table 6.5: Properties of two types of CSH optimized to fit nitrogen BET data [lvi].
85

Phase Density (dry)
(g/cm3)
Density (wet)
(g/cm3)
Surface Area (m2 g-1 dried)
Inaccessable porosity (vol%)
LD C-S-H 1.44 1.91 247 47
HD C-S-H 1.75 2.10 0 35
Although the HD C-S-H does not have porosity or surface area measurable by nitrogen, it
still has a significant porosity measurable by water vapor. The LD C-S-H, despite having a high surface area, also has a significant amount of inaccessible porosity. Much of this can be associated with interparticle and interlayer space, which is accessible to water. A recently proposed structural model of C-S-H gel provides a physical explanation for the results shown in Table 6.5 as well as most of the other results given in this chapter. This model is discussed in detail in Chapter 8.
6.6 Application of small angle scattering to cement paste
Small-angle scattering is a powerful tool for characterizing complex microstructures. It is a particularly attractive technique for characterizing cement paste because it is sensitive to features on the order of a nanometer in size and larger, and because specimens can be analyzed with water-filled pores, thus avoiding the problems associated with drying discussed in the previous section. Small angle neutron scattering (SANS) and small angle x-ray scattering (SAXS) operate on the same physical principle (diffraction), and results from these techniques are discussed together in this section. The primary difference between SAXS and SANS is that neutrons are scattered by interactions with atomic nuclei, while x-rays are scattered by interactions with outer shell electrons. However, in both cases the scattering occurs at interfaces between two phases. In cement paste, the scattering of both x-rays and neutrons is mostly at the interface between solid C-S-H and the pore system, although information about coarser microstructural features can also be obtained.
Figure 6-5 shows a schematic of a small angle neutron scattering experiment. The neutrons are first filtered so that they all have the same energy and wavelength, and then they are channeled down a long waveguide so that they are all traveling in the same direction. As the beam passes through the specimen a small fraction of the neutrons are scattered out of the incident direction by microstructural variations. A two-dimensional neutron detector records the final position of the neutrons, from which their angle of scatter can be calculated.
Figure 6-5: Schematic of a small angle neutron scattering experiment.
86

The surface area of a specimen is determined from the small angle scattering response at the largest scattering vectors, called Porod scattering. The following equation can be used:
Sv =CP
2π |Δρ |2 7.3
where SV is the surface area per unit sample volume, CP, the Porod constant, is determined from the data in the Porod regime, and |Δρ|2 is a parameter called the scattering contrast that represents the intrinsic strength of the neutron or x-ray scattering interaction between the two materials that define the surface area. For cement paste, this contrast is between C-S-H and H2O in a saturated paste, or between C-S-H and air if the paste is dried.
More details on the application of small-angle scattering to cement paste, with an emphasis on analyzing and interpreting the data, is given in the following optional section, while this section will focus on the surface area results. Small angle scattering data is normalized to the volume of the specimen that is exposed to the beam, and so surface area results are often reported as m2/cm3. In order to facilitate comparison with gas sorption results, reported values are converted to m2/g of dry paste. The density of mature dried cement paste decreases from about 1.78 – 1.30 g/cm3 as the w/c increases from 0.35 to 0.60 [lv].
6.6.1.1 Comparison of SANS and SAXS surface area values
Reported surface area values of normal mature cement pastes measured by SANS and SAXS are summarized below in Table 6.6.
Table 6.6: Reported SANS and SAXS surface area values for mature saturated pastes.
Technique
Ref., year
Specimen
Surface Area
(m2/g of dry paste)
SAXS [lvii], 1974 Type I OPC, w/c=0.3, 1.5 years
Type I OPC, w/c=0.4, 1.5 years
Type I OPC, w/c=0.6, 1.5 years
427
566
618
SAXS [lviii], 1987 OPC, w/c=0.50, 2 years 215
SAXS [lix], 1994 Type I OPC, w/c=0.40, 28 d
Type I OPC, w/c=0.40, 1 year
586
605
SAXS [lx], 1994 OPC, w/c=0.40, 6 months
OPC, w/c=0.60, 6 months
210 - 235
280 - 320
SAXS [lxi], 2000 OPC, w/c=0.40, 28 d 95
SANS [lxii], 1987 Type I OPC, w/c=0.40, 28 d 83
SANS [lxiii], 1991 Type I OPC, w/c=0.60, 31 d 83
SANS [lxiv],1995 Type I OPC, w/c=0.40, 11 d 63
87
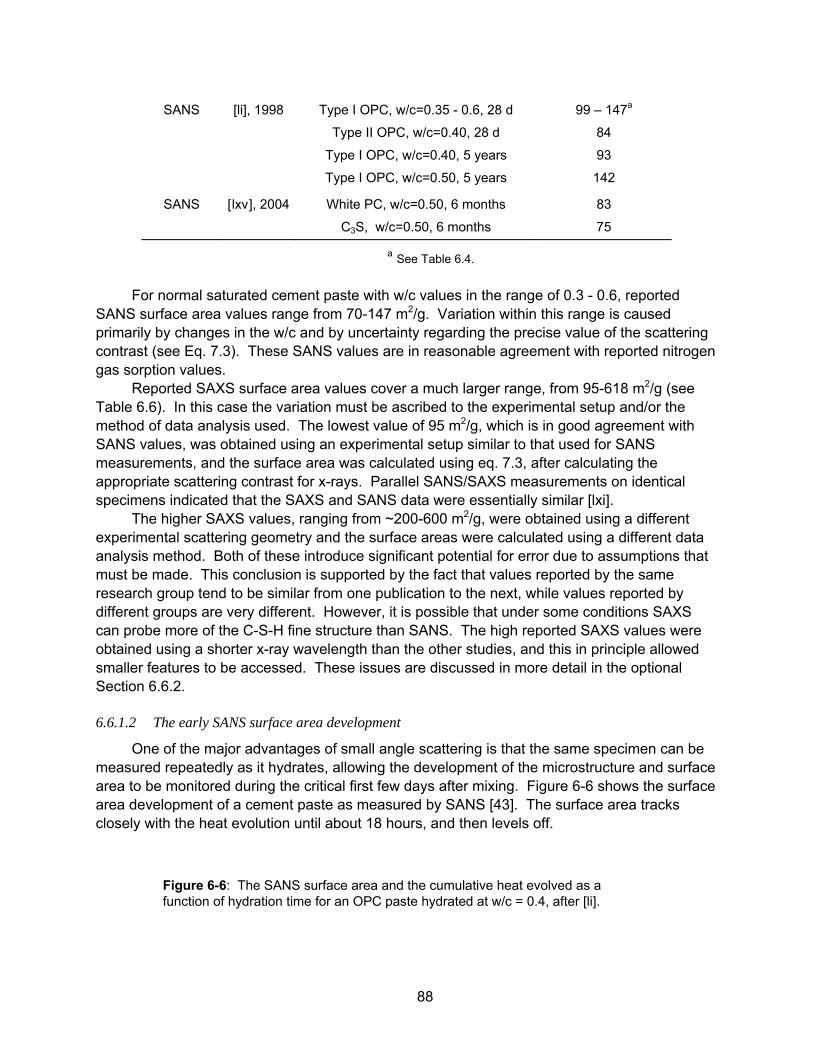
SANS [li], 1998 Type I OPC, w/c=0.35 - 0.6, 28 d
Type II OPC, w/c=0.40, 28 d
Type I OPC, w/c=0.40, 5 years
Type I OPC, w/c=0.50, 5 years
99 – 147a
84
93
142
SANS [lxv], 2004 White PC, w/c=0.50, 6 months
C3S, w/c=0.50, 6 months
83
75
a See Table 6.4.
For normal saturated cement paste with w/c values in the range of 0.3 - 0.6, reported SANS surface area values range from 70-147 m2/g. Variation within this range is caused primarily by changes in the w/c and by uncertainty regarding the precise value of the scattering contrast (see Eq. 7.3). These SANS values are in reasonable agreement with reported nitrogen gas sorption values.
Reported SAXS surface area values cover a much larger range, from 95-618 m2/g (see Table 6.6). In this case the variation must be ascribed to the experimental setup and/or the method of data analysis used. The lowest value of 95 m2/g, which is in good agreement with SANS values, was obtained using an experimental setup similar to that used for SANS measurements, and the surface area was calculated using eq. 7.3, after calculating the appropriate scattering contrast for x-rays. Parallel SANS/SAXS measurements on identical specimens indicated that the SAXS and SANS data were essentially similar [lxi].
The higher SAXS values, ranging from ~200-600 m2/g, were obtained using a different experimental scattering geometry and the surface areas were calculated using a different data analysis method. Both of these introduce significant potential for error due to assumptions that must be made. This conclusion is supported by the fact that values reported by the same research group tend to be similar from one publication to the next, while values reported by different groups are very different. However, it is possible that under some conditions SAXS can probe more of the C-S-H fine structure than SANS. The high reported SAXS values were obtained using a shorter x-ray wavelength than the other studies, and this in principle allowed smaller features to be accessed. These issues are discussed in more detail in the optional Section 6.6.2.
6.6.1.2 The early SANS surface area development
One of the major advantages of small angle scattering is that the same specimen can be measured repeatedly as it hydrates, allowing the development of the microstructure and surface area to be monitored during the critical first few days after mixing. Figure 6-6 shows the surface area development of a cement paste as measured by SANS [43]. The surface area tracks closely with the heat evolution until about 18 hours, and then levels off.
Figure 6-6: The SANS surface area and the cumulative heat evolved as a function of hydration time for an OPC paste hydrated at w/c = 0.4, after [li].
88

The kinetics of the SANS surface area development shown in are very similar to those of the constrained water development measured by QENS (see Section 6.2.2). The constrained water population and the surface area are both associated primarily with the low-density form of C-S-H gel, which forms preferentially during the early hydration period. These kinetic results add important support to the two-morphology hypothesis, which was initially proposed on the basis of gas sorption data (see Section 6.5.4). The results shown above indicate that the high-density C-S-H gel has little or no surface area measurable by SANS (as is the case with nitrogen BET). Given that SANS and nitrogen give similar surface area values, it appears that the size of the smallest features that can be probed by these techniques is similar (approximately 2 nm), although the limiting factors are somewhat different. Nitrogen molecules are physically restricted from spaces that are small enough to require an activated diffusion process, whereas neutrons easily pass through all areas of the specimen. However, microstructural features that are small compared to the wavelength of the neutron will not cause scattering.
6.6.2 More on small-angle scattering applied to cement paste The energy source consists of an intense, monochromatic (single wavelength) beam of
either neutrons or x-rays. The thickness of the specimen is chosen so that majority of the incident intensity, generally 70% or more, passes through the specimen without interaction. (If the transmission is too low, multiple scattering effects limit the utility of the data. For cement paste, the maximum thickness is about 1 mm for SANS and perhaps half that for SAXS. In both cases the volume of paste that is sampled is large enough to be statistically representative of the microstructure.) Most of the remaining intensity is scattered through random, elastic collisions with atoms in the specimen, creating large incoherent background signal. Thus only a small fraction of the incoming intensity (on the order of 1%) is scattered by diffraction through a small angle via interactions with microstructural features within the bulk of the material. These data must be separated from the incoherent background and calibrated as part of the analysis. The interpretation of SANS scattering data from highly disordered materials such as cement paste was discussed by Allen et al. [33]. Thomas et al. [21] have reviewed the application of SANS and SAXS to cement paste.
For purposes of analysis, the scattering angle, �, is normally replaced with a scattering vector, Q, defined as:
Q =4πλ
sin Φ2( )
(6.6.1)
where λ is the wavelength of incident neutrons or x-rays. This substitution simplifies the mathematics.
For cement and similar porous materials, the small-angle scattering profile, which is the flux of neutrons or x-rays as a function of scattering vector, is effectively a form of Fourier transform of the solid/pore microstructure. As the scattering vector increases, the size of the microstructural features that contribute to the signal decreases, so different aspects of the microstructure can be probed by focusing on the appropriate range of data. The intensity of the small angle scattering is a strong function of scattering vector, falling off sharply as the scattering vector increases. The smallest values of Q that can be resolved (and thus the largest
89

microstructural features) are determined by the experimental setup. The effective maximum scattering angles, and associated minimum dimensions studied, are determined by the signal-to-noise ratio as the small-angle scattering becomes small compared to the incoherent background signal. This is an important issue for surface area determination.
The surface area of a specimen is determined from the small angle scattering response at the largest scattering vectors, called Porod scattering. In the Porod region the intensity of the scattering, I, falls off as Q4, and the surface area is given by
Sv =CP
2π |Δρ |2 (6.6.2)
where SV is the surface area per unit sample volume, Δρ is the difference in the scattering length density of the two materials forming the interface associated with the scattering, and CP, the Porod constant, is the intercept of a linear fit to Porod data plotted as IQ4 vs. Q4. The term |Δρ|2 is called the scattering contrast, and it represents the relative strength of the scattering interaction created by the interface between the two materials that define the surface. For cement, this contrast is between C-S-H and H2O in a saturated paste, or between C-S-H and air if the paste is dried.
Once the Porod constant has been measured, there are two ways that the surface area can be determined from Eq. 6.6.2. The first, and preferred, method is to determine the scattering contrast. If the formula and density for the two phases creating the interface are known, the contrast can be calculated directly. Unfortunately, this is not the case for cement because the amount of water that should be included in the solid C-S-H phase for the purpose of this calculation is not known a priori. In the case of SANS, the contrast can be calculated experimentally by taking advantage of the difference in contrast when specimens are exchanged with D2O (heavy water) [34-36].
The second method for determining the surface area is the "scattering invariant" method. The scattering invariant, Iinv, is given by:
I inv = IQ2dQ0
∞
∫ = 2π2 Δρ2 φv 6.6.3
where φv is the volume fraction of the scattering phase, which is C-S-H in the case of cement. This method has two advantages: the data need not be absolutely calibrated, and the scattering contrast does not need to be known explicitly. However, these are more than offset by the difficulties associated with taking the integral in Eq. 3.3. The integration must be over all values of Q, which requires extrapolation of the experimental data. Uncertainties in the scattering profile or in the incoherent scattering subtraction create the potential for large errors, particularly at high Q [21]. Another problem is that the volume fraction of C-S-H, φv , is not easy to determine accurately.
Most SANS surface area values have been calculated using the contrast method, while SAXS studies have generally used the scattering invariant method.
An important contribution of small angle scattering to the study of cement is the discovery that the C-S-H phase has a disordered fractal structure [35, 37, 38], the non--solid spaces of which actually comprise the so-called "gel porosity" and, perhaps, part of the capillary porosity
90

as well. In this context a fractal region can be defined as a heterogeneous microstructure that remains consistent over various length scales, and such a microstructure is readily identified by the presence of a linear region on a log-log small angle scattering plot of I vs. Q. Figure 3.2 shows a typical SANS plot of this type for a mature cement paste and the various Q-ranges of interest. SAXS plots are essentially similar.
At larger Q values where smaller features are probed, a mass or volume fractal structure is observed with both SANS [34, 35] and SAXS [38-40] with a fractal scaling exponent, DV, of 2.5-2.8. Monte Carlo simulations performed on SANS data by Allen et al. [35] indicate that this structure is generated by the random aggregation of 5 nm diameter particles of C-S-H. At Q values just above the volume fractal region (the Guinier region, see fig. 3.2), a discrete population of scatterers of this size can be identified [41]. These results are consistent with a C-S-H outer product structure consisting of colloidal-sized particles that are aggregated into larger clusters [35]. No evidence for an interlayer structure is observed at these length scales.
At lower Q values, a surface fractal structure can be observed, with calculated scaling exponents, DS, ranging from about 2.5 to 3.0 [35]. This region can be associated with the development of surface roughness on the original cement grains as they hydrate [37]. The transition from surface fractal to volume fractal regions occurs at a Q-value of about 0.2 -1nm. It is interesting to note, in view of the large differences in the reported surface area values, that SANS and SAXS studies of cement are in good agreement regarding the fractal nature of the microstructure.
6.7 NMR relaxation (Surface area)
Nuclear magnetic resonance (NMR) is another advanced technique that is used to study a wide variety of atomic-scale interactions in materials. The technique is based on the fact that most atomic nuclei have a non-zero spin state. The rate at which the spins align themselves with a static magnetic field (spin-lattice NMR), or the response of the material to an oscillating magnetic field (spin-spin NMR), provides information about atomic interactions with adjacent nuclei and with the surrounding medium. For materials with a water-filled pore system such as cement, NMR utilizes the fact that nuclear spin interactions between water and the solid pore walls are much stronger than interactions in the bulk fluid. The NMR relaxation response of mobile hydrogen is thus sensitive to the surface to volume ratio of the pore system, and this allows a surface area value to be inferred. The application of NMR relaxation techniques to porous media was reviewed by Halperin et al. [47].
The first surface area measurement of cement paste using NMR, done using spin-lattice relaxation, reported values as high as 900 m2g-1 for mature cement paste [48]. However, the approach used to calculate the surface area (based on the BET approach for multilayer adsorption) was later shown to be inaccurate [49]. Halperin et al. [49, 50] developed a different approach, deriving an expression for the total surface area accessed by mobile water in a specimen:
S = T2SVλT2i (6.7.4)
where λ is the thickness of the layer of mobile surface water, V is the volume of mobile water in the pore system (the evaporable water content, determined after the experiment), T2S is the characteristic spin-spin relaxation time for mobile surface water, and T2i is the
91

experimentally measured spin-spin relaxation time for mobile water in the saturated paste. The parameter T2s is determined by measuring the change in T2i as the paste is progressively dried.
Using this approach, Halperin et al. [50] observed the development of the surface area during the hydration of a white cement paste (a low-iron cement quite similar to OPC with w/c=0.42, using spin-spin relaxation. They found that the surface area increased rapidly between 6 hours and about 48 hours, and that there was essentially no surface area increase between 100 and 1000 hours. This behavior is quite similar to the SANS results shown in Fig. 3.3. The maximum surface area was ~280 m2g-1 of dry paste, a value which falls between the values reported for SANS and for SAXS.
6.8 Other techniques
Scanning electron microscopy (SEM) and optical microscopy can be used to identify pores larger than about 500 nm. SEM provides higher magnifications and the potential to see smaller pores, but requires drying the specimen and thus altering the fine microstructure. Digital image analysis can be used to separate porosity from solid phases quantitatively, and backscattered SEM images have been used [51,52] to measure total coarse porosity values that, although lower, correlate well with the capillary porosity. Although microscopy is one of the most widely used and valuable techniques for studying cement microstructure and morphology, the inability to characterize the gel pores limits its use as a probe of the pore system.
Another method of studying the coarse porosity is low temperature calorimetry, which takes advantage of the depression of the freezing point of water confined in a pore. As the temperature is lowered below 0°C, ice forms in progressively smaller pores (the higher the surface to volume ratio the lower the freezing point), and the resulting change in heat capacity makes it possible to obtain a sort of pore size distribution [53]. Recently, quasi-elastic neutron scattering (QENS) has also been used to monitor the same effect [54]. QENS measures the relative amounts of bound and free water in a paste, allowing the fraction of frozen water to be monitored as a function of temperature.
Impedance spectroscopy (IS) measures the AC electrical response of a material as a function of frequency. Because the cement pore solution is much more of a conductor than the solid phases, IS is quite sensitive to the connectivity of the pore system, which is directly related to the permeability. This, combined with the relative experimental simplicity of IS, makes the technique potentially of great use both for fundamental studies and as a diagnostic technique. Christensen et al. [55] reviewed the application of IS to cement paste. The complexity of the IS data analysis invites analogy to small angle scattering, but the latter technique has the benefit of having been widely used on related systems such as clays, and enjoys a more sound theoretical underpinning. The impedance response of a porous material is affected by a wide variety of microstructural variables, and some features of the data obtained from cements are not well understood [6]. Reported IS results, particularly those attempting to produce quantitative values, have met some resistance in the cement research community due to a perceived lack of theoretical grounding.
92
93
Acknowledgment The author is grateful to the Infrastructure Technology Institute for sponsoring the preparation of this document.
References
i. Annual Book of ASTM Standards, Volume 4, published by the American Society for Testing and Materials.
ii. S. Mindess, J.F. Young, and D. Darwin, Concrete, Prentice Hall, 2nd Ed., 1996.
iii. P.K. Mehta and P.J.M. Monteiro, Concrete: Structure, Properties, and Materials, Prentice-Hall, Englewood Cliffs, NJ, 2nd Ed., 1993.
iv. S.H. Kosmatka, B. Kerkhoff, and W.C. Panarese, Design and Control of Concrete Mixtures, Portland Cement Association, Skokie, IL. 14th Ed., 2002.
v. H.F.W. Taylor, Cement Chemistry, Thomas Telford, London, 2nd Ed., 1997.
vi. You may have now realized that the name of “C-S-H gel” (the important phase that we met in Chapter 1) is in cement chemistry notation. However, we won’t put it in bold as the dashes make it distinct from all other phases that we will discuss.
vii Kosmatka, S.H., Kerkhoff, B. and Panarese, W.C., Design and Control of Concrete Mixtures, Portland Cement Association, Skokie, 2002.
viii. S.H. Kosmatka, B. Kerkhoff, and W.C. Panarese, Design and Control of Concrete Mixtures, Portland Cement Association, Skokie, IL. 14th Ed., 2002.
ix. H.F.W. Taylor, Cement Chemistry, Thomas Telford, London, 2nd Ed., 1997.
x. ASTM C 204 Blaine fineness
xi. T.D. Dyer, J.E. Halliday, and R.K. Dhir, “An investigation of the hydration chemistry of ternary blends containing cement kiln dust,” J. Mater. Sci. 34, pp. 4975-4983 (1999).
xii. Gartner, E.M., "Industrially interesting approaches to "low-CO2" cements," Cement and Concrete Research, vol. 34, 2004, p. 1489-1498.
xiii. D.P. Bentz and P.E. Stutzman, “SEM Analysis and Computer Modeling of Hydration of Portland Cement,” pp. 60-73 in Petrography of Cementitious Materials, S.M. Dehayes, D. Stark, Eds. ASTM, Philadelphia, 1994.
xiv. D.P. Bentz, X. Feng, C.-J. Haecker, and P.E. Stutzman, “Analysis of CCRL Proficiency Cements 135 and 136 using CEMHYD3D,” NIST Internal Report 6545, August 2000.
xv. ASTM C150
xvi. K.J. Wang, M.S. Konsta-Gdoutos, and S.R. Shah, “Hydration, rheology, and strength of ordinary Portland cement (OPC)-cement kiln dust (CKD)-slag binders,” ACI Mater. J. 99, pp. 173-179 (2002).
xvii. S.-D. Wang, “Alkali-activated slag cement and concrete: a review of properties and problems,” Adv. Cem. Res. 7, pp. 93-102 (1995).

94
xviii. T.M. Salem and S.M. Ragai, “Electrical conductivity of granulated slag cement kiln dust-
silica fume pastes at different porosities,” Cem. Concr. Res. 31, pp. 781-787 (2001).
xix. Youssef, “Utilization of cement kiln dust in the manufacture of wall tiles,” Ind. Ceram. 22, pp. 1-8 (2002).
xx. A.M. Amin, Eebied, and H. Eldidamony, “Activation of Granulated Slag with Calcined Cement Kiln Dust,” Silicates Industriels 60, pp. 109-115 (1995).
xxi. H.F.W. Taylor, “Modification of the Bogue calculation,” Adv. Cem. Res. 2, pp. 73-77 (1989).
xxii. S. Barnett and D. Brew, “DCC@aberdeen: Database of cementitious material synthesis,” http://www.abdn.ac.uk/chemistry/research/cement/dcc/index.htm.
xxiii. R. Berliner, C. Ball, and P.B. West, “Neutron powder diffraction investigation of model cement compounds,” Cem. Concr. Res. 27, pp. 551-575 (1997).
xxiv. S.-H. Hong and J.F. Young, “Hydration Kinetics and Phase Stability of Dicalcium Silicate Synthesized by the Pechini Process,” J. Am. Ceram. Soc. 82, pp. 1681-1686 (1999).
xxv. I. Nettleship, J.L. Shull, and W.M. Kriven, “Chemical preparation and phase stability of Ca2SiO4 and Sr2SiO4 powders,” J. European Ceram. Soc. 11, pp. 291-298 (1993).
xxvi. Le Chatelier, H., Ann. Mines 11 [8], pp. 345-465 (1887).
xxvii. D.P. Bentz, “Three-dimensional computer simulation of cement hydration and microstructure development,” J. Am. Ceram. Soc. 80, pp. 3-21 (1997).
xxviii. S. Mindess, J.F. Young, and D. Darwin, Concrete, 2nd Ed., Prentice Hall, 2nd Ed., 1996.
xxix. P.K. Mehta and P.J.M. Monteiro, Concrete: Structure, Properties, and Materials, 2nd Ed., Prentice-Hall, Englewood Cliffs, NJ, 2nd Ed., 1993.
xxx. S. Mindess, J.F. Young, and D. Darwin, Concrete, Prentice Hall, 2nd Ed., 1996.
xxxi. Rothstein, D., Thomas, J.J., Christensen, B.J. and Jennings, H.M., "Solubility behavior of Ca-, S-, Al-, and Si-bearing solid phases in Portland cement pore solutions as a function of hydration time," Cement and Concrete Research, vol. 32, 2002, p. 1663-1671.
xxxii. T.C. Powers and T.L. Brownyard, “Studies of the Physical Properties of Hardened Portland Cement Paste,” J. Am. Concr. Inst. 43, pp. 101-132, 249-336, 469-504, 549-602, 669-712, 845-57, 865-880, 933-969, 971-992; reprinted in PCA Bull. 22 Portland Cement Association, 1948, 992 pp. (1947).
xxxiii. T.C. Powers, “Physical properties of cement paste,” Fourth International Symposium on the Chemistry of Cement, Washington, D. C. National Bureau of Standards (1960).
xxxiv. J.J. Thomas, H.M. Jennings, and A.J. Allen, “The Surface Area of Hardened Cement Paste as Measured by Various Techniques,” Concr. Sci. Engrg. 1, pp. 45-64 (1999).
xxxv. S.A. FitzGerald, D.A. Neumann, J.J. Rush, D.P. Bentz, and R.A. Livingston, “In-Situ Quasielastic Neutron Scattering Study of the Hydration of Tricalcium Silicate,” Chem. Mater. 10, pp. 397-402 (1998).

95
xxxvi. J.J. Thomas, D.A. Neumann, S.A. FitzGerald, and R.A. Livingston, “State of Water in
Hydrating Tricalcium Silicate and Portland Cement Pastes as Measured by Quasi-Elastic Neutron Scattering,” J. Am. Ceram. Soc. 84, pp. 1811-16 (2001).
xxxvii. R.F. Feldman, “Helium Flow and Density Measurement of the Hydrated Tricalcium Silicate-Water System,” Cem. Concr. Res. 2, pp. 123-136 (1972).
xxxviii. H.F.W. Taylor, Cement Chemistry, Thomas Telford, London, 2nd Ed., 1997.
xxxix. E.J. Garboczi and D.P. Bentz, “Digitized Simulation of Mercury Intrusion Porosimetry,” in Advances in Cementitious Materials - Ceramic Transactions S. Mindess, Ed. (American Ceramic Society, Westerville, OH, 1991), vol. 16, pp. 365-380.
xl. R.A. Olson, C.M. Neubauer, and H.M. Jennings, “Damage to the pore structure of hardened portland cement paste by mercury intrusion,” J. Am. Ceram. Soc. 80, pp. 2454-2458 (1997).
xli. D.N. Winslow and D. Lui, “The Pore Structure of Paste in Concrete,” Cem. Concr. Res. 20, pp. 227-235 (1990).
xlii. S.J. Gregg and K.S.W. Sing, Adsorption, Surface Area and Porosity, Academic Press, New York, 2nd Ed. Ed., 1982.
xliii. R.L. Rarick, J.I. Bhatty, and H.M. Jennings, in Materials Science of Concrete IV J. Skalny, S. Mindess, Eds. (The American Ceramic Society, Westerville, OH, 1994) pp. 1-39.
xliv. I. Odler, “The BET-specific surface area of hydrated Portland cement and related materials,” Cem. Concr. Res. 33, pp. 2049-2056 (2003).
xlv. E.E. Bodor, J. Skalny, S. Brunauer, J. Hagymassy, and M. Yudenfreund, “Pore Structures of Hydrated Calcium Silicates and Portland Cements by Nitrogen Adsorption,” J. Colloid Interface Sci. 34, pp. 560-570 (1970).
xlvi. J. Hagymassy, I. Odler, M. Yudenfreund, J. Skalny, and S. Brunauer, “Pore structure analysis by water vapor adsorption III: Analysis of hydrated calcium silicates and Portland cements,” J. Colloid Interface Sci. 38, pp. 20-34 (1972).
xlvii. L.J. Parrott, R.G. Patel, D.C. Killoh, and H.M. Jennings, “Effect of Age on Diffusion in Hydrated Alite Cement,” J. Am. Ceram. Soc. 67, pp. 233-237 (1984).
xlviii. L.J. Parrott, “Effect of Drying History on the Exchange of Pore Water with Methanol and upon Subsequent Methanol Sorption Behavior in Hydrated Alite Paste,” Cem. Concr. Res. 11, pp. 651-658 (1981).
xlix. G.G. Litvan, “Variability of the Nitrogen Surface Area of Hydrated Cement Paste,” Cem. Concr. Res. 6, pp. 139-44 (1976).
l. R.S. Mikhail and S.A. Selim, in Symposium of Structure of Portland Cement and Concrete. (1966), vol. Highway Research Board Special Report 90, pp. 123-134.
li. J.J. Thomas, H.M. Jennings, and A.J. Allen, “The Surface Area of Cement Paste as Measured by Neutron Scattering - Evidence for Two C-S-H Morphologies,” Cem. Concr. Res. 28, pp. 897-905 (1998).
lii. M.C. Garci, "Quantifying Microstructural Variations in Cement Pastes: Implications on Drying Shrinkage," Pd.D. Thesis, Northwestern University (1999).

96
liii. V. Alunno-Rosetti, G. Chiocchio, and M. Collepardi, “Low pressure Steam Hydration of
Tricalcium Silicate,” Cem. Concr. Res. 4, pp. 279-288 (1974).
liv. I. Odler and M. Rossler, “Investigations on the Relationship between Porosity, Structure, and Strength of Hydrated Portland Cement Pastes. II. Effect of Pore Sturcture and Degree of Hydration,” Cem. Concr. Res. 15, pp. 401-410 (1985).
lv. H.M. Jennings and P.D. Tennis, “Model for the Developing Microstructure in Portland Cement Pastes,” J. Am. Ceram. Soc. 77, pp. 3161-3172 (1994), and corrrection, 78, pg. 2575 (1995).
lvi. P.D. Tennis and H.M. Jennings, “A Model for Two Types of Calcium Silicate Hydrate in the Microstructure of Portland Cement Pastes,” Cem. Concr. Res. 30, pp. 855-863 (2000).
lvii. D.N. Winslow and S. Diamond, “Specific Surface of Hardened Cement Paste as Determined by Small-Angle X-Ray Scattering,” J. Am. Ceram. Soc. 57, pp. 193-197 (1974).
lviii. J.J. Volkl, R.E. Beddoe, and M.J. Setzer, “The Specific Surface of Hardened Cement Paste by Small-Angle X-Ray Scattering - Effect of Moisture Content and Chlorides,” Cem. Concr. Res. 17, pp. 81-87 (1987).
lix. D.N. Winslow, J.M. Bukowski, and J.F. Young, “The Early Evolution of the Surface of Hydrating Cement,” Cem. Concr. Res. 24, pp. 1025-1032 (1994).
lx. R.E. Beddoe and K. Lang, “Effect of Moisture on Fractal Dimension and Specific Surface of Hardened Cement Paste by Small-Angle X-Ray Scattering,” Cem. Concr. Res. 24, pp. 605-612 (1994).
lxi. A.J. Allen, J.J. Thomas, and H.M. Jennings, “USAXS studies of Calcium-Silicate Hydrate Gel in Cement,” Report of UNICAT beamline research, (Argonne National Laboratory, 2000).
lxii. A.J. Allen, R.C. Oberthur, D. Pearson, P. Schofield, and C.R. Wilding, “Development of the Fine Porosity and Gel Structure of Hydrating Cement Systems,” Phil. Mag. B 56, pp. 263-268 (1987).
lxiii. A.J. Allen, “Time-Resolved Phenomena in Cements, Clays and Porous Rocks,” J. Appl. Cryst. 24, pp. 624-634 (1991).
lxiv. A.J. Allen and R.A. Livingston, “Small-Angle Scattering Study of Concrete Microstructure as a Function of Silica Fume, Fly Ash, or Other Pozzolanic Additions,” V.M. Malhotra, Ed. in Proc. 5th CANMET/ACI Int. Conf. on Fly Ash, Silica Fume, Slag and Natural Pozzolans in Concrete. American Concrete Institute (1995).
lxv. J.J. Thomas, J.J. Chen, H.M. Jennings, and A.J. Allen, “Effects of Decalcification on the Microstructure and Surface Area of Cement Paste,” Cem. Concr. Res. in press (2004).