materials performance in supercritical co and - supercritical...
TRANSCRIPT

National Energy Technology Laboratory
Driving Innovation ♦ Delivering Results
Gordon R Holcomb, Ömer N. Doğan, Casey Carney, Kyle Rozman, Jeffrey A. Hawk,
and Mark Anderson
The 5th International Symposium - Supercritical CO2 Power CyclesMarch 28-31, 2016, San Antonio, TX
Materials Performance in Supercritical CO2
in Comparison with Atmospheric CO2 and Supercritical Steam
BLUE OPTION
White space is filled with one or more photos

2National Energy Technology Laboratory
Acknowledgements
• University of Wisconsin-Madison Collaboration – Arjun Kalra and Paul Brooks
• Funding and Support– This work was funded by the Advanced Combustion Program at the National
Energy Technology Laboratory (Richard Dennis and Daniel Driscoll, Technology Managers and Briggs White, Project Monitor). The Research was executed through NETL’s Research and Innovation Center’s Advanced Combustion Field Work Proposal.
• Disclaimer– "This report was prepared as an account of work sponsored by an agency of the United
States Government. Neither the United States Government nor any agency thereof, nor any of their employees, makes any warranty, express or implied, or assumes any legal liability or responsibility for the accuracy, completeness, or usefulness of any information, apparatus, product, or process disclosed, or represents that its use would not infringe privately owned rights. Reference herein to any specific commercial product, process, or service by trade name, trademark, manufacturer, or otherwise does not necessarily constitute or imply its endorsement, recommendation, or favoring by the United States Government or any agency thereof. The views and opinions of authors expressed herein do not necessarily state or reflect those of the United States Government or any agency thereof."

3National Energy Technology Laboratory
Outline
• Background– Power cycles utilizing sCO2
– Comparison with steam system parameters
• sCO2, sH2O, and aCO2 Oxidation– Experimental procedures– Results– Comparisons with other results
• Summary/Conclusions

4National Energy Technology Laboratory
sCO2 Power Cycles
Cycle/ComponentInlet Outlet
T (C) P (bar) T (C) P (bar)
Indi
rect Heater 450-535 10-100 650-750 10-100
Turbine 650-750 200-300 550-650 80-100
HX 550-650 80-100 100-200 80-100
Dire
ct
Combustor 750 200-300 1150 200-300
Turbine 1150 200-300 800 30-80
HX 800 30-80 100 30-80
J.P. Gibbs et al., MIT Report, MIT-GFR-037, 2006Allam et al., GHGT-11
Johnson GT2012-70105
DIRECT
INDIRECT
mol %
CO2 85-95
O2 1-5
H2O 2-10

5National Energy Technology Laboratory
Coal-based Steam Systems and Efficiency
Steam conditions and net plant efficiencies for pulverized coal power plants
Nomenclature Conditions Net Plant Efficiency (HHV)
Subcritical 2400 psi/1050°F/1050°F (165 bar/566°C/566°C)
35%
Supercritical (SC) 3600 psi/1050°F/1075°F 248 bar/566°C/579°C)
38%
Ultra-Supercritical (USC) >3600 psi/1100°F/1150°F (>248 bar/593°C/621°C)
>42%
Advanced Ultra-Supercritical (A-USC)
4000-5000 psi/1300-1400°F (276-345 bar/704-760°C)
>45%
adapted from EPRI Report 1022770, 2011
Categories are materials related, largely due to creep strength • USC: advanced ferritic & austenitic steels
required• A-USC: nickel-base superalloys required
Each 1% increase in efficiency eliminates ~1,000,000 tons of CO2emissions over the lifetime of an
800-MW plantViswanathan, Armor, and Booras, 2003

6National Energy Technology Laboratory
Creep Rupture Advantages of Ni-Base Superalloys
Shingledecker, Purgert, and Cedro, 2013

7National Energy Technology Laboratory
sCO2 Components/A-USC Conditions
Nomenclature Conditions
Subcritical 2400 psi/1050°F/1050°F (165 bar/566°C/566°C)
Supercritical (SC) 3600 psi/1050°F/1075°F 248 bar/566°C/579°C)
Ultra-Supercritical (USC) >3600 psi/1100°F/1150°F (>248 bar/593°C/621°C)
Advanced Ultra-Supercritical (A-USC)
4000-5000 psi/1300-1400°F (276-345 bar/704-760°C)
adapted from EPRI Report 1022770, 2011
Similarities in temperature and pressure suggests similar alloy candidates
8National Energy Technology Laboratory
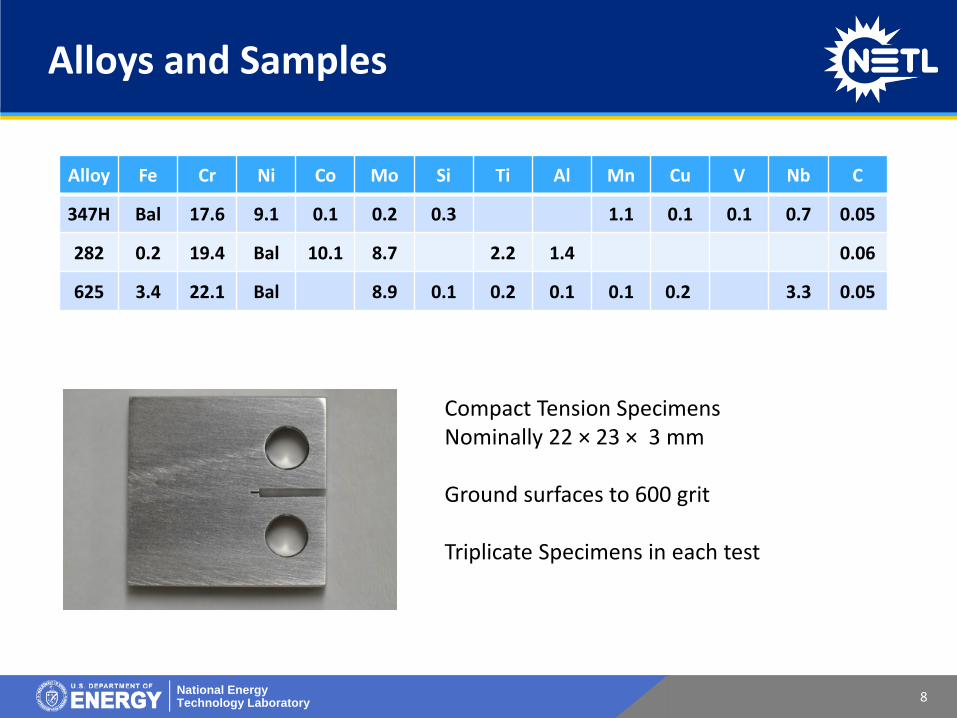
Alloys and Samples
Alloy Fe Cr Ni Co Mo Si Ti Al Mn Cu V Nb C
347H Bal 17.6 9.1 0.1 0.2 0.3 1.1 0.1 0.1 0.7 0.05
282 0.2 19.4 Bal 10.1 8.7 2.2 1.4 0.06
625 3.4 22.1 Bal 8.9 0.1 0.2 0.1 0.1 0.2 3.3 0.05
Compact Tension SpecimensNominally 22 × 23 × 3 mm
Ground surfaces to 600 grit
Triplicate Specimens in each test
9National Energy Technology Laboratory
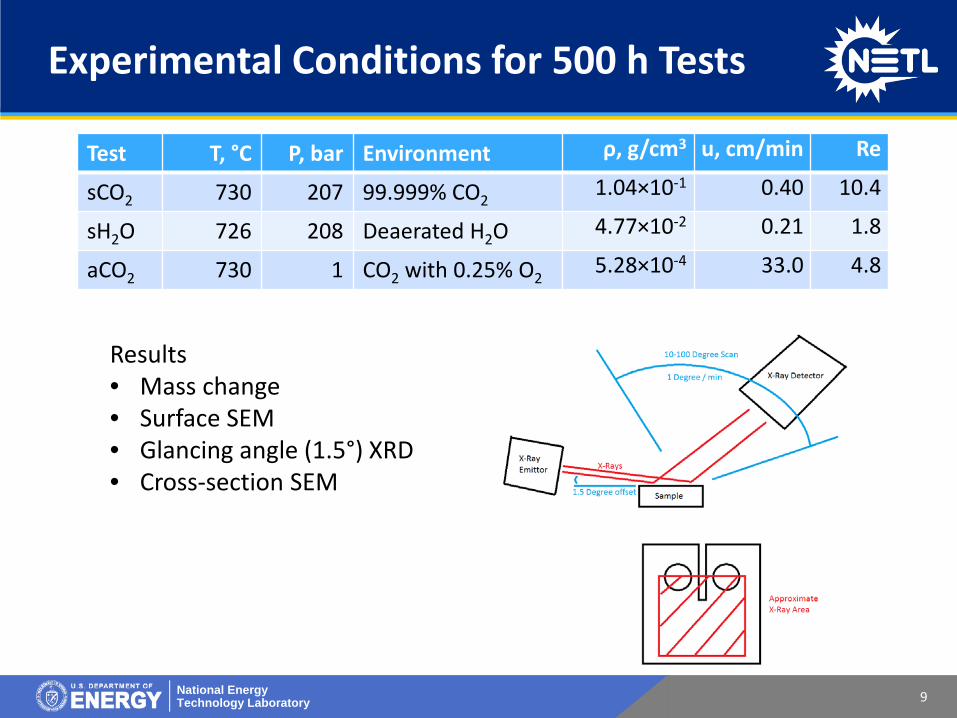
Experimental Conditions for 500 h Tests
Test T, °C P, bar Environment ρ, g/cm3 u, cm/min Re
sCO2 730 207 99.999% CO21.04×10-1 0.40 10.4
sH2O 726 208 Deaerated H2O 4.77×10⁻² 0.21 1.8
aCO2 730 1 CO2 with 0.25% O25.28×10-4 33.0 4.8
Results • Mass change• Surface SEM• Glancing angle (1.5°) XRD• Cross-section SEM

10National Energy Technology Laboratory
System for sCO2 Exposures
Exit line
Bottle weight scale
c Battery backup
SCO2 pump
Autoclave pressure gauge
Bottle pressure gauge
Actuators & Valves
Autoclave
Bottle valves
Solenoid valves

11National Energy Technology Laboratory
USC Autoclave for sH2O Exposures
High Pressure
Side
Autoclave1 Liter
6.35 cm ID31.75 cm L
Feed Water Prep/High Pressure Pump
Autoclave
Flow Rate Controlled by Pump
Pressure Controlled by Back Pressure Regulator

12National Energy Technology Laboratory
Mass Change Results
Test 282 625 347H
sCO2
0.36 0.16 0.10
0.33 0.15 0.08
0.33 0.21 0.08
sH2O
0.87 2.73 8.44
1.25 0.53 7.58
0.39 0.31 0.79*
CO2
0.40 0.09 -2.47
0.42 0.08 -3.33
0.37 0.07 -3.23
Mass Change, mg/cm2
*SEM revealed significant spalling, so not used in plots or kp calculations

13National Energy Technology Laboratory
Surface SEM – 347H
sCO2 +0.08 mg/cm2 sH2O +7.62 mg/cm2 CO2 -3.33 mg/cm2
20 µm 20 µm20 µm
61O-35Fe-1Cr-2Ni-1Mn, at%57O-21Fe-16Cr-2Ni*, at%
Metal
Mn-Rich & Low CrNb-Rich & Low Cr
Chromia with nodule formation of Low Cr oxidesScale spalling tendencies
*Glancing angle XRD confirms Cr2O3 and M3O4 as the primary surface phases
Fe Oxide with small amounts of Cr, Mn, Ni
Alloy Fe Cr Ni Co Mo Si Ti Al Mn Cu V Nb C
347H Bal 17.6 9.1 0.1 0.2 0.3 1.1 0.1 0.1 0.7 0.05
Secondary Electron Images
14National Energy Technology Laboratory
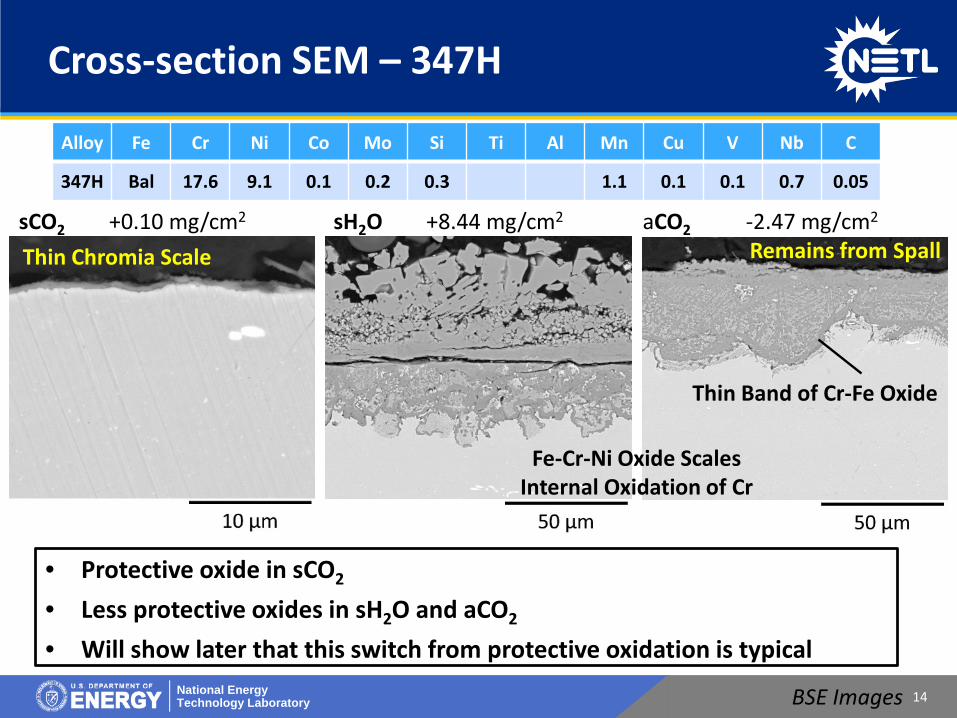
Cross-section SEM – 347H
BSE Images
Alloy Fe Cr Ni Co Mo Si Ti Al Mn Cu V Nb C
347H Bal 17.6 9.1 0.1 0.2 0.3 1.1 0.1 0.1 0.7 0.05
sCO2 +0.10 mg/cm2 sH2O +8.44 mg/cm2 aCO2 -2.47 mg/cm2
• Protective oxide in sCO2
• Less protective oxides in sH2O and aCO2
• Will show later that this switch from protective oxidation is typical
Thin Chromia Scale Remains from Spall
Fe-Cr-Ni Oxide ScalesInternal Oxidation of Cr
Thin Band of Cr-Fe Oxide

15National Energy Technology Laboratory
Surface SEM - 282
sCO2 +0.33 mg/cm2 sH2O +1.25 mg/cm2 aCO2 +0.42 mg/cm2
10 µm 10 µm10 µm
62O-31Cr-7Ti-1Ni*, at% 62O-30Cr-7Ti-1Ni*, at%
70O-26Cr-2Ti-3Ni, at%
Chromia scale with TiO2 on outer surface *Glancing angle XRD confirms Cr2O3 and TiO2 as the primary surface phases
65O-24Cr-6Ni-3Ti-1Co*, at%
Alloy Fe Cr Ni Co Mo Si Ti Al Mn Cu V Nb C
282 0.2 19.4 Bal 10.1 8.7 2.2 1.4 0.06
Secondary Electron Images
16National Energy Technology Laboratory
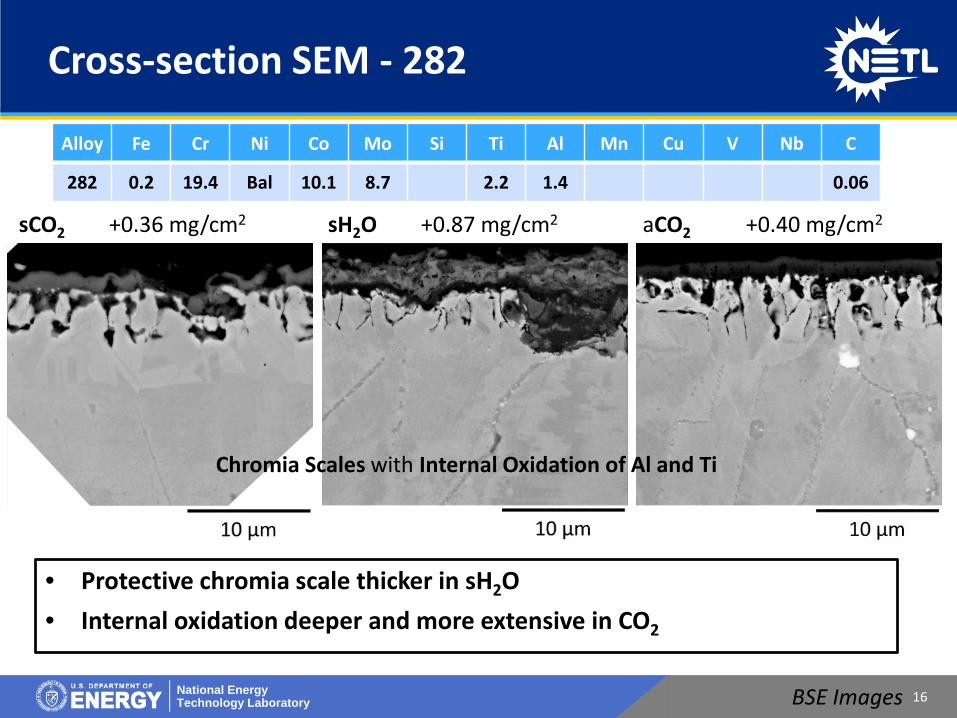
Cross-section SEM - 282
sCO2 +0.36 mg/cm2 sH2O +0.87 mg/cm2 aCO2 +0.40 mg/cm2
Alloy Fe Cr Ni Co Mo Si Ti Al Mn Cu V Nb C
282 0.2 19.4 Bal 10.1 8.7 2.2 1.4 0.06
BSE Images
Chromia Scales with Internal Oxidation of Al and Ti
• Protective chromia scale thicker in sH2O• Internal oxidation deeper and more extensive in CO2

17National Energy Technology Laboratory
EDS Mapping of 282 in sCO2
• Depletion of Cr, Al, Tibelow internal oxidation zone
• Loss of γ’ and strength

18National Energy Technology Laboratory
Surface SEM - 625
sCO2 +0.15 mg/cm2 sH2O +0.53 mg/cm2 aCO2 +0.08 mg/cm2
10 µm 10 µm10 µm
68O-17Cr-11Ni-2Mo-1Nb*, at%
71O-28Cr-1Ni-1Nb, at%
70O-20Cr-7Ni-1Mo-1Nb*, at%
Chromia scale with some underlying alloy Ni content showing in analysis *Glancing angle XRD confirms
Cr2O3 as the primary surface phase
63O-17Cr-15Ni-2Mo-1Fe*, at%
Alloy Fe Cr Ni Co Mo Si Ti Al Mn Cu V Nb C
625 3.4 22.1 Bal 8.9 0.1 0.2 0.1 0.1 0.2 3.3 0.05
Secondary Electron Images
19National Energy Technology Laboratory
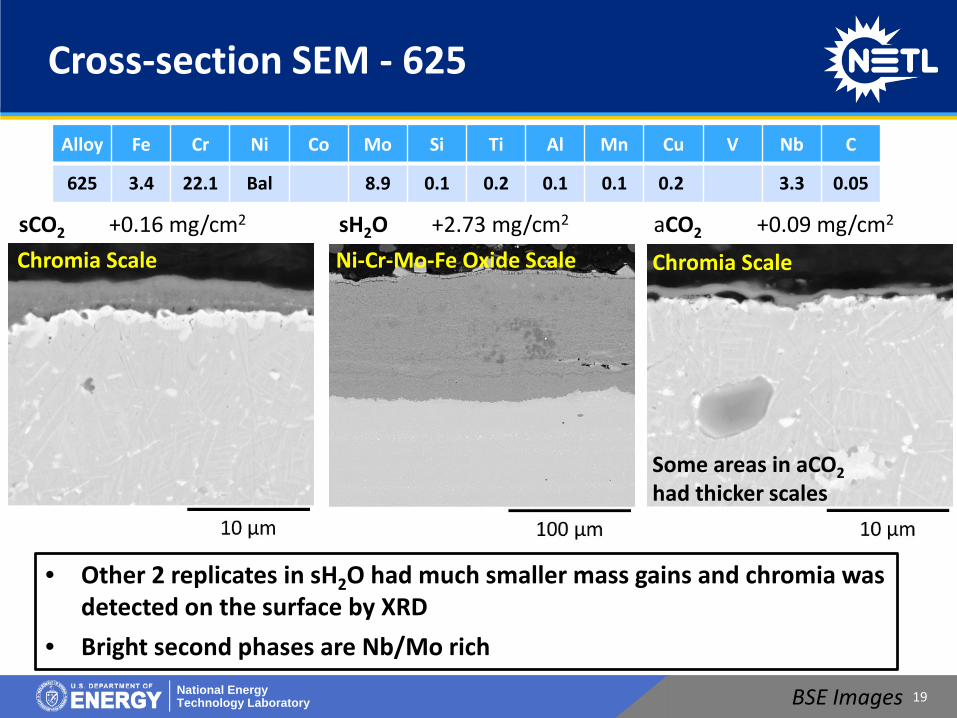
Cross-section SEM - 625
sCO2 +0.16 mg/cm2 sH2O +2.73 mg/cm2 aCO2 +0.09 mg/cm2
Alloy Fe Cr Ni Co Mo Si Ti Al Mn Cu V Nb C
625 3.4 22.1 Bal 8.9 0.1 0.2 0.1 0.1 0.2 3.3 0.05
BSE Images
Some areas in aCO2had thicker scales
Chromia Scale Chromia ScaleNi-Cr-Mo-Fe Oxide Scale
• Other 2 replicates in sH2O had much smaller mass gains and chromia was detected on the surface by XRD
• Bright second phases are Nb/Mo rich

20National Energy Technology Laboratory
Parabolic Behavior
• Parabolic rate constants were estimated using
– Where ΔM is the mass change and t is the time
• Time series tests are planned to verify such behavior• Not applied in cases where spalling was evident
𝑘𝑘𝑝𝑝 =∆𝑀𝑀2
2𝑡𝑡

21National Energy Technology Laboratory
300 Series (18Cr-8Ni)/E-Brite
Note: PMCr forms pure chromia scale
H2O adapted from the compilation of Wright & Dooley (2010), plus Holcomb (2014) and Holcomb (2016)sCO2 adapted from Furukawa (2011), Cao (2012), Pint (2014), Lim (2008), Olivares (2015), Dunlevy (2007), and Lee (2015)
H2O sCO2, 200-220 bar, 99.99+%
• Similar behavior in both sH2O and sCO2 (but note the gap in sCO2)• A variable increase in oxidation of fine-grain alloys with pressure• Variability arises from Fe-rich nodule formation and lateral growth to
disrupt protective chromia scale
22National Energy Technology Laboratory
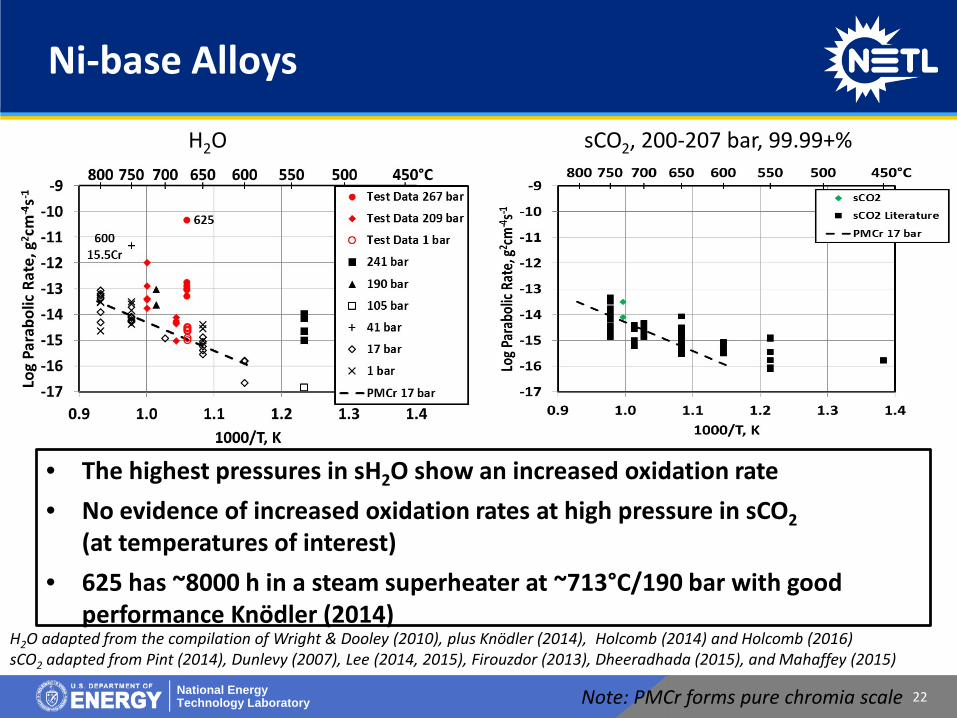
Ni-base Alloys
H2O sCO2, 200-207 bar, 99.99+%
H2O adapted from the compilation of Wright & Dooley (2010), plus Knödler (2014), Holcomb (2014) and Holcomb (2016)sCO2 adapted from Pint (2014), Dunlevy (2007), Lee (2014, 2015), Firouzdor (2013), Dheeradhada (2015), and Mahaffey (2015)
Note: PMCr forms pure chromia scale
• The highest pressures in sH2O show an increased oxidation rate • No evidence of increased oxidation rates at high pressure in sCO2
(at temperatures of interest)• 625 has ~8000 h in a steam superheater at ~713°C/190 bar with good
performance Knödler (2014)

23National Energy Technology Laboratory
Effect of Pressure in Steam for Ni Alloys
• Arrhenius behavior used to translate oxidation data to a 700°C basis• Oxide defect models tend to predict kp ∝ PT
X
• Better fit with log kp ∝ PT

24National Energy Technology Laboratory
Effect of Pressure in Steam for Austenitics
• Arrhenius behavior used to translate oxidation data to a 700°C basis• Oxide defect models tend to predict kp ∝ PT
X
• Fine Grain Alloys: Better fit with log kp ∝ log PT (kp ∝ PT1.13)
• Coarse Grain Alloys: No measurable dependence on pressure

25National Energy Technology Laboratory
Summary/Conclusions
• High Pressure sH2O and sCO2 Exposures– Over 200 bar and 726-730°C
• Preliminarily Results Indicate:– Nickel-base alloys
• Unlike in sH2O, there is no evidence of significant increased oxidation rates at high pressure in sCO2
– Fine-grain austenitic steels• Similar increase in oxidation with pressure in both sH2O and sCO2
• More Fe-rich oxide nodule formation with pressure• Variability in results associated with nodule formation/lateral growth
– Coarse-grain austenitic steels• No measurable increase in oxidation with pressure in sH2O • Not examined in sCO2